11ar english
TRANSCRIPT
I n s u r I n g I n v e s t m e n t s
E n s u r i n g o p p o r t u n i t i E s
annual report 2011
MIGa’s Mission
MIGa annual report 2011 | 1
“
”
to promote foreign direct
investment into developing
countries to support economic
growth, reduce poverty, and
improve people’s lives.
2 | MIGa annual report 2011
abbreviations ADC AfricanDevelopmentCorporationBRICS Brazil,theRussianFederation,India,China,SouthAfricaCAO ComplianceAdvisor/OmbudsmanCAR CapitalAdequacyRatioCUP CooperativeUnderwritingProgramDIFC DubaiInternationalFinancialCentreEIB EuropeanInvestmentBankFDI ForeignDirectInvestmentFEU Finance,EconomicsandUrbanDepartmentGDP GrossDomesticProductIBRD InternationalBankforReconstructionandDevelopmentIC InvestmentClimateAdvisoryServicesICSID InternationalCentreforSettlementofInvestmentDisputesICT InformationandCommunicationTechnologyIDA InternationalDevelopmentAssociationIEG IndependentEvaluationGroupIFC InternationalFinanceCorporationMD&A Management’sDiscussionandAnalysisMENA MiddleEastandNorthAfricaMMI MetropolitanMunicipalityofIstanbulMOU MemorandumofUnderstandingONDD TheBelgianExportCreditAgencyPCH ProCreditHoldingPRI PoliticalRiskInsuranceSIP SmallInvestmentProgramSADC SouthernAfricanDevelopmentCommunitySSA Sub-SaharanAfrica
MIGa annual report 2011 | 3
Contents1 MIGA’sMission
2 Abbreviations
4 MIGAFiscalYear2011Highlights
6 WorldBankGroupFiscalYear2011Highlights
8 MessagefromtheWorldBankGroupPresident 10 MessagefromMIGAExecutiveVicePresident
12 MIGAManagementTeam
14 MIGABoard 16 MIGADevelopmentImpact 24 MIGABusiness24 OperationalOverview36 Guarantees36 AsiaandthePacific 40 EuropeandCentralAsia 46 LatinAmericaandtheCaribbean49 MiddleEastandNorthAfrica51 Sub-SaharanAfrica
60 ResearchandKnowledge
64 TechnicalAssistance66 IndependentEvaluationGroup
68 ComplianceAdvisor/Ombudsman
70 Management’sDiscussionandAnalysis FinancialStatements
116 Appendices
131 MIGAContactInformation
4 | MIGa annual report 2011
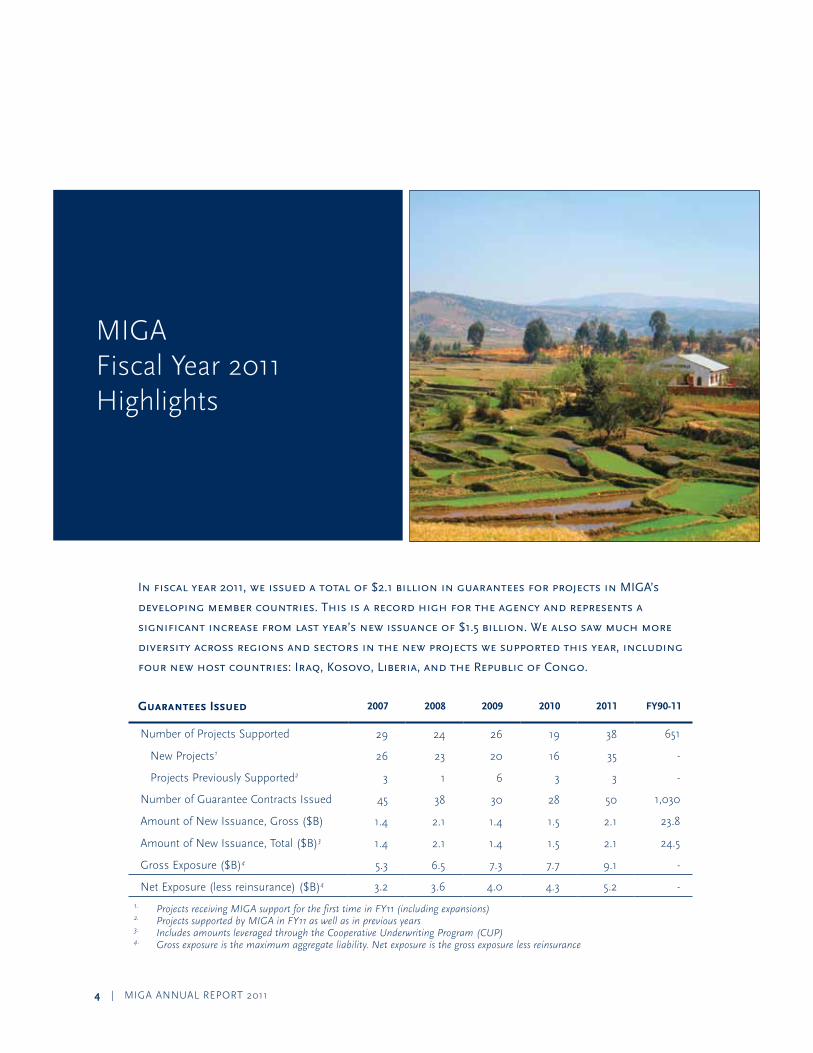
Infiscalyear2011,weissuedatotalof$2.1billioninguaranteesforprojectsinMIGA’s
developingmembercountries.Thisisarecordhighfortheagencyandrepresentsa
significantincreasefromlastyear’snewissuanceof$1.5billion.Wealsosawmuchmore
diversityacrossregionsandsectorsinthenewprojectswesupportedthisyear,including
fournewhostcountries:Iraq,Kosovo,Liberia,andtheRepublicofCongo.
Guarantees Issued 2007 2008 2009 2010 2011 FY90-11
number of projects Supported 29 24 26 19 38 651
new projects1 26 23 20 16 35 -
projects previously Supported2 3 1 6 3 3 -
number of Guarantee Contracts Issued 45 38 30 28 50 1,030
amount of new Issuance, Gross ($B) 1.4 2.1 1.4 1.5 2.1 23.8
amount of new Issuance, total ($B)3 1.4 2.1 1.4 1.5 2.1 24.5
Gross exposure ($B)4 5.3 6.5 7.3 7.7 9.1 -
net exposure (less reinsurance) ($B)4 3.2 3.6 4.0 4.3 5.2 -
1. Projects receiving MIGA support for the first time in FY11 (including expansions)2. Projects supported by MIGA in FY11 as well as in previous years3. Includes amounts leveraged through the Cooperative Underwriting Program (CUP)4. Gross exposure is the maximum aggregate liability. Net exposure is the gross exposure less reinsurance
MIGaFiscal Year 2011 Highlights
MIGa annual report 2011 | 5
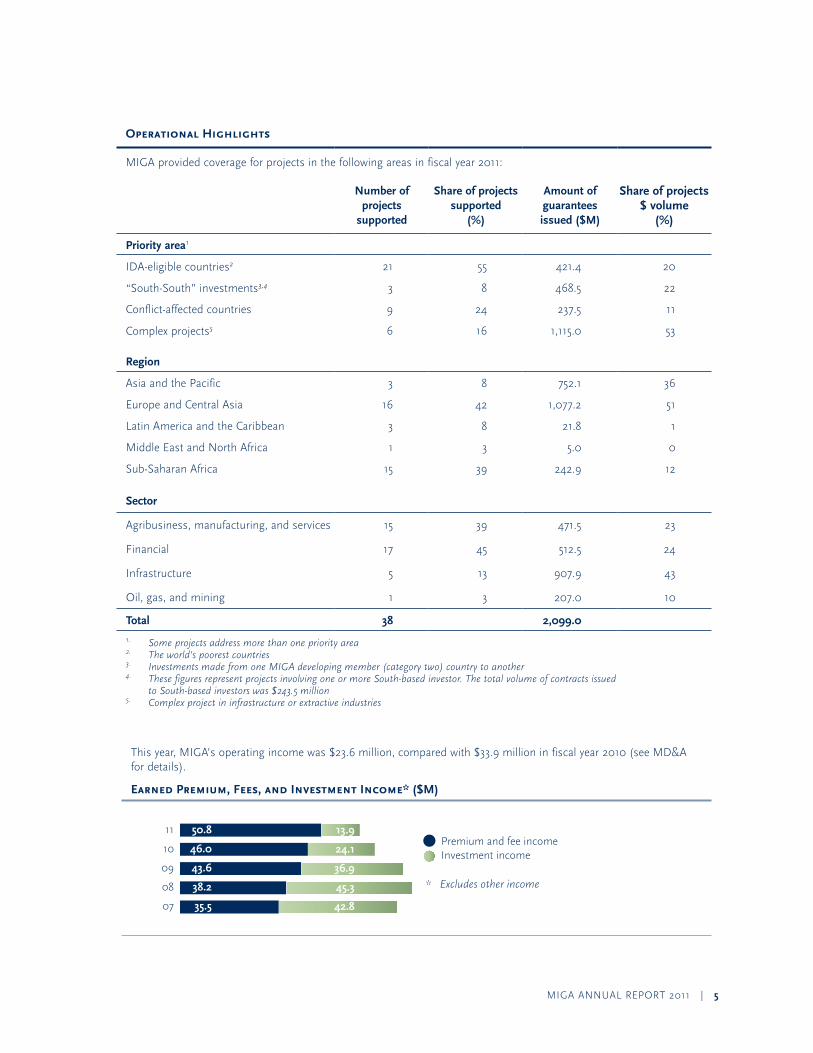
Operational Highlights
MIGa provided coverage for projects in the following areas in fiscal year 2011:
Number of projects
supported
Share of projects supported
(%)
Amount of guarantees issued ($M)
Share of projects $ volume
(%)
Priority area1
IDa-eligible countries2 21 55 421.4 20
“South-South” investments3,4 3 8 468.5 22
Conflict-affected countries 9 24 237.5 11
Complex projects5 6 16 1,115.0 53
Region
asia and the pacific 3 8 752.1 36
europe and Central asia 16 42 1,077.2 51
latin america and the Caribbean 3 8 21.8 1
Middle east and north africa 1 3 5.0 0
Sub-Saharan africa 15 39 242.9 12
Sector
agribusiness, manufacturing, and services 15 39 471.5 23
Financial 17 45 512.5 24
Infrastructure 5 13 907.9 43
oil, gas, and mining 1 3 207.0 10
Total 38 2,099.0
1. Some projects address more than one priority area2. The world’s poorest countries3. Investments made from one MIGA developing member (category two) country to another4. These figures represent projects involving one or more South-based investor. The total volume of contracts issued
to South-based investors was $243.5 million5. Complex project in infrastructure or extractive industries
this year, MIGa’s operating income was $23.6 million, compared with $33.9 million in fiscal year 2010 (see MD&a for details).
Earned Premium, Fees, and Investment Income* ($M) $M
Guarantees Portfolio, Gross Outstanding Exposure, $ M
Premium and fee incomeInvestment income
Consumption of MIGA’s Economic Capital by Sector in FY11
Figure 1: Earned Premium, Fees, and Investment Income* ($M)
Outstanding Portfolio Distribution by Host Region, Percent of Gross Exposure [as of February 28, 2009
60% Europe and Central Asia 14% Asia and the Pacific 12% Sub-Saharan Africa 11% Latin America and the Caribbean 5% Middle East and North Africa
Outstanding Portfolio Distribution, by Investor Country,Percent of Gross Exposure*
AustriaFrance
GermanyBelgium
LuxembourgNetherlands
SpainUnited Arab Emirates
SloveniaSingapore
Saudi ArabiaSwitzerland
South AfricaSweden
United KingdomMauritius
Cayman IslandsSenegal
JapanBermuda
CanadaEgypt, Arab Republic of
United StatesPoland
Others Others: Cyprus, Thailand, India, Turkey, Ecuador, Lebanon, Norway, Romania, Italy, Tunisia, Mali, St. Kitts and Nevis, Panama, Denmark, Virgin Islands (UK), Ireland, Colombia, Peru, Portugal
* Numbers may not add up to 100 percent due to investors for the same guarantee contract domiciled in different countries
35.19.28.06.56.24.63.43.02.72.72.52.32.21.61.61.41.41.01.01.01.00.90.60.6
1.8
11
10
09
08
07
46% Infrastructure 21% Financial 20% Oil, gas, and mining 13% Agribusiness, manufacturing, and services
* Excludes other income
50.8
46.0
43.6
38.2
35.5
13.9
24.1
36.9
45.3
42.8
01 02 03 04 05 06 07 08 09 10 11
Guarantees Issued in FY11, by Sector(by $ volume) [as of June 30, 2011]
43% Infrastructure 24% Financial 23% Agribusiness, manufacturing, and services 10% Oil, gas, and mining
0
2,000
4,000
6,000
8,000
10,000
Gross ExposureNet exposure
Figure 2: guarantees issued in FY11 by region
42% Europe and Central Asia 39% Sub-Saharan Africa 8% Asia and the Pacific 8% Latin America and the Caribbean 3% Middle East and North Africa
* Totals exceed 100 percent due to master contracts covering more than one region
6 | MIGa annual report 2011
TheWorldBankGroup,oneoftheworld’s
largestdevelopmentinstitutions,isamajor
sourceoffinancialandtechnicalassistance
todevelopingcountriesaroundtheworld.Its
memberinstitutionsworktogetherandcom-
plementeachother’sactivitiestoachievetheir
sharedgoalsofreducingpovertyandimproving
lives.TheBankGroupsharesknowledgeand
supportsprojectsinagriculture,trade,finance,
health,poverty,education,infrastructure,gov-
ernance,climatechange,andinotherareasto
benefitpeopleindevelopingcountries.
World Bank Group Fiscal Year 2011 Highlights
MIGa annual report 2011 | 7
INTE
RNATIO
NAL BANKFOR
WORLD BANK
RECONSTRUCTION AND DE
VE
LOPM
ENT
The World Bank Group comprises five closely associated institutions:
International Bank for Reconstruction and Development (IBRD), which lends to gov-ernments of middle-income and creditworthy low-income countries
International Development Association (IDA), which provides interest-free loans, or credits, and grants to governments of the poorest countries
International Finance Corporation (IFC), which provides loans, equity, and advisory services to stimulate private sector investment in developing countries
Multilateral Investment Guarantee Agency (MIGA), which provides political risk insurance or guarantees against losses caused by non-commercial risks to facilitate foreign direct investment (FDI) in developing countries
International Centre for Settlement of Investment Disputes (ICSID), which provides international facilities for conciliation and arbitration of investment disputes.
INTERNATIONAL
D EVELOPMENT
ASSOCIATION
INTERNATI ON
A LF I N A N C
E
CORPORATIONIN
TERNATI ON
A LF I N A N C
E
CORPORATION
•MULTIL
AT E
R A L I N V E
STMENT
•
GUA
RA N T E E A G E
NCY
SE
TT
LE
ME
N
T O F I N V E S T M E NT D
I SP
UT
ES
•IN
TERNATIONAL CENTRE
FOR
•
I C S I D
the World Bank Group committed $57.3 billion in fiscal year 2011.
the World Bank, comprising IDa and IBrD, com-mitted $43 billion in loans and grants to its member countries. of this, IDa commitments to the world’s poorest countries were $16.3 billion.
IFC committed $12.2 billion and mobilized an addi-tional $6.5 billion for private sector development in developing countries. $4.9 billion of the total went to IDa countries.
MIGa issued $2.1 billion in guarantees in support of investments in developing countries.
World Bank Group Cooperation
Joint projects and programs of the Bank Group’s insti-tutions focus on promoting sustainable development by expanding financial markets, issuing guarantees to investors and commercial lenders, and providing advisory services to create better investment conditions in developing countries. Working together, the World Bank, IFC, and MIGa catalyze projects and programs that make resources available to clients through greater innovation and responsiveness. a number of these are highlighted in this report.
8 | MIGa annual report 2011
Thispastyear,theWorldBankGrouphasbeen
helpingdevelopingcountriesmeetchallenges,
managerisks,andseizeopportunities:historic
changesintheMiddleEastandNorthAfrica;
highandvolatilefoodandfuelprices;the
ravagescausedbynaturaldisasters;rising
inflationinemergingmarketswithsomerisks
ofoverheating;therecoveriesoffragilestates,
oftencomingoutofconflict;andthebenefits
ofgreatertransparencyandopenness.
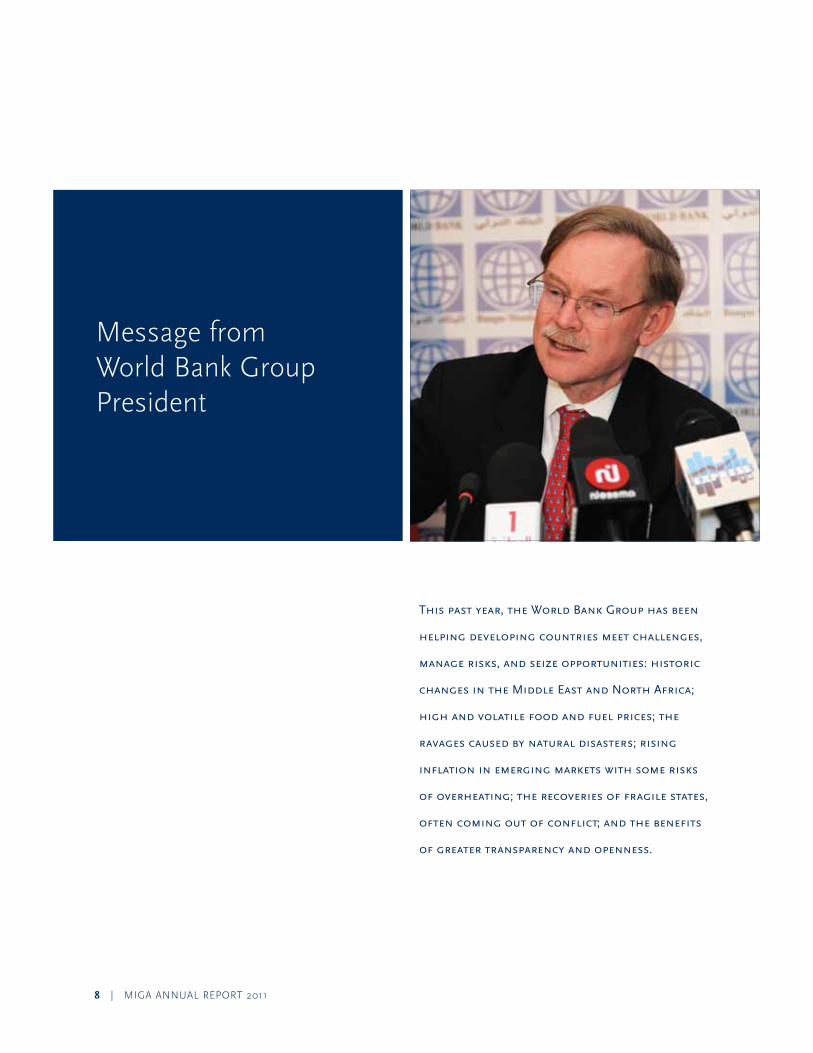
Message from World Bank Group president
MIGa annual report 2011 | 9
a robust and engaged private sector is a key factor in helping economies adjust to these and other chal-lenges. MIGa’s annual report 2011 demonstrates the important role the agency plays in supporting sustainable growth and development through providing investment guarantees in countries where risk-mitigation tools are essential to securing private sector investment.
the report highlights MIGa’s innovation, flexibility, and ability to deliver on its own modernization agenda. this year, the agency secured significant amendments to its Convention that enhance its value as a multilateral provider of political risk insurance. these amendments, approved by the Council of Governors in august, have already enabled MIGa to support projects that would not previously have been possible.
In fiscal year 2011, MIGa provided $2.1 billion in new guarantee coverage—a record high for the agency, and a 43 percent increase over the previous year, which indicates renewed interest in political risk-mitigation products. MIGa has shown renewed diversification and regional outreach—from its support for a manufacturing plant in Iraq, to an agribusiness venture in liberia, to a mining feasibility study in Indonesia, and to banking endeavors supporting small and medium enterprises in 14 countries. MIGa’s concerted efforts to encourage foreign direct investment (FDI) into the Middle east and north africa region have been especially important this year.
MIGa is also doing important work in countries affected by conflict and fragility. the agency supports investments in several of these countries, and uses its knowledge, research, and convening power to focus attention on
these much-underserved markets. the World Bank’s recent World Development Report on Conflict, Security, and Development underscores the critical impact of FDI in these countries—to support service delivery and job creation, so important for early results as well as longer-term growth—and of MIGa’s efforts. MIGa is in the process of establishing a specific political risk facility that can be deployed in countries affected by violence or fragility.
to further expand its outreach, MIGa established its asia hub this year, signaling a strong emphasis on inbound and outbound asian investment. We are seeing an increasing appetite from investors in asian countries to venture into challenging markets, and MIGa’s strengthened presence in the region will help facilitate their plans.
MIGa has also strengthened external and internal part-nerships over the past year to further leverage its devel-opment impact. the agency signed memoranda of under-standing with a lebanese financial company to cooperate on promoting cross-border investment into developing countries and with the Indonesian Infrastructure Guarantee Fund to cooperate on building capacity and to co-insure a pipeline of infrastructure projects. Closer to home, MIGa’s strengthened business and marketing relationship with IFC has already demonstrated results. In addition, this year the agency signed internal agreements with the World Bank’s Finance, economics and urban Department and the Banking and Debt Management Department to cross-market products aimed at leveraging the strengths of MIGa and the World Bank.
I want to thank MIGa’s staff for their commitment, con-tributions, and focus. MIGa’s considerable achievements this year reflect the strong leadership and innovative spirit of Izumi Kobayashi and her management team. I also thank our Council of Governors, Board of Directors, and other partners for their guidance and support.
Robert B. Zoellick June 30, 2011
10 | MIGa annual report 2011
Todaytheworldisstillcautiouslyemerging
fromasevererecession.Onapositivenote,
thedevelopingworldisdrivingtheworld’s
economicrecovery—andthereweareseeing
growthratesthatareimpressive.However,
highunemploymentanddebtstillconcern
manyindustrializedcountries,whilerising
andvolatilefoodpricesagainposesignificant
problemsformillionsinthedevelopingworld.
Atthesametime,weareexperiencingbothuncer-
taintyandanticipationpromptedbythetrans-
formativeeventsintheMiddleEastandNorth
Africa.Theglobalscenarioisindeedmixed.
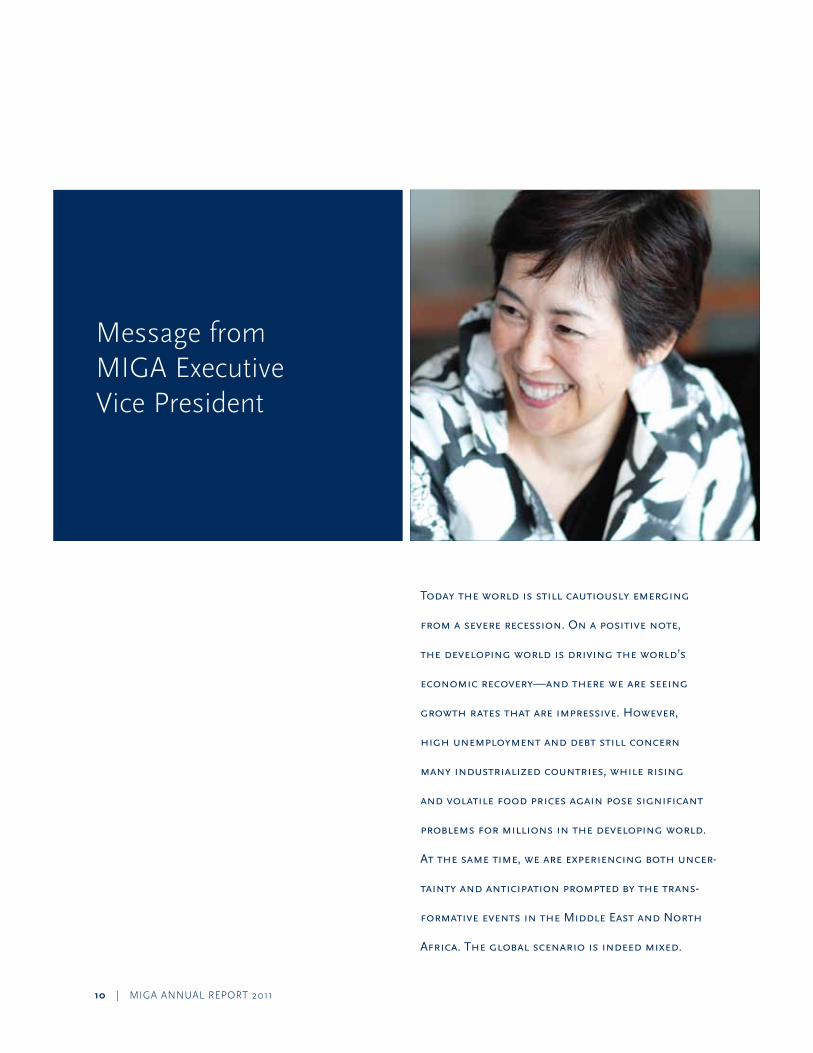
Message from MIGa executive Vice president
MIGa annual report 2011 | 11
Following a sharp contraction during the financial crisis, foreign direct investment is beginning to pick up—although it could take three years to return to pre-crisis levels. project sponsors and lenders are still nervous; investors rate political risk as being the most significant medium-term impediment to making new investments in developing countries.
Here we have a role to play. I am pleased to note that MIGa issued $2.1 billion in new guarantee coverage in 2011, a record high for the agency and a significant increase from last year. as we note later in this report, nearly all of the coverage was issued to new clients. this indicates that our enhanced business development efforts, including our strengthened partnerships within the World Bank Group, are beginning to show results. Importantly, the portfolio was also significantly more diversified across sectors and regions. portfolio runoff continued to be low, as in the past few years, and the agency’s total gross exposure of $9.1 billion represented yet another historic high for MIGa.
In this report we also note important amendments to MIGa’s Convention, approved by the Council of Governors, which took effect in november 2010. these historic amendments greatly enhance our ability to support clients. We are now able to cover stand-alone debt and some existing investments, putting us in a better position to support investors in times of uncertainty. Clients have responded very positively to our expanded authority, which has also contributed to this year’s increased business volume. I am particularly grateful for the strong support we received from our shareholders to move forward with these amendments.
I had the opportunity to travel to the Middle east in February, a most interesting time to be in the region as events unfolded. In lebanon, Jordan, and Saudi arabia, conversations with government officials and the private sector focused on ways to encourage continued investment into the region and to support local investors seeking opportunities in other developing countries. We are enhancing our partnerships and representation in the region and stand ready to assist project sponsors and lenders to bring developmentally beneficial investment into these countries.
one of MIGa’s top strategic priorities continues to be investment into conflict-affected and fragile economies. to help facilitate this kind of investment, MIGa has again drawn on its role as a member of the World Bank Group to be a knowledge resource—and has devoted research to this particular topic. our report, World Investment and
Political Risk 2010, which we discuss later in this review, focused on investment in conflict-affected and fragile economies. In addition, to complement our existing investment guarantee product, this year we proposed the establishment of a Conflict-affected and Fragile economies Facility to further promote investment and trade into these underserved markets.
this past year saw other advances at MIGa. We launched our asia regional hub last august, placing representatives in Hong Kong Sar, China and Singapore, and augmenting our on-the-ground presence in Beijing and tokyo. this move was important to allow us to get closer to our regional clients and assist asia’s emergence as a new center for outbound investment flows. We also expanded and strengthened our internal Bank Group and external partnerships, as we note later in this report.
Within MIGa, we welcomed several new staff, including those in the positions of general counsel, chief financial officer, and chief economist. We also inaugurated the MIGa professionals program, hiring two young profes-sionals to join us for a period of two years. We believe the program has been successful in bringing in new and diverse talent from underrepresented countries, and we hope to bring three young professionals on board next fiscal year.
on a personal note, I happened to be in tokyo when the earthquake and ensuing tsunami hit further to the north and left immediate and lasting devastation. It was beyond anything I had experienced growing up in Japan—and I knew immediately it would have serious repercussions for my country. But it also reminded me all the more about the people whom development institutions like the World Bank Group assist around the world, underserved people and communities hit by similar or other disasters, and without adequate support mechanisms. these are the people we at MIGa hope to reach and support by encouraging private sector investors to bring sustainable projects to countries that need it the most.
In conclusion, I would like to thank MIGa’s committed and professional staff for their hard work in these continued challenging times. I know I can count on their support, as well as that of our shareholders and partners, as we continue to uphold our mission of facilitating investment that improves people’s lives.
Izumi Kobayashi June 30, 2011

12 | MIGa annual report 2011
(From left to right, top to bottom)
IzumiKobayashi
executive Vice president
JamesP.Bond
Chief operating officer
Ana-MitaBetancourt
Director and General Counsel, legal affairs and Claims
KevinW.Lu
regional Director, asia-pacific
EdithP.Quintrell
Director, operations
LakshmiShyam-Sunder
Director and Chief Financial officer, Finance and risk Management
RaviVish
Chief economist and Director, economics and policy
MarcusS.D.Williams
adviser, Strategy and operations
MIGaManagement
team
MIGa annual report 2011 | 13
14 | MIGa annual report 2011
ACouncilofGovernorsandaBoardof
Directors,representing175membercountries,
guidetheprogramsandactivitiesofMIGA.
Eachcountryappointsonegovernorandone
alternate.MIGA’scorporatepowersarevestedin
theCouncilofGovernors,whichdelegatesmost
ofitspowerstoaboardof25directors.Voting
powerisweightedaccordingtotheshareof
capitaleachdirectorrepresents.
MIGa Board
MIGa annual report 2011 | 15
MIGA’s Board of Executive Directors, as of June 30, 2011
Standing, from left to right: Gino pierre alzetta, Susanna Moorehead, piero Cipollone, Felix a. Camarasa, abdulrahman almofadhi, Merza Hasan, Shaolin Yang, pulok Chatterji, Jorg Frieden, Ian H. Solomon, Jim Hagan, Dyg Sadiah Binti abg Bohan, nobumitsu Hayashi, rudolf treffers, Ingrid Hoven, rogerio Studart, ambroise Fayolle
Seated, from left to right: eugene Miagkov, anna Brandt, Hassan a. taha, agapito Mendes Dias, Marie-lucie Morin, Javed talat, Marta Garcia, renosi Mokate
the directors meet regularly at the World Bank Group headquarters in Washington, DC, where they review and decide on investment projects and oversee general man-agement policies.
Directors also serve on one or more of several standing committees:
r audit Committee
r Budget Committee
r Committee on Development effectiveness
r Committee on Governance and administrative Matters
r ethics Committee
r personnel Committee
these committees help the board discharge its oversight responsibilities through in-depth examinations of policies and procedures.
During fiscal year 2011, MIGa’s Board of Directors reviewed and concurred with investment guarantees issued by MIGa. the board also approved MIGA’s FY12-14 Strategy: Achieving Value-Driven Volume, MIGa’s budget for fiscal year 2012, and increased exposure limits for MIGa’s coverage at the project and country level. these increased exposure limits will be effective in fiscal year 2012. In addition, MIGa submitted quarterly financial reports and collaborated in drafting World Bank Group country assistance and partnership strategies that were considered by the board.
During fiscal year 2010, the board discussed and con-curred with recommended amendments to MIGa’s Convention. these amendments were subsequently approved by the Council of Governors last august and became effective this fiscal year.
16 | MIGa annual report 2011
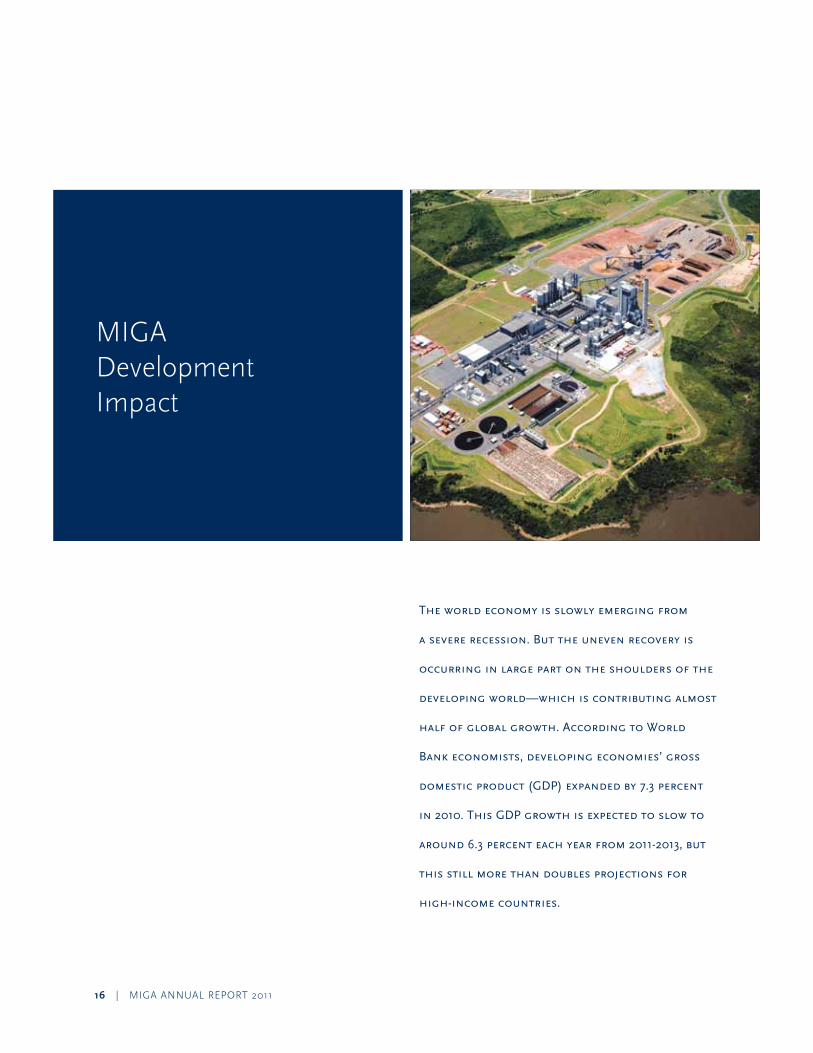
Theworldeconomyisslowlyemergingfrom
asevererecession.Buttheunevenrecoveryis
occurringinlargepartontheshouldersofthe
developingworld—whichiscontributingalmost
halfofglobalgrowth.AccordingtoWorld
Bankeconomists,developingeconomies’gross
domesticproduct(GDP)expandedby7.3percent
in2010.ThisGDPgrowthisexpectedtoslowto
around6.3percenteachyearfrom2011-2013,but
thisstillmorethandoublesprojectionsfor
high-incomecountries.
MIGa Development Impact
MIGa annual report 2011 | 17
this is a significant change to previous patterns of economic growth and even more remarkable because it mainly reflects an expansion of internal developing-country markets. this is good news for the global economic system—and particularly good news for development.
While, in general, the global recovery has broadened to encompass more firms, more countries, and more com-ponents of aggregate demand, there are several reasons to restrain unbridled optimism. the recovery in many economies in emerging europe and Central asia and in some high-income countries is tentative. persistent financial sector problems and debt crises in some high-income countries still threaten growth. unstable money flows chasing higher returns as well as the potential for overheating in developing economies could undermine development gains. and the sharp rise and volatility in food prices loom large for economies and livelihoods around the globe, affecting the people most in need of sustained growth and stability.
In addition, we note other unforeseeable factors that influence growth, and this year has had its share. popular
uprisings in the Middle east and north africa (Mena) have captured the world’s attention. the social and devel-opmental repercussions of these political sea-changes are still being analyzed, and their potential effect on oil prices has implications for the global economy. also, the effects of Japan’s tragic earthquake and resulting tsunami have contributed to a modest slowing in global industrial pro-duction and trade.
What Does This Mean for FDI?
as the global economic outlook still remains mixed, prospects for foreign direct investment (FDI) appear brighter for developing countries. according to World Bank economists, inflows should continue growing by 20 percent and 13 percent a year in 2011 and 2012, respec-tively. In particular, FDI flows originating from developing countries have rebounded rapidly and are expected to continue this brisk pace. While the uptick in developing-country outbound FDI is led by Brazil, India, China, the russian Federation, and South africa (BrICS), others are gradually moving up the ranks as their multinational enterprises globalize operations.
18 | MIGa annual report 2011
the evolving role of FDI varies among regions. For example, sub-Saharan africa is attracting new sources of FDI. Investment into asia is spread more evenly across multiple industries and countries, though outbound investment will undoubtedly be affected by the earthquake in Japan. In latin america, entrepreneurs are going global. Foreign banks have played a stabilizing role in europe and Central asia, but their large-scale presence also raises potential concerns. While the civil unrest in the Mena region worries many investors, some suggest that political changes sweeping the region may open up investment opportunities.
In June of 2010, MIGa surveyed 194 executives from multinational companies worldwide to inform our World Investment and Political Risk report. the survey found investors to be optimistic about their prospects, par-ticularly in the medium term. those from the extractive industries were particularly bullish in their investment intentions, as were South-South investors—confirming the trend we see in FDI data.
What Does This Mean for MIGA?
Confirming the market’s renewed optimism during this fiscal year, our volume of new business reached a record high and we saw a return to a more balanced portfolio across regions and sectors. revolutions in Mena con-tributed to a resurging awareness of political risk in general, which led to increased business inquiries as MIGa entered the last quarter of our fiscal year (see MIGa Business for detailed portfolio results).
the historic amendments to MIGa’s Convention approved by our Council of Governors in 2010 helped the agency catch the dual waves of FDI resurgence and investors’ heightened sensitivity to political risk. By broadening our pool of eligible investments to include some types of existing projects and stand-alone debt, MIGa is better able to deliver on our mission of encouraging developmentally beneficial FDI.
We continue to leverage our foremost strength in the marketplace—attracting investors and private insurers into difficult operating environments. MIGa’s opera-tional strategy—which focuses on IDa-eligible countries, conflict-affected environments, complex projects in infrastructure and extractive industries, and encouraging investment between developing countries (South-South investments)—guides our work. For example, last year, under our Small Investment program, we supported a project in ethiopia that involves the privatization, rehabili-tation, and expansion of an existing farm to cultivate and process passion fruit, mango, and papaya for juice exports. this project is already delivering solid results and is con-tributing to an economic revival in a region that has seen very high levels of poverty (see box 1).
this year, MIGa supported a number of projects in our priority areas, including our first contracts supporting investments into Iraq, Kosovo, liberia, and the republic of Congo. of all contracts signed this year, 72 percent fell into one or more of the priority areas noted above.
MIGa focused intensely on conflict-affected and fragile economies this year, choosing to address conflict’s impact on FDI in the World Investment and Political Risk 2010 report. our findings on constraints to growth were con-sistent with the World Bank’s World Development Report 2011 on Conflict, Security, and Development. apart from our guarantees to projects in fragile countries, we are also looking at innovative ways to address the gap between the exit of post-conflict official development assistance and the emergence of a resilient private sector. this year, MIGa has actively engaged member countries to enlist their support for a Conflict-affected and Fragile economies Facility that will combine a variety of products to mitigate risk and address market demand.
Reaffirming our Priorities
MIGa’s priorities of mobilizing investments into the world’s poorest and conflict-affected countries, facilitating complex projects, and supporting South-South investment contribute to the goal of inclusive and sustainable glo-balization and are areas where we can make the most difference as a development agency. While these priority areas are not intended to be exclusive, they serve as an important operational compass for MIGa. these priorities have guided our work over the last several years and we recommitted our focus to them in MIGA’s FY12-14 Strategy: Achieving Value-Driven Volume. our priorities also dovetail with the World Bank Group’s strategy laid out in New World, New World Bank Group: (I) Post-Crisis Directions: to overcome poverty by targeting the poor and vulnerable, creating opportunities for growth, providing cooperative models, strengthening governance, managing risk, and preparing for crises. In addition to these overarching goals, MIGa has taken important steps—as has the World Bank Group—to enhance our focus on client service and flexibility, particularly through the amendments to our Convention, implementing adjustments to our operational regulations, and streamlining underwriting processes. We talk more about this later in this report.
Bolstering Investments in the Middle East and North Africa
MIGa has made a concerted effort to preserve and encourage FDI into the Mena region during these challenging times. Here, MIGa’s work is critical, as an increase in FDI would not only boost growth in the region but also help create much-needed jobs—an essential element of security and stability.
MIGa annual report 2011 | 19
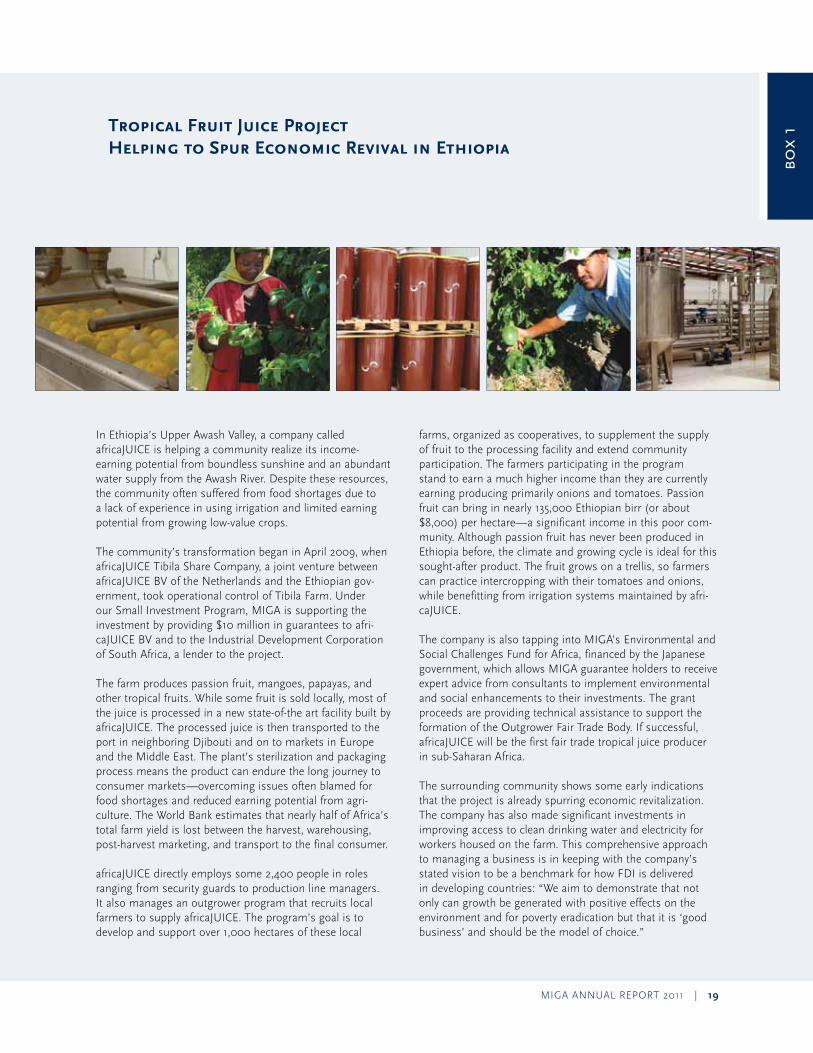
Tropical Fruit Juice Project Helping to Spur Economic Revival in Ethiopia
box
1
In ethiopia’s upper awash Valley, a company called africaJuICe is helping a community realize its income-earning potential from boundless sunshine and an abundant water supply from the awash river. Despite these resources, the community often suffered from food shortages due to a lack of experience in using irrigation and limited earning potential from growing low-value crops.
the community’s transformation began in april 2009, when africaJuICe tibila Share Company, a joint venture between africaJuICe BV of the netherlands and the ethiopian gov-ernment, took operational control of tibila Farm. under our Small Investment program, MIGa is supporting the investment by providing $10 million in guarantees to afri-caJuICe BV and to the Industrial Development Corporation of South africa, a lender to the project.
the farm produces passion fruit, mangoes, papayas, and other tropical fruits. While some fruit is sold locally, most of the juice is processed in a new state-of-the art facility built by africaJuICe. the processed juice is then transported to the port in neighboring Djibouti and on to markets in europe and the Middle east. the plant’s sterilization and packaging process means the product can endure the long journey to consumer markets—overcoming issues often blamed for food shortages and reduced earning potential from agri-culture. the World Bank estimates that nearly half of africa’s total farm yield is lost between the harvest, warehousing, post-harvest marketing, and transport to the final consumer.
africaJuICe directly employs some 2,400 people in roles ranging from security guards to production line managers. It also manages an outgrower program that recruits local farmers to supply africaJuICe. the program’s goal is to develop and support over 1,000 hectares of these local
farms, organized as cooperatives, to supplement the supply of fruit to the processing facility and extend community participation. the farmers participating in the program stand to earn a much higher income than they are currently earning producing primarily onions and tomatoes. passion fruit can bring in nearly 135,000 ethiopian birr (or about $8,000) per hectare—a significant income in this poor com-munity. although passion fruit has never been produced in ethiopia before, the climate and growing cycle is ideal for this sought-after product. the fruit grows on a trellis, so farmers can practice intercropping with their tomatoes and onions, while benefitting from irrigation systems maintained by afri-caJuICe.
the company is also tapping into MIGa’s environmental and Social Challenges Fund for africa, financed by the Japanese government, which allows MIGa guarantee holders to receive expert advice from consultants to implement environmental and social enhancements to their investments. the grant proceeds are providing technical assistance to support the formation of the outgrower Fair trade Body. If successful, africaJuICe will be the first fair trade tropical juice producer in sub-Saharan africa.
the surrounding community shows some early indications that the project is already spurring economic revitalization. the company has also made significant investments in improving access to clean drinking water and electricity for workers housed on the farm. this comprehensive approach to managing a business is in keeping with the company’s stated vision to be a benchmark for how FDI is delivered in developing countries: “We aim to demonstrate that not only can growth be generated with positive effects on the environment and for poverty eradication but that it is ‘good business’ and should be the model of choice.”
20 | MIGa annual report 2011
executive Vice president Izumi Kobayashi visited the region as the revolutions in tunisia and egypt were unfolding and her experience helped lay the groundwork for MIGa’s initiative to help encourage and support investment into the region.
MIGa’s Mena initiative has two components. the first is knowledge sharing: in May 2011, we hosted a roundtable in paris that convened investors, policymakers, and investment promotion authorities to discuss concerns and opportunities resulting from current events. Similar roundtable discussions will be held in the Mena region and in Washington.
the second element of the initiative is increased direct support to investors. MIGa is mobilizing $1 billion in insurance capacity to retain and encourage FDI in Mena. We are reaching out to investors and lenders interested in the region, noting that we are open for business and high-lighting our ability to guarantee projects under Islamic financing structures, our partnership with the Dubai International Financial Centre (DIFC), and our West Bank and Gaza Investment Guarantee trust Fund. our repre-sentative in the West Bank and Gaza, placed early this fiscal year, is focusing on business development for the trust fund as well as more broadly in the region.
MIGa is also consulting with the World Bank, IFC, and other regional partners with the aim of leveraging our collective resources to support FDI into Mena. these consultations include direct discussions with government agencies and state-owned enterprises in the region to understand their needs with respect to priority projects.
Sustaining Attention to Environmental and Social Impact
Sound environmental performance, sustainability with respect to natural resource management, and social responsibility are critical to an investment’s success and its contribution to the host country’s development. MIGa adheres to performance standards that help clients take a responsible approach to their projects’ environmental and social aspects. Well-designed environmental and social programs can help manage reputational risks for project sponsors, protect the environment, and reduce political risks. Most importantly, attention to these issues ensures that the people and ecosystems that are most affected by a project will be taken into account during design and implementation.
MIGa administers the environmental and Social Challenges Fund for africa to provide technical advice to cross-border investors in the region. Financed by the Japanese government, the fund is open on a case-by-case basis to investors already receiving MIGa guarantees or being considered for support. through the fund,
investors can receive expert advice from MIGa and other consultants with an aim to ensure that projects comply with MIGa’s environmental and social policies and investors receive best-practice advice on issues such as resettlement and local community benefits. as noted above, this fund is being used to support the africaJuICe project in ethiopia.
an example of our close collaboration with clients on envi-ronmental and social issues is MIGa’s guarantee to an exploration and feasibility study for the Weda Bay nickel mining project in Indonesia. the Weda Bay deposit is one of the world’s largest undeveloped identified resources of nickel, with 5.1 million tons of nickel contained in measured, indicated, and inferred resources. project sponsor Strand Minerals (Indonesia) pte. ltd. asked MIGa to provide a guarantee of $207 million to support the detailed exploration and feasibility study stage of this complex project. our involvement in the early phase helps the sponsors to identify the social and environmental impacts in detail, design mitigation measures, and test their effectiveness—using MIGa’s performance standards, environmental guidelines, and good industry practices.
Enhancing Understanding of Development Impact
this year, MIGa expanded the program for self-evalu-ations we began in fiscal year 2010, stepping up our ability to gather developmental lessons from completed projects and apply them to current and future work. this organizational learning tool will allow the agency to more fully absorb lessons, while increasing accountability to shareholders and other stakeholders.
“Well-designed environmental
and social programs can help
manage reputational risks
for project sponsors, protect the
environment, and reduce
political risks.”

MIGa annual report 2011 | 21
Since the program’s inception, MIGa has completed eight evaluations for guaranteed investments, including in afghanistan and uruguay (see box 2). the projects are rated on criteria that measure development outcomes on the one hand, and MIGa’s effectiveness on the other.
the evaluations, carried out by MIGa’s economists, envi-ronmental and social specialists, and underwriters—and independently validated by the Independent evaluation Group (IeG)—are aimed at increasing awareness and learning among operational staff. Going forward, MIGa intends to gradually expand the program to carry out more evaluations each year.
In addition, this fiscal year we introduced a series of development metrics that track direct employment, training budgets, the value of locally produced goods, taxes and fees paid, community investment amounts, and investment leveraged for all new MIGa-insured projects. ongoing attention to this effort will eventually allow the agency to report on development indicators across the entire portfolio.
Leveraging Development Impact through Partnerships
this year, we continued to fortify existing relationships and also sought out new partners to promote and support developmentally beneficial FDI. Joint business development efforts and cross-marketing support between MIGa and IFC were particularly fruitful, resulting in the introduction of new clients to MIGa. these include the proCredit group, a provider of finance to some 750,000 very small, small, and medium enterprises in latin america, eastern and Central europe, and africa.
this fiscal year MIGa and the World Bank’s Finance, economics and urban (Feu) department signed an agreement to more effectively cross-market their political risk insurance and other guarantee products. MIGa and Feu are also working on structures that would allow clients to benefit from both MIGa’s political risk insurance and World Bank guarantee products in a single transaction—significantly reducing processing time for critical investments. We also signed a similar business development cooperation agreement with the Banking and Debt Management Department in the World Bank’s treasury vice presidency. In addition, this year marked enhanced collaboration between MIGa and the World Bank’s Investment Climate advisory Services (IC) with the placement of a senior MIGa staff member in IC’s Vienna office who focuses on business development in eastern europe and Central asia.
outside of the World Bank Group, we signed a Memorandum of understanding (Mou) with Kafalat S.a.l., a lebanese financial company that provides guar-antees for small and medium enterprises to access bank loans. through this agreement, MIGa and Kafalat will cooperate to promote lebanese enterprises’ cross-border investments into developing countries. the partners also committed to raising general awareness about risk-mitigation instruments such as political risk insurance through joint conferences and training—with the first training program conducted in Beirut in March by a MIGa team.
additionally, MIGa signed an Mou with the Indonesian Infrastructure Guarantee Fund to collaborate on capacity building and to coinsure a pipeline of infrastructure projects.
these new agreements are additions to our recent strategic partnerships with organizations such as the Japan Bank for International Cooperation, the Central american Bank for economic Integration, Korea’s eximbank, nippon export and Investment Insurance, and DIFC. Such partnerships leverage these regional players’ in-depth knowledge of markets and MIGa’s experience in political risk insurance to encourage sound investment in developing countries worldwide.
also noteworthy is the partnership that was formed in the wake of the global financial crisis among the european Bank for reconstruction and Development, the european Investment Bank, and the World Bank Group. In March 2011, the institutions observed the conclusion of the suc-cessful cooperation and pledged to collaborate again in the future, as needed. From october 2008 to March 2011, MIGa issued $2 billion in guarantees to the financial sector in Central and eastern europe as part of the group’s Joint International Financial Institution action plan.
22 | MIGa annual report 2011
box
2
Learning Lessons, Demonstrating Impact
MIGa has significantly expanded its attention to lessons
learned and its ability to demonstrate the developmental
impact of its guarantees through self evaluation. Here we
highlight two projects in very different environments that
were among the first to be formally evaluated with rigorous
criteria developed jointly by MIGa and IeG: Mtn
in afghanistan and Botnia South america (now upM)
in uruguay.
Connecting Afghanistan
When MIGa recently evaluated its support for Mtn Group’s telecommunications investment in afghanistan, the project received the highest marks for its development outcome, including strong results for financial and economic sustain-ability, private sector impact, and MIGa’s effectiveness.
after decades of armed conflict, afghanistan’s communi-cations network was barely functioning. the country had no internet access. In fact, the state of the country’s com-munications infrastructure was so poor that it hindered the government’s ability to coordinate its own operations. In response, the World Bank Group mobilized to modernize the afghan telecommunications sector. IDa credits and grants were used to provide key public infrastructure, and the joint World Bank/IFC Information and Communication technology Sector unit accessed trust funds to deliver technical assistance for reform of regulations needed to attract private investment.
In fiscal year 2007, MIGa issued a guarantee of $74.5 million to Mtn Group of South africa covering its equity investment in areeba afghanistan llC. MIGa chose to issue the guarantee despite clear risks for the project itself and for MIGa’s covered risks, as the project was expected to have a significant development impact.
Crucially, an additional $2 million “first loss” provision was insured under MIGa’s afghanistan Investment Guarantee
Facility designed to encourage foreign investment into the country. the facility is jointly funded by the government of afghanistan, IDa, the government of the united Kingdom, and the asian Development Bank.
the MIGa-supported project entailed the installation, operation, and maintenance of a GSM network, wireless communication services, internet and satellite services, and public pay phones. Mtn afghanistan’s network implemen-tation and maintenance was subcontracted to local busi-nesses and network equipment was produced locally. as a result, the project created substantial opportunities for local companies.
Following a thorough evaluation, MIGa confirmed that this was a highly developmentally beneficial project. the evaluation also clearly demonstrated that the business model employed by the project works—even in an exceedingly dif-ficult environment—as financial returns have been healthy, especially given the undeveloped market.
In fact, Mtn afghanistan exceeded most expectations. the project introduced the latest GSM technology covering over 80 percent of afghan territory. profitability margins are higher than expected. this, despite very real and grave risks: Mtn faces daily security threats from insurgent forces, as well as a highly uncertain policy environment.
Supporting Uruguay’s Largest Foreign Investment
We also completed a self evaluation on the “green” tech-nology upM pulp mill project in uruguay, which MIGa sup-ported by issuing a $300 million guarantee to its investors in 2007. the mill produces bleached eucalyptus kraft pulp that is exported to paper manufacturers in europe, asia, and north america.
the upM mill is located on the bank of the river uruguay, upstream of Fray Bentos, a town that had been economically depressed since its primary meat-packing industry closed down in 1979. High expectations were set for the project from the start—both within the community and more broadly: the project represents the largest foreign investment in uruguay’s history and has been watched closely at the national level.
MIGa’s evaluation confirms the project’s significant economic and developmental success. the mill boasts an
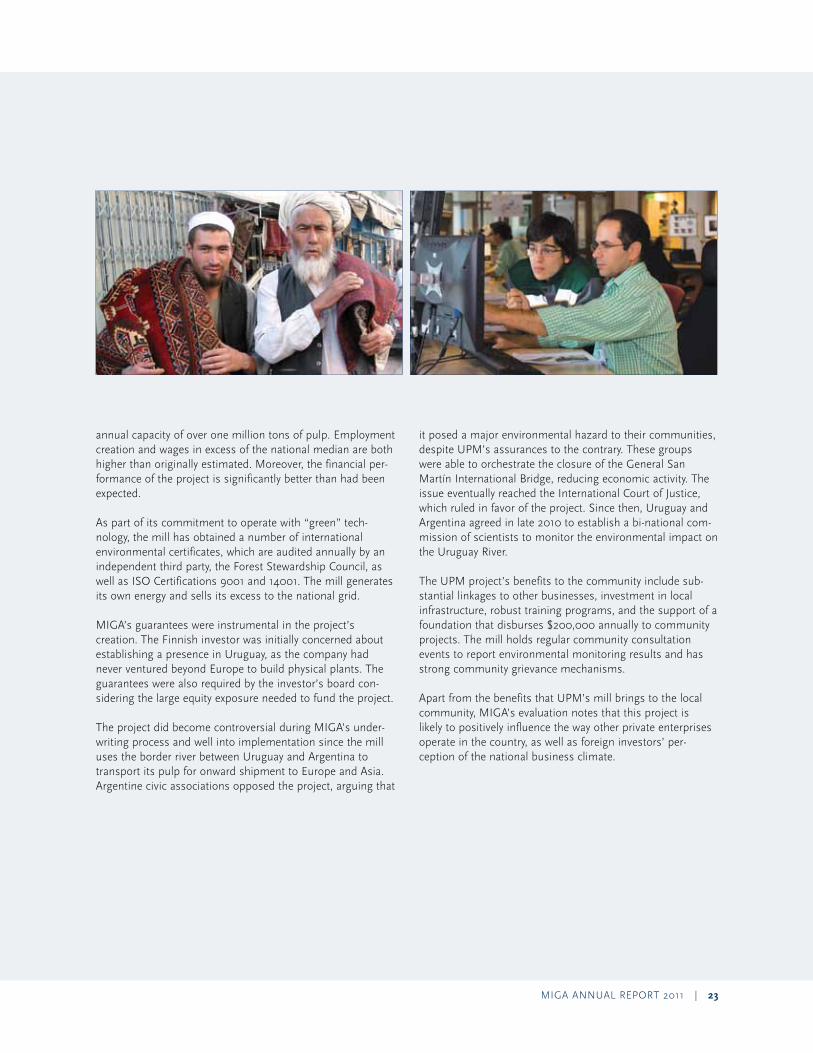
MIGa annual report 2011 | 23
annual capacity of over one million tons of pulp. employment creation and wages in excess of the national median are both higher than originally estimated. Moreover, the financial per-formance of the project is significantly better than had been expected.
as part of its commitment to operate with “green” tech-nology, the mill has obtained a number of international environmental certificates, which are audited annually by an independent third party, the Forest Stewardship Council, as well as ISo Certifications 9001 and 14001. the mill generates its own energy and sells its excess to the national grid.
MIGa’s guarantees were instrumental in the project’s creation. the Finnish investor was initially concerned about establishing a presence in uruguay, as the company had never ventured beyond europe to build physical plants. the guarantees were also required by the investor’s board con-sidering the large equity exposure needed to fund the project.
the project did become controversial during MIGa’s under-writing process and well into implementation since the mill uses the border river between uruguay and argentina to transport its pulp for onward shipment to europe and asia. argentine civic associations opposed the project, arguing that
it posed a major environmental hazard to their communities, despite upM’s assurances to the contrary. these groups were able to orchestrate the closure of the General San Martín International Bridge, reducing economic activity. the issue eventually reached the International Court of Justice, which ruled in favor of the project. Since then, uruguay and argentina agreed in late 2010 to establish a bi-national com-mission of scientists to monitor the environmental impact on the uruguay river.
the upM project’s benefits to the community include sub-stantial linkages to other businesses, investment in local infrastructure, robust training programs, and the support of a foundation that disburses $200,000 annually to community projects. the mill holds regular community consultation events to report environmental monitoring results and has strong community grievance mechanisms.
apart from the benefits that upM’s mill brings to the local community, MIGa’s evaluation notes that this project is likely to positively influence the way other private enterprises operate in the country, as well as foreign investors’ per-ception of the national business climate.
24 | MIGa annual report 2011
OperationalOverview
MIGa Business
MIGAissued$2.1billioninnewguarantee
coverageinfiscalyear2011.Thisrepresents
thelargestamountofnewissuanceinMIGA’s
history.Nearlyallofthecoveragewasissued
tonewclients—indicatingthatourenhanced
businessdevelopmentefforts,includinga
marketingagreementwiththeIFC,arebeginning
toshowresults.Inaddition,asignificant
volumeofour2011businessresultedfromrecent
amendmentstoMIGA’sConvention.
MIGa annual report 2011 | 25
the portfolio was also more diversified across sectors and regions than in recent years. We insured investments in four new host countries—Iraq, Kosovo, liberia, and the republic of Congo—and supported investments in nearly all of our business sectors. With 36 contract cancellations totaling $417 million, portfolio runoff continued to be rela-tively low, as in the past few years. at the close of the fiscal year, the agency’s total gross exposure of $9.1 billion repre-sented yet another historic high for MIGa (see figure 1).
MIGA’s Operating Environment
Fiscal year 2011 was characterized by gradual economic recovery led by the developing world. as credit con-straints eased and foreign direct investment (FDI) flows to developing countries began to recover, the demand for political risk insurance (prI) products increased. In addition, as we mentioned earlier, events in the Middle east and north africa contributed to a resurging awareness of political risk.
Figure 1 Guarantees Portfolio, Gross and Net Outstanding Exposure ($M)
Guarantees Portfolio, Gross Outstanding Exposure, $ M
Premium and fee incomeInvestment income
Consumption of MIGA’s Economic Capital by Sector in FY11
Figure 1: Earned Premium, Fees, and Investment Income* ($M)
Outstanding Portfolio Distribution by Host Region, Percent of Gross Exposure [as of February 28, 2009
60% Europe and Central Asia 14% Asia and the Pacific 12% Sub-Saharan Africa 11% Latin America and the Caribbean 5% Middle East and North Africa
Outstanding Portfolio Distribution, by Investor Country,Percent of Gross Exposure*
AustriaFrance
GermanyBelgium
LuxembourgNetherlands
SpainUnited Arab Emirates
SloveniaSingapore
Saudi ArabiaSwitzerland
South AfricaSweden
United KingdomMauritius
Cayman IslandsSenegal
JapanBermuda
CanadaEgypt, Arab Republic of
United StatesPoland
Others Others: Cyprus, Thailand, India, Turkey, Ecuador, Lebanon, Norway, Romania, Italy, Tunisia, Mali, St. Kitts and Nevis, Panama, Denmark, Virgin Islands (UK), Ireland, Colombia, Peru, Portugal
* Numbers may not add up to 100 percent due to investors for the same guarantee contract domiciled in different countries
35.19.28.06.56.24.63.43.02.72.72.52.32.21.61.61.41.41.01.01.01.00.90.60.6
1.8
11
10
09
08
07
46% Infrastructure 21% Financial 20% Oil, gas, and mining 13% Agribusiness, manufacturing, and services
* Excludes other income
50.8
46.0
43.6
38.2
35.5
13.9
24.1
36.9
45.3
42.8
01 02 03 04 05 06 07 08 09 10 11
Guarantees Issued in FY11, by Sector(by $ volume) [as of June 30, 2011]
43% Infrastructure 24% Financial 23% Agribusiness, manufacturing, and services 10% Oil, gas, and mining
0
2,000
4,000
6,000
8,000
10,000
Gross ExposureNet exposure
Figure 2: guarantees issued in FY11 by region
42% Europe and Central Asia 39% Sub-Saharan Africa 8% Asia and the Pacific 8% Latin America and the Caribbean 3% Middle East and North Africa
* Totals exceed 100 percent due to master contracts covering more than one region
26 | MIGa annual report 2011
Yet, despite this increased interest, prI seems to remain a discretionary purchase as margins become thinner and many established investors feel that their balance sheets are strong enough to warrant the risk of not insuring the investment. Competition in the industry is strong with adequate capacity to support investor demand.
our comparative advantage in this competitive market lies in MIGa’s status as a member of the World Bank Group and our ability to support complex, higher-risk projects requiring long tenors and significant syndication. Despite available capacity, many providers of prI are less willing to provide cover in countries where political risk is perceived to have increased. In these environments, MIGa is often the only insurer willing to provide coverage, especially for long tenors. Indeed, we are taking this comparative advantage to the next level by proposing the establishment of a Conflict-affected and Fragile economies Facility to further promote investment and trade in these under-served markets. Supported by donors, the facility would offer investment and export credit insurance to address the unmet demand for risk-management products, as well as to fill the gap between the exit of post-conflict official development assistance and the emergence of a resilient private sector in these countries.
as a development institution, MIGa has many additional underwriting requirements that many other prI providers do not, such as the need for economic impact analysis and environmental and social requirements. However, this is often a comparative advantage for MIGa, especially in projects that are facing difficult environmental or social
issues. our presence is a public indication that the project sponsor is developing the project in accordance with MIGa’s policy on Social and environmental Sustainability. this can help the client in a variety of ways—from managing community relations to attracting financing.
Convention Amendments Boost MIGA’s Support to FDI
Significant amendments to MIGa’s Convention, approved by MIGa’s Council of Governors, took effect in november 2010. two key modifications are that MIGa is now able to insure project debt even when we are not insuring a portion of the equity investment, and we may now insure some types of existing investments.
the ability to support non-shareholder loans supporting FDI was a critical milestone for MIGa. We frequently had to turn away projects where a lender wanted the benefit of MIGa’s cover, but the equity investor did not meet MIGa’s eligibility requirements or was not convinced of the need for prI. this resulted in cases where prospective lenders to projects chose not to proceed, reducing the number of available financing options for the sponsors—and poten-tially increasing their financing costs. our ability to insure stand-alone debt has also made it easier for us to provide non-honoring of sovereign financial obligations cover. Demand for this product has been substantial, coming pri-marily from lenders and involving transactions in the public finance area and sub-sovereign entities in frontier markets.
We can also provide prI to projects in cases of the simple acquisition of existing investments. previously, MIGa was unable to provide cover for brownfield acquisitions, despite the potential developmental benefits of having a new private sector operator. MIGa is also able to insure eligible investments in cases where an investor is seeking coverage for a pool of existing and new projects. our ability to offer coverage for existing investments puts MIGa in a better position to support investors in times of uncertainty and is particularly timely given this year’s events unfolding in the Middle east and north africa. Coverage for temporary business interruption, which was authorized under the changes to our operational regulations in fiscal year 2009, offers an added layer of protection in conflict-affected environments.
MIGA’s Business Development
this year we focused on raising awareness of our new flex-ibility and products among existing clients and developing new relationships with the banking industry. We also strengthened collaboration with the IFC to mobilize private investment into emerging markets. Building on the two organizations’ natural synergy, the IFC/MIGa business development unit leveraged IFC’s global
“Our comparative advantage in
this competitive market
lies in MIGA’s status as a member
of the World Bank Group and
our ability to support complex,
higher-risk projects requiring
long tenors and significant
syndication. ”
MIGa annual report 2011 | 27
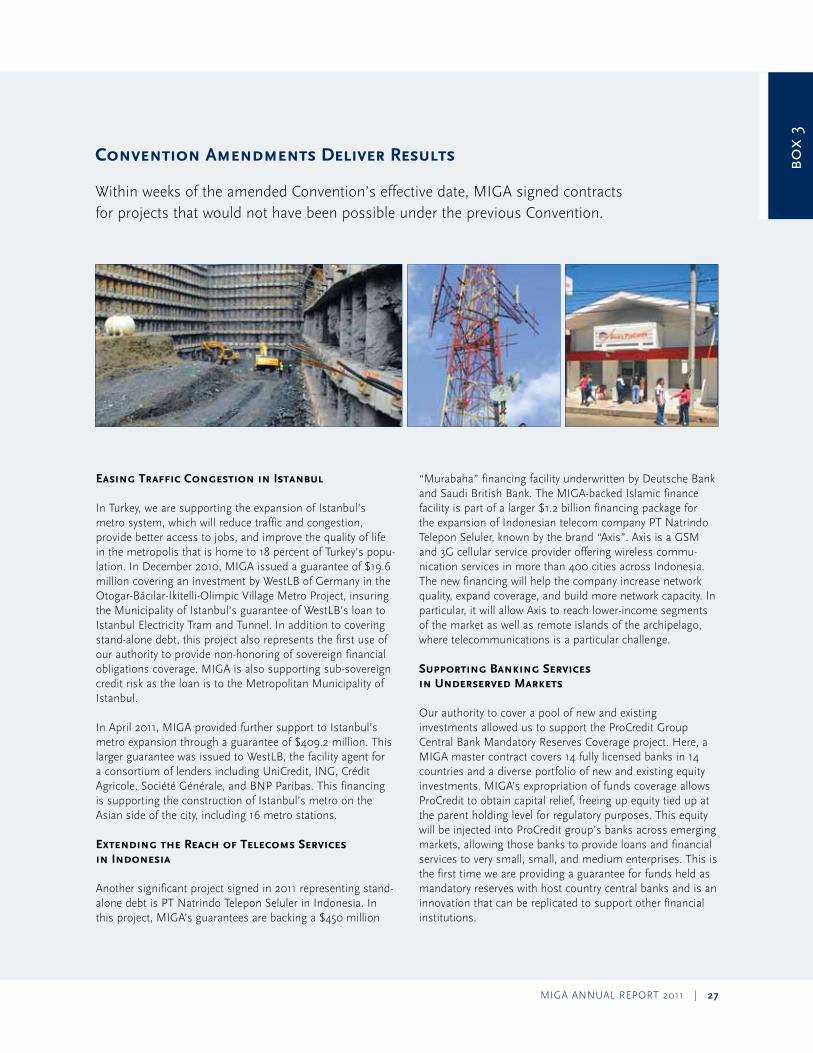
Convention Amendments Deliver Results
Within weeks of the amended Convention’s effective date, MIGa signed contracts for projects that would not have been possible under the previous Convention.
box
3
Easing Traffic Congestion in Istanbul
In turkey, we are supporting the expansion of Istanbul’s metro system, which will reduce traffic and congestion, provide better access to jobs, and improve the quality of life in the metropolis that is home to 18 percent of turkey’s popu-lation. In December 2010, MIGa issued a guarantee of $19.6 million covering an investment by WestlB of Germany in the otogar-Bacılar-Ikitelli-olimpic Village Metro project, insuring the Municipality of Istanbul’s guarantee of WestlB’s loan to Istanbul electricity tram and tunnel. In addition to covering stand-alone debt, this project also represents the first use of our authority to provide non-honoring of sovereign financial obligations coverage. MIGa is also supporting sub-sovereign credit risk as the loan is to the Metropolitan Municipality of Istanbul.
In april 2011, MIGa provided further support to Istanbul’s metro expansion through a guarantee of $409.2 million. this larger guarantee was issued to WestlB, the facility agent for a consortium of lenders including uniCredit, InG, Crédit agricole, Société Générale, and Bnp paribas. this financing is supporting the construction of Istanbul’s metro on the asian side of the city, including 16 metro stations.
Extending the Reach of Telecoms Services in Indonesia
another significant project signed in 2011 representing stand-alone debt is pt natrindo telepon Seluler in Indonesia. In this project, MIGa’s guarantees are backing a $450 million
“Murabaha” financing facility underwritten by Deutsche Bank and Saudi British Bank. the MIGa-backed Islamic finance facility is part of a larger $1.2 billion financing package for the expansion of Indonesian telecom company pt natrindo telepon Seluler, known by the brand “axis”. axis is a GSM and 3G cellular service provider offering wireless commu-nication services in more than 400 cities across Indonesia. the new financing will help the company increase network quality, expand coverage, and build more network capacity. In particular, it will allow axis to reach lower-income segments of the market as well as remote islands of the archipelago, where telecommunications is a particular challenge.
Supporting Banking Services in Underserved Markets
our authority to cover a pool of new and existing investments allowed us to support the proCredit Group Central Bank Mandatory reserves Coverage project. Here, a MIGa master contract covers 14 fully licensed banks in 14 countries and a diverse portfolio of new and existing equity investments. MIGa’s expropriation of funds coverage allows proCredit to obtain capital relief, freeing up equity tied up at the parent holding level for regulatory purposes. this equity will be injected into proCredit group’s banks across emerging markets, allowing those banks to provide loans and financial services to very small, small, and medium enterprises. this is the first time we are providing a guarantee for funds held as mandatory reserves with host country central banks and is an innovation that can be replicated to support other financial institutions.
ˇ
28 | MIGa annual report 2011
presence while offering IFC a clear financial incentive to bring bankable projects to MIGa. the landmark proCredit transaction, which resulted from this relationship, led to the completion of 14 projects in 14 countries, of which nine are eligible for concessional lending from the International Development association (IDa) (see box 3).
In august 2010, MIGa launched a hub in asia and started operations in Hong Kong Sar, China and Singapore. We also augmented our representation in Beijing and tokyo. the hub is geared toward providing better and more efficient access for MIGa’s clients and other stakeholders in asia. We felt a particularly acute need for a base in asia due to the robustness of the region’s inbound and outbound investment activities as well as practical chal-lenges such as the geographical and time differences. the team has developed a strong pipeline of viable business leads and underwriting is underway on several projects.
our marketing agents and finders program, launched in September 2009, now has five marketing agents and 41 business finders who have been selected to help us expand our marketing efforts in countries and regions where MIGa is less well-known. In fiscal year 2011, three projects in africa, equivalent to $14.2 million in guar-antees, were generated through the program—and an additional seven projects totaling approximately $500 million are in the business pipeline. the majority of these projects are in one or more of our strategic priority areas.
underpinning all of this has been a concerted effort to improve efficiency within the agency. We have streamlined a number of internal processes and launched a new system to support coordinated management of client rela-tionships.
Product Innovation, New Host Countries Broaden MIGA’s Portfolio
From a regional and country perspective, MIGa’s guarantee volume showed significant diversification (see figure 2) as europe and Central asia accounted for 51 percent of the volume of guarantees issued, compared to 74 percent in fiscal year 2010 and 88 percent in fiscal year 2009. We supported 15 new projects in sub-Saharan africa, spanning a variety of sectors. Seventy-two percent of the projects we supported fell into one or more of our strategic priority areas: investment into IDa-eligible countries, support for complex projects, support for South-South investment, and investment into conflict-affected countries.
this year we issued guarantees in support of investments into Iraq, Kosovo, liberia, and the republic of Congo. these are new host countries for MIGa and all represent priority areas for us. notably, all four countries are rec-ognized by the World Bank as “conflict-affected.”
Diversity also returned at the sector level (see figure 3). Since the onset of the global financial crisis, we focused heavily on supporting the recapitalization of banks in eastern europe and Central asia as part of the World Bank Group’s Financial Sector Initiative. this year we wound down those activities as demand subsided and investor needs shifted. as a result, 24 percent of the volume of guarantees we issued this year were in the financial sector, compared to 64 percent in fiscal year 2010. We covered 17 projects in this sector, including 14 projects with proCredit Holding, a new client for MIGa focusing on small and medium enterprises. through our Small Investment program, we are supporting a health insurance provider in Kenya that is expanding its delivery of medical insurance in east africa.
Figure 2 Guarantees issued in FY11, by Region(by number of projects)
as noted earlier, demand by financial institutions for MIGa’s cover against the risk of non-honoring of sov-ereign financial obligations resulted in robust support to the infrastructure sector, including two contracts covering the construction of Istanbul’s metro system. Several additional infrastructure projects involving this cover are in MIGa’s pipeline for fiscal year 2012. MIGa’s increased value in the infrastructure sector has been recognized by the market: In polling undertaken by Infrastructure Investor, MIGa received Honorable Mention in the category of Global Infrastructure Insurance House of the Year (2010).
We also supported a number of new agribusiness trans-actions this year. this sector is an area of particular importance considering deepening concerns about food price volatility and supply. our work in this sector is bolstering the World Bank Group’s commitment to helping developing countries improve agriculture’s con-tribution to food security, raising the incomes of the poor, and facilitating economic transformation. notably, in Zambia, a MIGa guarantee backs a project that will cultivate maize, wheat, and soya for consumers in that country and the broader Southern african Development
Guarantees Portfolio, Gross Outstanding Exposure, $ M
Premium and fee incomeInvestment income
Consumption of MIGA’s Economic Capital by Sector in FY11
Figure 1: Earned Premium, Fees, and Investment Income* ($M)
Outstanding Portfolio Distribution by Host Region, Percent of Gross Exposure [as of February 28, 2009
60% Europe and Central Asia 14% Asia and the Pacific 12% Sub-Saharan Africa 11% Latin America and the Caribbean 5% Middle East and North Africa
Outstanding Portfolio Distribution, by Investor Country,Percent of Gross Exposure*
AustriaFrance
GermanyBelgium
LuxembourgNetherlands
SpainUnited Arab Emirates
SloveniaSingapore
Saudi ArabiaSwitzerland
South AfricaSweden
United KingdomMauritius
Cayman IslandsSenegal
JapanBermuda
CanadaEgypt, Arab Republic of
United StatesPoland
Others Others: Cyprus, Thailand, India, Turkey, Ecuador, Lebanon, Norway, Romania, Italy, Tunisia, Mali, St. Kitts and Nevis, Panama, Denmark, Virgin Islands (UK), Ireland, Colombia, Peru, Portugal
* Numbers may not add up to 100 percent due to investors for the same guarantee contract domiciled in different countries
35.19.28.06.56.24.63.43.02.72.72.52.32.21.61.61.41.41.01.01.01.00.90.60.6
1.8
11
10
09
08
07
46% Infrastructure 21% Financial 20% Oil, gas, and mining 13% Agribusiness, manufacturing, and services
* Excludes other income
50.8
46.0
43.6
38.2
35.5
13.9
24.1
36.9
45.3
42.8
01 02 03 04 05 06 07 08 09 10 11
Guarantees Issued in FY11, by Sector(by $ volume) [as of June 30, 2011]
43% Infrastructure 24% Financial 23% Agribusiness, manufacturing, and services 10% Oil, gas, and mining
0
2,000
4,000
6,000
8,000
10,000
Gross ExposureNet exposure
Figure 2: guarantees issued in FY11 by region
42% Europe and Central Asia 39% Sub-Saharan Africa 8% Asia and the Pacific 8% Latin America and the Caribbean 3% Middle East and North Africa
* Totals exceed 100 percent due to master contracts covering more than one region
MIGa annual report 2011 | 29
Community (SaDC). this project comes under the master contract we issued last year to Chayton atlas Investments, an investment holding company within Chayton atlas agricultural Company, a private equity fund focused on investing in agribusiness in SaDC countries.
portfolio runoff due to cancelled contracts remained somewhat lower than the years preceding the global financial crisis, but is beginning to return to pre-crisis levels. thirty-six contracts were cancelled this fiscal year compared to 32 in 2010, 11 in 2009, 50 in 2008, and 54 in 2007. the majority of these cancellations were due to the sale of the project enterprise by MIGa’s guarantee holder. a sig-nificant number of cancellations also takes place each year as a result of changes in corporate strategy related to risk management. these generally occur when an investment is considered successful from a financial standpoint or when perceptions of political risk have improved.
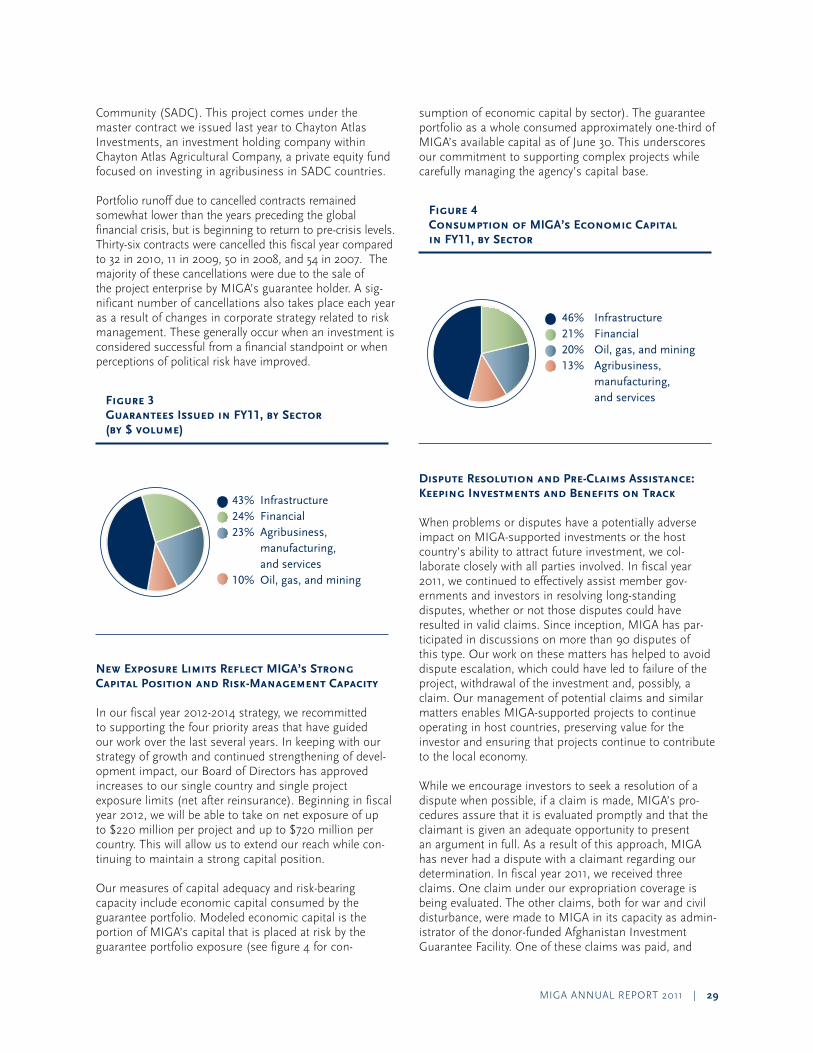
Figure 3 Guarantees Issued in FY11, by Sector (by $ volume)
New Exposure Limits Reflect MIGA’s Strong Capital Position and Risk-Management Capacity
In our fiscal year 2012-2014 strategy, we recommitted to supporting the four priority areas that have guided our work over the last several years. In keeping with our strategy of growth and continued strengthening of devel-opment impact, our Board of Directors has approved increases to our single country and single project exposure limits (net after reinsurance). Beginning in fiscal year 2012, we will be able to take on net exposure of up to $220 million per project and up to $720 million per country. this will allow us to extend our reach while con-tinuing to maintain a strong capital position.
our measures of capital adequacy and risk-bearing capacity include economic capital consumed by the guarantee portfolio. Modeled economic capital is the portion of MIGa’s capital that is placed at risk by the guarantee portfolio exposure (see figure 4 for con-
sumption of economic capital by sector). the guarantee portfolio as a whole consumed approximately one-third of MIGa’s available capital as of June 30. this underscores our commitment to supporting complex projects while carefully managing the agency’s capital base.
Figure 4 Consumption of MIGA’s Economic Capital in FY11, by Sector
Dispute Resolution and Pre-Claims Assistance: Keeping Investments and Benefits on Track
When problems or disputes have a potentially adverse impact on MIGa-supported investments or the host country’s ability to attract future investment, we col-laborate closely with all parties involved. In fiscal year 2011, we continued to effectively assist member gov-ernments and investors in resolving long-standing disputes, whether or not those disputes could have resulted in valid claims. Since inception, MIGa has par-ticipated in discussions on more than 90 disputes of this type. our work on these matters has helped to avoid dispute escalation, which could have led to failure of the project, withdrawal of the investment and, possibly, a claim. our management of potential claims and similar matters enables MIGa-supported projects to continue operating in host countries, preserving value for the investor and ensuring that projects continue to contribute to the local economy.
While we encourage investors to seek a resolution of a dispute when possible, if a claim is made, MIGa’s pro-cedures assure that it is evaluated promptly and that the claimant is given an adequate opportunity to present an argument in full. as a result of this approach, MIGa has never had a dispute with a claimant regarding our determination. In fiscal year 2011, we received three claims. one claim under our expropriation coverage is being evaluated. the other claims, both for war and civil disturbance, were made to MIGa in its capacity as admin-istrator of the donor-funded afghanistan Investment Guarantee Facility. one of these claims was paid, and
Guarantees Portfolio, Gross Outstanding Exposure, $ M
Premium and fee incomeInvestment income
Consumption of MIGA’s Economic Capital by Sector in FY11
Figure 1: Earned Premium, Fees, and Investment Income* ($M)
Outstanding Portfolio Distribution by Host Region, Percent of Gross Exposure [as of February 28, 2009
60% Europe and Central Asia 14% Asia and the Pacific 12% Sub-Saharan Africa 11% Latin America and the Caribbean 5% Middle East and North Africa
Outstanding Portfolio Distribution, by Investor Country,Percent of Gross Exposure*
AustriaFrance
GermanyBelgium
LuxembourgNetherlands
SpainUnited Arab Emirates
SloveniaSingapore
Saudi ArabiaSwitzerland
South AfricaSweden
United KingdomMauritius
Cayman IslandsSenegal
JapanBermuda
CanadaEgypt, Arab Republic of
United StatesPoland
Others Others: Cyprus, Thailand, India, Turkey, Ecuador, Lebanon, Norway, Romania, Italy, Tunisia, Mali, St. Kitts and Nevis, Panama, Denmark, Virgin Islands (UK), Ireland, Colombia, Peru, Portugal
* Numbers may not add up to 100 percent due to investors for the same guarantee contract domiciled in different countries
35.19.28.06.56.24.63.43.02.72.72.52.32.21.61.61.41.41.01.01.01.00.90.60.6
1.8
11
10
09
08
07
46% Infrastructure 21% Financial 20% Oil, gas, and mining 13% Agribusiness, manufacturing, and services
* Excludes other income
50.8
46.0
43.6
38.2
35.5
13.9
24.1
36.9
45.3
42.8
01 02 03 04 05 06 07 08 09 10 11
Guarantees Issued in FY11, by Sector(by $ volume) [as of June 30, 2011]
43% Infrastructure 24% Financial 23% Agribusiness, manufacturing, and services 10% Oil, gas, and mining
0
2,000
4,000
6,000
8,000
10,000
Gross ExposureNet exposure
Figure 2: guarantees issued in FY11 by region
42% Europe and Central Asia 39% Sub-Saharan Africa 8% Asia and the Pacific 8% Latin America and the Caribbean 3% Middle East and North Africa
* Totals exceed 100 percent due to master contracts covering more than one region
30 | MIGa annual report 2011
MIGa is evaluating the other. In addition, we are con-tinuing to work on a claim filed in fiscal year 2010 and have given the investor additional time to support its claim. MIGa maintains appropriate reserves for these matters.
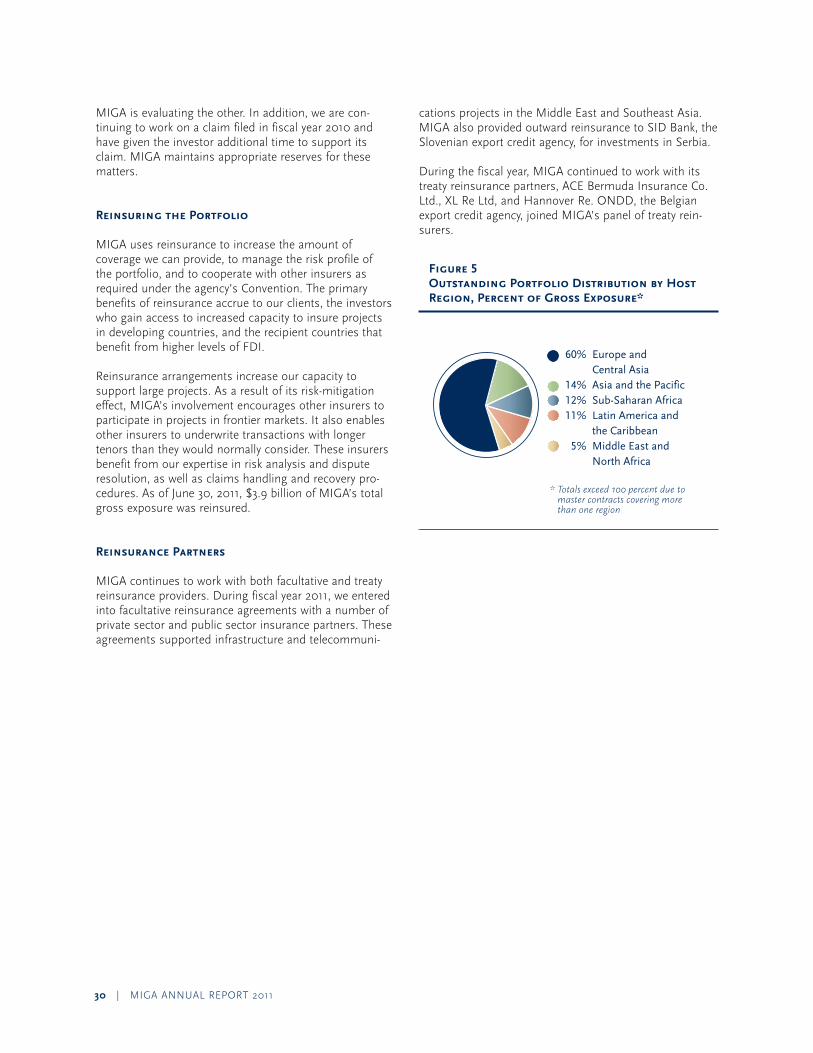
Reinsuring the Portfolio
MIGa uses reinsurance to increase the amount of coverage we can provide, to manage the risk profile of the portfolio, and to cooperate with other insurers as required under the agency’s Convention. the primary benefits of reinsurance accrue to our clients, the investors who gain access to increased capacity to insure projects in developing countries, and the recipient countries that benefit from higher levels of FDI.
reinsurance arrangements increase our capacity to support large projects. as a result of its risk-mitigation effect, MIGa’s involvement encourages other insurers to participate in projects in frontier markets. It also enables other insurers to underwrite transactions with longer tenors than they would normally consider. these insurers benefit from our expertise in risk analysis and dispute resolution, as well as claims handling and recovery pro-cedures. as of June 30, 2011, $3.9 billion of MIGa’s total gross exposure was reinsured.
Reinsurance Partners
MIGa continues to work with both facultative and treaty reinsurance providers. During fiscal year 2011, we entered into facultative reinsurance agreements with a number of private sector and public sector insurance partners. these agreements supported infrastructure and telecommuni-
cations projects in the Middle east and Southeast asia. MIGa also provided outward reinsurance to SID Bank, the Slovenian export credit agency, for investments in Serbia.
During the fiscal year, MIGa continued to work with its treaty reinsurance partners, aCe Bermuda Insurance Co. ltd., Xl re ltd, and Hannover re. onDD, the Belgian export credit agency, joined MIGa’s panel of treaty rein-surers.
Figure 5 Outstanding Portfolio Distribution by Host Region, Percent of Gross Exposure*
Guarantees Portfolio, Gross Outstanding Exposure, $ M
Premium and fee incomeInvestment income
Consumption of MIGA’s Economic Capital by Sector in FY11
Figure 1: Earned Premium, Fees, and Investment Income* ($M)
Outstanding Portfolio Distribution by Host Region, Percent of Gross Exposure [as of February 28, 2009
60% Europe and Central Asia 14% Asia and the Pacific 12% Sub-Saharan Africa 11% Latin America and the Caribbean 5% Middle East and North Africa
Outstanding Portfolio Distribution, by Investor Country,Percent of Gross Exposure*
AustriaFrance
GermanyBelgium
LuxembourgNetherlands
SpainUnited Arab Emirates
SloveniaSingapore
Saudi ArabiaSwitzerland
South AfricaSweden
United KingdomMauritius
Cayman IslandsSenegal
JapanBermuda
CanadaEgypt, Arab Republic of
United StatesPoland
Others Others: Cyprus, Thailand, India, Turkey, Ecuador, Lebanon, Norway, Romania, Italy, Tunisia, Mali, St. Kitts and Nevis, Panama, Denmark, Virgin Islands (UK), Ireland, Colombia, Peru, Portugal
* Numbers may not add up to 100 percent due to investors for the same guarantee contract domiciled in different countries
35.19.28.06.56.24.63.43.02.72.72.52.32.21.61.61.41.41.01.01.01.00.90.60.6
1.8
11
10
09
08
07
46% Infrastructure 21% Financial 20% Oil, gas, and mining 13% Agribusiness, manufacturing, and services
* Excludes other income
50.8
46.0
43.6
38.2
35.5
13.9
24.1
36.9
45.3
42.8
01 02 03 04 05 06 07 08 09 10 11
Guarantees Issued in FY11, by Sector(by $ volume) [as of June 30, 2011]
43% Infrastructure 24% Financial 23% Agribusiness, manufacturing, and services 10% Oil, gas, and mining
0
2,000
4,000
6,000
8,000
10,000
Gross ExposureNet exposure
Figure 2: guarantees issued in FY11 by region
42% Europe and Central Asia 39% Sub-Saharan Africa 8% Asia and the Pacific 8% Latin America and the Caribbean 3% Middle East and North Africa
* Totals exceed 100 percent due to master contracts covering more than one region
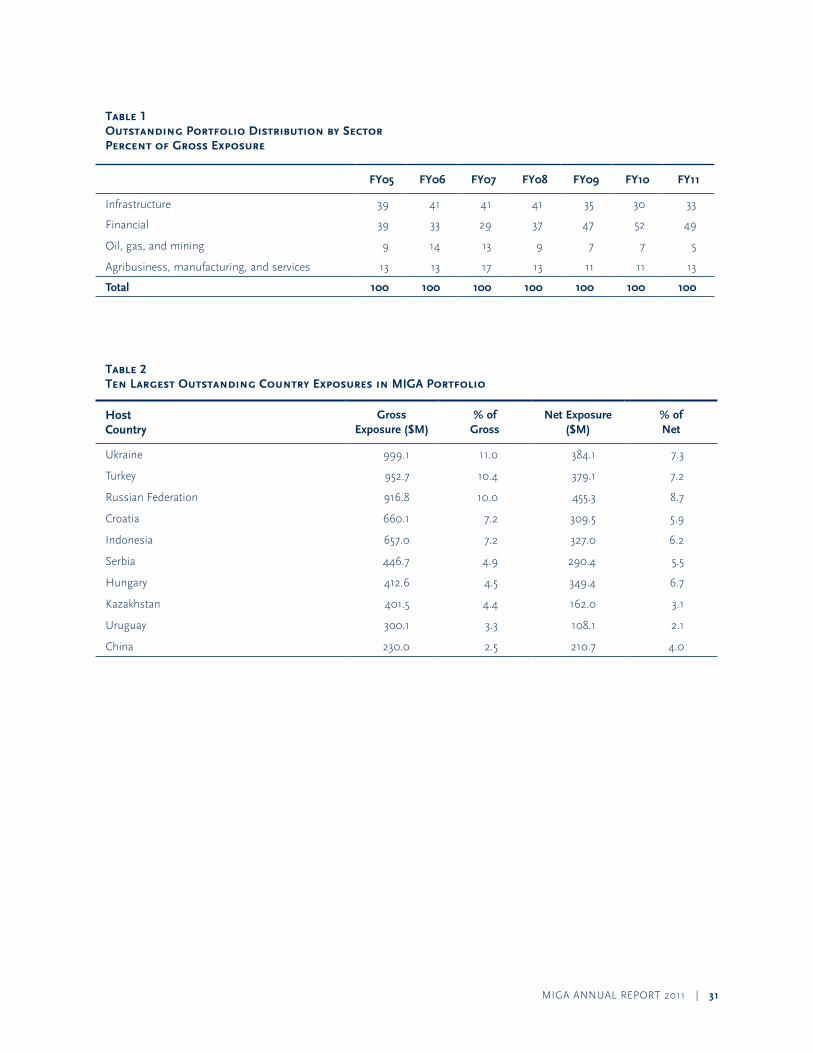
MIGa annual report 2011 | 31
Table 2 Ten Largest Outstanding Country Exposures in MIGA Portfolio
Host Country
Gross Exposure ($M)
% of Gross
Net Exposure ($M)
% of Net
ukraine 999.1 11.0 384.1 7.3
turkey 952.7 10.4 379.1 7.2
russian Federation 916.8 10.0 455.3 8.7
Croatia 660.1 7.2 309.5 5.9
Indonesia 657.0 7.2 327.0 6.2
Serbia 446.7 4.9 290.4 5.5
Hungary 412.6 4.5 349.4 6.7
Kazakhstan 401.5 4.4 162.0 3.1
uruguay 300.1 3.3 108.1 2.1
China 230.0 2.5 210.7 4.0
Table 1 Outstanding Portfolio Distribution by Sector Percent of Gross Exposure
FY05 FY06 FY07 FY08 FY09 FY10 FY11
Infrastructure 39 41 41 41 35 30 33
Financial 39 33 29 37 47 52 49
oil, gas, and mining 9 14 13 9 7 7 5
agribusiness, manufacturing, and services 13 13 17 13 11 11 13
Total 100 100 100 100 100 100 100
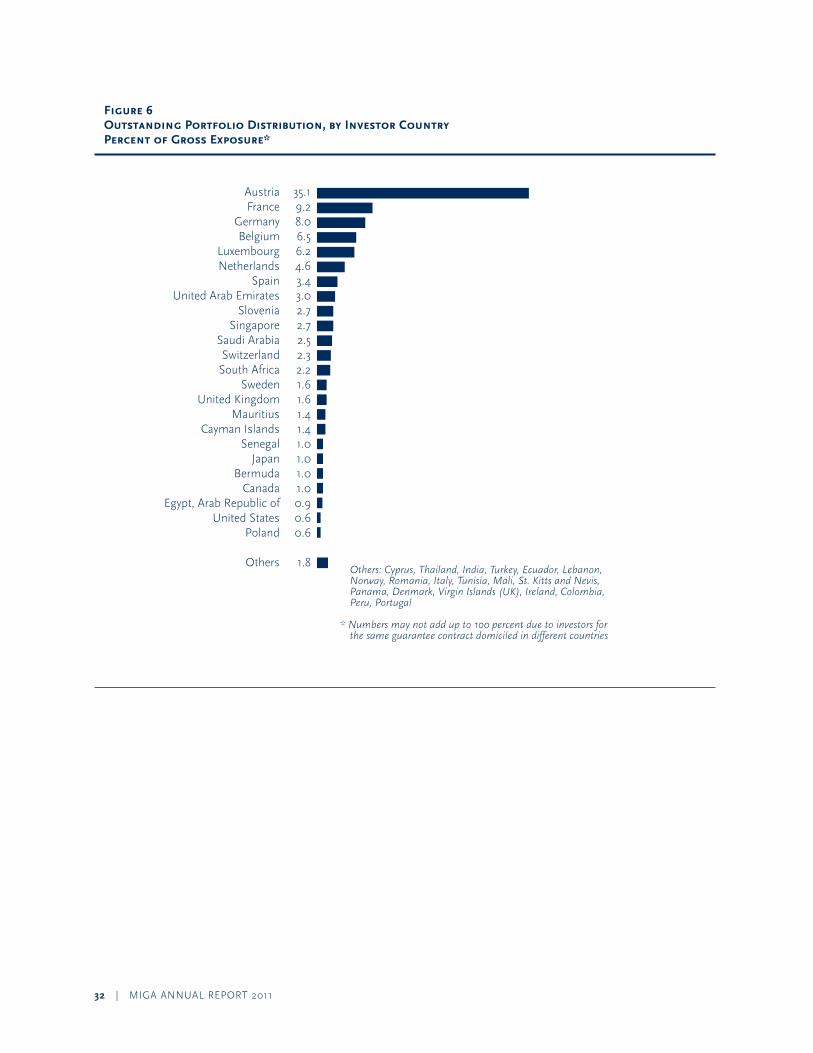
32 | MIGa annual report 2011
Figure 6 Outstanding Portfolio Distribution, by Investor Country Percent of Gross Exposure*
Guarantees Portfolio, Gross Outstanding Exposure, $ M
Premium and fee incomeInvestment income
Consumption of MIGA’s Economic Capital by Sector in FY11
Figure 1: Earned Premium, Fees, and Investment Income* ($M)
Outstanding Portfolio Distribution by Host Region, Percent of Gross Exposure [as of February 28, 2009
60% Europe and Central Asia 14% Asia and the Pacific 12% Sub-Saharan Africa 11% Latin America and the Caribbean 5% Middle East and North Africa
Outstanding Portfolio Distribution, by Investor Country,Percent of Gross Exposure*
AustriaFrance
GermanyBelgium
LuxembourgNetherlands
SpainUnited Arab Emirates
SloveniaSingapore
Saudi ArabiaSwitzerland
South AfricaSweden
United KingdomMauritius
Cayman IslandsSenegal
JapanBermuda
CanadaEgypt, Arab Republic of
United StatesPoland
Others Others: Cyprus, Thailand, India, Turkey, Ecuador, Lebanon, Norway, Romania, Italy, Tunisia, Mali, St. Kitts and Nevis, Panama, Denmark, Virgin Islands (UK), Ireland, Colombia, Peru, Portugal
* Numbers may not add up to 100 percent due to investors for the same guarantee contract domiciled in different countries
35.19.28.06.56.24.63.43.02.72.72.52.32.21.61.61.41.41.01.01.01.00.90.60.6
1.8
11
10
09
08
07
46% Infrastructure 21% Financial 20% Oil, gas, and mining 13% Agribusiness, manufacturing, and services
* Excludes other income
50.8
46.0
43.6
38.2
35.5
13.9
24.1
36.9
45.3
42.8
01 02 03 04 05 06 07 08 09 10 11
Guarantees Issued in FY11, by Sector(by $ volume) [as of June 30, 2011]
43% Infrastructure 24% Financial 23% Agribusiness, manufacturing, and services 10% Oil, gas, and mining
0
2,000
4,000
6,000
8,000
10,000
Gross ExposureNet exposure
Figure 2: guarantees issued in FY11 by region
42% Europe and Central Asia 39% Sub-Saharan Africa 8% Asia and the Pacific 8% Latin America and the Caribbean 3% Middle East and North Africa
* Totals exceed 100 percent due to master contracts covering more than one region
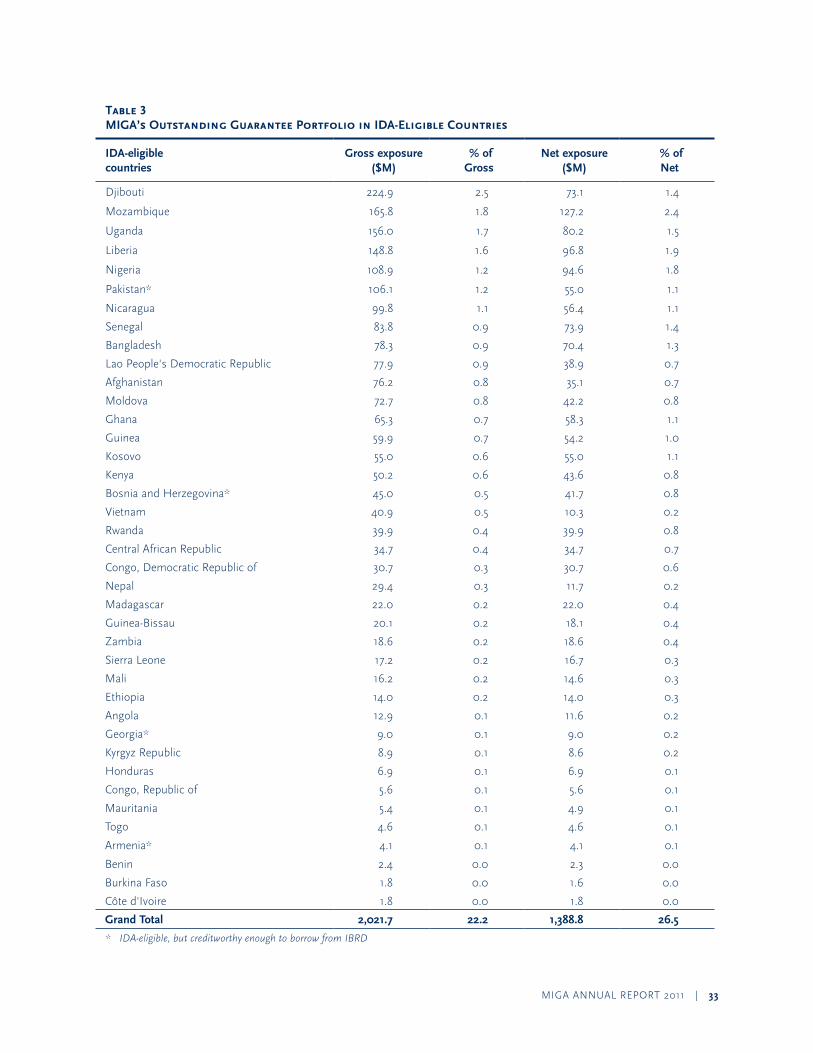
MIGa annual report 2011 | 33
Table 3 MIGA’s Outstanding Guarantee Portfolio in IDA-Eligible Countries
IDA-eligible countries
Gross exposure ($M)
% of Gross
Net exposure ($M)
% of Net
Djibouti 224.9 2.5 73.1 1.4
Mozambique 165.8 1.8 127.2 2.4
uganda 156.0 1.7 80.2 1.5
liberia 148.8 1.6 96.8 1.9
nigeria 108.9 1.2 94.6 1.8
pakistan* 106.1 1.2 55.0 1.1
nicaragua 99.8 1.1 56.4 1.1
Senegal 83.8 0.9 73.9 1.4
Bangladesh 78.3 0.9 70.4 1.3
lao people's Democratic republic 77.9 0.9 38.9 0.7
afghanistan 76.2 0.8 35.1 0.7
Moldova 72.7 0.8 42.2 0.8
Ghana 65.3 0.7 58.3 1.1
Guinea 59.9 0.7 54.2 1.0
Kosovo 55.0 0.6 55.0 1.1
Kenya 50.2 0.6 43.6 0.8
Bosnia and Herzegovina* 45.0 0.5 41.7 0.8
Vietnam 40.9 0.5 10.3 0.2
rwanda 39.9 0.4 39.9 0.8
Central african republic 34.7 0.4 34.7 0.7
Congo, Democratic republic of 30.7 0.3 30.7 0.6
nepal 29.4 0.3 11.7 0.2
Madagascar 22.0 0.2 22.0 0.4
Guinea-Bissau 20.1 0.2 18.1 0.4
Zambia 18.6 0.2 18.6 0.4
Sierra leone 17.2 0.2 16.7 0.3
Mali 16.2 0.2 14.6 0.3
ethiopia 14.0 0.2 14.0 0.3
angola 12.9 0.1 11.6 0.2
Georgia* 9.0 0.1 9.0 0.2
Kyrgyz republic 8.9 0.1 8.6 0.2
Honduras 6.9 0.1 6.9 0.1
Congo, republic of 5.6 0.1 5.6 0.1
Mauritania 5.4 0.1 4.9 0.1
togo 4.6 0.1 4.6 0.1
armenia* 4.1 0.1 4.1 0.1
Benin 2.4 0.0 2.3 0.0
Burkina Faso 1.8 0.0 1.6 0.0
Côte d'Ivoire 1.8 0.0 1.8 0.0
Grand Total 2,021.7 22.2 1,388.8 26.5
* IDA-eligible, but creditworthy enough to borrow from IBRD
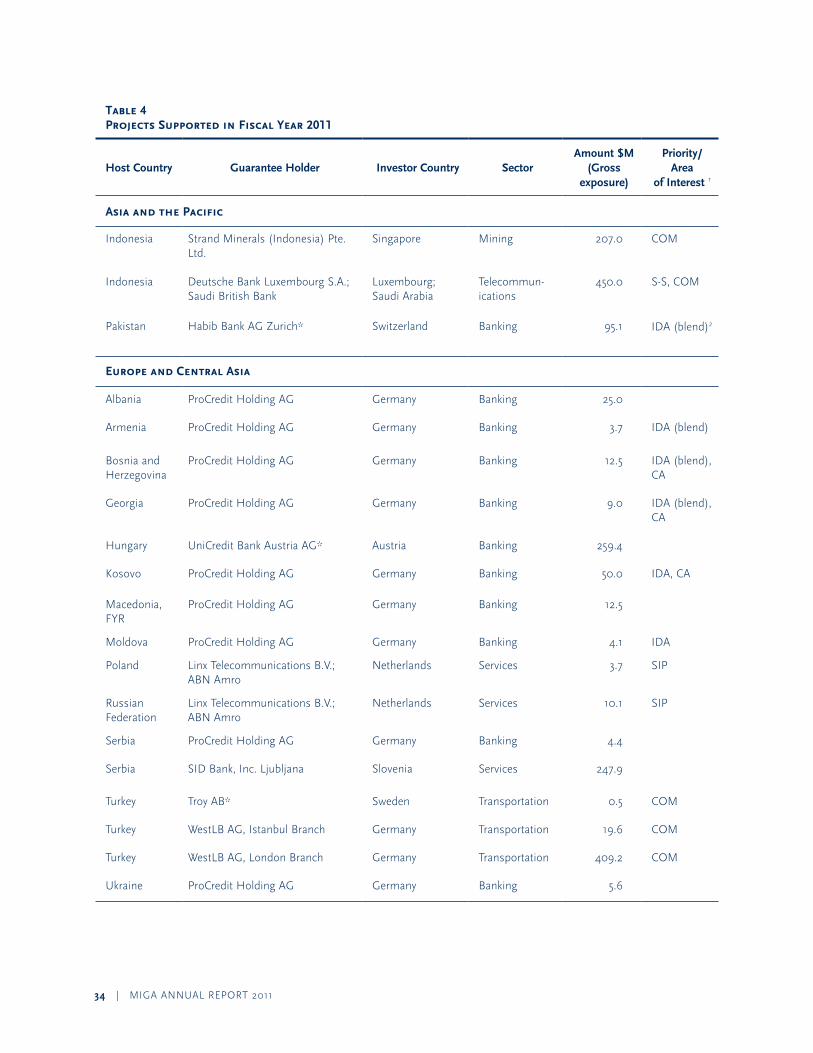
34 | MIGa annual report 2011
Table 4 Projects Supported in Fiscal Year 2011
Host Country Guarantee Holder Investor Country SectorAmount $M
(Gross exposure)
Priority/Area
of Interest 1
Asia and the Pacific
Indonesia Strand Minerals (Indonesia) pte. ltd.
Singapore Mining 207.0 CoM
Indonesia Deutsche Bank luxembourg S.a.; Saudi British Bank
luxembourg; Saudi arabia
telecommun-ications
450.0 S-S, CoM
pakistan Habib Bank aG Zurich* Switzerland Banking 95.1 IDa (blend)2
Europe and Central Asia
albania proCredit Holding aG Germany Banking 25.0
armenia proCredit Holding aG Germany Banking 3.7 IDa (blend)
Bosnia and Herzegovina
proCredit Holding aG Germany Banking 12.5 IDa (blend), Ca
Georgia proCredit Holding aG Germany Banking 9.0 IDa (blend), Ca
Hungary uniCredit Bank austria aG* austria Banking 259.4
Kosovo proCredit Holding aG Germany Banking 50.0 IDa, Ca
Macedonia, FYr
proCredit Holding aG Germany Banking 12.5
Moldova proCredit Holding aG Germany Banking 4.1 IDa
poland linx telecommunications B.V.; aBn amro
netherlands Services 3.7 SIp
russian Federation
linx telecommunications B.V.; aBn amro
netherlands Services 10.1 SIp
Serbia proCredit Holding aG Germany Banking 4.4
Serbia SID Bank, Inc. ljubljana Slovenia Services 247.9
turkey troy aB* Sweden transportation 0.5 CoM
turkey WestlB aG, Istanbul Branch Germany transportation 19.6 CoM
turkey WestlB aG, london Branch Germany transportation 409.2 CoM
ukraine proCredit Holding aG Germany Banking 5.6
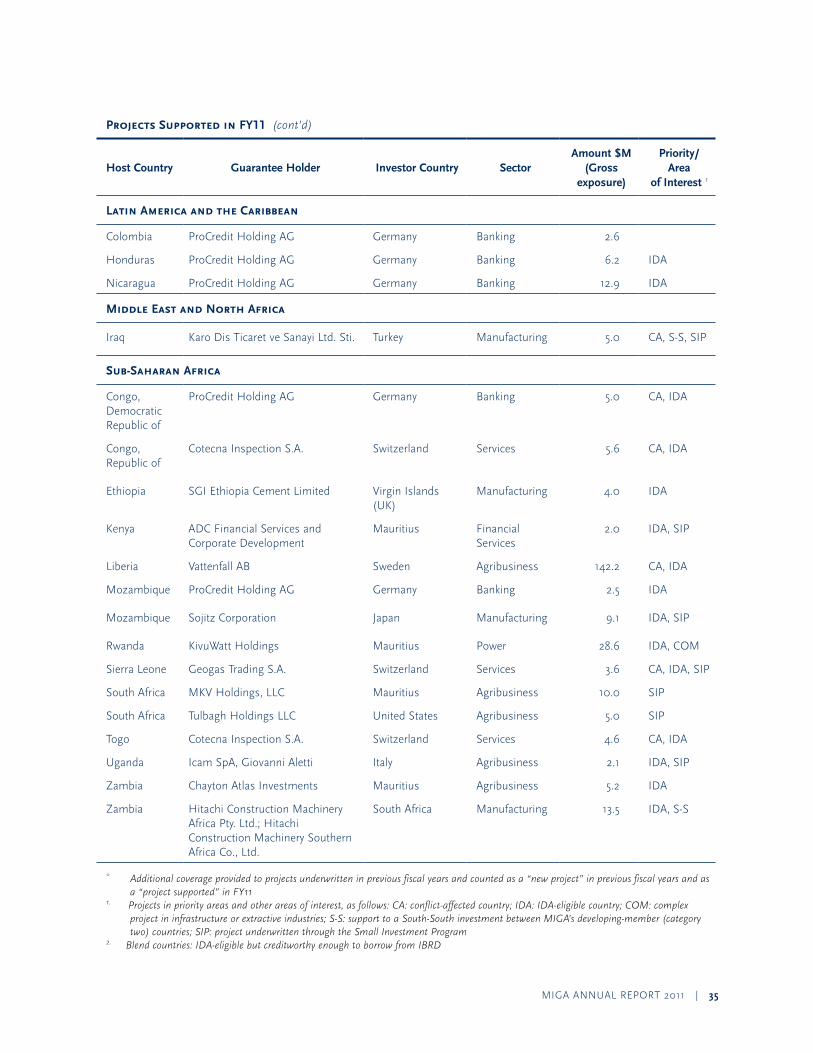
MIGa annual report 2011 | 35
Projects Supported in FY11 (cont’d)
Host Country Guarantee Holder Investor Country SectorAmount $M
(Gross exposure)
Priority/Area
of Interest 1
Latin America and the Caribbean
Colombia proCredit Holding aG Germany Banking 2.6
Honduras proCredit Holding aG Germany Banking 6.2 IDa
nicaragua proCredit Holding aG Germany Banking 12.9 IDa
Middle East and North Africa
Iraq Karo Dis ticaret ve Sanayi ltd. Sti. turkey Manufacturing 5.0 Ca, S-S, SIp
Sub-Saharan Africa
Congo, Democratic republic of
proCredit Holding aG Germany Banking 5.0 Ca, IDa
Congo, republic of
Cotecna Inspection S.a. Switzerland Services 5.6 Ca, IDa
ethiopia SGI ethiopia Cement limited Virgin Islands (uK)
Manufacturing 4.0 IDa
Kenya aDC Financial Services and Corporate Development
Mauritius Financial Services
2.0 IDa, SIp
liberia Vattenfall aB Sweden agribusiness 142.2 Ca, IDa
Mozambique proCredit Holding aG Germany Banking 2.5 IDa
Mozambique Sojitz Corporation Japan Manufacturing 9.1 IDa, SIp
rwanda KivuWatt Holdings Mauritius power 28.6 IDa, CoM
Sierra leone Geogas trading S.a. Switzerland Services 3.6 Ca, IDa, SIp
South africa MKV Holdings, llC Mauritius agribusiness 10.0 SIp
South africa tulbagh Holdings llC united States agribusiness 5.0 SIp
togo Cotecna Inspection S.a. Switzerland Services 4.6 Ca, IDa
uganda Icam Spa, Giovanni aletti Italy agribusiness 2.1 IDa, SIp
Zambia Chayton atlas Investments Mauritius agribusiness 5.2 IDa
Zambia Hitachi Construction Machinery africa pty. ltd.; Hitachi Construction Machinery Southern africa Co., ltd.
South africa Manufacturing 13.5 IDa, S-S
* Additional coverage provided to projects underwritten in previous fiscal years and counted as a “new project” in previous fiscal years and as a “project supported” in FY11
1. Projects in priority areas and other areas of interest, as follows: CA: conflict-affected country; IDA: IDA-eligible country; COM: complex project in infrastructure or extractive industries; S-S: support to a South-South investment between MIGA’s developing-member (category two) countries; SIP: project underwritten through the Small Investment Program
2. Blend countries: IDA-eligible but creditworthy enough to borrow from IBRD
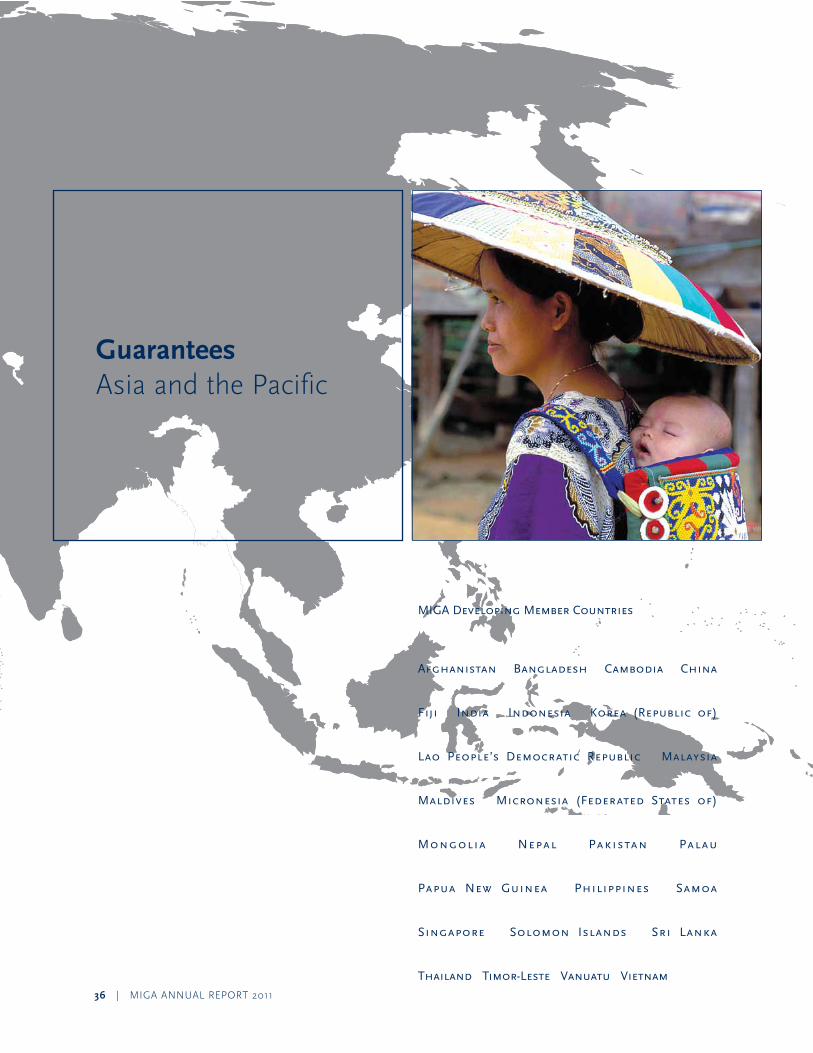
36 | MIGa annual report 2011
MIGADevelopingMemberCountries
Afghanistan Bangladesh Cambodia China
Fiji India Indonesia Korea (Republic of)
Lao People’s Democratic Republic Malaysia
Maldives Micronesia (Federated States of)
Mongolia Nepal Pakistan Palau
Papua New Guinea Philippines Samoa
Singapore Solomon Islands Sri Lanka
ThailandTimor-LesteVanuatuVietnam
Guaranteesasia and the pacific
MIGa annual report 2011 | 37
the east asia and pacific region rebounded quickly from the recession prompted by the financial crisis, with overall growth estimated to have reached 9.6 percent in 2010. Supported by a fiscal stimulus, China was the principal driver, with GDp growth estimated at 10.3 percent in 2010. also driven by China, exports of goods and services rebounded robustly in 2010 having declined in the previous year. excluding China, the east asia and pacific region grew by 1.5 percent in 2009 and an estimated 6.8 percent in 2010. GDp growth rates for China and the region as a whole are expected to slow somewhat in 2011 and 2012, but remain elevated.
the effects of the March 2011 earthquake and tsunami in Japan are expected to have a negative impact on that country’s growth rate in the short term, but as recon-struction begins growth is expected to accelerate. this temporary slowdown in Japan is expected to have a modest short-term effect on the region through subdued trade and FDI flows, as well as disruptions in regionally integrated supply chain production.
South asia also recovered quickly from the recession, mostly due to strong domestic demand, stimulus measures, and improved exports. as a result, GDp growth for the region is estimated at 9.3 percent in 2010, with India alone expected to grow at 8.8 percent. excluding India, South asia’s rate of growth for 2010 is estimated at 5 percent.
the strong rebound of the asia-pacific region, coupled with asset price increases, spiking food and oil prices, and a surge in portfolio inflows, has also raised the specter of inflation in a number of countries. this has prompted increases in interest rates to control inflationary pressures, new measures aimed at stemming price increases in overheated sectors, and currency appreciations in some countries.
net private and official capital flows increased in 2010 to an estimated $378.2 billion in east asia and the pacific. Following a sizable decline in 2009, net FDI inflows jumped by 63 percent to an estimated $225.2 billion in 2010, and are projected to increase further to $267.7 billion in 2012. In South asia, net private and official flows increased to an estimated $88.3 billion in 2010, but FDI flows declined for the second consecutive year from a peak of $48.7 billion in 2008 to an estimated $24.2 billion.
During the fiscal year, MIGa provided guarantees for three projects in the region. at year-end, MIGa’s gross guarantee exposure stood at $1.3 billion, equivalent to 14 percent of the agency’s outstanding portfolio.
Indonesia
Project name: PT Natrindo Telepon Seluler
Guaranteeholders:DeutscheBankLuxembourgS.A.;SaudiBritishBank
on June 15, 2011, MIGa issued guarantees totaling $450 million covering a “Murabaha” financing facility by Deutsche Bank luxembourg S.a. and Saudi British Bank (SaBB) for pt natrindo telepon Seluler (ntS) in Indonesia. MIGa’s coverage is for a period of up to seven and a half years against the risks of transfer restriction, expropriation, and war and civil disturbance.
this investment is part of a larger $1.2 billion Islamic financing package for ntS, holder of the registered brand “axis”. the company is a national GSM and 3G cellular service provider in Indonesia, offering wireless communi-cation services. the financing is aimed at increasing the quality on the existing network, increasing the population coverage, and building additional network capacity.
the portion of the financing that MIGa is insuring is a dual currency term “Murabaha” facility with Deutsche Bank luxembourg S.a. as political risk insurance agent acting on behalf of itself, SaBB, and other financial insti-tutions to be identified. the initial participants are SaBB and Deutsche Bank luxembourg S.a. the facility will be syndicated following the financial close. the facility may be taken out at a later stage in whole or part by a Sukuk capital markets issue for which the primary obligor will be ntS.
ntS contributes to the development of a competitive telecommunications industry in Indonesia by providing mobile telecommunication services, including the instal-lation, operation, and maintenance of a GSM network; wireless communication services; internet; and satellite services. ntS is focusing its growth on lower-income segments of the market, so the beneficiaries of these services will be lower income households and remote islands. the spread of mobile telecommunications has been shown to stimulate local entrepreneurship and provide significant employment opportunities.
this widespread availability of telecommunications networks also provides a platform for the private sector and the government to deliver important services to under-served communities throughout Indonesia.
this project will contribute to the objectives of the World Bank Group’s Country partnership Strategy for Indonesia by facilitating important private infrastructure investment in a sector, which promotes the growth of private sector enterprises. the project is also aligned with MIGa’s strategic priority of promoting South-South investment.
38 | MIGa annual report 2011
Indonesia
Project name: PT Weda Bay Nickel Project Exploration and Feasibility Studies
Guaranteeholder:StrandMinerals(Indonesia)Pte.Ltd.
on august 11, 2010, MIGa issued a guarantee of $207 million to Strand Minerals (Indonesia) pte. ltd. of Singapore for its equity investment in the pt Weda Bay nickel project. Strand Minerals is jointly owned by eramet S.a. of France and Mitsubishi Corporation of Japan. the coverage is for a period of up to three years against the risks of transfer restriction, expropriation, breach of contract, and war and civil disturbance.
During this period it is anticipated that approximately $230 million will be invested for the engineering and fea-sibility studies necessary to conclude a bankable feasibility study for the operation of a nickel-cobalt mine with a hydrometallurgical processing plant on Halmahera Island. once the studies are complete, an investment decision will be taken on whether to continue developing the mine and building a processing plant. It is anticipated that the final investment decision should be made before the end of 2012.
the core project will require large capital expenditure to develop the mine and the processing plant. In addition, in order for the mine to be commercially feasible, additional capital expenditure will have to be undertaken on the associated transportation infrastructure including roads, airport, and port.
the Weda Bay deposit is one of the largest undeveloped nickel projects with 5.1 million tons of nickel contained in measured, indicated, and inferred ore resources. Should this project be developed it will allow Indonesia to become one of the world’s major nickel producers. It will provide significant employment, both during construction and when in operation, major government revenues, and will contribute substantially to the local economy, in par-ticular to the north Maluku province. It will also provide an important demonstration of how a major natural resource project can bring benefits to the Indonesian people and be developed in a socially and environmentally sustainable way.
MIGa’s support for this investment is aligned with the World Bank Group’s Country partnership Strategy for Indonesia for 2009-2012, particularly with regard to making Indonesia’s private sector a driver in broad-based growth, and increasing the country’s competitiveness regionally and globally.
Pakistan
Project name: Habib Metropolitan Bank Limited
Guaranteeholder:HabibBankAGZurich
on June 24, 2011, MIGa issued a guarantee to Habib Bank aG Zurich (HBZ) of Switzerland covering its investment in its subsidiary, Habib Metropolitan Bank (HMB) in pakistan. the coverage is for 80 million Swiss Francs ($95.1 million equivalent) for a period of up to 20 years against the risks of transfer restriction and expropriation. this new coverage augments and replaces several MIGa guarantees issued to HBZ between fiscal years 2001-2008.
HMB is one of the 10 largest banks in pakistan. the bank was formed in 2006 as a result of a merger between the pakistani branches of HBZ and Metropolitan Bank limited, a local bank. HBZ currently holds 51 percent of the shares, with the remaining shares owned by local and foreign investors. MIGa’s additional coverage to HBZ, as well as the denomination of MIGa’s contract in Swiss Francs, will help HBZ meet its obligations to the Financial Markets Supervisory authority (FInMa), the Swiss banking regulator.
HMB plays a major role in offering financial services to pakistan’s population. It operates more than 120 branches in 19 cities throughout the country, including four full-service Islamic banking branches. Moreover, the bank’s network connectivity has been substantially upgraded, including a 17 percent increase in atM rollout across the country and various internal control process enhancements. Investment in human capital has also continued, bringing the total number of staff to nearly 2,700.
HBZ’s expansion and modernization continues to contribute to the strengthening of the local banking sector through the transfer of know-how, expertise, and technology as HMB’s policies, directives, and business practices are aligned with those of its parent company, which is subject to the supervisory authority of FInMa. the impact of this is to introduce international best practices to both HMB and to the local industry. Moreover, foreign presence in the banking sector is considered to play a positive role in strengthening the banking sector against systemic risk.
MIGa’s support is aligned with the World Bank Group’s strategy in pakistan’s financial sector, which aims at increasing competition and expanding access to financial services to different segments of the population. the sector still suffers from low banking penetration and limited access to finance, especially with respect to the provision of banking services to underserved segments, including small and medium enterprises, consumer and

MIGa annual report 2011 | 39
housing finance, microfinance, and rural finance. the project is also aligned with MIGa’s strategic priority of supporting investments into countries eligible for lending from the International Development association.
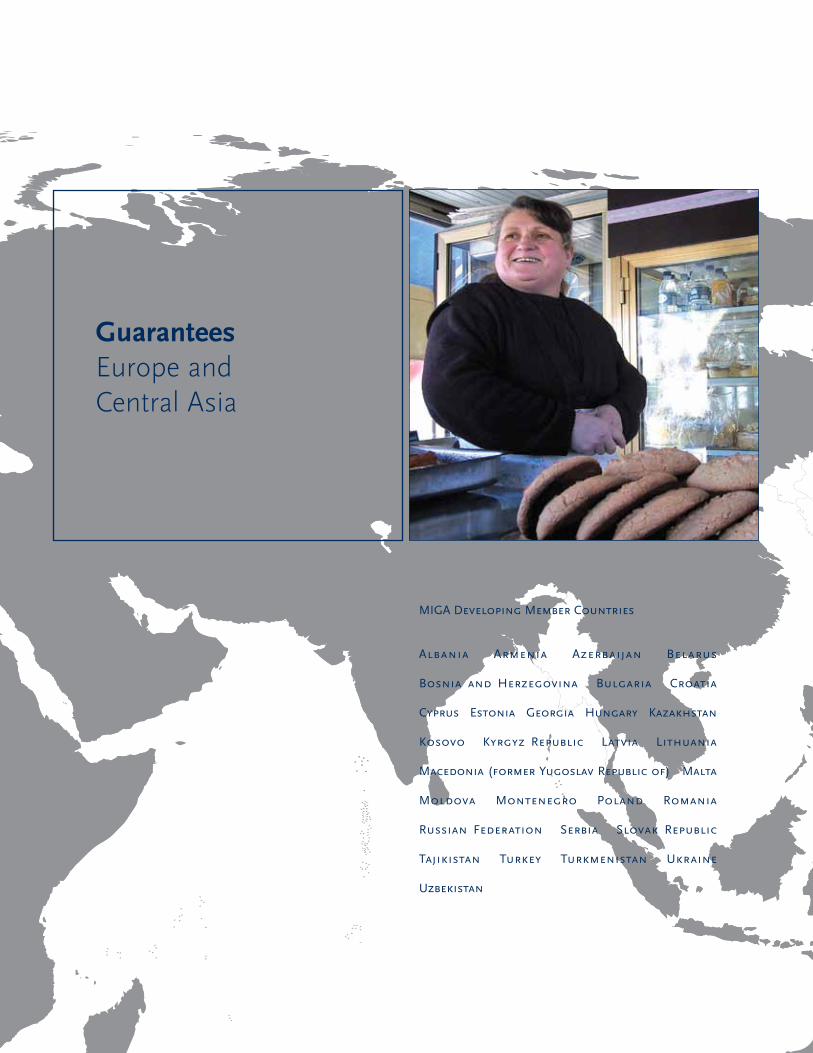
40 | MIGa annual report 2011
MIGADevelopingMemberCountries
Albania Armenia Azerbaijan Belarus
Bosnia and Herzegovina Bulgaria Croatia
CyprusEstoniaGeorgiaHungaryKazakhstan
Kosovo Kyrgyz Republic Latvia Lithuania
Macedonia(formerYugoslavRepublicof)Malta
Moldova Montenegro Poland Romania
Russian Federation Serbia Slovak Republic
Tajikistan Turkey Turkmenistan Ukraine
Uzbekistan
Guaranteeseurope and Central asia
MIGa annual report 2011 | 41
Severely affected by the financial crisis, most of europe and Central asia rebounded in 2010, with GDp growth estimated to have reached 5.2 percent, following a 6.4 percent decline in 2009, but still below pre-crisis growth levels. the recovery was mainly driven by merchandise exports, as well as official aid and fiscal stimulus packages in some cases. the recovery of domestic demand and imports, however, has been weak. this, in conjunction with structural imbalances (fiscal deficits, high unem-ployment, high household indebtedness, and banking sector restructuring), has contributed to slower growth and larger output gaps than other regions.
net private and official capital inflows, which had plummeted in 2009, increased by 47 percent in 2010 to an estimated $132.1 billion. net FDI inflows, which had almost halved in 2009, declined again in 2010 to an estimated $76.4 billion, but are projected to pick up and reach $107.1 billion in 2012, aided by renewed interest in privatization in a number of countries.
During fiscal year 2011, MIGa provided guarantees for 16 projects in this region. at year-end, MIGa’s gross guarantee exposure stood at $5.4 billion, or 60 percent of the agency’s total outstanding portfolio.
Albania
Project name: ProCredit Group Central Bank Mandatory Reserves Coverage
Guaranteeholder:ProCreditHolding
on December 22, 2010, MIGa issued a guarantee of $25 million to proCredit Holding (pCH) covering its investment in its subsidiary in albania. the coverage is for a period of up to 10 years against the risk of expropriation of funds for mandatory reserves held by the subsidiary in the central bank of its jurisdiction.
this project is part of a master contract that MIGa has issued. pCH is headquartered in Germany and is the parent company of 21 banks (proCredit group). the proCredit group is a provider of finance to some 750,000 very small, small, and medium enterprises in latin america, eastern and Central europe, and africa. throughout the world, banks are required to maintain mandatory reserves with the central banks of their respective jurisdictions. the proCredit group’s capital adequacy ratio (Car) is calculated according to the German Banking act. under this act, at a consolidated level, reserves deposited at the various central banks can attract a risk weighting of 100 or even 150 percent, depending on the country. this risk weighting determines the amount of equity required to maintain a specified Car in accordance with the German Banking act.
the guarantee issued by MIGa will help pCH obtain capital relief from the Car requirements. By obtaining MIGa’s insurance against the risk of expropriation of funds, the risk weighting for mandatory reserves held at the central bank can be reduced. a lower risk weighting will allow pCH to free up equity currently tied up for Car maintenance purposes, thereby allowing these funds to be injected into its subsidiary banks. this in turn will allow pCH’s emerging market subsidiary banks to increase their lending activities.
MIGa’s support will help pCH optimize its capital man-agement across its 21 banks, allowing pCH to direct equity to subsidiaries with the greatest need. these banks will be able to offer additional financial services to very small, small, and medium enterprises at a time of macro-economic challenges. Supporting productive small busi-nesses will help stimulate growth, generate employment, and reduce poverty.
MIGa’s support for this project is aligned with the World Bank Group’s microfinance strategy that includes improving the supply of microfinance in large, but under-served markets; enhancing deposit capacity by assisting microfinance institutions in savings mobilization; capacity building; creating and shaping markets; and fostering innovation.
Armenia
Project name: ProCredit Group Central Bank Mandatory Reserves Coverage
Guaranteeholder:ProCreditHolding
on December 22, 2010, MIGa issued a guarantee of $3.7 million to proCredit Holding (pCH) covering its investment in its subsidiary in armenia. the coverage is for a period of up to 10 years against the risk of expro-priation of funds for mandatory reserves held by the sub-sidiary in the central bank of its jurisdiction.
this project is part of a master contract that MIGa has issued. Please refer to project description for “Albania” above.
42 | MIGa annual report 2011
BosniaandHerzegovina
Project name: ProCredit Group Central Bank Mandatory Reserves Coverage
Guaranteeholder:ProCreditHolding
on December 22, 2010, MIGa issued a guarantee of $12.5 million to proCredit Holding (pCH) covering its investment in its subsidiary in Bosnia and Herzegovina. the coverage is for a period of up to 10 years against the risk of expropriation of funds for mandatory reserves held by the subsidiary in the central bank of its jurisdiction.
this project is part of a master contract that MIGa has issued. Please refer to project description for “Albania” above.
Georgia
Project name: ProCredit Group Central Bank Mandatory Reserves Coverage
Guaranteeholder:ProCreditHolding
on December 22, 2010, MIGa issued a guarantee of $9 million to proCredit Holding (pCH) covering its investment in its subsidiary in Georgia. the coverage is for a period of up to 10 years against the risk of expro-priation of funds for mandatory reserves held by the sub-sidiary in the central bank of its jurisdiction.
this project is part of a master contract that MIGa has issued. Please refer to project description for “Albania” above.
Hungary
Project name: UniCredit Bank Hungary Zrt.
Guaranteeholder:UniCreditBankAustriaAG
on September 30, 2010, MIGa issued a guarantee of $259.4 (e190) million to uniCredit Bank austria aG’s (uBa), covering its e200 million shareholder loan to its Hungarian subsidiary, uniCredit Bank Hungary Zrt. (uCBH). the guarantee is for a period of 10 years against the risks of transfer restriction, expropriation, and war and civil disturbance. this long-term shareholder loan is expected to serve a dual purpose: support the recovery and growth of corporate lending, and improve further uCBH’s long-term liquidity profile.
MIGa’s coverage for this loan falls under the framework of the Financial Sector Initiative, intended to support financial institutions’ cross-border investments into their emerging market subsidiaries, at a time when Hungary’s economy is recovering from economic shocks. Hungary, like many other countries in the europe and Central asia region, is currently facing difficult fiscal adjustments along with the need for external financing. this shareholder loan from uBa to uCBH will support an institution of systemic importance to the financial sector, while contributing to the growth of new lending in the economy.
the project will help increase the availability of credit for Hungary’s corporate, retail, and sub-national borrowers and help uCBH strengthen its structural liquidity profile, enabling uCBH to maintain a higher level of financial intermediation than it would have been able to otherwise accomplish. It will also help provide job opportunities in a consolidating sector and a soft labor market. Despite financial sector consolidation and cost-cutting, uCBH has continued to pursue an approach of strategic expansion, resulting in the opening of 19 new branches and the direct creation of resultant jobs.
Kosovo
Project name: ProCredit Group Central Bank Mandatory Reserves Coverage
GuaranteeHolder:ProCreditHolding
on December 22, 2010, MIGa issued a guarantee of $50 million to proCredit Holding (pCH) covering its investment in its subsidiary in the republic of Kosovo. the coverage is for a period of up to 10 years against the risk of expropriation of funds for mandatory reserves held by the subsidiary in the central bank of its jurisdiction.
this project is part of a master contract that MIGa has issued. Please refer to project description for “Albania” above.
FormerYugoslavRepublicofMacedonia
Project name: ProCredit Group Central Bank Mandatory Reserves Coverage
Guaranteeholder:ProCreditHolding
on December 22, 2010, MIGa issued a guarantee of $12.5 million to proCredit Holding (pCH) covering its investment in its subsidiary in the Former Yugoslav republic of Macedonia. the coverage is for a period of up
MIGa annual report 2011 | 43
to 10 years against the risk of expropriation of funds for mandatory reserves held by the subsidiary in the central bank of its jurisdiction.
this project is part of a master contract that MIGa has issued. Please refer to project description for “Albania” above.
Moldova
Project name: ProCredit Group Central Bank Mandatory Reserves Coverage
Guaranteeholder:ProCreditHolding
on December 22, 2010, MIGa issued a guarantee of $4.1 million to proCredit Holding (pCH) covering its investment in its subsidiary in Moldova. the coverage is for a period of up to 10 years against the risk of expro-priation of funds for mandatory reserves held by the sub-sidiary in the central bank of its jurisdiction.
this project is part of a master contract that MIGa has issued. Please refer to project description for “Albania” above.
Poland
Project name: Linxtelecom Warsaw Data Center
Guaranteeholders:LinxTelecommunicationsB.V.;ABNAmro
on november 22, 2010, MIGa issued a guarantee of e100,000 ($136,995) to linx telecommunications B.V. (linx) of the netherlands covering its equity investment in its subsidiary Warsaw DC Sp Zo.o. of poland. MIGa also issued a guarantee of e2.6 million ($3.5 million) for aBn amro’s non-shareholder loan to the project. the coverage is for up to six years against the risks of transfer restriction, expropriation, and war and civil disturbance.
this project consists of the establishment and operation of a data center in Warsaw that will provide state-of-the art data center and connectivity services primarily to interna-tional customers.
the project hopes to leverage shared infrastructure and data management in order to reach economies of scale—thereby stimulating growth of technology-intensive and knowledge-based industries in poland. Specifically, the project expects the following development results: improvement of information and communication tech-nology (ICt) infrastructure and access to information; a
lower cost of entry into the ICt market; increased compe-tition in the ICt market; rapidly expanding data/telecom networks; and local employment opportunities.
the World Bank Group’s Country partnership Strategy for poland for 2009-2013 notes a need for continued progress in developing the country’s knowledge economy. In fact, poland’s european union accession has driven the liberal-ization of the ICt sector, of which this project is a part.
the project was underwritten through MIGa’s Small Investment program.
RussianFederation
Project name: Linxtelecom Module 5 and Skytrade Data Centers
Guaranteeholders:LinxTelecommunicationsB.V.;ABNAmro
on november 22, 2010, MIGa issued a guarantee of e500,000 ($684,975) to linx telecommunications B.V. (linx) of the netherlands covering its shareholder loan to its subsidiary, linx llC Svyaz VSD of the russian Federation. MIGa also issued two guarantees for a total of e6.9 million ($9.5 million) covering aBn amro’s non-shareholder loans to the subsidiary. the coverage is for up to six years against the risks of transfer restriction, expro-priation, and war and civil disturbance.
this project consists of the construction and operation of a tier 3 data center in St. petersburg and operation of Module 5 of a data center in Moscow that will provide state-of-the art data center and connectivity services pri-marily to international customers.
the project hopes to leverage shared infrastructure and data management in order to reach economies of scale—thereby stimulating growth of technology-intensive and knowledge-based industries in russia. Specifically, the project expects the following development results: improvement of information and communication tech-nology (ICt) infrastructure and access to information; a lower cost of entry into the ICt market; increased com-petition in ICt market; rapidly expanding data/telecom networks; and local employment opportunities.
the World Bank Group’s current Country partnership Strategy for russia notes a need for increased private sector development and diversification of the economy—to which this project will contribute.
the project was underwritten through MIGa’s Small Investment program.
44 | MIGa annual report 2011
Serbia
Project name: ProCredit Group Central Bank Mandatory Reserves Coverage
Guaranteeholder:ProCreditHolding
on December 22, 2010, MIGa issued a guarantee of $4.4 million to proCredit Holding (pCH) covering its investment in its subsidiary in Serbia. the coverage is for a period of up to 10 years against the risk of expropriation of funds for mandatory reserves held by the subsidiary in the central bank of its jurisdiction.
this project is part of a master contract that MIGa has issued. Please refer to project description for “Albania” above.
Serbia
Project name: Mercator – S Serbia
Guaranteeholder:SlovenskaIzvoznainRazvojnaBanka,d.d.,Ljubljana(SIDBank,Inc.Ljubljana)
on June 29, 2011, MIGa issued a guarantee to reinsure SID Bank, Inc. ljubljana’s coverage to the Mercator retail group (Mercator) in Serbia. MIGa’s reinsurance for the investment results in a gross exposure of $247.9 million. MIGa’s reinsurance is for a period of up to two years, against the risks of transfer restriction, expropriation, and war and civil disturbance.
MIGa’s support to SID Bank, Inc., ljubljana is in accordance with MIGa’s mandate to cooperate with national entities of its member countries, as stated in MIGa’s Convention. By providing facultative reinsurance, MIGa is allowing SID Bank, Inc.; ljubljana to reduce its net exposure to Mercator and to free up capacity for other investment insurance projects.
Mercator is helping to stimulate exports among Balkan countries by carrying goods from the other countries in each of its retail locations. as a result, Mercator is expanding the venue for suppliers to sell not only in their respective countries, but also in neighboring countries where Mercator has an established presence. In addition, Mercator’s further expansion in the Balkans, supported by SID Bank, Inc. ljubljana and MIGa, will provide employment and retail training opportunities in these countries.
MIGa is also helping to establish best practices with respect to corporate governance as well as environmental and social policies in the host countries.
Turkey
Project name: Bandirma Port
GuaranteeHolder:TroyAB
on october 6, 2010, MIGa issued a guarantee of $522,000 to cover troy aB of Sweden’s equity investment in the privatization of Bandirma port in turkey under a 36-year transfer-of-operating-rights scheme. MIGa’s guarantee covers against the risks of currency inconvert-ibility and transfer restriction, as well as expropriation of funds, for a period of 14 years.
Following a competitive tender, Celebi Joint Venture Group was named the preferred bidder in May 2008, offering an up-front operating rights fee of $175.5 million.
the project represents an ongoing process of privatization started by the government of turkey in the early 1980s. It aims to introduce openness and competitiveness into the country, increase efficiency in former state-owned enter-prises and promote economic growth.
the privatization of Bandirma port will introduce a new and experienced management team and best market practices that will improve the productivity and efficiency of the port. In turn, this will strengthen the competi-tiveness of local exporters by decreasing transportation costs. In particular, better port operations will further stimulate the growth of the region’s automotive manufac-turing industry as a hub for Central and eastern europe. the local economy will also benefit from improved con-nectivity to international markets, a key infrastructure requirement to attract foreign direct investment. Finally, the new operators of the port will introduce higher standards of operation, including environmental and safety rules in line with national and european union guidelines.
the project is also aligned with the World Bank Group’s Country partnership Strategy for turkey. Improving trans-portation infrastructure is a key component of the World Bank Group’s focus on helping turkey improve its com-petitiveness and employment opportunities.
Turkey
Project name: Otogar-Bagcılar-Ikitelli-Olimpic Village Metro Project
GuaranteeHolder:WestLB,IstanbulBranch
on December 27, 2010, MIGa issued a guarantee of $19.6 million to cover an investment by WestlB of Germany in the otogar-Bagcılar-Ikitelli-olimpic Village Metro
˘
˘
MIGa annual report 2011 | 45
project in turkey. MIGa’s guarantee is for a period of up to three years against the risk of non-honoring of sov-ereign financial obligations. It covers a guarantee by the Metropolitan Municipality of Istanbul (MMI) on a loan amount of up to $21 million that WestlB aG’s branch office in Istanbul (WestlB, Istanbul Branch) has extended to Istanbul electricity, tram and tunnel, a general direc-torate of MMI, which is financing the expansion of the project.
the project consists of two parts. the first section of the project, “otogar-Kirazlı lrt”, will extend the existing light rail transit from the otogar (intercity bus terminal) to densely developed residential areas in Bagcılar and Kirazlı. the second phase of the project, “Kirazlı-Ikitelli-Basak Konut/olimpic Village Metro” will create a new metro line that will connect the Ikitelli organized Industrial area and the new residential areas developed at Ikitelli to the rail network of Istanbul.
Section one, otogar-Kirazlı lrt, which consists of a double-track system of 5,510 meters to serve five stations, is the western extension of the existing lrt track operating between aksaray and the International airport. Section two, Kirazlı-Ikitelli-Basak Konut/olimpic Village Metro, which consists of a double track system of 15,834 meters to serve 11 stations, will be the western extension of the metro track planned to operate between Yenikapı and Kirazlı.
By extending coverage of the metro system to the suburban and light manufacturing areas to the west, the project will help improve urban mobility, and reduce travel times and traffic, thereby contributing to urban productivity and private sector-led growth. In addition, the expansion of public transportation in the city will reduce dependence on roads and motorways, which will help reduce the growth of transport-related greenhouse gases and, through the reduction in pollution, help make Istanbul a more attractive business location.
the project is also aligned with the World Bank Group’s Country partnership Strategy for turkey. Improving trans-portation infrastructure is a key component of the Bank Group’s focus on helping turkey improve its competi-tiveness and employment opportunities.
Turkey
Project name: Kadikoy-Kartal-Kaynarca Metro Project
GuaranteeHolder:WestLBAG,LondonBranch
on april 21, 2011, MIGa issued a guarantee of $409.2 million for an investment by WestlB aG, london Branch,
for itself and as agent for a consortium of lenders, in the Kadikoy-Kartal-Kaynarca Metro project in Istanbul, turkey. MIGa’s guarantee covers principal and interest for a period of up to nine and a half years against the risk of non-honoring of sovereign financial obligations.
the project will be the first underground metro system on the asian side of Istanbul. It will also eventually connect with the european side of city. the first phase of the project involves finishing the construction of 22 kilometers of the line from Kadikoy to Kartal, which includes 16 metro stations. the second phase consists of extending the metro line by 4.5 kilometers from Kartal to Kaynarca, the construction of a parking and maintenance area, and the construction of pedestrian subways.
By extending coverage of Istanbul’s metro system, the project will help improve urban mobility, and reduce travel times and traffic—thereby contributing to increased pro-ductivity and private sector-led growth. In addition, the expansion of public transportation in the city will reduce dependence on roads and motorways. this will help reduce pollution and help make Istanbul a more attractive location for residents and business.
the project is aligned with the World Bank Group’s Country partnership Strategy for turkey. Improving trans-portation infrastructure is a key component of the Bank Group’s focus on helping turkey improve its competi-tiveness and employment opportunities.
Ukraine
Project name: ProCredit Group Central Bank Mandatory Reserves Coveragee
GuaranteeHolder:ProCreditHolding
on December 22, 2010, MIGa issued a guarantee of $5.6 million to proCredit Holding (pCH) covering its investment in its subsidiary in ukraine. the coverage is for a period of up to 10 years against the risk of expropriation of funds for mandatory reserves held by the subsidiary in the central bank of its jurisdiction.
this project is part of a master contract that MIGa has issued. Please refer to project description for “Albania” above.
˘,
,

46 | MIGa annual report 2011
MIGADevelopingMemberCountries
AntiguaandBarbudaArgentinaBahamas(The)
Barbados Belize Bolivia Br azil
Chile Colombia Costa Rica Dominica
Dominican Republic Ecuador El Salvador
GrenadaGuatemalaGuyanaHaitiHonduras
JamaicaMexicoNicaraguaPanamaParaguay
Peru St. Kitts and Nevis St. Lucia
S t . V i n c e n t a n d T h e G r e n a d i n e s
Suriname Trinidad and Tobago Uruguay
Venezuela(RepúblicaBolivarianade)
Guaranteeslatin america and the Caribbean
MIGa annual report 2011 | 47
With GDp growth rebounding to an estimated 6 percent in 2010, having contracted by 2.1 percent in 2009, latin america and the Caribbean have weathered the financial crisis well, for the most part reflecting sound macro-economic fundamentals prior to the crisis. In particular, most countries took advantage of higher commodity prices preceding the crisis to reduce their external vul-nerabilities through a reduction of external debt and an increase of international reserves. Furthermore, stronger fiscal balances left room for countercyclical fiscal easing. During the crisis, countries with close links to the u.S. economy were more vulnerable, due to either reductions in remittances or reductions in the trade account.
Concerns going forward relate to inflationary pressures and appreciating exchange rates in light of the strong rebound in both growth and capital flows, as well as rising commodity and food prices. GDp growth is expected to moderate to 4.5 percent over 2011 and to 4.1 percent in 2012 as monetary policy tightens.
net private and official flows recovered too, increasing by 44 percent in 2010 to an estimated $240.4 billion. net FDI inflows also jumped to $115.9 billion, having declined by 42 percent in 2009. they are projected to increase in both 2011 and 2012 and to reach $132.3 billion in the latter.
During the fiscal year, MIGa provided guarantees for three projects in the region. at year-end, MIGa’s gross guarantee exposure stood at $1.0 billion, equivalent to 11 percent of the agency’s outstanding portfolio.
Colombia
Project name: ProCredit Group Central Bank Mandatory Reserves Coverage
Guaranteeholder:ProCreditHolding
on December 22, 2010, MIGa issued a guarantee of $2.6 million to proCredit Holding (pCH) covering its investment in its subsidiary in Colombia. the coverage is for a period of up to 10 years against the risk of expro-priation of funds for mandatory reserves held by the sub-sidiary in the central bank of its jurisdiction.
this project is part of a master contract that MIGa has issued. pCH is headquartered in Germany and is the parent company of 21 banks (proCredit group). the proCredit group is a provider of finance to some 750,000 very small, small, and medium enterprises in latin america, eastern and Central europe, and africa. throughout the world, banks are required to maintain mandatory reserves with the central banks of their respective jurisdictions. the proCredit group’s capital
adequacy ratio (Car) is calculated according to the German Banking act. under this act, at a consolidated level, reserves deposited at the various central banks can attract a risk weighting of 100 or even 150 percent, depending on the country. this risk weighting determines the amount of equity required to maintain a specified Car in accordance with the German Banking act.
the guarantee issued by MIGa will help pCH obtain capital relief from the Car requirements. By obtaining MIGa’s insurance against the risk of expropriation of funds, the risk weighting for mandatory reserves held at the central bank can be reduced. a lower risk weighting will allow pCH to free up equity currently tied up for Car maintenance purposes, thereby allowing these funds to be injected into its subsidiary banks. this in turn will allow pCH’s emerging market subsidiary banks to increase their lending activities.
MIGa’s support will help pCH optimize its capital man-agement across its 21 banks, allowing pCH to direct equity to subsidiaries with the greatest need. these banks will be able to offer additional financial services to very small, small, and medium enterprises at a time of macro-economic challenges. Supporting productive small busi-nesses will help stimulate growth, generate employment, and reduce poverty.
MIGa’s support for this project is aligned with the World Bank Group’s microfinance strategy that includes improving the supply of microfinance in large, but under-served markets; enhancing deposit capacity by assisting microfinance institutions in savings mobilization; capacity building; creating and shaping markets; and fostering innovation.
Honduras
Project name: ProCredit Group Central Bank Mandatory Reserves Coverage
Guaranteeholder:ProCreditHolding
on December 22, 2010, MIGa issued a guarantee of $6.2 million to proCredit Holding (pCH) covering its investment in its subsidiary in Honduras. the coverage is for a period of up to 10 years against the risk of expro-priation of funds for mandatory reserves held by the sub-sidiary in the central bank of its jurisdiction.
this project is part of a master contract that MIGa has issued. Please refer to project description for “Colombia” above.
48 | MIGa annual report 2011
Nicaragua
Project name: ProCredit Group Central Bank Mandatory Reserves Coverage
Guaranteeholder:ProCreditHolding
on December 22, 2010, MIGa issued a guarantee of $12.9 million to proCredit Holding (pCH) covering its investment in its subsidiary in nicaragua. the coverage is for a period of up to 10 years against the risk of expro-priation of funds for mandatory reserves held by the sub-sidiary in the central bank of its jurisdiction.
this project is part of a master contract that MIGa has issued. Please refer to project description for “Colombia” above.
MIGa annual report 2011 | 49
MIGADevelopingMemberCountries
A l g e r i a B a h r a i n D j i b o u t i
Egypt (Arab Republic of) Iran (Islamic
Republic of) Iraq Israel Jordan Kuwait
Lebanon Libya Morocco Oman Qatar
Saudi Arabia Syrian Arab Republic Tunisia
UnitedArabEmiratesYemen(Republicof)
GuaranteesMiddle east and north africa
50 | MIGa annual report 2011
the Middle east and north africa grew by an estimated 3.1 percent in 2010, marginally higher than the 2.8 percent GDp growth registered in 2009. the financial crisis had a much smaller impact on economic growth owing to the region’s limited global financial integration. Increased oil prices contributed to growth in oil-exporting countries. the recent political turmoil in the region, however, is expected to lead to a slippage in projected growth in 2011 to 1.9 percent, but a rebound to 3.5 percent is expected in 2012.
Compared with 2009, net private and official capital flows into the Middle east and north africa remained steady in 2010 at $28 billion. net FDI inflows are estimated to have declined in 2010 by 18 percent to $20.1 billion, and are projected to decline further in light of recent political turmoil to $10.7 billion in 2011, but rebound to $17.4 billion in 2012.
MIGa provided guarantees for one project in the region. at year-end, MIGa’s gross guarantee exposure stood at $415.8 billion, equivalent to 5 percent of the agency’s out-standing portfolio.
Iraq
Project name: Sebeel Al Safa Manufacturing Petrochemicals and Water Filling Company
Guaranteeholder:KaroDisTicaretveSanayiLtd.Sti.
on September 23, 2010, MIGa issued a guarantee of $5 million to Karo Dis ticaret ve Sanayi ltd. Sti. of turkey covering their shareholder loan to the Sebeel al Safa Manufacturing petrochemicals and Water Filling Company in Iraq. the coverage is for a period of five years against the risks of transfer restriction, expropriation, and war and civil disturbance.
the project involves the establishment of a manufac-turing plant in the Baghdad area to produce polyethylene terephthalate (pet) preforms. pet preforms are the raw material used to manufacture bottles for the beverage industry. the first machine will produce preforms for half-liter water bottles. the general demand in Iraq for preforms is estimated to be more than six billion annually for different bottle sizes. Currently, nearly all of pet preforms are imported from neighboring countries.
this project will have a positive and significant devel-opment impact for Iraq. the economy is currently heavily dependent on the oil and gas extractive sectors and the government is making efforts to diversify, including through attracting foreign direct investment into other sectors. this South-South investment can provide an
important signal to other potential investors into Iraq and into Baghdad specifically. the project will demonstrate the available returns from supplying the large and growing domestic market in Iraq, and help aid the continued progress towards stability and economic growth. the factory will provide employment for 46 staff, almost all of whom will be recruited locally.
the project is aligned with the World Bank Group’s Interim Strategy note for Iraq, which includes supporting policies and institutions that promote broad-based, private-sector-led growth with the goal of revitalizing the private sector and facilitating job creation. It is also aligned with MIGa’s commitment to supporting South-South investments as well as investments in conflict-affected countries. the project was underwritten through MIGa’s Small Investment program.
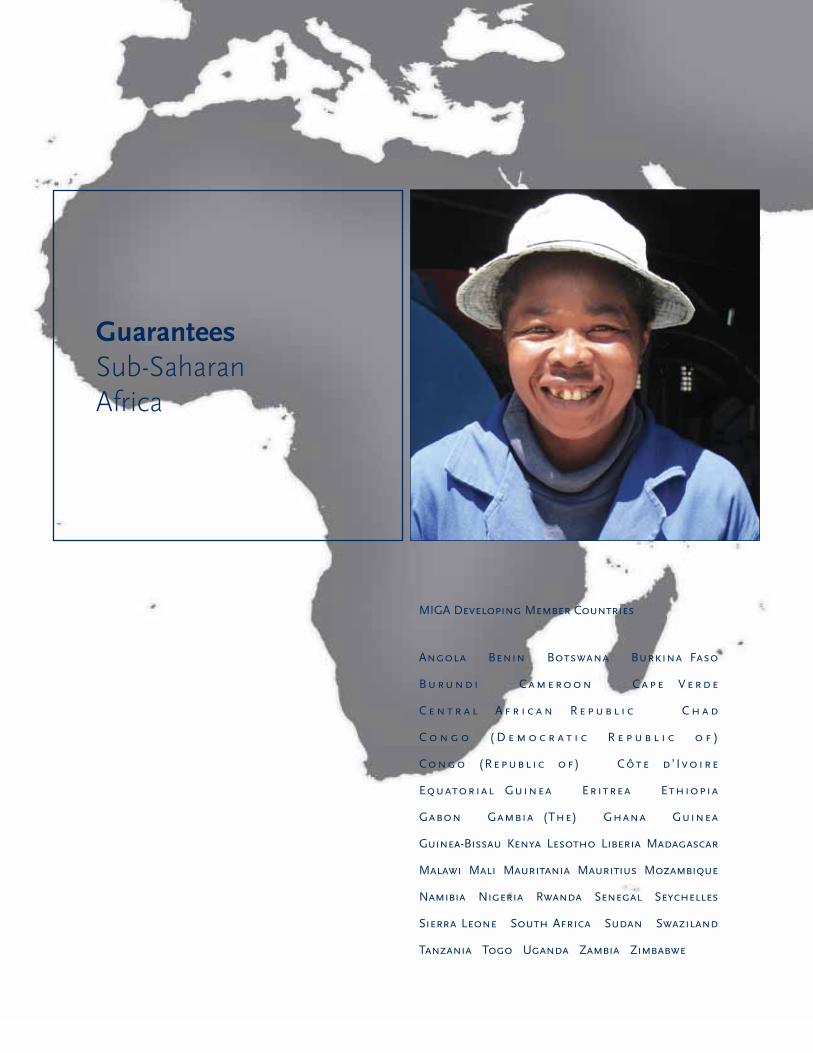
MIGa annual report 2011 | 51
MIGADevelopingMemberCountries
Angola Benin Botswana Burkina Faso
B u r u n d i C a m e r o o n C a p e V e r d e
C e n t r a l A f r i c a n R e p u b l i c C h a d
C o n g o ( D e m o c r a t i c R e p u b l i c o f )
Congo (Republic of) Côte d ’ Ivoire
Equatorial Guinea Eritrea Ethiopia
Gabon Gambia (The) Ghana Guinea
Guinea-BissauKenyaLesothoLiberiaMadagascar
MalawiMaliMauritaniaMauritiusMozambique
NamibiaNigeriaRwandaSenegalSeychelles
SierraLeone SouthAfrica Sudan Swaziland
TanzaniaTogoUgandaZambiaZimbabwe
GuaranteesSub-Saharan africa
52 | MIGa annual report 2011
Having declined to 2 percent in 2009, the GDp growth rate of sub-Saharan africa rebounded in 2010 to an estimated 4.8 percent and is projected to accelerate to 5.1 percent in 2011 and 5.7 percent in 2012. the main drivers have been the recovery of the global economy, supported by growth in domestic demand, oil price increases for the oil-exporting countries, and public expenditures to improve infrastructure in selected countries.
net private and official flows rebounded in 2010 by 13 percent to an estimated $51.1 billion. net FDI inflows declined in 2010 by 21 percent to an estimated $23.8 billion, but they are projected to increase during 2011 and 2012 and reach $35.2 billion in the latter.
MIGa provided guarantees for 15 projects in the region. at year-end, MIGa’s gross guarantee exposure stood at $1.1 billion, equivalent to 12 percent of the agency’s out-standing portfolio.
DemocraticRepublicofCongo
Project name: ProCredit group Central Bank Mandatory Reserves Coverage
Guaranteeholder:ProCreditHolding
on December 22, 2010, MIGa issued a guarantee of $5 million to proCredit Holding (pCH) covering its investment in its subsidiary in the Democratic republic of Congo. the coverage is for a period of up to 10 years against the risk of expropriation of funds for mandatory reserves held by the subsidiary in the central bank of its jurisdiction.
this project is part of a master contract that MIGa has issued. pCH is headquartered in Germany and is the parent company of 21 banks (proCredit group). the proCredit group is a provider of finance to some 750,000 very small, small, and medium enterprises in latin america, eastern and Central europe, and africa. throughout the world, banks are required to maintain mandatory reserves with the central banks of their respective jurisdictions. the proCredit group’s capital adequacy ratio (Car) is calculated according to the German Banking act. under this act, at a con-solidated level, reserves deposited at the various central banks can attract a risk weighting of 100 or even 150 percent, depending on the country. this risk weighting determines the amount of equity required to maintain a specified Car in accordance with the German Banking act.
the guarantee issued by MIGa will help pCH obtain capital relief from the Car requirements. By obtaining MIGa’s insurance against the risk of expropriation of
funds, the risk weighting for mandatory reserves held at the central bank can be reduced. a lower risk weighting will allow pCH to free up equity currently tied up for Car maintenance purposes, thereby allowing these funds to be injected into its subsidiary banks. this in turn will allow pCH’s emerging market subsidiary banks to increase their lending activities.
MIGa’s support will help pCH optimize its capital man-agement across its 21 banks, allowing pCH to direct equity to subsidiaries with the greatest need. these banks will be able to offer additional financial services to very small, small, and medium enterprises at a time of macro-economic challenges. Supporting productive small busi-nesses will help stimulate growth, generate employment, and reduce poverty.
MIGa’s support for this project is aligned with the World Bank Group’s microfinance strategy that includes improving the supply of microfinance in large, but under-served markets; enhancing deposit capacity by assisting microfinance institutions in savings mobilization; capacity building; creating and shaping markets; and fos-tering innovation.
RepublicofCongo
Project name: Cotecna Inspection Congo S.A.R.L.
Guaranteeholder:CotecnaInspectionS.A.
on June 30, 2011, MIGa issued a guarantee of $5.6 million covering an investment by Cotecna Inspection S.a. of Switzerland, as sole shareholder, in Cotecna Inspection Congo S.a.r.l located in the republic of Congo. the coverage is for a period of three years against the risks of transfer restriction, expropriation, war and civil disturbance, and breach of contract.
the project involves the provision of import verification services to importers on behalf of the government of Congo under a build, operate, and transfer concession between Cotecna Inspection S.a. and the government. the service contract involves the supply, installation, and operation of an X-ray scanner and Cotecna’s Computerized risk Management System, as well as the overall management of the import verification system for goods entering Congo through the port of pointe noire.
the project will contribute to trade facilitation, as well as the development of the private sector, by speeding up the customs clearance of goods needed by the industrial and service sectors in Congo. In addition, it will help the government secure revenues through the elimination of opportunities for fraud and fiscal evasion due to the transparent audit trail provided by scanning
MIGa annual report 2011 | 53
data. Security at the port will also be strengthened by ensuring that containerized goods are not illegal.
this project is aligned with MIGa’s strategic priorities of supporting investments into countries eligible for assistance from the International Development association as well as countries affected by conflict. It is also the first MIGa-supported project in republic of Congo.
Ethiopia
Project name: National Cement Share Company
Guaranteeholder:SGIEthiopiaCementLimited
on June 30, 2011, MIGa issued a guarantee covering an equity investment by Schulze Global Investments (SGI) into the national Cement Share Company of ethiopia. the project is being implemented by SGI ethiopia Cement limited, an intermediary company incorporated in the British Virgin Islands. MIGa’s guarantee of $4 million provides coverage for a period of up to 15 years against the risks of transfer restriction, expropriation, and war and civil disturbance.
SGI has invested into national Cement Share Company (nCSC) for a minority equity stake in the company. nCSC currently operates a 500 ton-per-day (tpd) clinker plant in Dire Dawa. nCSC recently began construction of a new 3,000 tpd clinker plant. the new plant is also located in Dire Dawa, near the existing plant. In order to accelerate the construction of the new plant, nCSC engaged SGI for a round of equity financing.
the expansion of the plant is expected to result in addi-tional significant tax revenue to the government and the creation of up to 600 new local jobs directly, and potentially an additional 2,500 indirect jobs. It will also provide an increased supply of domestic cement to meet the growing demand in ethiopia—reducing the country’s reliance on expensive imports and reducing the drain on foreign exchange reserves.
MIGa’s support for this investment is consistent with the first pillar of the World Bank Group’s Country assistance Strategy for ethiopia for 2008-2011, which focuses on fos-tering economic growth in order to sustain the emerging economic “take-off”. the project is also aligned with MIGa’s commitment to supporting more investments in IDa-eligible (the world’s poorest) countries.
Kenya
Project name: Resolution Health East Africa Limited
Guaranteeholder:ADCFinancialServicesandCorporateDevelopment
on June 8, 2011, MIGa issued a guarantee covering an equity investment by aDC Financial Services and Corporate Development (aDC) of Mauritius in resolution Health east africa limited (rHeal) in Kenya. MIGa’s coverage of $2.0 million is for a period of up to 10 years against the risks of transfer restriction, expropriation, and war and civil disturbance.
aDC is planning to take a 39.4 percent equity stake in rHeal, an existing Kenyan Health Insurance provider. aDC’s investment is aimed at improving the per-formance of the company through the introduction of new sales techniques and products; international best practice in processing and management; improved procurement and supplier management; and improved financial controls and corporate governance. the medical insurance sector in Kenya and other east african economies offers attractive growth opportu-nities. aDC’s investment will help rHeal achieve its growth objectives in the region.
aDC’s investment in rHeal will allow the company to expand its delivery of medical insurance both in Kenya and tanzania, as well as other east african countries in the future. rHeal structures medical insurance packages that offer insurance for pre-existing conditions such as HIV/aIDS. additionally, rHeal offers access to quality healthcare through offering affordable medical insurance.
this project is aligned with the World Bank Group’s Country partnership Strategy for Kenya. the Bank Group has committed to working together to increase access to financial services, further regulatory reform, and develop capital and local securities markets, with a goal of sup-porting key economic and social development needs, including infrastructure and housing development, and investments for pension and insurance funds. the project is also aligned with MIGa’s objective of sup-porting investments into countries eligible for conces-sional lending from the International Development association. the project was underwritten through MIGa’s Small Investment program.
54 | MIGa annual report 2011
Liberia
Project name: Buchanan Renewables Fuel Inc.
Guaranteeholder:VattenfallAB
on December 28, 2010, MIGa issued guarantees totaling $142.2 million to Vattenfall aB of Sweden covering its investment in Buchanan renewables Fuel Inc. in liberia. the guarantees are for a period of 15 years and provide coverage against the risks of expropriation and war and civil disturbance.
Buchanan renewables Fuel Inc. (BrF) is a liberian biomass cultivator that collects and processes non-productive rubber trees for export to Vattenfall’s power plants in europe. Vattenfall’s investment will result in an expansion of the current operation from 500,000 tons of biomass per annum to 2 million tons.
Vattenfall’s investment will bring experience and tech-nology to liberia’s most important industry. the rubber industry employs over 40,000 liberians directly, plus an additional 5,000 in related industries. rubber sales currently constitute 90 percent of the country’s export revenues. as a labor-intensive industry in which liberia has proven its global competitiveness, rubber is liberia’s best available option for generating wide-scale sustainable employment and poverty alleviation.
Vattenfall’s investment will help develop a sustainable biomass source from unproductive trees (an agricultural waste product), as well as help liberia rehabilitate its rubber industry. even though rubber plantations con-tinued to operate during the war, there was limited replanting and the inventory is old. an estimated 60-75 percent of rubber trees have been slaughter-tapped and/or left to ruin during 15 years of civil conflict. this backlog amounts to nearly 60 million tons of biomass that can be harvested and exported. this project will help farmers by removing unproductive trees that provide no income and accelerate the farm-rejuvenation cycle. It also turns a liability into an asset for the farmers because they are compensated for the biomass.
MIGa’s guarantee is aligned with the World Bank Group’s strategy of improving liberia’s agriculture and natural resources management in ways that generate pro-poor growth. It is also aligned with MIGa’s commitment to supporting investments in the world’s poorest countries, as well as countries affected by conflict.
Mozambique
Project name: ProCredit group Central Bank Mandatory Reserves Coverage
Guaranteeholder:ProCreditHolding
on December 22, 2010, MIGa issued a guarantee of $2.5 million to proCredit Holding (pCH) covering its investment in its subsidiary in Mozambique. the coverage is for a period of up to 10 years against the risk of expro-priation of funds for mandatory reserves held by the sub-sidiary in the central bank of its jurisdiction.
this project is part of a master contract that MIGa has issued. Please refer to project description for “Democratic Republic of Congo” above.
Mozambique
Project name: Sojitz Maputo Cellulose Limitada
Guaranteeholder:SojitzCorporation
on april 14, 2011, MIGa issued a guarantee covering an investment by Sojitz Corporation of Japan in Sojitz Maputo Cellulose limitada in Mozambique (SoMaCel). two additional guarantees were issued on June 15, 2011. the total coverage is for $9.1 million for a period of up to 10 years against the risks of transfer restriction, expro-priation, and war and civil disturbance.
the project consists of the development of a greenfield wood-chipping operation. the facility will be located on the territory of the Maputo port and the raw material will be sourced from eucalyptus plantations in the northeast region of South africa and from the northern region of Swaziland. SoMaCel is expected to process and export wood chips. the output will be sold to a paper manu-facturer in Japan.
the project is expected to generate local jobs and annual tax revenues for the government of Mozambique. this project is aligned with the third pillar of Mozambique’s development strategy, which includes job creation and integrating the country into the international economy.
the project is also aligned with MIGa’s operational priority to support investments into countries eligible for concessional lending from the International Development association. the project was underwritten through MIGa’s Small Investment program.
MIGa annual report 2011 | 55
Rwanda
Project name: KivuWatt Ltd.
Guaranteeholder:KivuWattHoldings
on May 4, 2011, MIGa issued a guarantee of $28.6 million to KivuWatt Holdings of Mauritius for its equity investment in KivuWatt ltd. in rwanda. the coverage is for a period of up to 20 years against the risks of expro-priation, transfer restriction, war and civil disturbance, and breach of contract.
the investment is for the construction and operation of a 25 megawatt power-generation facility using methane gas extracted from lake Kivu. the entire project (phase 1 and phase 2) involves extraction and separation of methane gas from the bottom of lake Kivu and up to 100 megawatts of power-generation capacity to be implemented in two phases. the phase 1 pilot project will involve gas extraction using a floating barge located approximately 13 kilometers offshore from the city of Kibuye. the extracted gas will be further processed and pumped to the shore for use in a power plant via sub-merged floating pipeline. power will be produced by methane powered reciprocating engine generator sets with combined capacity of 25 megawatts, net output. Based on successful implementation of phase 1, phase 2 will comprise three additional gas extraction barges and three more power production blocks with 75 megawatt capacity resulting in 100 megawatts of overall power gen-eration.
the output will be sold to the rwandan state-owned utility, rwanda electricity Corporation (reCo), formerly known as electrogaz. phase 1 output will be connected to the national grid via a new dedicated 11 kV transmission line installed by reCo. phase 2 will be connected to the existing 220 kV transmission system via two new trans-formers to be installed by reCo.
over the last decade, rwanda’s economy has nearly doubled in size, growing at an average rate of 7 percent per year. nevertheless, the country’s electricity infra-structure (the generation, transmission, and distribution network) has failed to develop in pace with the broader economy. rwanda’s total installed power generation capacity is 55 megawatts and only 6 percent of the popu-lation is serviced by the national power grid. to keep up with demand, expensive diesel power generators have been rented and brought online, raising the power tariff per kilowatt hour to twenty-one cents, one of the highest in africa.
the project’s primary development impact will be the generation of additional electricity capacity produced at a significantly lower cost than alternatives currently in the local market. tapping the considerable methane reserves
stored in lake Kivu will offer the small, highly populated, and land-locked country with a secure, domestic, cheap, and renewable source of power supply. the project is being developed in conjunction with a $400 million ini-tiative (supported by rwanda and international donors) to simultaneously expand and overhaul rwanda’s power transmission and distribution network.
one of the main objectives of the World Bank’s Country assistance Strategy for rwanda for 2009-2012 is to improve access to and quality of key infrastructure services. the project is fully consistent with this objective and is also aligned with MIGa’s strategic priority of sup-porting investments into IDa-eligible (the world’s poorest) countries and investments in complex infrastructure projects.
SierraLeone
Project name: Afrigas (SL) Limited
Guaranteeholder:GeogasTradingS.A.
on September 17, 2010, MIGa issued guarantees totaling $3.6 million to Geogas trading S.a. of Switzerland covering its investment in a liquefied petroleum gas (lpG) storage and distribution project in Sierra leone. the coverage is for a period five years against the risks of transfer restriction, expropriation, and war and civil disturbance.
the aim of the project is to introduce permanent lpG bulk storage facilities to supply the local market with lpG. the lpG would be used primarily for cooking, but could also be used for industrial practices such as welding and cooling. In addition to constructing the storage facilities, the project will establish four filling stations for five-kilogram lpG gas bottles.
the project will establish the first permanent lpG storage facility in Sierra leone and is expected to result in a price reduction of 60 percent for lpG. lpG offers several advantages over traditional biomass fuels, such as wood and charcoal, including the reduction of defor-estation and fewer respiratory illnesses resulting from indoor pollution. It can also improve productivity, partic-ularly for women, by reducing the amount of time spent gathering firewood. lpG can also be used in microen-terprises such as food preparation and processing and metal works.
MIGa’s support for this investment is aligned with the World Bank Group’s Country partnership Strategy for Sierra leone, particularly with regard to supporting the development of a competitive private sector.
56 | MIGa annual report 2011
MIGa’s participation in the project is also aligned with key agency priorities, which include encouraging investment in post-conflict and IDa-eligible countries. the guarantees were underwritten through MIGa’s Small Investment program.
SouthAfrica
Project name: Bon View Trading 92 (Proprietary) Limited
Guaranteeholder:MKVHoldings,LLC
on May 27, 2011, MIGa issued guarantees totaling $10 million covering an equity investment and shareholder loan from MKV Holdings, llC of Mauritius to Bon View trading 92 (proprietary) limited in South africa. Bon View intends to engage in the manufacturing and export of wine and related products through the acquisition of the assets of an existing winery. the coverage is for a period of up to 10 years against the risks of transfer restriction, expropriation, and war and civil disturbance.
the project involves an investment in MKV’s wholly owned subsidiary, Bon View, for the purposes of acquiring the assets of the Mulderbosch winery, which consists of inventory, winemaking equipment, brand, and the Kanu winery building and farms located in Stellenbosch, Western Cape. the sponsors intend to invest in wine-making equipment to upgrade the existing winery and employ more rigorous viticulture.
the Stellenbosch region’s main economic sectors comprise agriculture (vineyards and soft fruit), tourism, and the services industry. Despite continuing economic growth, there remains a great deal of unemployment, especially within the lower income groups in the Stellenbosch/Somerset West region. the project will have a significant socioeconomic benefit to the area through the creation of temporary jobs during the construction phase and permanent jobs in the operational phase. Staff will receive specialized training to build on their existing skills. the project will generate rates and taxes for the Stellenbosch Municipality, and will contribute to increased tourism in the area.
MIGa’s support for the project is aligned with the World Bank Group’s Country partnership Strategy for South africa, which calls for the use of MIGa instruments to support small and medium-scale enterprises and increase foreign direct investment. the project was underwritten through MIGa’s Small Investment program.
SouthAfrica
Project name: Austin Scott Farms
Guaranteeholder:TulbaghHoldingsLLC
on December 16, 2010, MIGa issued guarantees totaling $5 million to tulbagh Holdings llC of the united States for their investment in austin Scott Farms winery in South africa. the coverage is for a period of seven years against the risks of transfer restriction, expropriation, and war and civil disturbance.
the project consists of the acquisition of austin Scott Farms situated on the southwestern flank of tulbagh Mountain. the acquisition includes land (184 hectares), buildings, equipment, existing crops and stock, bottling plants, intellectual property, water rights, and all other assets or rights required for continued business operation. the investor intends to improve the quality of wines through investment and incorporating industry best practices into the vineyards, winemaking process, and structures. Wine production is expected to increase from 4,700 cases of premium wines for the 2011 vintage to approximately 13,500 cases in 2015, and 18,700 cases in 2017.
tulbagh town’s main economic sectors consist of agriculture (vineyards and soft fruit), tourism, and services. It has experienced significant diversification of its economy with the emergence of a number of new small, medium, and micro businesses—particularly in the personal services, financial, and business sectors. notwithstanding this economic growth there remains a great deal of unemployment, especially within the lower-income groups in the greater region. the project will have a significant socioeconomic benefit to tulbagh and the surrounding communities by creating jobs (temporary in the construction phase and permanent in the operational phase) in various sectors, investing in staff training, and generating taxes for the tulbagh Municipality. Workers will also be trained with the industry’s current standards and best practices to promote and build upon their skills. the investors intend to adhere to the principles underlying the Broad-Based Black economic empowerment act of 2004.
MIGa’s support for the project is aligned with the World Bank Group’s Country partnership Strategy for South africa, which calls for the use of MIGa instruments to support small and medium-scale enterprises and increase developmentally sound foreign direct investment. the project was underwritten through MIGa’s Small Investment program.
MIGa annual report 2011 | 57
Togo
Project name: Cotecna Inspection S.A., Bureau de Liaison du Togo
Guaranteeholder:CotecnaInspectionS.A.
on June 30, 2011, MIGa issued a guarantee of $4.6 million covering an investment by Cotecna Inspection S.a. of Switzerland in Cotecna Inspection S.a., Bureau de liaison du togo (CoInS-togo). the coverage is for a period of five years against the risks of transfer restriction, expropriation, war and civil disturbance, and breach of contract.
CoInS-togo is providing import verification services on behalf of the government of togo under a build, operate, and transfer concession between Cotecna Inspection S.a. and the government of togo. the service contract involves the supply, installation, and operation of an x-ray scanner and GpS-based container tracking equipment, as well as the management of the import verification system for goods entering togo through the port of lomé.
the project will improve togo’s position as a trading partner by introducing greater transparency and effi-ciency into the port of lomé’s operations. this will help togo realize the benefits of a deepwater port that can serve neighboring land-locked countries. the transparent audit trail provided by scanning data will also help the government secure revenues through the elimination of opportunities for fraud and fiscal evasion. Security at the port will also be enhanced by ensuring that containerized goods are not illegal.
this project is aligned with MIGa’s strategic priorities of supporting investments into countries eligible for assistance from the International Development association as well as countries affected by conflict.
Uganda
Project name: Icam Chocolate Uganda Limited
Guaranteeholders:IcamSpA;GiovanniAletti
on January 14, 2011, MIGa issued guarantees supporting investments by Icam Spa and Giovanni aletti of Italy in Icam Chocolate uganda limited. the guarantees total $2.1 million and provide coverage for a period of up to six years against the risks of transfer restriction, expro-priation, and war and civil disturbance.
the project consists of the establishment of a new company, Icam Chocolate uganda limited, that will set up collection, storage, and processing facilities in three
cocoa-producing regions. these facilities will source organically grown green cocoa beans directly from local farmers. Icam uganda will use a bean-drying and fermen-tation process what will dry the beans faster and more thoroughly to meet the stringent standards of Icam Italy. this process reduces the risk of mold and fungi, and pre-serves the cocoa’s desirable taste and aroma. the project intends to source a combined 3,900 tons of dry cocoa from the three facilities by the fifth year of operation.
technical assistance will be provided by agronomists to support local farmers in improving farming practices, which could increase productivity by up to 100 percent. Furthermore, by sourcing the cocoa beans before they have been dried and fermented by the farmers, the project will substantially reduce harvest failure due to bad weather (heavy rains) during the drying and fermenting process.
the project is expected to help boost and diversify uganda’s agricultural exports. although the cacao plant was introduced to the country in the early 1900s, it has never become a major export crop like coffee. uganda is specifically encouraging cocoa-growing as part of a plan to diversify its exports.
Growing cocoa beans also offers small-scale farmers in uganda and other tropical countries a livelihood from a product that has strong foreign demand and local environmental benefits, according to researchers at the International Food policy research Institute. Cacao bushes can grow alongside food crops on small parcels of land and on poor soils, which makes production more feasible for small farms and women growers.
this project is consistent with the World Bank Group’s Country assistance Strategy for uganda, which includes increased productivity and commercialization of agri-culture as an outcome. the project was underwritten through MIGa’s Small Investment program.
Zambia
Project name: Chobe Agrivision Company Limited
Guaranteeholder:ChaytonAtlasInvestments
on June 30, 2011, MIGa issued a guarantee of $5.2 million to Chayton atlas Investments of Mauritius for its equity in Chobe agrivision Company limited in Zambia. the coverage is for a period of up to 10 years against the risks of transfer restriction, expropriation, war and civil disturbance, and breach of contract.
the project involves the acquisition of two adjacent farms in the Mkushi farm block in the Central province of Zambia. these are commercial farms currently cultivating
58 | MIGa annual report 2011
maize, wheat, and soya. the investor plans to increase the amount of land under irrigation from 210 to 580 hectares through increased capital expenditure. the farms are located in an area that has abundant renewable water resources for irrigation development and a climate that supports two crops per year with irrigation. a “contract farming” business was acquired in addition to the two farms. the contract farming operation provides machinery and equipment services to the two farms as well as third party farms.
the agricultural sector has been identified by the Zambian government and by the World Bank (in its Country partnership Strategy) as a key area where there is potential to contribute to development and economic growth. Chayton estimates that only 1.1 percent of the country’s potential fertile Guinea Savannah agricultural area is cropped. Moreover, the introduction of highly efficient agricultural practices (for instance, crop rotation and zero tillage), soil and water management, and certain techno-logical improvements will result in increased productivity and sustainable crop-yield enhancement. the introduction of new technologies and methods also offers the chance for substantial demonstration effects for local farmers. the proposed project will also contribute to increased food security within Zambia and the broader Southern african Development Community—the target market for consumption.
the project is aligned with MIGa’s strategic priorities of supporting investments into countries eligible for assistance from the International Development association.
Zambia
Project name: Hitachi Construction Machinery Zambia Co. Ltd.
Guaranteeholders:HitachiConstructionMachineryAfricaPty.Ltd;HitachiConstructionMachinerySouthernAfricaCo.,Ltd.
on March 31, 2011, MIGa issued guarantees totaling $13.5 million to Hitachi Construction Machinery africa pty. ltd. and Hitachi Construction Machinery Southern africa Co., ltd. of South africa. the coverage is for a period of up to 20 years against the risks of transfer restriction, expro-priation, and war and civil disturbance.
the project involves the construction and operation of a remanufacturing plant in lusaka, Zambia. the facility will recondition used parts and components from heavy-duty earth-moving machinery, primarily in the mining sector, to provide a more cost-effective maintenance solution to serve clients within Zambia as well as in adjacent countries.
the project’s expected developmental impacts include job creation, state-of-the-art technology transfer, and technical skills transfer through structured training programs. In addition, the project’s focus on the reconditioning of old parts will reduce the demand for scarce resources that are used to manufacture new complex machinery and equipment.
MIGa’s support for the project is aligned with the World Bank Group’s Country partnership Strategy, which calls for improving competitiveness in order to accelerate economic growth. the project addresses this goal through its expected technology and skills transfer. MIGa’s partici-pation in the project is also aligned with key agency pri-orities, which include supporting South-South investment and investment into IDa-eligible countries.

MIGa annual report 2011 | 59
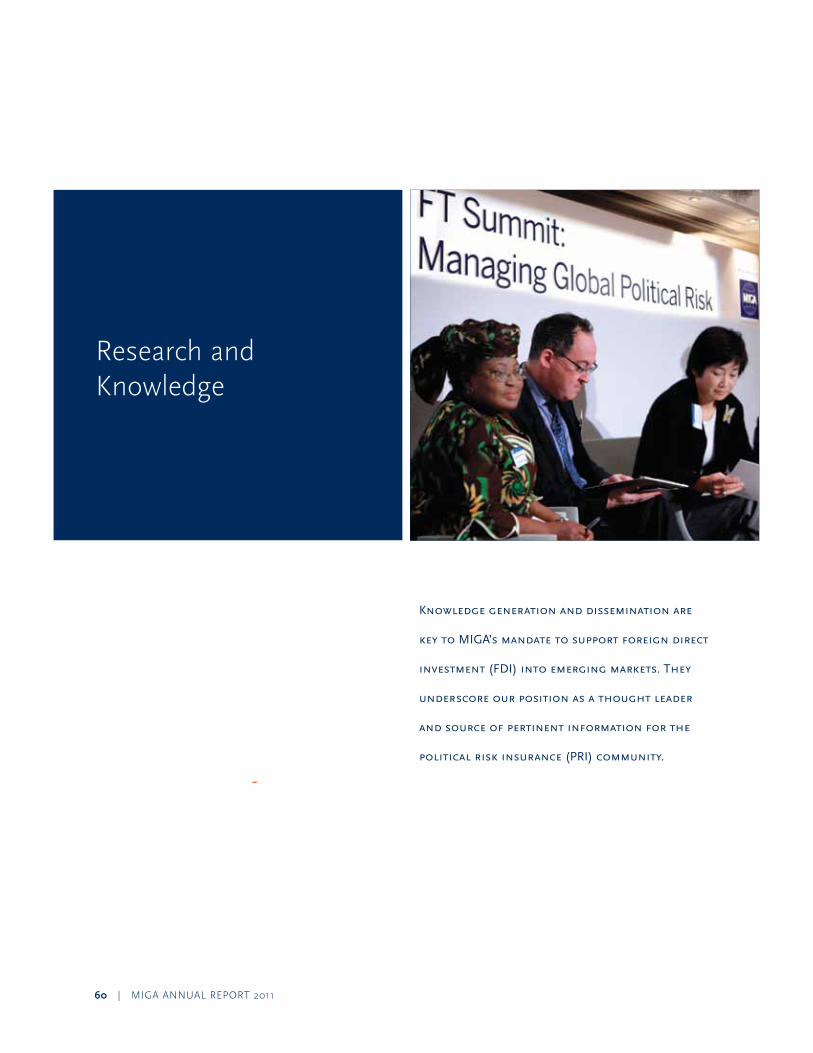
60 | MIGa annual report 2011
Knowledgegenerationanddisseminationare
keytoMIGA’smandatetosupportforeigndirect
investment(FDI)intoemergingmarkets.They
underscoreourpositionasathoughtleader
andsourceofpertinentinformationforthe
politicalriskinsurance(PRI)community.
research and Knowledge
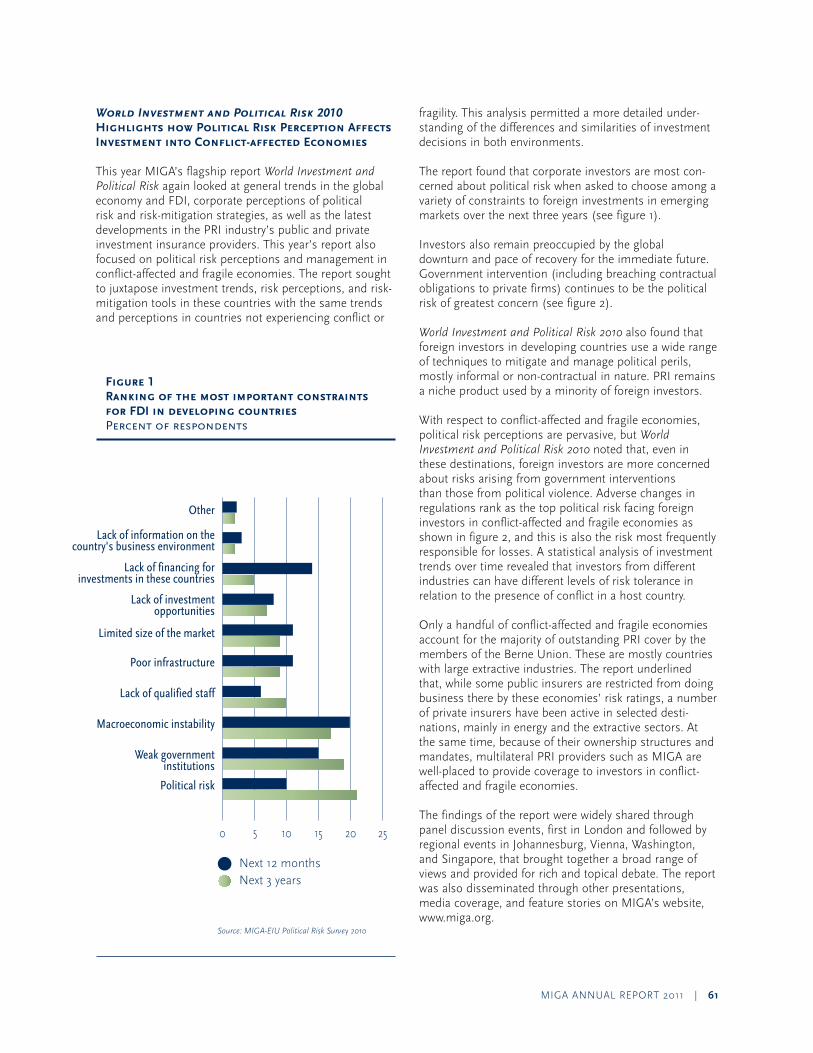
MIGa annual report 2011 | 61
World Investment and Political Risk 2010 Highlights how Political Risk Perception Affects Investment into Conflict-affected Economies
this year MIGa’s flagship report World Investment and Political Risk again looked at general trends in the global economy and FDI, corporate perceptions of political risk and risk-mitigation strategies, as well as the latest developments in the prI industry’s public and private investment insurance providers. this year’s report also focused on political risk perceptions and management in conflict-affected and fragile economies. the report sought to juxtapose investment trends, risk perceptions, and risk-mitigation tools in these countries with the same trends and perceptions in countries not experiencing conflict or
fragility. this analysis permitted a more detailed under-standing of the differences and similarities of investment decisions in both environments.
the report found that corporate investors are most con-cerned about political risk when asked to choose among a variety of constraints to foreign investments in emerging markets over the next three years (see figure 1).
Investors also remain preoccupied by the global downturn and pace of recovery for the immediate future. Government intervention (including breaching contractual obligations to private firms) continues to be the political risk of greatest concern (see figure 2).
World Investment and Political Risk 2010 also found that foreign investors in developing countries use a wide range of techniques to mitigate and manage political perils, mostly informal or non-contractual in nature. prI remains a niche product used by a minority of foreign investors.
With respect to conflict-affected and fragile economies, political risk perceptions are pervasive, but World Investment and Political Risk 2010 noted that, even in these destinations, foreign investors are more concerned about risks arising from government interventions than those from political violence. adverse changes in regulations rank as the top political risk facing foreign investors in conflict-affected and fragile economies as shown in figure 2, and this is also the risk most frequently responsible for losses. a statistical analysis of investment trends over time revealed that investors from different industries can have different levels of risk tolerance in relation to the presence of conflict in a host country.
only a handful of conflict-affected and fragile economies account for the majority of outstanding prI cover by the members of the Berne union. these are mostly countries with large extractive industries. the report underlined that, while some public insurers are restricted from doing business there by these economies’ risk ratings, a number of private insurers have been active in selected desti-nations, mainly in energy and the extractive sectors. at the same time, because of their ownership structures and mandates, multilateral prI providers such as MIGa are well-placed to provide coverage to investors in conflict-affected and fragile economies.
the findings of the report were widely shared through panel discussion events, first in london and followed by regional events in Johannesburg, Vienna, Washington, and Singapore, that brought together a broad range of views and provided for rich and topical debate. the report was also disseminated through other presentations, media coverage, and feature stories on MIGa’s website, www.miga.org.
Figure 1 Ranking of the most important constraints for FDI in developing countries Percentofrespondents
Ranking of the most important constraints for FDI in developing countriesPercent of respondents
Next 12 monthsNext 3 years
0 5 10 15 20 25
Lack of information on thecountry's business environment
Source: MIGA-EIU Political Risk Survey 2010
Lack of financing forinvestments in these countries
Political risks of most concern to foreign investors
Investors in CAF countries Investors in developing countries
0 10 20 30 40 50 60 70
Source: MIGA-EIU Political Risk Survey 2010 and MIGA-EIU CAF Investors Survey
Note: Percentages add up to more than 100 because of multiple selections
Non-honoring of sovereign guarantees
Transfer andconvertibility restrictions
Regulatory changes
Civil disturbance
Expropriation
Breach of contract
War
Terrorism
Other
Lack of investmentopportunities
Limited size of the market
Poor infrastructure
Lack of qualified staff
Macroeconomic instability
Weak governmentinstitutions
Political risk

62 | MIGa annual report 2011
New Research Agenda Tackles Topics of Interest for MIGA’s Business
In this fiscal year, MIGa embarked on a number of ini-tiatives to support the agency’s research and knowledge agenda. Specifically, topics addressed include a new framework for analyzing the causes of expropriation; the relationship between sovereign defaults and restrictions on transfer and convertibility; and political risk as it relates to state-owned enterprises. these research topics will be used as inputs in MIGa’s World Investment and Political Risk 2011 report, in addition to being disseminated through MIGa’s websites and other channels.
MIGa has formed partnerships with outside academic institutions, such as the paris School of economics and Washington university in St. louis, to analyze probable causes of expropriation as well as the impact of political institutions on governmental decision-making with regards to private investors. this allows MIGa’s research agenda to cover both operational aspects directly related
to prI coverage, as well as political economy issues that are associated with political risk triggers.
MIGA Refocuses Web Presence on Political Risk Issues
this fiscal year, MIGa decided to warehouse FDI.net—its investor-focused web portal for disseminating and pro-moting investment opportunities and information about business conditions in developing countries—and to redeploy its resources to research on political risk issues. We will continue to maintain and update prI Center (www.pri-center.com), our online information service dis-seminating knowledge on the political risk environment, risk-management issues, as well as prI industry news and events. prI Center will also serve as a forum for discussion of emerging original research produced by MIGa. We will also continue to extend our reach through MIGa’s bi-monthly newsletter, the prI Briefing.
We also focused heavily on using social media to engage audiences interested in FDI and political risk. MIGa’s blog “political risk and emerging Markets” has generated a very high readership and offers a platform for MIGa staff to share views on topical issues such as the political dynamic in the Middle east and north africa, growth in sub-Saharan africa, and carbon credits. MIGa also dis-seminates information through twitter and Youtube. these platforms are helping us reach new audiences and raise our profile in the investor and academic communities.
We also began revamping our website, www.miga.org, this fiscal year. this will allow clients to conduct business with us in a more user-friendly manner. In addition, all MIGa stakeholders will have improved access to project information, news, features, publications, policies and pro-cedures, as well as MIGa’s social media platforms.
Figure 2 Political risks of most concern to foreign investors
Ranking of the most important constraints for FDI in developing countriesPercent of respondents
Next 12 monthsNext 3 years
0 5 10 15 20 25
Lack of information on thecountry's business environment
Source: MIGA-EIU Political Risk Survey 2010
Lack of financing forinvestments in these countries
Political risks of most concern to foreign investors
Investors in CAF countries Investors in developing countries
0 10 20 30 40 50 60 70
Source: MIGA-EIU Political Risk Survey 2010 and MIGA-EIU CAF Investors Survey
Note: Percentages add up to more than 100 because of multiple selections
Non-honoring of sovereign guarantees
Transfer andconvertibility restrictions
Regulatory changes
Civil disturbance
Expropriation
Breach of contract
War
Terrorism
Other
Lack of investmentopportunities
Limited size of the market
Poor infrastructure
Lack of qualified staff
Macroeconomic instability
Weak governmentinstitutions
Political risk
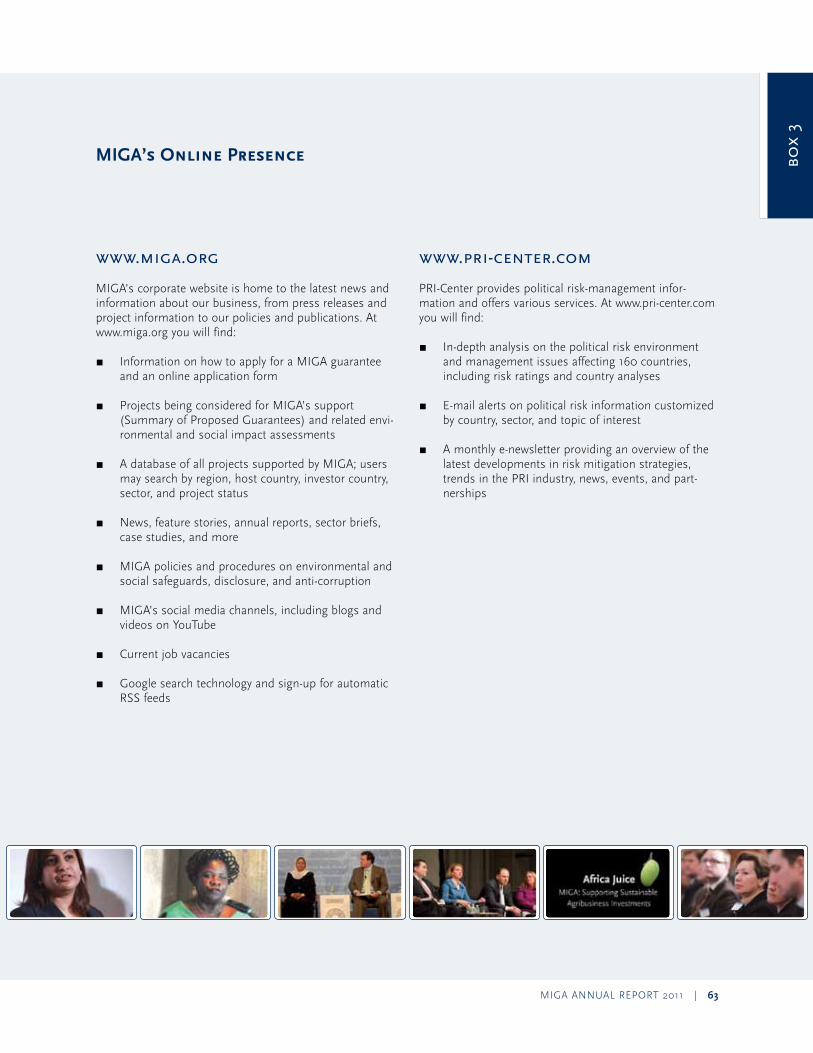
MIGa annual report 2011 | 63
MIGA’s Online Presence
www.pri-center.com
prI-Center provides political risk-management infor-mation and offers various services. at www.pri-center.com you will find:
r In-depth analysis on the political risk environment and management issues affecting 160 countries, including risk ratings and country analyses
r e-mail alerts on political risk information customized by country, sector, and topic of interest
r a monthly e-newsletter providing an overview of the latest developments in risk mitigation strategies, trends in the prI industry, news, events, and part-nerships
www.miga.org
MIGa’s corporate website is home to the latest news and information about our business, from press releases and project information to our policies and publications. at www.miga.org you will find:
r Information on how to apply for a MIGa guarantee and an online application form
r projects being considered for MIGa’s support (Summary of proposed Guarantees) and related envi-ronmental and social impact assessments
r a database of all projects supported by MIGa; users may search by region, host country, investor country, sector, and project status
r news, feature stories, annual reports, sector briefs, case studies, and more
r MIGa policies and procedures on environmental and social safeguards, disclosure, and anti-corruption
r MIGa’s social media channels, including blogs and videos on Youtube
r Current job vacancies
r Google search technology and sign-up for automatic rSS feeds
box
3
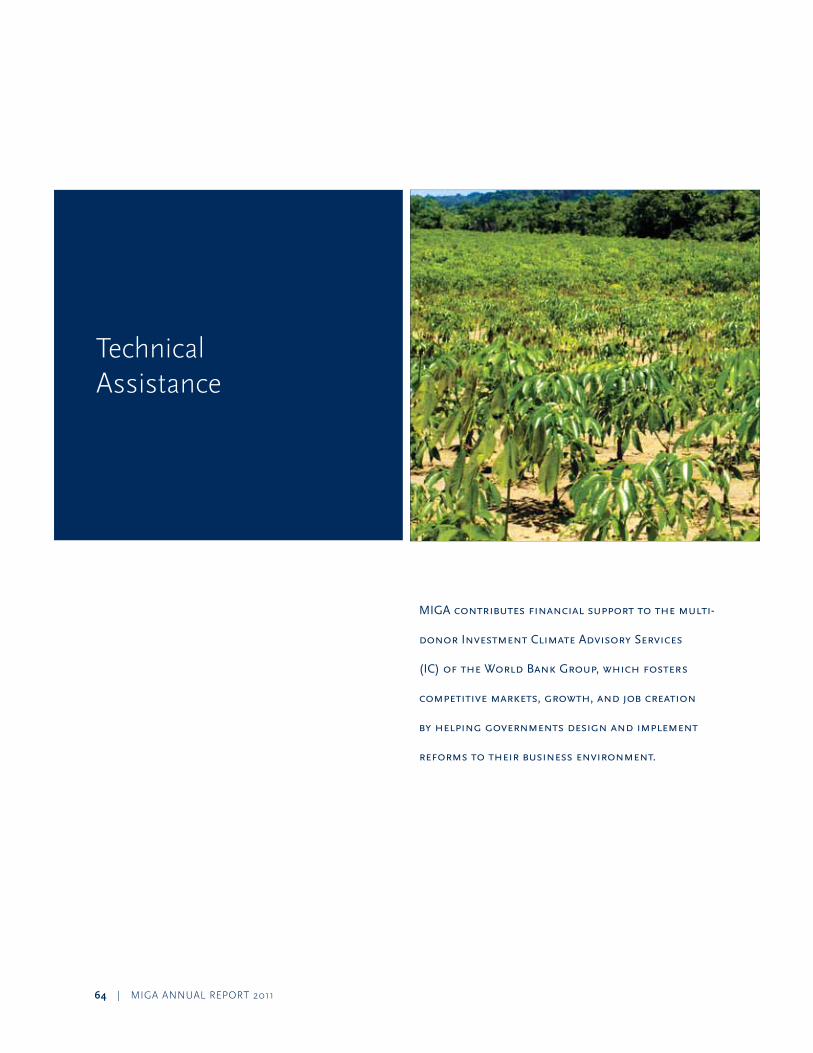
64 | MIGa annual report 2011
technicalassistance
MIGAcontributesfinancialsupporttothemulti-
donorInvestmentClimateAdvisoryServices
(IC)oftheWorldBankGroup,whichfosters
competitivemarkets,growth,andjobcreation
byhelpinggovernmentsdesignandimplement
reformstotheirbusinessenvironment.
MIGa annual report 2011 | 65
In the first half of fiscal year 2011, IC supported econ-omy-wide results1 in client countries across the globe. Sixty-seven percent of IC’s fiscal year 2011 advisory portfolio supported reforms in IDa countries and 30 percent were in fragile and conflict-affected countries. IC helped level the playing field by advising governments on reducing barriers to business entry, expansion, and exit. It also facilitated international trade and investment by identifying constraints and supporting improvements in policies, laws, and regulations that influence domestic and foreign firms’ business decisions.
Building the government’s investment promotion capacity through the Bangladesh Investment Climate Fund, IC facilitated $203 million of foreign direct investment (FDI) and 17,000 new jobs to export-processing zones in the country. this has increased labor compliance in zone companies to more than 90 percent. In the Dhaka export-processing zone where the number of grievances dropped from 2,400 in 2006 to 400 in 2009, the program is also facilitating a water treatment plant that is expected to increase the amount of properly treated industrial water from zero to 15,000 cubic meters by august 2011.
In Yemen, for example, IC assistance facilitated the passage of a new income tax law that reduced the general tax rate from 35 to 20 percent and created a sim-plified filing process for micro, small and medium-sized corporate taxpayers. these moves encouraged partici-pation in the formal economy and increased tax revenues by expanding reporting compliance. the project suc-cessfully streamlined six procedures to reduce corruption and will result in an estimated $3.1 million in direct cost savings over the next three years.
Brazil is attracting investment into its frontier states through a fully client-funded IC project that has linked up the country’s national and state investment promotion agencies. Investors have announced plans for eight projects in the states of pernambuco and para following IC assistance. the team also assisted apex-Brasil, the national agency, in developing investor-friendly strategies, resulting in seven announced investments since IC support began in May 2009. to date, it has recorded about $100 million of new actual investment and 1,200 actual jobs, mostly in pernambuco, but para is also showing good potential.
IC is also drawing on a range of experience in national reforms to address binding constraints and market failures in a bid to encourage sustainable investments in key strategic industries such as agribusiness. For example, ukraine’s agricultural export potential and ability to play a global role in food security prompted IC to join forces with IFC’s ukraine advisory Services to address regulatory and policy constraints to the sector’s development. as a result, the government abolished mandatory state certification of food products, with the exception of tobacco, alcohol, and baby food. the mandatory certification represented the single most burdensome requirement for food processors, which were already subject to regular food safety controls. Its abolition has enabled the government to open up new export opportunities for ukrainian agricultural producers through greater harmonization of national food safety legislation with european union standards and regu-lations.
IC also helps countries foster “green” development by setting standards and attracting much-needed private investment into low carbon, more resource-efficient economic activities. IC is assisting Indonesia’s Jakarta province as it develops a green building code in line with national standards, and in consultation with private sector stakeholders. the implementation of a “green” building code in Indonesia has very significant carbon reduction potential.
In fiscal year 2011, IC responded to increased demand and devoted considerable resources to IDa countries in sub-Saharan africa. an independent external evaluation found that programs in Burkina Faso, liberia, Sierra leone, and rwanda helped ease regulatory burdens that enabled the registration of 23,000 new firms and led to the creation of additional private sector investment ranging between $75 to $90 million and 51,500 jobs. With IC support, 16 West african countries are moving to increase access to credit and reduce hurdles to business startup. In fact, for the first time since it was created in 1993, the organization for the Harmonization of Business law in africa has amended its laws on secured lending and commerce, creating a simplified legal regime for small entrepreneurs. this will facilitate access to credit in its member states and encourage thousands of informal entrepreneurs to join the formal economy.
1 An IC result is defined as “a change implemented by a client with support from an IC-supported project that significantly improves the investment climate in a given country, region, or sector. These changes are tangible achievements brought about with IC assistance and for which there is wide technical and expert consensus regarding their relevance in including private sector-led development.”
66 | MIGa annual report 2011
Independent evaluation Group
TheIndependentEvaluationGroup(IEG)
evaluatesMIGA’sstrategies,policies,and
guaranteeprojectstoimproveMIGA’s
developmentresults.IEGisindependentof
MIGAmanagementandreportsitsfindings
toMIGA’sBoardofDirectors.
MIGa annual report 2011 | 67
IeG’s mandate is to generate lessons learned from MIGa’s operations and to ensure corporate account-ability for results. In a rapidly changing business context, IeG aims to strengthen MIGa’s operational performance and inform its strategy and future directions. It provides MIGa’s Board of Directors, management, and other stakeholders with relevant and timely evaluations assessing the adequacy and quality of MIGa’s strategy, programs, policies, and projects, and makes recommen-dations for their continuous improvement.
IeG evaluations contribute to MIGa’s overall devel-opment and institutional effectiveness. For example, in its report on the World Bank Group guarantee instruments, IeG recommended that MIGa propose to its share-holders amendments to its Convention, expanding its mandate to include coverage for stand-alone debt, existing assets, and brownfield investments.
IeG has supported MIGa’s self-evaluation of its guar-anteed projects to strengthen institutional learning and the focus on development results. IeG’s role is to inde-pendently validate the results of MIGa’s self-evaluations according to methods and guidelines jointly agreed to by IeG and MIGa. In fiscal year 2010, IeG received three pilot self-evaluations from MIGa for validation followed by five additional self evaluations in fiscal year 2011.
IeG’s report, Achieving Value-Driven Volume—MIGA’s Development Results and Institutional Effectiveness 2010, provided an updated assessment of MIGa’s institu-
tional effectiveness. IeG also commented on MIGa’s overall performance in a Bank Group report—Results and Performance of the World Bank Group: IEG Annual Report 2010. among other things, this report evaluated the World Bank Group’s response to the global financial crisis and explored select issues on institutional effec-tiveness. MIGa operations have also been highlighted in several other evaluations, including The World Bank Group’s Response to the Global Economic Crisis; Climate Change and the World Bank Group Phase II: The Challenge of Low-Carbon Development; Safeguards and Sustainability Policies in a Changing World; and Peru: Country Program Evaluation for the World Bank Group, 2003–09.
Development effectiveness is a core part of MIGa’s mission to promote foreign direct investment into developing countries to support economic growth, reduce poverty, and improve people’s lives. MIGa’s strength lies in attracting investors and private insurers into difficult operating environments, including conflict-affected environments. IeG seeks to help MIGa achieve its goal to support investments that are developmentally sound, meet high social and environmental standards, and are integrated with the sector and thematic strategies and programs of the entire World Bank Group.
Consistent with corporate transparency, IeG’s reports and recommendations are publicly disclosed on IeG’s website at ieg.worldbankgroup.org.
68 | MIGa annual report 2011
TheComplianceAdvisor/Ombudsman(CAO)is
theindependentaccountabilitymechanism
forMIGAandIFCandreportsdirectlytothe
PresidentoftheWorldBankGroup.TheCAO
respondstocomplaintsfrompeopleaffected
byMIGAandIFC-supportedbusinessactivities,
withthegoalofenhancingsocialandenviron-
mentaloutcomesonthegroundandfostering
greaterpublicaccountabilityofbothagencies.
Compliance advisor/ombudsman
MIGa annual report 2011 | 69
the Cao has three roles. Cao’s dispute resolution arm works to identify the causes of conflict and helps stakeholders resolve concerns using a flexible, problem-solving approach. Cao’s compliance arm oversees investigations of MIGa’s/IFC’s social and environmental performance to ensure compliance with applicable policies, guidelines, procedures, and systems. In its advisory role, the Cao provides independent advice to the World Bank Group president and management of MIGa and IFC in relation to policies, systemic environ-mental and social issues, and emerging trends.
In July 2010, the Cao accepted a complaint related to a MIGa-supported nickel mining project in Indonesia (see project brief on page 38). another complaint concerning
a water privatization project in ecuador that MIGa guar-anteed in 2001 was closed following a final meeting of the stakeholders in December 2010. after the complaint was filed by residents in the city of Guayaquil in 2008, the Cao worked with MIGa’s client, water users’ asso-ciations, and affected parties to create agreements for debt reduction to help the poorest customers get the water they need. the company used lessons learned from a collaborative review of water users’ concerns to strengthen its grievance processes to enable individuals to resolve water service issues on a sustained basis.
Visit www.cao-ombudsman.org for more information about the Cao’s activities.
70 | MIGa annual report 2011
Management’sDiscussion and analysis (FY11) Financial Statements
Management’s Discussion and Analysis (FY11)
overview Development activities Summary of Business Segmentsoutlook and ChallengesFunding SourcesCapital ManagementInvestment ManagementCritical accounting policiesresults of operationsCorporate Governance
MIGa annual report 2011 | 71
Financial Statements
Management’s report regarding effectiveness of Internal Controls over external Financial reportingreport of Independent auditors on Management assertion regarding effectiveness of Internal Controls over external Financial reportingIndependent auditors’ report Balance Sheet Statement of operations Statement of Comprehensive IncomeStatement of Changes in Shareholders’ equity Statement of Cash Flows Statement of Subscriptions to Capital Stock and Voting powerStatement of Guarantees outstandingnotes to Financial Statements
72 | MIGa annual report 2011
1 Smaller guarantees may be underwritten through MIGA’s Small Investment Program (SIP), but SIP coverage is limited to the risks of transfer restriction, expropriation, and war and civil disturbance.
Overview
established in 1988, the Multilateral Investment Guarantee agency (MIGa or “the agency”) is a member of the World Bank Group. the World Bank Group also includes the International Bank for reconstruction and Development (IBrD), the International Development association (IDa), the International Finance Corporation (IFC), and the International Centre for Settlement of Investment Disputes (ICSID). MIGa is a legal entity separate and distinct from IBrD, IDa, IFC, and ICSID, with its own charter (the “Convention”), share capital, financial structure, management, and staff. Membership in the agency, which currently stands at 175 countries, is open to all members of IBrD.
MIGa’s mission is to promote foreign direct investment (FDI) into developing countries to support economic growth, reduce poverty, and improve people’s lives. to this end, the agency acts as a multilateral risk mitigator, providing investors and lenders in the international investment com-munity with the level of comfort necessary to invest in developing countries. MIGa’s core business is the provision of political risk insurance (prI). In addition, as part of its mandate, the agency carries out complementary activities such as providing dispute resolution, technical assistance, and research and knowledge services to support FDI.
MIGa is committed to promoting projects that are economically, environmentally, and socially sustainable, and that promise a strong devel-opment impact. By providing prI for foreign direct investment in developing countries, MIGa is able to play a critical role in supporting the World Bank Group’s broad strategic priorities.
this year, MIGa’s Council of Governors approved amendments to MIGa’s Convention. these amendments have expanded MIGa’s eligibility criteria, allowing the agency to support a broader range of developmentally beneficial investments.
In august 2010, MIGa launched a hub in asia and started operations in Hong Kong Sar, China and Singapore. the hub is geared toward providing better and more efficient access for MIGa’s clients and other stakeholders in asia. the regionally based team has developed a strong pipeline of viable business leads and underwriting has commenced on several projects.
Since its inception, MIGa has issued $24.5 billion of guarantees (including amounts issued under the Cooperative underwriting program), in support of 651 projects in 104 member countries. the agency has also supported numerous technical assistance activities, as well as multiple programs at regional and global levels in member countries.
MIGa is financially self-sustaining, and its activities are supported by a strong capital base and a comprehensive risk management framework. the agency prepares its financial statements in accordance with generally accepted accounting principles in the united States of america (uS Gaap) as well as International Financial reporting Standards (IFrS) as issued by the International accounting Standards Board (IaSB).
Development Activities
Summary of Business SegmentsMIGa seeks to fulfill its mission in developing member countries by offering prI, investment dispute resolution, technical assistance, and research and knowledge services.
Political Risk Insurance MIGa provides investment guarantees against certain non-commercial and sovereign risks to eligible foreign investors for qualified investments in developing member countries. MIGa covers against the risks of 1) transfer restriction and inconvertibility, 2) expropriation, 3) breach of contract, 4) war and civil disturbance, and, 5) the non-honoring of a sovereign financial obligation. Investors may choose any combination of these covers 1 (see Box 1). MIGa insures new cross-border investments originating in any MIGa member country, destined for any developing member country. types of investments that can be covered include equity, shareholder and non-shareholder loans, and loan guarantees (provided the loans have a minimum maturity of more than one year). other forms of investments—such as technical assistance and management contracts, or franchising and licensing agreements—may also be eligible. table 1 contains a summary of cumulative guarantees issued in member countries.
Table 1 Cumulative Guarantees Issued in Member Countries
FY11 FY10 FY09 FY08 FY07
Cumulative Guarantees Issued ($B)* 24.5 22.4 20.9 19.5 17.4
Host Countries 104 100 99 99 96
* Includes amounts from Cooperative Underwriting Program.
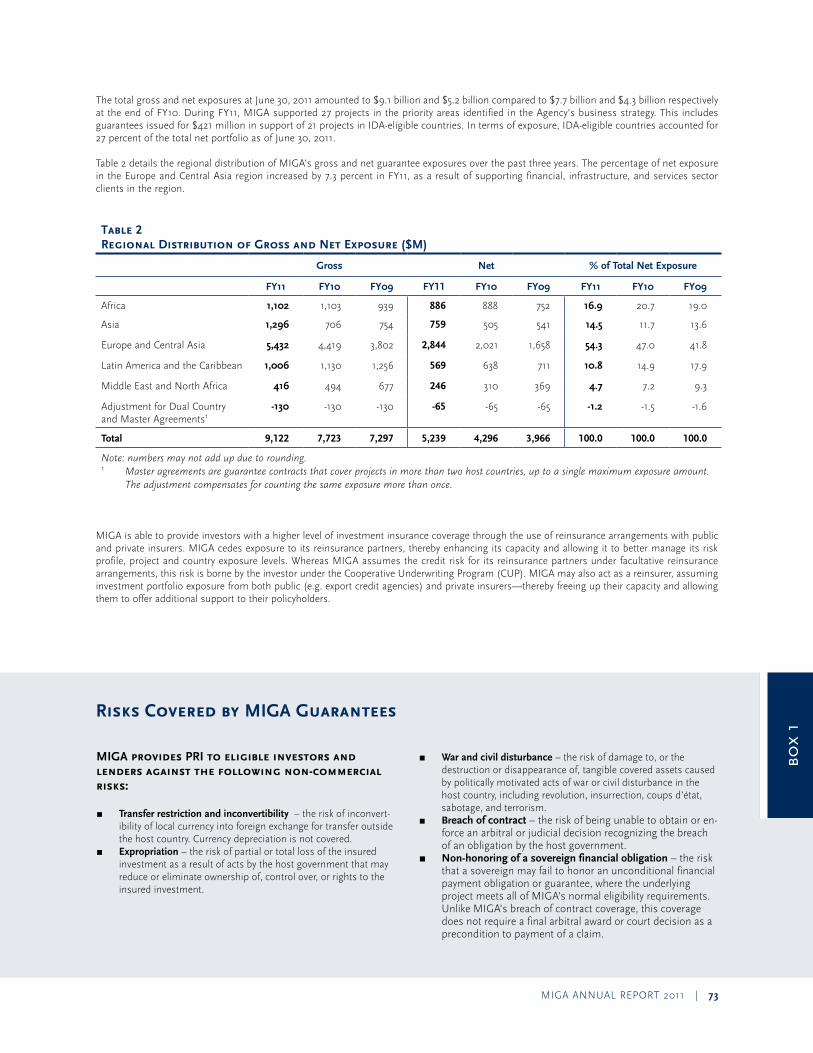
MIGa annual report 2011 | 73
Risks Covered by MIGA Guarantees
the total gross and net exposures at June 30, 2011 amounted to $9.1 billion and $5.2 billion compared to $7.7 billion and $4.3 billion respectively at the end of FY10. During FY11, MIGa supported 27 projects in the priority areas identified in the agency’s business strategy. this includes guarantees issued for $421 million in support of 21 projects in IDa-eligible countries. In terms of exposure, IDa-eligible countries accounted for 27 percent of the total net portfolio as of June 30, 2011.
table 2 details the regional distribution of MIGa’s gross and net guarantee exposures over the past three years. the percentage of net exposure in the europe and Central asia region increased by 7.3 percent in FY11, as a result of supporting financial, infrastructure, and services sector clients in the region.
Table 2 Regional Distribution of Gross and Net Exposure ($M)
Gross Net % of Total Net Exposure
FY11 FY10 FY09 FY11 FY10 FY09 FY11 FY10 FY09
africa 1,102 1,103 939 886 888 752 16.9 20.7 19.0
asia 1,296 706 754 759 505 541 14.5 11.7 13.6
europe and Central asia 5,432 4,419 3,802 2,844 2,021 1,658 54.3 47.0 41.8
latin america and the Caribbean 1,006 1,130 1,256 569 638 711 10.8 14.9 17.9
Middle east and north africa 416 494 677 246 310 369 4.7 7.2 9.3
adjustment for Dual Country and Master agreements1
-130 -130 -130 -65 -65 -65 -1.2 -1.5 -1.6
Total 9,122 7,723 7,297 5,239 4,296 3,966 100.0 100.0 100.0
Note: numbers may not add up due to rounding.1 Master agreements are guarantee contracts that cover projects in more than two host countries, up to a single maximum exposure amount.
The adjustment compensates for counting the same exposure more than once.
MIGa is able to provide investors with a higher level of investment insurance coverage through the use of reinsurance arrangements with public and private insurers. MIGa cedes exposure to its reinsurance partners, thereby enhancing its capacity and allowing it to better manage its risk profile, project and country exposure levels. Whereas MIGa assumes the credit risk for its reinsurance partners under facultative reinsurance arrangements, this risk is borne by the investor under the Cooperative underwriting program (Cup). MIGa may also act as a reinsurer, assuming investment portfolio exposure from both public (e.g. export credit agencies) and private insurers—thereby freeing up their capacity and allowing them to offer additional support to their policyholders.
box
1
r War and civil disturbance – the risk of damage to, or the destruction or disappearance of, tangible covered assets caused by politically motivated acts of war or civil disturbance in the host country, including revolution, insurrection, coups d’état, sabotage, and terrorism.
r Breach of contract – the risk of being unable to obtain or en-force an arbitral or judicial decision recognizing the breach of an obligation by the host government.
r Non-honoring of a sovereign financial obligation – the risk that a sovereign may fail to honor an unconditional financial payment obligation or guarantee, where the underlying project meets all of MIGa’s normal eligibility requirements. unlike MIGa’s breach of contract coverage, this coverage does not require a final arbitral award or court decision as a precondition to payment of a claim.
MIGA provides PRI to eligible investors and lenders against the following non-commercial risks:
r Transfer restriction and inconvertibility – the risk of inconvert-ibility of local currency into foreign exchange for transfer outside the host country. Currency depreciation is not covered.
r Expropriation – the risk of partial or total loss of the insured investment as a result of acts by the host government that may reduce or eliminate ownership of, control over, or rights to the insured investment.
74 | MIGa annual report 2011
1 MIGA’s categorization for developing countries; see MIGA Member Countries list in the Appendices section of the Annual Report
Technical Assistance (TA)MIGa supports the multi-donor Investment Climate advisory Services of the World Bank Group, which helps governments design and implement reforms to improve their business environment and attract domestic and foreign investment. Investment Climate advisory Services remains focused on IDa and conflict-affected countries. MIGa’s financial contribution has supported projects that reduce policy impediments and provide support to governments in attracting new investors as well as retaining and expanding existing investments.
Research and Knowledge Services MIGa carries out research and disseminates information to promote investment in its developing member countries. this year MIGa’s flagship report World Investment and Political Risk looked at general trends in the global economy and FDI, corporate perceptions of political risk and risk-mitigation strategies, as well as the latest developments in the prI industry’s public and private investment insurance providers. this year’s report also focused on political risk perceptions and management in conflict-affected and fragile economies.
effective June 30, 2011, MIGa warehoused its online service “FDI.net” and redeployed its resources to research on political risk issues. In addition to producing World Investment and Political Risk, MIGa will continue to maintain and update the prI Center (www.pri-center.com).
Investment Dispute ResolutionConsistent with article 23 of the MIGa Convention, the agency seeks both to remove impediments to the flow of investment to developing member countries and to encourage the settlement of disputes between investors and host governments. MIGa actively pursues the resolution of disputes affecting MIGa-supported projects. In many cases, these efforts focus on situations in which either a claim has been or is expected to be filed, but MIGa will also assist in resolving problems that are not related to its cover. During FY11, MIGa engaged with investors or governments in relation to projects located in argentina, Guinea, Guinea-Bissau, Senegal, and Sierra leone.
In appropriate circumstances, the agency will mediate disputes between states and investors not guaranteed by MIGa if such disputes inhibit the flow of additional investment to the country. In such circumstances, MIGa may seek compensation for these services and reimbursement for its costs in conducting the mediation.
Outlook and Challenges
Market TrendsFY11 was characterized by gradual economic recovery led by the developing world. as credit constraints eased and FDI flows to developing countries began to recover, the demand for prI products increased. In addition, events in the Middle east and north africa contributed to a resurging awareness of political risk. MIGa’s guarantee holders continue to show a certain level of caution and risk aversion by maintaining their political risk coverage for existing projects at longer periods than in the years prior to the global financial crisis.
Operational Priorities this year MIGa’s Board of Directors, endorsed an updated operational Directions paper, FY12-14 Strategy: Achieving Value-Driven Volume. this strategy reaffirmed MIGa’s commitments to the operational priorities that have guided the agency since FY05:
r Investments in IDA countries, a key area of comparative advantage for MIGa. r Investments in conflict-affected countries, an area of increased engagement for the agency over the past few years and where MIGa remains
strongly relevant. r Investments in complex projects, mostly in infrastructure and the extractive industries, often involving government intervention and resulting in
a delicate balance of risk-sharing by stakeholders. r Support for investments between MIGA Category Two countries1 (South-South investments), given the growing proportion of FDI coming from
developing countries and the need to provide underserved corporations with prI.
MIGa’s delivery of these operational priorities will be guided by the need to:
r Support and complement World Bank Group strategies articulated for specific countries, as well as its strategic themes. r Be responsive to clients and the market through greater flexibility in service and product delivery across all markets. r Promote financial sustainability, which will require an efficient use of MIGa’s capital and the maintenance of a balanced portfolio.
Funding Sources
Subscribed CapitalMIGa derives its financial strength primarily from the capital it receives from its shareholders and its retained earnings.
MIGa’s Convention established MIGa’s authorized capital stock (membership shares) at 100,000 shares—equivalent to $1,082 million—with a provision that the authorized capital stock shall automatically increase upon the admission of a new member to the extent that the total number of authorized shares are sufficient to allow subscription by the new member. as of June 30, 2011, the initial authorized shares are 107,483, equivalent to $1,163.0 million, and authorized capital increase shares are 78,559, equivalent to $850 million. the total authorized shares are 186,042,
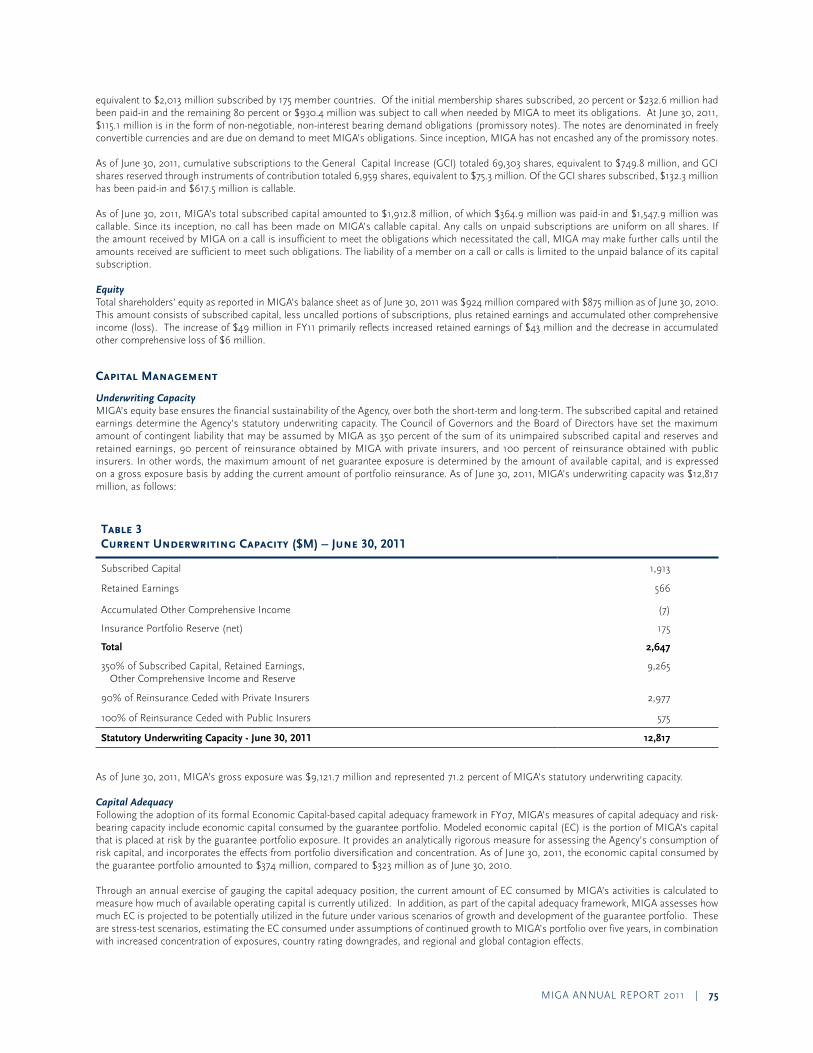
MIGa annual report 2011 | 75
equivalent to $2,013 million subscribed by 175 member countries. of the initial membership shares subscribed, 20 percent or $232.6 million had been paid-in and the remaining 80 percent or $930.4 million was subject to call when needed by MIGa to meet its obligations. at June 30, 2011, $115.1 million is in the form of non-negotiable, non-interest bearing demand obligations (promissory notes). the notes are denominated in freely convertible currencies and are due on demand to meet MIGa’s obligations. Since inception, MIGa has not encashed any of the promissory notes.
as of June 30, 2011, cumulative subscriptions to the General Capital Increase (GCI) totaled 69,303 shares, equivalent to $749.8 million, and GCI shares reserved through instruments of contribution totaled 6,959 shares, equivalent to $75.3 million. of the GCI shares subscribed, $132.3 million has been paid-in and $617.5 million is callable.
as of June 30, 2011, MIGa’s total subscribed capital amounted to $1,912.8 million, of which $364.9 million was paid-in and $1,547.9 million was callable. Since its inception, no call has been made on MIGa’s callable capital. any calls on unpaid subscriptions are uniform on all shares. If the amount received by MIGa on a call is insufficient to meet the obligations which necessitated the call, MIGa may make further calls until the amounts received are sufficient to meet such obligations. the liability of a member on a call or calls is limited to the unpaid balance of its capital subscription.
Equity total shareholders’ equity as reported in MIGa’s balance sheet as of June 30, 2011 was $924 million compared with $875 million as of June 30, 2010. this amount consists of subscribed capital, less uncalled portions of subscriptions, plus retained earnings and accumulated other comprehensive income (loss). the increase of $49 million in FY11 primarily reflects increased retained earnings of $43 million and the decrease in accumulated other comprehensive loss of $6 million.
Capital Management
Underwriting Capacity MIGa’s equity base ensures the financial sustainability of the agency, over both the short-term and long-term. the subscribed capital and retained earnings determine the agency’s statutory underwriting capacity. the Council of Governors and the Board of Directors have set the maximum amount of contingent liability that may be assumed by MIGa as 350 percent of the sum of its unimpaired subscribed capital and reserves and retained earnings, 90 percent of reinsurance obtained by MIGa with private insurers, and 100 percent of reinsurance obtained with public insurers. In other words, the maximum amount of net guarantee exposure is determined by the amount of available capital, and is expressed on a gross exposure basis by adding the current amount of portfolio reinsurance. as of June 30, 2011, MIGa’s underwriting capacity was $12,817 million, as follows:
Table 3 Current Underwriting Capacity ($M) – June 30, 2011
Subscribed Capital 1,913
retained earnings 566
accumulated other Comprehensive Income (7)
Insurance portfolio reserve (net) 175
Total 2,647
350% of Subscribed Capital, retained earnings, other Comprehensive Income and reserve
9,265
90% of reinsurance Ceded with private Insurers 2,977
100% of reinsurance Ceded with public Insurers 575
Statutory Underwriting Capacity - June 30, 2011 12,817
as of June 30, 2011, MIGa’s gross exposure was $9,121.7 million and represented 71.2 percent of MIGa’s statutory underwriting capacity.
Capital Adequacy Following the adoption of its formal economic Capital-based capital adequacy framework in FY07, MIGa’s measures of capital adequacy and risk-bearing capacity include economic capital consumed by the guarantee portfolio. Modeled economic capital (eC) is the portion of MIGa’s capital that is placed at risk by the guarantee portfolio exposure. It provides an analytically rigorous measure for assessing the agency’s consumption of risk capital, and incorporates the effects from portfolio diversification and concentration. as of June 30, 2011, the economic capital consumed by the guarantee portfolio amounted to $374 million, compared to $323 million as of June 30, 2010.
through an annual exercise of gauging the capital adequacy position, the current amount of eC consumed by MIGa’s activities is calculated to measure how much of available operating capital is currently utilized. In addition, as part of the capital adequacy framework, MIGa assesses how much eC is projected to be potentially utilized in the future under various scenarios of growth and development of the guarantee portfolio. these are stress-test scenarios, estimating the eC consumed under assumptions of continued growth to MIGa’s portfolio over five years, in combination with increased concentration of exposures, country rating downgrades, and regional and global contagion effects.
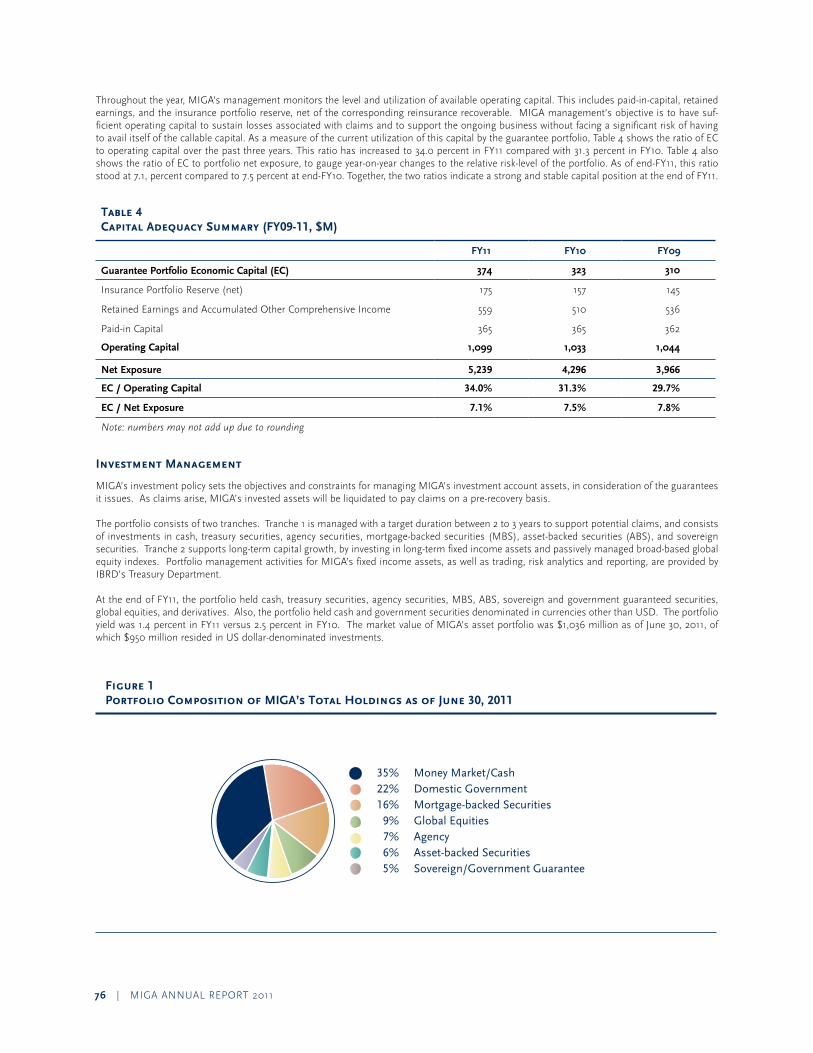
76 | MIGa annual report 2011
throughout the year, MIGa’s management monitors the level and utilization of available operating capital. this includes paid-in-capital, retained earnings, and the insurance portfolio reserve, net of the corresponding reinsurance recoverable. MIGa management’s objective is to have suf-ficient operating capital to sustain losses associated with claims and to support the ongoing business without facing a significant risk of having to avail itself of the callable capital. as a measure of the current utilization of this capital by the guarantee portfolio, table 4 shows the ratio of eC to operating capital over the past three years. this ratio has increased to 34.0 percent in FY11 compared with 31.3 percent in FY10. table 4 also shows the ratio of eC to portfolio net exposure, to gauge year-on-year changes to the relative risk-level of the portfolio. as of end-FY11, this ratio stood at 7.1, percent compared to 7.5 percent at end-FY10. together, the two ratios indicate a strong and stable capital position at the end of FY11.
Table 4 Capital Adequacy Summary (FY09-11, $M)
FY11 FY10 FY09
Guarantee Portfolio Economic Capital (EC) 374 323 310
Insurance portfolio reserve (net) 175 157 145
retained earnings and accumulated other Comprehensive Income 559 510 536
paid-in Capital 365 365 362
Operating Capital 1,099 1,033 1,044
Net Exposure 5,239 4,296 3,966
EC / Operating Capital 34.0% 31.3% 29.7%
EC / Net Exposure 7.1% 7.5% 7.8%
Note: numbers may not add up due to rounding
Investment Management
MIGa’s investment policy sets the objectives and constraints for managing MIGa’s investment account assets, in consideration of the guarantees it issues. as claims arise, MIGa’s invested assets will be liquidated to pay claims on a pre-recovery basis.
the portfolio consists of two tranches. tranche 1 is managed with a target duration between 2 to 3 years to support potential claims, and consists of investments in cash, treasury securities, agency securities, mortgage-backed securities (MBS), asset-backed securities (aBS), and sovereign securities. tranche 2 supports long-term capital growth, by investing in long-term fixed income assets and passively managed broad-based global equity indexes. portfolio management activities for MIGa’s fixed income assets, as well as trading, risk analytics and reporting, are provided by IBrD’s treasury Department.
at the end of FY11, the portfolio held cash, treasury securities, agency securities, MBS, aBS, sovereign and government guaranteed securities, global equities, and derivatives. also, the portfolio held cash and government securities denominated in currencies other than uSD. the portfolio yield was 1.4 percent in FY11 versus 2.5 percent in FY10. the market value of MIGa’s asset portfolio was $1,036 million as of June 30, 2011, of which $950 million resided in uS dollar-denominated investments.
Figure 1 Portfolio Composition of MIGA’s Total Holdings as of June 30, 2011
35% Money Market/Cash 22% Domestic Government 16% Mortgage-backed Securities 9% Global Equities 7% Agency 6% Asset-backed Securities 5% Sovereign/Government Guarantee
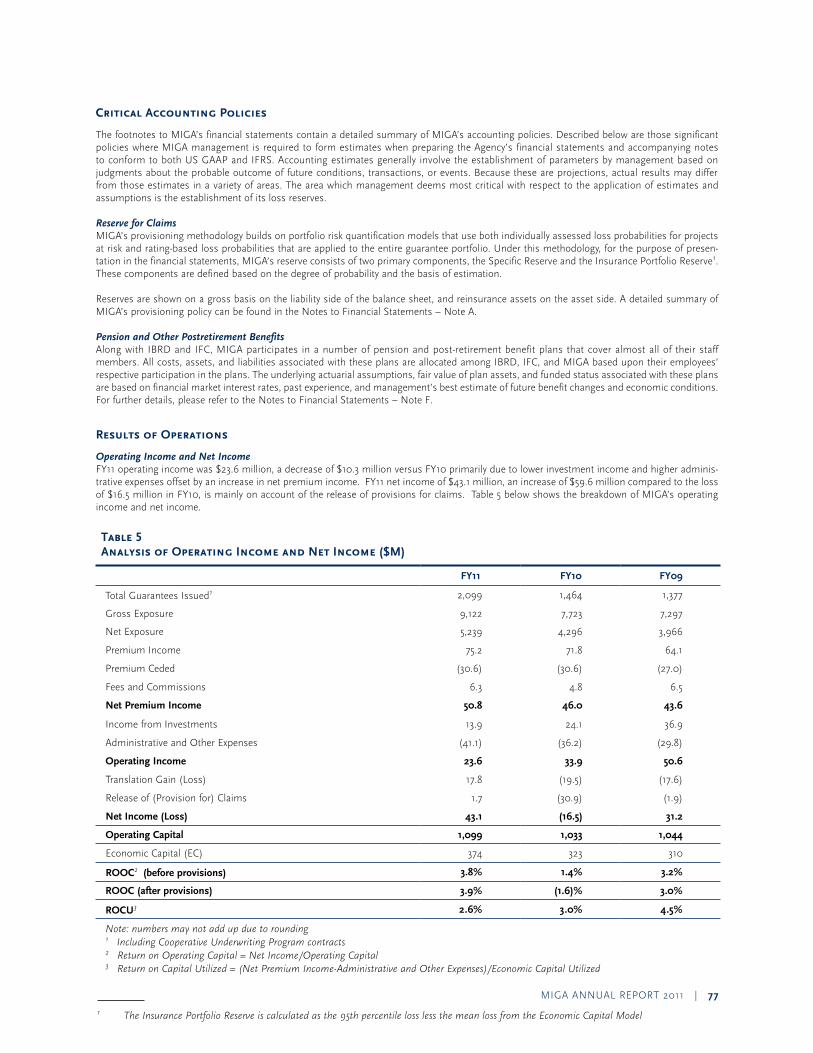
MIGa annual report 2011 | 77
Critical Accounting Policies
the footnotes to MIGa’s financial statements contain a detailed summary of MIGa’s accounting policies. Described below are those significant policies where MIGa management is required to form estimates when preparing the agency’s financial statements and accompanying notes to conform to both uS Gaap and IFrS. accounting estimates generally involve the establishment of parameters by management based on judgments about the probable outcome of future conditions, transactions, or events. Because these are projections, actual results may differ from those estimates in a variety of areas. the area which management deems most critical with respect to the application of estimates and assumptions is the establishment of its loss reserves.
Reserve for ClaimsMIGa’s provisioning methodology builds on portfolio risk quantification models that use both individually assessed loss probabilities for projects at risk and rating-based loss probabilities that are applied to the entire guarantee portfolio. under this methodology, for the purpose of presen-tation in the financial statements, MIGa’s reserve consists of two primary components, the Specific reserve and the Insurance portfolio reserve1. these components are defined based on the degree of probability and the basis of estimation.
reserves are shown on a gross basis on the liability side of the balance sheet, and reinsurance assets on the asset side. a detailed summary of MIGa’s provisioning policy can be found in the notes to Financial Statements – note a.
Pension and Other Postretirement Benefitsalong with IBrD and IFC, MIGa participates in a number of pension and post-retirement benefit plans that cover almost all of their staff members. all costs, assets, and liabilities associated with these plans are allocated among IBrD, IFC, and MIGa based upon their employees’ respective participation in the plans. the underlying actuarial assumptions, fair value of plan assets, and funded status associated with these plans are based on financial market interest rates, past experience, and management’s best estimate of future benefit changes and economic conditions. For further details, please refer to the notes to Financial Statements – note F.
Results of Operations
Operating Income and Net IncomeFY11 operating income was $23.6 million, a decrease of $10.3 million versus FY10 primarily due to lower investment income and higher adminis-trative expenses offset by an increase in net premium income. FY11 net income of $43.1 million, an increase of $59.6 million compared to the loss of $16.5 million in FY10, is mainly on account of the release of provisions for claims. table 5 below shows the breakdown of MIGa’s operating income and net income.
Table 5 Analysis of Operating Income and Net Income ($M)
FY11 FY10 FY09
total Guarantees Issued1 2,099 1,464 1,377
Gross exposure 9,122 7,723 7,297
net exposure 5,239 4,296 3,966
premium Income 75.2 71.8 64.1
premium Ceded (30.6) (30.6) (27.0)
Fees and Commissions 6.3 4.8 6.5
Net Premium Income 50.8 46.0 43.6
Income from Investments 13.9 24.1 36.9
administrative and other expenses (41.1) (36.2) (29.8)
Operating Income 23.6 33.9 50.6
translation Gain (loss) 17.8 (19.5) (17.6)
release of (provision for) Claims 1.7 (30.9) (1.9)
Net Income (Loss) 43.1 (16.5) 31.2
Operating Capital 1,099 1,033 1,044
economic Capital (eC) 374 323 310
ROOC2 (before provisions) 3.8% 1.4% 3.2%
ROOC (after provisions) 3.9% (1.6)% 3.0%
ROCU3 2.6% 3.0% 4.5%
Note: numbers may not add up due to rounding1 Including Cooperative Underwriting Program contracts2 Return on Operating Capital = Net Income/Operating Capital3 Return on Capital Utilized = (Net Premium Income-Administrative and Other Expenses)/Economic Capital Utilized
1 The Insurance Portfolio Reserve is calculated as the 95th percentile loss less the mean loss from the Economic Capital Model
78 | MIGa annual report 2011
FY11 versus FY10MIGa issued $2,099 billion in guarantees during FY11, $635 million higher than in FY10. new issues when combined with lower policy cancel-lations resulted in overall growth of MIGa’s guarantee portfolio and premium income. In FY11, gross exposure and gross premium income increased by $1,399 million and $3.4 million, respectively. premium amounts ceded to reinsurers remained stable at $30.6 million.
MIGa’s investment portfolio generated $13.9 million of investment income in FY11, compared with $24.1 million in FY10. the yield was 1.4 percent in FY11, compared with 2.5 percent in FY10. Investment income was lower this fiscal year due to a lower overall interest rate environment.
administrative and other expenses increased to $41.1 million in FY11, compared with $36.2 million in FY10.
Corporate Governance
General Governance
Board Membership MIGa’s Board of Directors consists of 25 members. In accordance with the Convention establishing MIGa, all members of the Board are elected. Directors are neither officers, nor staff of MIGa. the president serves as the presiding officer, is the only management member of the Board of Directors, and ordinarily has no vote except a deciding vote in the case of an equal division. the Board has established five standing committees which are each chaired by a Director: (i) Committee on Development effectiveness or CoDe, (ii) audit Committee, (iii) Budget Committee, (iv) Human resources Committee or HrC, and (v) Committee on Governance and administrative Matters or CoGaM. the Directors maintain an ethics Committee to consider matters relating to the interpretation or application of the Code of Conduct for Board officials, which took effect in november 1, 2007.
the Directors and their committees operate in continuous session at the principal offices of the World Bank Group, and meet in accordance with the agency’s business needs. each committee’s terms of reference establishes its respective roles and responsibilities. their role is primarily to help the full Board of Directors discharge its oversight responsibilities through in-depth examination of policies and practices.
Audit Committee
Membershipthe audit Committee consists of eight members of the Board of Directors. Membership on the Committee is determined by the Board of Directors, based upon nominations by the Chairman of the Board, following informal consultation with the Directors. In addition, the composition of the Committee is expected to reflect the economic and geographic diversity of MIGa’s member countries. other relevant selection criteria include seniority, continuity, and relevant experience. Some or all of the responsibilities of individual Committee members are performed by their alternates or advisors. Generally, Committee members are appointed for a two-year term; reappointment to a second term, when possible, is desirable for continuity. audit Committee meetings are generally open to any member of the Board who wishes to attend, and non-Committee members of the Board may participate in the discussion but cannot vote. In addition, the Chairman of the audit Committee may speak in that capacity at meetings of the Board of Directors, with respect to discussions held at the audit Committee.
Key Responsibilitiesthe audit Committee has a mandate to assist the Board of Directors in overseeing MIGa’s finances, accounting, risk management, and internal controls. this mandate includes oversight of the integrity of MIGa financial statements and financial reporting related to trust funds. the audit Committee is also responsible for recommending to the Board of Directors the appointment of the external auditor, as well as monitoring the performance and independence of the external auditor. the audit Committee oversees the internal audit function, including reviewing the responsibilities, staffing, annual internal audit plan, and effectiveness of internal audit. In the execution of its role, the Committee discusses with management, the external auditors, and internal auditors financial issues and policies that have an impact on the agency’s financial position and risk-bearing capacity. the audit Committee monitors the evolution of developments in corporate governance and encourages continuous improvement of, and adherence to MIGa’s policies, procedures, and practices at all levels.
Communicationsthe audit Committee communicates regularly with the full Board of Directors through distribution of the following documents:
r the minutes of its meetings r reports of the audit Committee prepared by the Chairman, which document discussions held. these reports are distributed to the Direc-
tors, alternates, World Bank Group Senior Management, and the Senior Management of MIGa r “Statement(s) of the Chairman” and statements issued by other members of the audit Committee r the annual report to the Board of Directors, which provides an overview of the main issues addressed by the committee over the year
the audit Committee’s communications with the external auditor are described in the auditor Independence section.
Executive Sessionsunder the audit Committee’s terms of reference, members of the audit Committee shall meet periodically in separate executive or, where spe-cifically required, closed sessions with management, the auditor General, the external auditor, and the Vice president for Institutional Integrity, to discuss any matters that the Committee or any of the foregoing believes should be discussed privately.
MIGa annual report 2011 | 79
Access to Resources and to Managementthroughout the year, the audit Committee receives a large volume of information, with respect to financial condition, financial statement presen-tations, risk assessment, and risk management, as well as governance and controls. the audit Committee meets both formally and informally throughout the year to discuss finance, accounting, risk management, and internal controls matters. Directors have complete access to man-agement. the audit Committee reviews and discusses with management the quarterly and annual financial statements. the committee also reviews with the external auditor the financial statements prior to their publication and recommends these for approval to the Board of Directors.
the audit Committee has the capacity, under exceptional circumstances, to obtain advice and assistance from outside legal, accounting, or other advisors as deemed appropriate.
Code of Conduct and Business Conduct FrameworkStaff members’ ethical obligations to the institution are embodied in its Core Values and principles of Staff employment. as a member organi-zation, MIGa has adopted the updated World Bank Group Code of Conduct, Living our Values, which is a practical guide to assist staff in making the Bank Group’s Core Values a part of what staff do every day. the Code applies to all staff worldwide and is available on IBrD’s website, www.worldbank.org. all MIGa staff have completed the mandatory training course, which includes an acknowledgement from staff to abide by the tenets of the Code.
In addition to the Code, the business conduct obligations of staff are articulated in the Staff Manual (principles of Staff employment, Staff rules), administrative Manual, and other guidelines. the principles and Staff rules require that all staff avoid or properly manage conflicts of interest. to protect individual staff in MIGa from apparent and real (actual or potential) conflicts of interest, senior managers are required to file an annual confidential financial disclosure statement with the office of ethics and Business Conduct.
Guidance for staff is also provided through programs, training materials, and other resources. Managers are responsible for ensuring that internal systems, policies, and procedures are consistently aligned with MIGa’s business conduct framework. the following World Bank Group units assist in communicating business conduct expectations to staff:
r the office of ethics and Business Conduct (eBC) provides leadership, management and oversight for MIGa’s ethics infrastructure including the ethics Helpline, a consolidated conflicts of interest disclosure/resolution system, financial disclosure, ongoing training to both internal and external audiences, and communication resources. this office has the mandate to review and assist in the resolution of allegations of staff misconduct.
r the Integrity Vice presidency (Int) is charged with investigating allegations of fraud and corruption in projects benefiting from World Bank Group funding or guarantees. It also trains and educates staff and clients in detecting and reporting fraud and corruption.
Both eBC and Int report directly to the president and are composed of professionals from a range of disciplines including financial analysts, researchers, investigators, lawyers, prosecutors, forensic accountants, and staff with operational experience across the World Bank Group. these units maintain comprehensive websites to provide guidance on how to handle concerns.
Auditor Independencethe Board of Directors adopted a set of principles applicable to the appointment of the external auditor for the World Bank Group. Key features of those principles include:
r prohibition of the external auditor from the provision of all non audit-related services r all audit-related services must be pre-approved on a case-by-case basis by the Board of Directors, upon recommendation by the audit Com-
mittee r Mandatory rebidding of the external audit contract every five years r prohibition of any firm serving as external auditors for more than two consecutive five-year terms r Mandatory rotation of the senior partner after five years r an evaluation of the performance of the external auditor at the mid-point of the five year term
external auditors are appointed to a five-year term of service. this is subject to annual reappointment based on the recommendation of the audit Committee and approval of a resolution by the executive Directors. Following a mandatory re-bidding of the external audit contract during FY08, IBrD’s executive Directors approved the appointment of KpMG as the World Bank Group’s auditors for a five-year term commencing FY09.
as standard practice, the external auditor is present as an observer at virtually all audit Committee meetings and is frequently asked to present its perspective on issues. In addition, the audit Committee meets periodically with the external auditor in private sessions without the presence of management. Communication between the external auditor and the audit Committee is ongoing, as frequently as is deemed necessary by either party. MIGa’s external auditors follow the communication requirements with audit committees set out under uS Generally accepted auditing Standards and International Standards on auditing. In keeping with these standards, significant formal communications include:
r Quarterly and annual financial statement reporting r annual appointment of the external auditors r presentation of the external audit plan r presentation of control recommendations and discussion of the Internal Control over Financial reporting (ICFr) attestation and report r presentation of a statement regarding independence
In addition to committee meetings, individual members of the audit Committee have independent access to the external auditor.
80 | MIGa annual report 2011
Management’s Report Regarding Effectiveness of Internal Controls Over External Financial Reporting
MIGa annual report 2011 | 81
Management’s Report Regarding Effectiveness of Internal Controls Over External Financial Reporting (cont’d)
82 | MIGa annual report 2011
Report of Independent Auditors on Management Assertion Regarding Effectiveness of Internal Controls Over External Financial Reporting
MIGa annual report 2011 | 83
Report Of Independent Auditors on Management Assertion Regarding Effectiveness Of Internal Controls Over External Financial Reporting (cont’d)
84 | MIGa annual report 2011
Independent Auditors’ Report
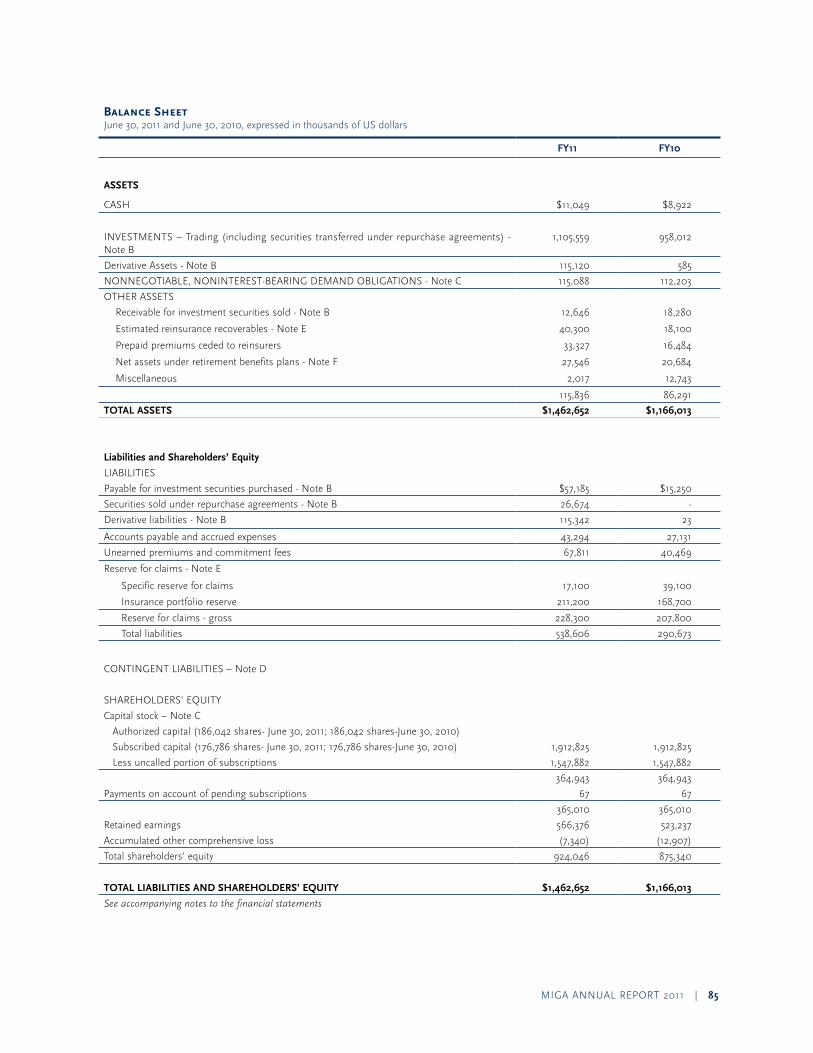
MIGa annual report 2011 | 85
Balance Sheet June 30, 2011 and June 30, 2010, expressed in thousands of uS dollars
FY11 FY10
ASSETS
CaSH $11,049 $8,922
InVeStMentS – trading (including securities transferred under repurchase agreements) - note B
1,105,559 958,012
Derivative assets - note B 115,120 585
nonneGotIaBle, nonIntereSt-BearInG DeManD oBlIGatIonS - note C 115,088 112,203
otHer aSSetS
receivable for investment securities sold - note B 12,646 18,280
estimated reinsurance recoverables - note e 40,300 18,100
prepaid premiums ceded to reinsurers 33,327 16,484
net assets under retirement benefits plans - note F 27,546 20,684
Miscellaneous 2,017 12,743
115,836 86,291
TOTAL ASSETS $1,462,652 $1,166,013
Liabilities and Shareholders’ Equity
lIaBIlItIeS
payable for investment securities purchased - note B $57,185 $15,250
Securities sold under repurchase agreements - note B 26,674 -
Derivative liabilities - note B 115,342 23
accounts payable and accrued expenses 43,294 27,131
unearned premiums and commitment fees 67,811 40,469
reserve for claims - note e
Specific reserve for claims 17,100 39,100
Insurance portfolio reserve 211,200 168,700
reserve for claims - gross 228,300 207,800
total liabilities 538,606 290,673
ContInGent lIaBIlItIeS – note D
SHareHolDerS’ eQuItY
Capital stock – note C
authorized capital (186,042 shares- June 30, 2011; 186,042 shares-June 30, 2010)
Subscribed capital (176,786 shares- June 30, 2011; 176,786 shares-June 30, 2010) 1,912,825 1,912,825
less uncalled portion of subscriptions 1,547,882 1,547,882
364,943 364,943
payments on account of pending subscriptions 67 67
365,010 365,010
retained earnings 566,376 523,237
accumulated other comprehensive loss (7,340) (12,907)
total shareholders’ equity 924,046 875,340
TOTAL LIABILITIES AND SHAREHOLDERS’ EQUITY $1,462,652 $1,166,013
See accompanying notes to the financial statements
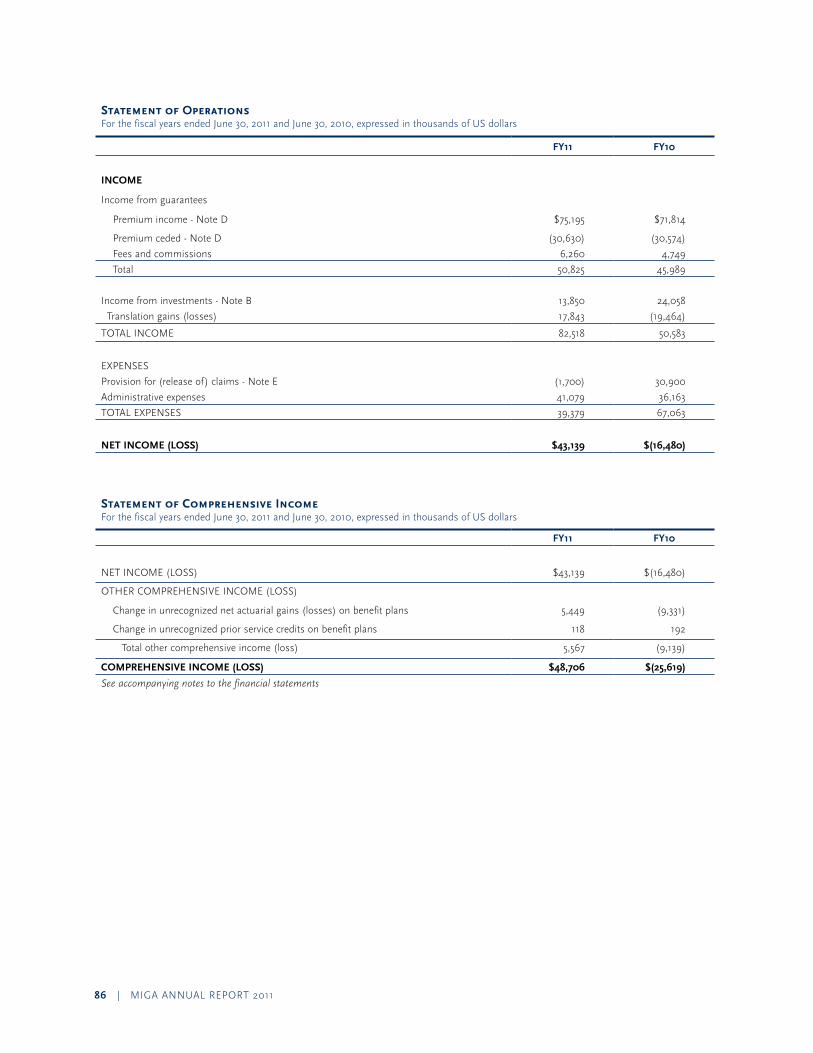
86 | MIGa annual report 2011
Statement of Operations For the fiscal years ended June 30, 2011 and June 30, 2010, expressed in thousands of uS dollars
FY11 FY10
INCOME
Income from guarantees
premium income - note D $75,195 $71,814
premium ceded - note D (30,630) (30,574)
Fees and commissions 6,260 4,749
total 50,825 45,989
Income from investments - note B 13,850 24,058
translation gains (losses) 17,843 (19,464)
total InCoMe 82,518 50,583
eXpenSeS
provision for (release of) claims - note e (1,700) 30,900
administrative expenses 41,079 36,163
total eXpenSeS 39,379 67,063
NET INCOME (LOSS) $43,139 $(16,480)
Statement of Comprehensive Income For the fiscal years ended June 30, 2011 and June 30, 2010, expressed in thousands of uS dollars
FY11 FY10
net InCoMe (loSS) $43,139 $(16,480)
otHer CoMpreHenSIVe InCoMe (loSS)
Change in unrecognized net actuarial gains (losses) on benefit plans 5,449 (9,331)
Change in unrecognized prior service credits on benefit plans 118 192
total other comprehensive income (loss) 5,567 (9,139)
COMPREHENSIVE INCOME (LOSS) $48,706 $(25,619)
See accompanying notes to the financial statements
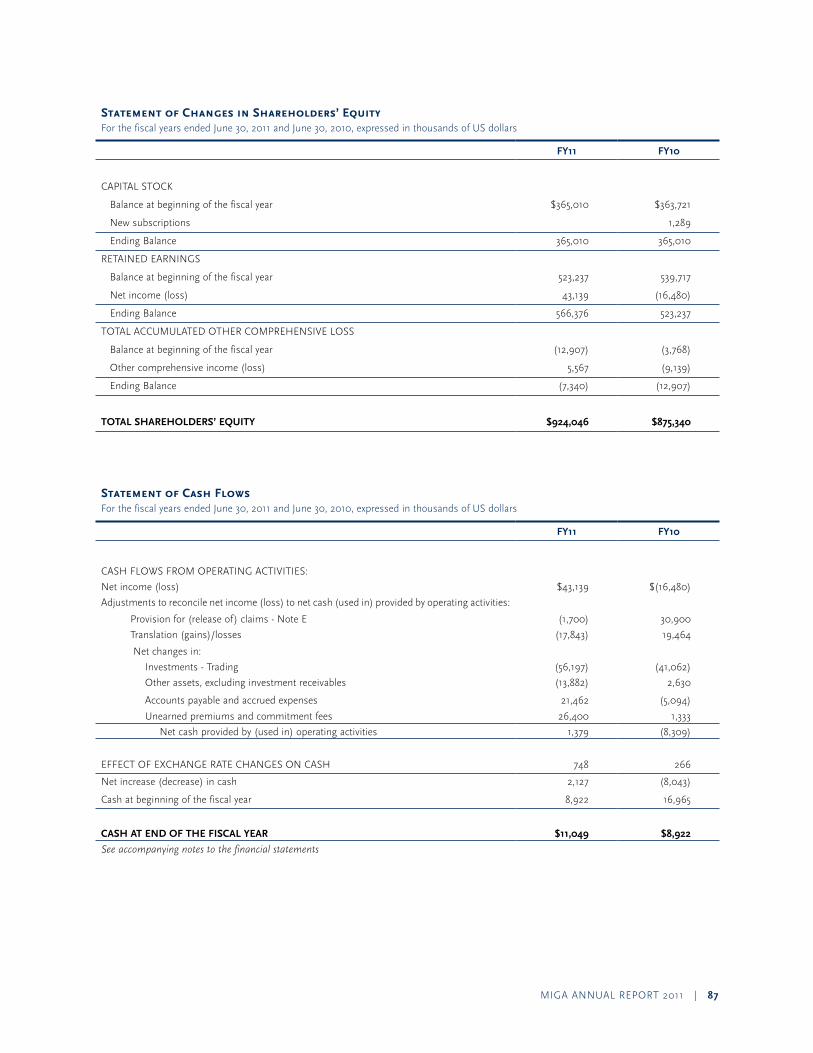
MIGa annual report 2011 | 87
Statement of Changes in Shareholders’ Equity For the fiscal years ended June 30, 2011 and June 30, 2010, expressed in thousands of uS dollars
FY11 FY10
CapItal StoCK
Balance at beginning of the fiscal year $365,010 $363,721
new subscriptions 1,289
ending Balance 365,010 365,010
retaIneD earnInGS
Balance at beginning of the fiscal year 523,237 539,717
net income (loss) 43,139 (16,480)
ending Balance 566,376 523,237
total aCCuMulateD otHer CoMpreHenSIVe loSS
Balance at beginning of the fiscal year (12,907) (3,768)
other comprehensive income (loss) 5,567 (9,139)
ending Balance (7,340) (12,907)
TOTAL SHAREHOLDERS’ EQUITY $924,046 $875,340
Statement of Cash Flows For the fiscal years ended June 30, 2011 and June 30, 2010, expressed in thousands of uS dollars
FY11 FY10
CaSH FloWS FroM operatInG aCtIVItIeS:
net income (loss) $43,139 $(16,480)
adjustments to reconcile net income (loss) to net cash (used in) provided by operating activities:
provision for (release of) claims - note e (1,700) 30,900
translation (gains)/losses (17,843) 19,464
net changes in:
Investments - trading (56,197) (41,062)
other assets, excluding investment receivables (13,882) 2,630
accounts payable and accrued expenses 21,462 (5,094)
unearned premiums and commitment fees 26,400 1,333
net cash provided by (used in) operating activities 1,379 (8,309)
eFFeCt oF eXCHanGe rate CHanGeS on CaSH 748 266
net increase (decrease) in cash 2,127 (8,043)
Cash at beginning of the fiscal year 8,922 16,965
CASH AT END OF THE FISCAL YEAR $11,049 $8,922
See accompanying notes to the financial statements
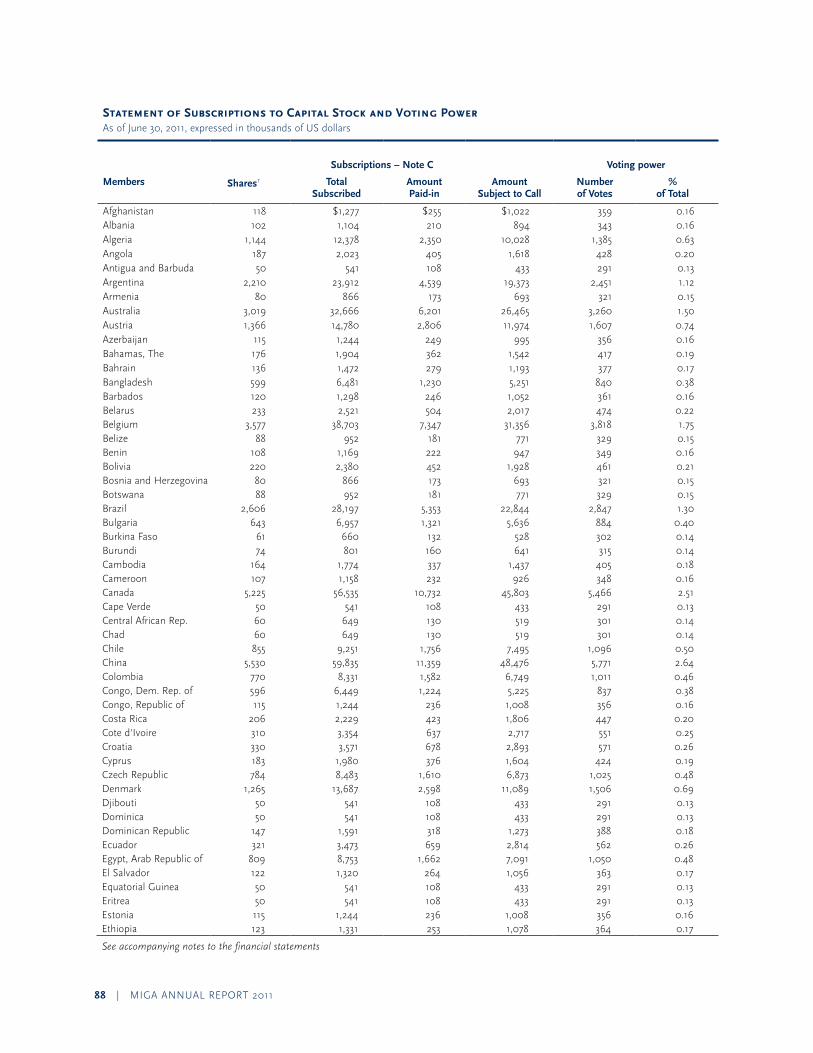
88 | MIGa annual report 2011
Statement of Subscriptions to Capital Stock and Voting Power as of June 30, 2011, expressed in thousands of uS dollars
Subscriptions – Note C Voting power
Members Shares1 Total Subscribed
Amount Paid-in
Amount Subject to Call
Numberof Votes
% of Total
afghanistan 118 $1,277 $255 $1,022 359 0.16 albania 102 1,104 210 894 343 0.16 algeria 1,144 12,378 2,350 10,028 1,385 0.63 angola 187 2,023 405 1,618 428 0.20 antigua and Barbuda 50 541 108 433 291 0.13 argentina 2,210 23,912 4,539 19,373 2,451 1.12 armenia 80 866 173 693 321 0.15 australia 3,019 32,666 6,201 26,465 3,260 1.50 austria 1,366 14,780 2,806 11,974 1,607 0.74 azerbaijan 115 1,244 249 995 356 0.16 Bahamas, the 176 1,904 362 1,542 417 0.19 Bahrain 136 1,472 279 1,193 377 0.17 Bangladesh 599 6,481 1,230 5,251 840 0.38 Barbados 120 1,298 246 1,052 361 0.16 Belarus 233 2,521 504 2,017 474 0.22 Belgium 3,577 38,703 7,347 31,356 3,818 1.75 Belize 88 952 181 771 329 0.15 Benin 108 1,169 222 947 349 0.16 Bolivia 220 2,380 452 1,928 461 0.21 Bosnia and Herzegovina 80 866 173 693 321 0.15 Botswana 88 952 181 771 329 0.15 Brazil 2,606 28,197 5,353 22,844 2,847 1.30 Bulgaria 643 6,957 1,321 5,636 884 0.40 Burkina Faso 61 660 132 528 302 0.14 Burundi 74 801 160 641 315 0.14 Cambodia 164 1,774 337 1,437 405 0.18 Cameroon 107 1,158 232 926 348 0.16 Canada 5,225 56,535 10,732 45,803 5,466 2.51 Cape Verde 50 541 108 433 291 0.13 Central african rep. 60 649 130 519 301 0.14 Chad 60 649 130 519 301 0.14 Chile 855 9,251 1,756 7,495 1,096 0.50 China 5,530 59,835 11,359 48,476 5,771 2.64 Colombia 770 8,331 1,582 6,749 1,011 0.46 Congo, Dem. rep. of 596 6,449 1,224 5,225 837 0.38 Congo, republic of 115 1,244 236 1,008 356 0.16 Costa rica 206 2,229 423 1,806 447 0.20 Cote d'Ivoire 310 3,354 637 2,717 551 0.25 Croatia 330 3,571 678 2,893 571 0.26 Cyprus 183 1,980 376 1,604 424 0.19 Czech republic 784 8,483 1,610 6,873 1,025 0.48 Denmark 1,265 13,687 2,598 11,089 1,506 0.69 Djibouti 50 541 108 433 291 0.13 Dominica 50 541 108 433 291 0.13 Dominican republic 147 1,591 318 1,273 388 0.18 ecuador 321 3,473 659 2,814 562 0.26 egypt, arab republic of 809 8,753 1,662 7,091 1,050 0.48 el Salvador 122 1,320 264 1,056 363 0.17 equatorial Guinea 50 541 108 433 291 0.13 eritrea 50 541 108 433 291 0.13 estonia 115 1,244 236 1,008 356 0.16 ethiopia 123 1,331 253 1,078 364 0.17
See accompanying notes to the financial statements
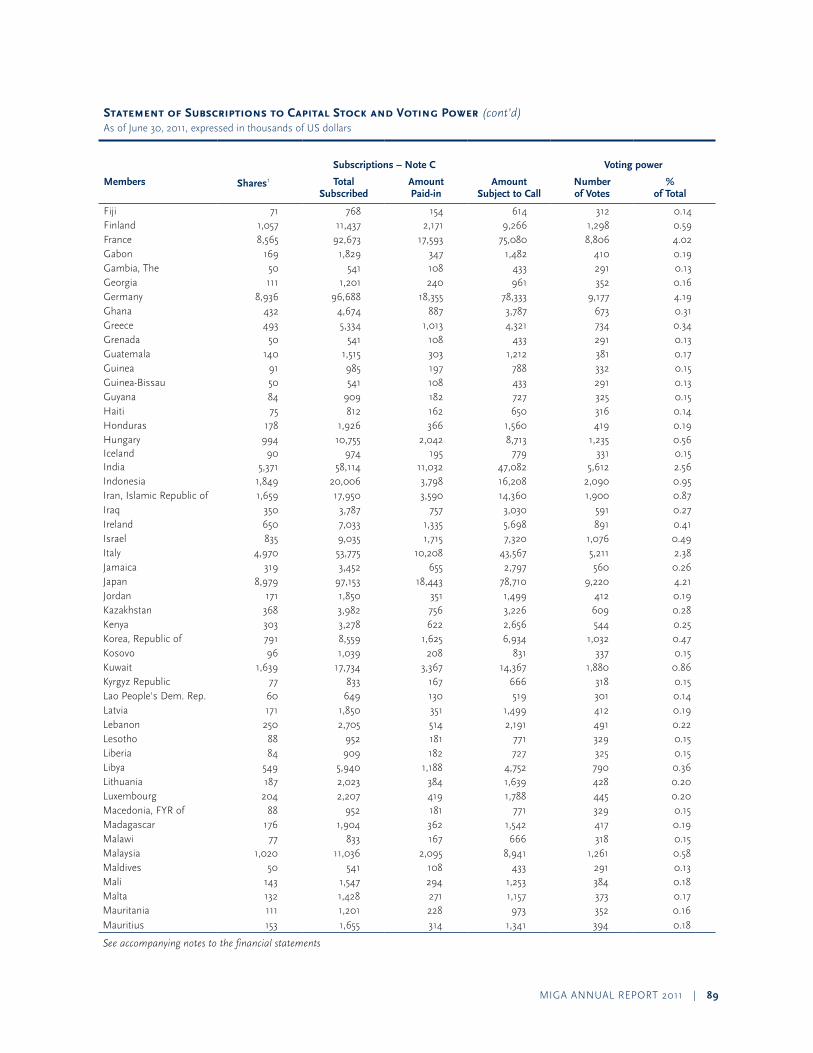
MIGa annual report 2011 | 89
Statement of Subscriptions to Capital Stock and Voting Power (cont’d)as of June 30, 2011, expressed in thousands of uS dollars
Subscriptions – Note C Voting power
Members Shares1 Total Subscribed
Amount Paid-in
Amount Subject to Call
Numberof Votes
% of Total
Fiji 71 768 154 614 312 0.14 Finland 1,057 11,437 2,171 9,266 1,298 0.59 France 8,565 92,673 17,593 75,080 8,806 4.02 Gabon 169 1,829 347 1,482 410 0.19 Gambia, the 50 541 108 433 291 0.13 Georgia 111 1,201 240 961 352 0.16 Germany 8,936 96,688 18,355 78,333 9,177 4.19 Ghana 432 4,674 887 3,787 673 0.31 Greece 493 5,334 1,013 4,321 734 0.34 Grenada 50 541 108 433 291 0.13 Guatemala 140 1,515 303 1,212 381 0.17 Guinea 91 985 197 788 332 0.15 Guinea-Bissau 50 541 108 433 291 0.13 Guyana 84 909 182 727 325 0.15 Haiti 75 812 162 650 316 0.14 Honduras 178 1,926 366 1,560 419 0.19 Hungary 994 10,755 2,042 8,713 1,235 0.56 Iceland 90 974 195 779 331 0.15 India 5,371 58,114 11,032 47,082 5,612 2.56 Indonesia 1,849 20,006 3,798 16,208 2,090 0.95 Iran, Islamic republic of 1,659 17,950 3,590 14,360 1,900 0.87 Iraq 350 3,787 757 3,030 591 0.27 Ireland 650 7,033 1,335 5,698 891 0.41 Israel 835 9,035 1,715 7,320 1,076 0.49 Italy 4,970 53,775 10,208 43,567 5,211 2.38 Jamaica 319 3,452 655 2,797 560 0.26 Japan 8,979 97,153 18,443 78,710 9,220 4.21 Jordan 171 1,850 351 1,499 412 0.19 Kazakhstan 368 3,982 756 3,226 609 0.28 Kenya 303 3,278 622 2,656 544 0.25 Korea, republic of 791 8,559 1,625 6,934 1,032 0.47 Kosovo 96 1,039 208 831 337 0.15 Kuwait 1,639 17,734 3,367 14,367 1,880 0.86 Kyrgyz republic 77 833 167 666 318 0.15 lao people's Dem. rep. 60 649 130 519 301 0.14 latvia 171 1,850 351 1,499 412 0.19 lebanon 250 2,705 514 2,191 491 0.22 lesotho 88 952 181 771 329 0.15 liberia 84 909 182 727 325 0.15 libya 549 5,940 1,188 4,752 790 0.36 lithuania 187 2,023 384 1,639 428 0.20 luxembourg 204 2,207 419 1,788 445 0.20 Macedonia, FYr of 88 952 181 771 329 0.15 Madagascar 176 1,904 362 1,542 417 0.19 Malawi 77 833 167 666 318 0.15 Malaysia 1,020 11,036 2,095 8,941 1,261 0.58 Maldives 50 541 108 433 291 0.13 Mali 143 1,547 294 1,253 384 0.18 Malta 132 1,428 271 1,157 373 0.17 Mauritania 111 1,201 228 973 352 0.16 Mauritius 153 1,655 314 1,341 394 0.18
See accompanying notes to the financial statements
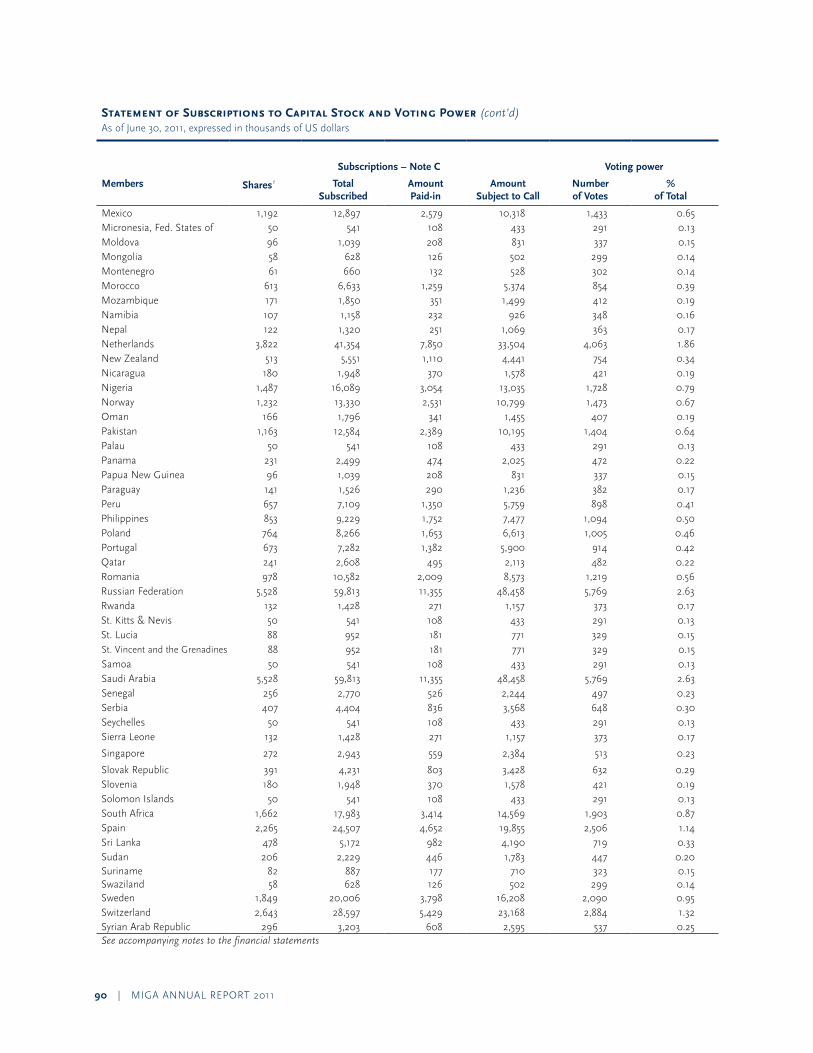
90 | MIGa annual report 2011
Statement of Subscriptions to Capital Stock and Voting Power (cont’d)as of June 30, 2011, expressed in thousands of uS dollars
Subscriptions – Note C Voting power
Members Shares1 Total Subscribed
Amount Paid-in
Amount Subject to Call
Numberof Votes
% of Total
Mexico 1,192 12,897 2,579 10,318 1,433 0.65 Micronesia, Fed. States of 50 541 108 433 291 0.13 Moldova 96 1,039 208 831 337 0.15 Mongolia 58 628 126 502 299 0.14 Montenegro 61 660 132 528 302 0.14 Morocco 613 6,633 1,259 5,374 854 0.39 Mozambique 171 1,850 351 1,499 412 0.19 namibia 107 1,158 232 926 348 0.16 nepal 122 1,320 251 1,069 363 0.17 netherlands 3,822 41,354 7,850 33,504 4,063 1.86 new Zealand 513 5,551 1,110 4,441 754 0.34 nicaragua 180 1,948 370 1,578 421 0.19 nigeria 1,487 16,089 3,054 13,035 1,728 0.79 norway 1,232 13,330 2,531 10,799 1,473 0.67 oman 166 1,796 341 1,455 407 0.19 pakistan 1,163 12,584 2,389 10,195 1,404 0.64 palau 50 541 108 433 291 0.13 panama 231 2,499 474 2,025 472 0.22 papua new Guinea 96 1,039 208 831 337 0.15 paraguay 141 1,526 290 1,236 382 0.17 peru 657 7,109 1,350 5,759 898 0.41 philippines 853 9,229 1,752 7,477 1,094 0.50 poland 764 8,266 1,653 6,613 1,005 0.46 portugal 673 7,282 1,382 5,900 914 0.42 Qatar 241 2,608 495 2,113 482 0.22 romania 978 10,582 2,009 8,573 1,219 0.56 russian Federation 5,528 59,813 11,355 48,458 5,769 2.63 rwanda 132 1,428 271 1,157 373 0.17 St. Kitts & nevis 50 541 108 433 291 0.13 St. lucia 88 952 181 771 329 0.15 St. Vincent and the Grenadines 88 952 181 771 329 0.15 Samoa 50 541 108 433 291 0.13 Saudi arabia 5,528 59,813 11,355 48,458 5,769 2.63 Senegal 256 2,770 526 2,244 497 0.23 Serbia 407 4,404 836 3,568 648 0.30 Seychelles 50 541 108 433 291 0.13 Sierra leone 132 1,428 271 1,157 373 0.17
Singapore 272 2,943 559 2,384 513 0.23
Slovak republic 391 4,231 803 3,428 632 0.29 Slovenia 180 1,948 370 1,578 421 0.19 Solomon Islands 50 541 108 433 291 0.13 South africa 1,662 17,983 3,414 14,569 1,903 0.87 Spain 2,265 24,507 4,652 19,855 2,506 1.14 Sri lanka 478 5,172 982 4,190 719 0.33 Sudan 206 2,229 446 1,783 447 0.20 Suriname 82 887 177 710 323 0.15 Swaziland 58 628 126 502 299 0.14 Sweden 1,849 20,006 3,798 16,208 2,090 0.95 Switzerland 2,643 28,597 5,429 23,168 2,884 1.32 Syrian arab republic 296 3,203 608 2,595 537 0.25 See accompanying notes to the financial statements
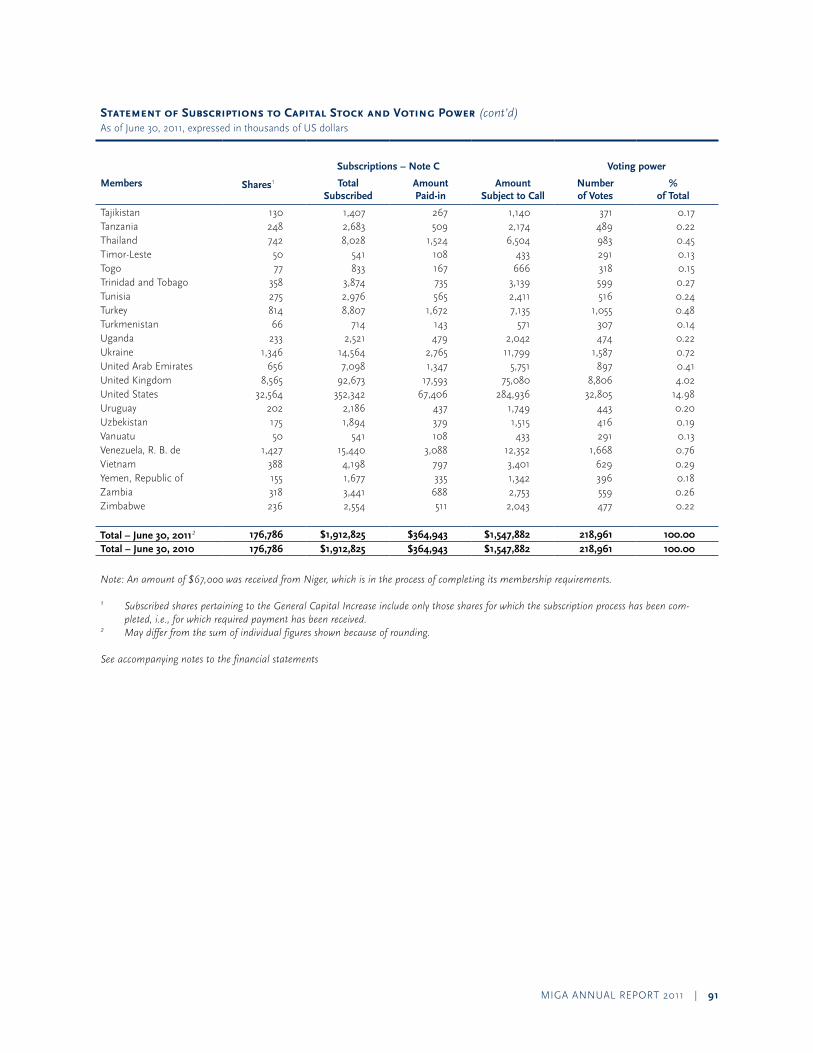
MIGa annual report 2011 | 91
Statement of Subscriptions to Capital Stock and Voting Power (cont’d)as of June 30, 2011, expressed in thousands of uS dollars
Subscriptions – Note C Voting power
Members Shares1 Total Subscribed
Amount Paid-in
Amount Subject to Call
Numberof Votes
% of Total
tajikistan 130 1,407 267 1,140 371 0.17 tanzania 248 2,683 509 2,174 489 0.22 thailand 742 8,028 1,524 6,504 983 0.45 timor-leste 50 541 108 433 291 0.13 togo 77 833 167 666 318 0.15 trinidad and tobago 358 3,874 735 3,139 599 0.27 tunisia 275 2,976 565 2,411 516 0.24 turkey 814 8,807 1,672 7,135 1,055 0.48 turkmenistan 66 714 143 571 307 0.14 uganda 233 2,521 479 2,042 474 0.22 ukraine 1,346 14,564 2,765 11,799 1,587 0.72 united arab emirates 656 7,098 1,347 5,751 897 0.41 united Kingdom 8,565 92,673 17,593 75,080 8,806 4.02 united States 32,564 352,342 67,406 284,936 32,805 14.98 uruguay 202 2,186 437 1,749 443 0.20 uzbekistan 175 1,894 379 1,515 416 0.19 Vanuatu 50 541 108 433 291 0.13 Venezuela, r. B. de 1,427 15,440 3,088 12,352 1,668 0.76 Vietnam 388 4,198 797 3,401 629 0.29 Yemen, republic of 155 1,677 335 1,342 396 0.18 Zambia 318 3,441 688 2,753 559 0.26 Zimbabwe 236 2,554 511 2,043 477 0.22
Total – June 30, 20112 176,786 $1,912,825 $364,943 $1,547,882 218,961 100.00 Total – June 30, 2010 176,786 $1,912,825 $364,943 $1,547,882 218,961 100.00
Note: An amount of $67,000 was received from Niger, which is in the process of completing its membership requirements.
1 Subscribed shares pertaining to the General Capital Increase include only those shares for which the subscription process has been com-pleted, i.e., for which required payment has been received.
2 May differ from the sum of individual figures shown because of rounding.
See accompanying notes to the financial statements
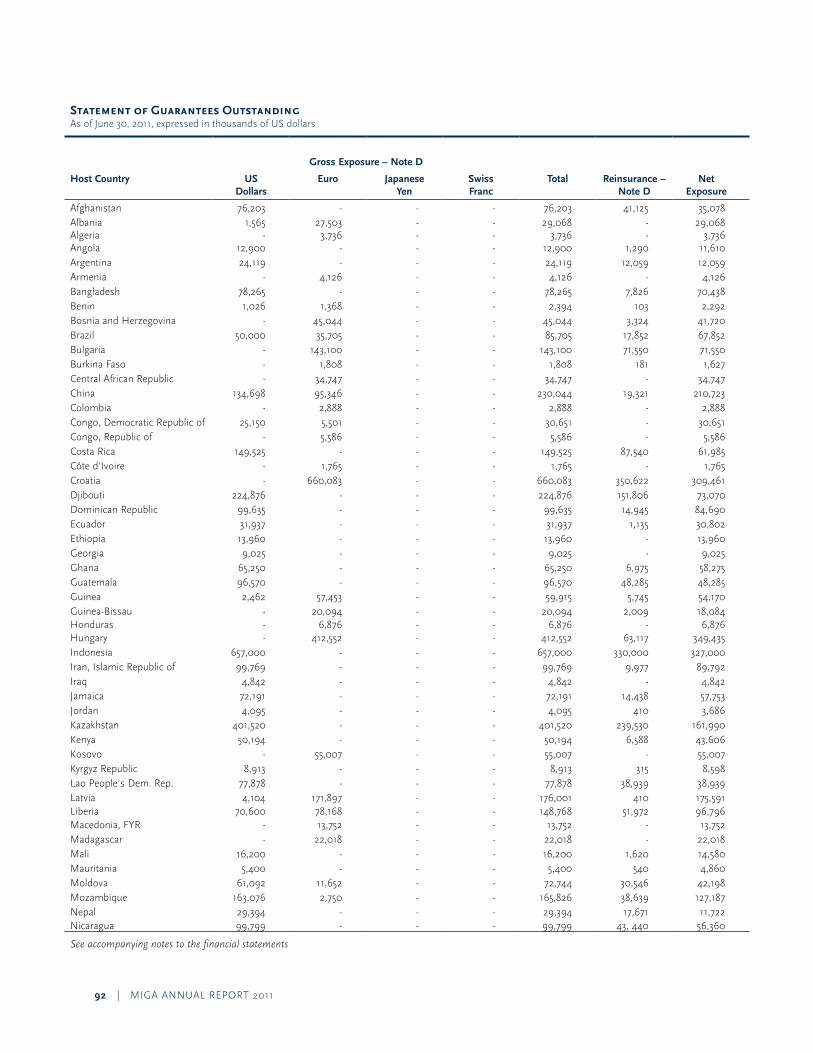
92 | MIGa annual report 2011
Statement of Guarantees Outstanding as of June 30, 2011, expressed in thousands of uS dollars
Gross Exposure – Note D
Host Country US Dollars
Euro Japanese Yen
Swiss Franc
Total Reinsurance – Note D
NetExposure
afghanistan 76,203 - - - 76,203 41,125 35,078albania 1,565 27,503 - - 29,068 - 29,068algeria - 3,736 - - 3,736 - 3,736angola 12,900 - - - 12,900 1,290 11,610argentina 24,119 - - - 24,119 12,059 12,059armenia - 4,126 - - 4,126 - 4,126Bangladesh 78,265 - - - 78,265 7,826 70,438Benin 1,026 1,368 - - 2,394 103 2,292Bosnia and Herzegovina - 45,044 - - 45,044 3,324 41,720Brazil 50,000 35,705 - - 85,705 17,852 67,852Bulgaria - 143,100 - - 143,100 71,550 71,550Burkina Faso - 1,808 - - 1,808 181 1,627Central african republic - 34,747 - - 34,747 - 34,747China 134,698 95,346 - - 230,044 19,321 210,723Colombia - 2,888 - - 2,888 - 2,888Congo, Democratic republic of 25,150 5,501 - - 30,651 - 30,651Congo, republic of - 5,586 - - 5,586 - 5,586Costa rica 149,525 - - - 149,525 87,540 61,985Côte d'Ivoire - 1,765 - - 1,765 - 1,765Croatia - 660,083 - - 660,083 350,622 309,461Djibouti 224,876 - - - 224,876 151,806 73,070Dominican republic 99,635 - - - 99,635 14,945 84,690ecuador 31,937 - - - 31,937 1,135 30,802ethiopia 13,960 - - - 13,960 - 13,960Georgia 9,025 - - - 9,025 - 9,025Ghana 65,250 - - - 65,250 6,975 58,275Guatemala 96,570 - - - 96,570 48,285 48,285Guinea 2,462 57,453 - - 59,915 5,745 54,170Guinea-Bissau - 20,094 - - 20,094 2,009 18,084Honduras - 6,876 - - 6,876 - 6,876Hungary - 412,552 - - 412,552 63,117 349,435Indonesia 657,000 - - - 657,000 330,000 327,000Iran, Islamic republic of 99,769 - - - 99,769 9,977 89,792Iraq 4,842 - - - 4,842 - 4,842Jamaica 72,191 - - - 72,191 14,438 57,753Jordan 4,095 - - - 4,095 410 3,686Kazakhstan 401,520 - - - 401,520 239,530 161,990 Kenya 50,194 - - - 50,194 6,588 43,606 Kosovo - 55,007 - - 55,007 - 55,007 Kyrgyz republic 8,913 - - - 8,913 315 8,598 lao people's Dem. rep. 77,878 - - - 77,878 38,939 38,939 latvia 4,104 171,897 - - 176,001 410 175,591 liberia 70,600 78,168 - - 148,768 51,972 96,796 Macedonia, FYr - 13,752 - - 13,752 - 13,752 Madagascar - 22,018 - - 22,018 - 22,018 Mali 16,200 - - - 16,200 1,620 14,580 Mauritania 5,400 - - - 5,400 540 4,860 Moldova 61,092 11,652 - - 72,744 30,546 42,198 Mozambique 163,076 2,750 - - 165,826 38,639 127,187 nepal 29,394 - - - 29,394 17,671 11,722 nicaragua 99,799 - - - 99,799 43, 440 56,360
See accompanying notes to the financial statements
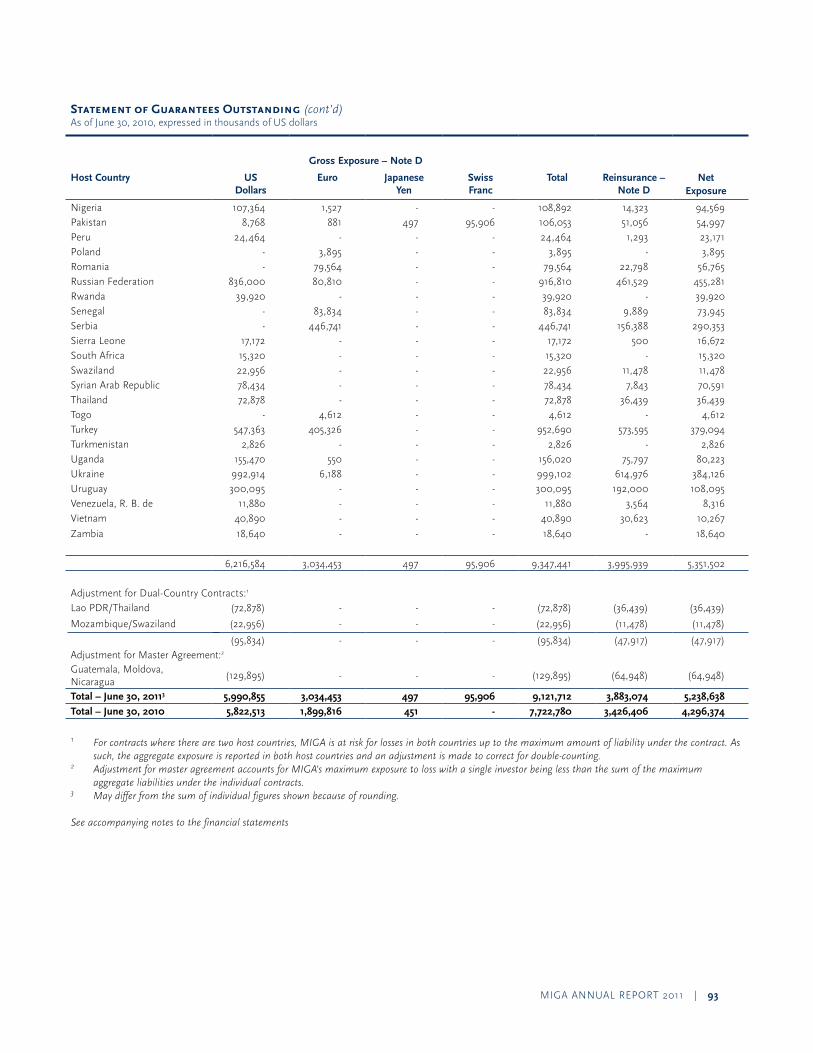
MIGa annual report 2011 | 93
Statement of Guarantees Outstanding (cont’d) as of June 30, 2010, expressed in thousands of uS dollars
Gross Exposure – Note D
Host Country US Dollars
Euro Japanese Yen
Swiss Franc
Total Reinsurance – Note D
NetExposure
nigeria 107,364 1,527 - - 108,892 14,323 94,569 pakistan 8,768 881 497 95,906 106,053 51,056 54,997 peru 24,464 - - - 24,464 1,293 23,171 poland - 3,895 - - 3,895 - 3,895 romania - 79,564 - - 79,564 22,798 56,765 russian Federation 836,000 80,810 - - 916,810 461,529 455,281 rwanda 39,920 - - - 39,920 - 39,920 Senegal - 83,834 - - 83,834 9,889 73,945 Serbia - 446,741 - - 446,741 156,388 290,353 Sierra leone 17,172 - - - 17,172 500 16,672 South africa 15,320 - - - 15,320 - 15,320 Swaziland 22,956 - - - 22,956 11,478 11,478 Syrian arab republic 78,434 - - - 78,434 7,843 70,591 thailand 72,878 - - - 72,878 36,439 36,439 togo - 4,612 - - 4,612 - 4,612 turkey 547,363 405,326 - - 952,690 573,595 379,094 turkmenistan 2,826 - - - 2,826 - 2,826 uganda 155,470 550 - - 156,020 75,797 80,223 ukraine 992,914 6,188 - - 999,102 614,976 384,126 uruguay 300,095 - - - 300,095 192,000 108,095 Venezuela, r. B. de 11,880 - - - 11,880 3,564 8,316 Vietnam 40,890 - - - 40,890 30,623 10,267
Zambia 18,640 - - - 18,640 - 18,640
6,216,584 3,034,453 497 95,906 9,347,441 3,995,939 5,351,502
adjustment for Dual-Country Contracts:1
lao pDr/thailand (72,878) - - - (72,878) (36,439) (36,439)
Mozambique/Swaziland (22,956) - - - (22,956) (11,478) (11,478)
(95,834) - - - (95,834) (47,917) (47,917)adjustment for Master agreement:2
Guatemala, Moldova, nicaragua
(129,895) - - - (129,895) (64,948) (64,948)
Total – June 30, 20113 5,990,855 3,034,453 497 95,906 9,121,712 3,883,074 5,238,638
Total – June 30, 2010 5,822,513 1,899,816 451 - 7,722,780 3,426,406 4,296,374
1 For contracts where there are two host countries, MIGA is at risk for losses in both countries up to the maximum amount of liability under the contract. As such, the aggregate exposure is reported in both host countries and an adjustment is made to correct for double-counting.
2 Adjustment for master agreement accounts for MIGA’s maximum exposure to loss with a single investor being less than the sum of the maximum aggregate liabilities under the individual contracts.
3 May differ from the sum of individual figures shown because of rounding.
See accompanying notes to the financial statements
94 | MIGa annual report 2011
Notes to Financial Statements
Purpose
the Multilateral Investment Guarantee agency (MIGa), established on april 12, 1988 and located in Washington D.C., is a member of the World Bank Group which also includes the International Bank for reconstruction and Development (IBrD), the International Finance Corporation (IFC), the International Development association (IDa), and the International Center for Settlement of Investment Disputes (ICSID). MIGa’s activities are closely coordinated with and complement the overall development objectives of the other World Bank institutions. MIGa is designed to help developing countries attract productive foreign investment by both private investors and commercially operated public sector companies. Its facilities include guarantees or insurance against noncommercial risks and a program of advisory services and technical assistance to support member countries’ efforts to attract and retain foreign direct investment.
Note A: Summary of Significant Accounting and Related Policies
Basis of Preparation
MIGa’s financial statements have been prepared in accordance with International Financial reporting Standards (IFrS) issued by the International accounting Standards Board (IaSB) and with accounting principles generally accepted in the united States of america (u.S. Gaap). the policy adopted is that considered most appropriate to the circumstances of MIGa having regard to its legal requirements and to the practices of other international insurance entities.
on august 4, 2011, the executive Vice president and the Chief Financial officer authorized the financial statements for issue. MIGa has evaluated subsequent events through august 4, 2011, the date of issue.
Accounting and Reporting Developments
the IaSB issued IFrS 4, Insurance Contracts in March 2004 to achieve convergence of widely varying insurance industry accounting practices around the world. the IaSB has divided the insurance project into two phases. In line with the requirements of phase 1, MIGa included addi-tional disclosures beginning the quarter ended September 30, 2005 that identify and explain the amounts in the financial statements arising from insurance contracts. In July 2010, the IaSB released an exposure draft on phase 2 of the project addressing issues on insurance accounting and is expecting to issue a standard in 2011. the Financial accounting Standard Board (FaSB) is deliberating the accounting for insurance contracts in a joint effort with the IaSB and is expected to issue an exposure draft and a standard in 2012.
In november 2009, IaSB issued IFrS 9, Financial Instruments as a first step as part of a wider project to replace IaS 39, Financial Instruments: Recognition and Measurement. the november 2009 issuance of IFrS 9 focuses on the classification and measurement of financial assets where it retains but simplifies the mixed measurement model and establishes two primary measurement categories for financial assets: amortized cost and fair value. the basis of classification depends on the entity’s business model and the contractual cash flow characteristics of the financial asset. requirements for financial liabilities were added to IFrS 9 in october 2010, most of which were carried forward unchanged from IaS 39. However, some changes were made to the fair value option for financial liabilities to address the issue of own credit risk. the standard is effective for annual periods beginning on or after January 1, 2015, but may be applied earlier. MIGa is currently assessing the impact of this standard on its financial statements.
In May 2011, the FaSB issued aSu 2011-04, Fair Value Measurement (Topic 820): Amendments to Achieve Common Fair Value Measurement and Disclosure Requirements in U.S. GAAP and International Financial Reporting Standards (IFRS).the amendments result in common fair value mea-surement and disclosure requirements in u.S. Gaap and IFrS. While many of the amendments are changes in wording that are not expected to significantly impact current practice, some of the amendments change the existing fair value measurement and disclosure requirements. this aSu is effective for interim and annual periods beginning after December 15, 2011. MIGa is currently evaluating the impact on its financial statements.
In June 2011, the IaSB issued an amended employee benefits standard IAS 19 Employee Benefits, which has an effective date of annual periods beginning on or after January 1, 2013. the amended standard is expected to impact accounting around the funded defined benefit plans primarily driven by a new approach to calculating and presenting the net interest income or expense on the net defined benefit liability or asset. the standard will require entities to present the net interest income or expense on the net defined benefit liability or asset as a single net interest figure, based on the discount rate that is used to measure the defined benefit obligations. MIGa will be assessing the impact of this standard on its financial statements.
Differences between US GAAP and IFRS
the Compensation Retirement Benefits Topic of the FaSB aSC 715-30 requires employers to recognize on their balance sheets the funded status of their defined benefit postretirement plans, measured as the difference between the fair value of the plan assets and the benefit obligation. Gains or losses and prior service costs or credits that arise during the period are recognized as part of other Comprehensive Income, to the extent they
MIGa annual report 2011 | 95
are not recognized as components of the net periodic benefit cost. additionally, aSC 715-30 requires unrecognized net actuarial gains or losses and unrecognized prior service costs to be recognized in the ending balance of accumulated other Comprehensive Income. these amounts will be adjusted as they are subsequently recognized as components of net periodic benefit cost.
MIGa’s accounting policy under International Accounting Standards (IAS) 19, Employee Benefits is to recognize all actuarial gains and losses in the period in which they occur—but outside profit or loss—“in a statement of changes in shareholder’s equity.” this is a permitted alternative available under IaS 19 and MIGa considers that this will allow it to show the over/under funded position on the balance sheet thereby making its financial statements more relevant and complete. aSC 715-30 and IaS 19 differ in the treatment of amortization of unrecognized actuarial gains or losses. aSC 715-30 requires that the unrecognized actuarial gains or losses to be amortized to the Statement of operations, and IaS 19 requires the unrecognized actuarial gains or losses to be recognized in other Comprehensive Income and immediately recognized in retained earnings. MIGa does not believe the differences are material.
Use of Estimates
the preparation of financial statements in conformity with IFrS and u.S. Gaap requires management to make estimates and assumptions that affect the amounts reported in the financial statements. actual results could differ from these estimates.
Significant judgments have been made in areas which management views as most critical with respect to the establishment of its loss reserves, the determination of net periodic cost/income from pension and other postretirement benefits plans, and the present value of benefit obligations.
the significant accounting policies employed by MIGa are summarized below.
Investments MIGa manages its investment portfolio both for the purpose of providing liquidity for potential claims and for capital growth. MIGa invests in equity securities, time deposits, mortgage/asset-backed securities and government and agency obligations based on its investment policy approved by the Board. Government and agency obligations include highly rated fixed rate bonds, notes, bills and other obligations issued or unconditionally guaranteed by governments of countries or other official entities including government agencies or by multilateral organizations. MIGa makes limited use of derivatives contracts such as exchange traded futures, options and covered forward contracts to manage its investment portfolio. the purposes of these transactions are to enhance the return and manage the overall duration of the portfolio. With respect to futures and options, MIGa generally closes out most open positions prior to expiration. Futures are settled on a daily basis.
MIGa has classified all investment securities as trading. Investments classified as trading securities are reported at fair value using trade-date accounting. Securities purchased or sold may have a settlement date that is different from the trade-date. Securities purchased that could not be settled before the reporting dates are recorded as liability. Similarly, securities sold that could not be settled before the reporting dates are recorded under other assets.
For trading securities, unrealized net gains and losses are recognized in earnings. Income from investments includes net gains and losses and interest income.
Nonnegotiable, Noninterest-bearing Demand Obligations on Account of Subscribed Capitalpayments on these instruments are due to MIGa upon demand and are held in bank accounts which bear MIGa’s name. accordingly, these instruments are carried and reported at face value as assets on the balance sheet.
Impairment of Reinsurance AssetsMIGa assesses at each balance sheet date whether there is objective evidence that the reinsurance asset is impaired, and makes a provision for such impairment. objective evidence may be in the form of observable data that comes to MIGa’s attention periodically. If an impairment is determined, the carrying amount of the reinsurance asset is reduced through the use of an allowance account and the amount of the loss is recognized in the Statement of operations.
Reserve for ClaimsMIGa’s reserve consists of two primary components, the Specific reserve and the Insurance portfolio reserve. these components are compre-hensive and mutually exclusive with respect to risk of losses that may develop from each guarantee contract, and from the contingent liability for the portfolio as a whole.
the Specific reserve is calculated based on contract-specific parameters that are reviewed every quarter by MIGa Management for contracts that have known difficulties. the Insurance portfolio reserve is calculated based on the long-term historical experiences of the political risk insurance industry.
assumptions and parameters used in the calculations are intended to serve as the basis for an objective reserve for probable claims. Key assumptions, including frequency of claim, severity, and expected recovery have been quantitatively derived from the political risk insurance industry’s historical claims data. the principal sources of data used as inputs for the assumptions include the Berne union and the overseas private Investment Corporation (opIC). the historical analysis of the data from those sources is further augmented by an internal econometric scoring analysis in order to derive risk-differentiated parameters with term structure effects over time. the historical and econometric analyses cover periods that are over 30 years, and the derived parameters are considered stable in the short term; however the parameters are reviewed periodically. Short-term risk changes are captured by changes in internal risk ratings for countries and contracts on a quarterly basis. For the purpose of claims provisioning, MIGa factors in time value of money of potential cash flows, using representative risk-free interest rates as the discount rates.
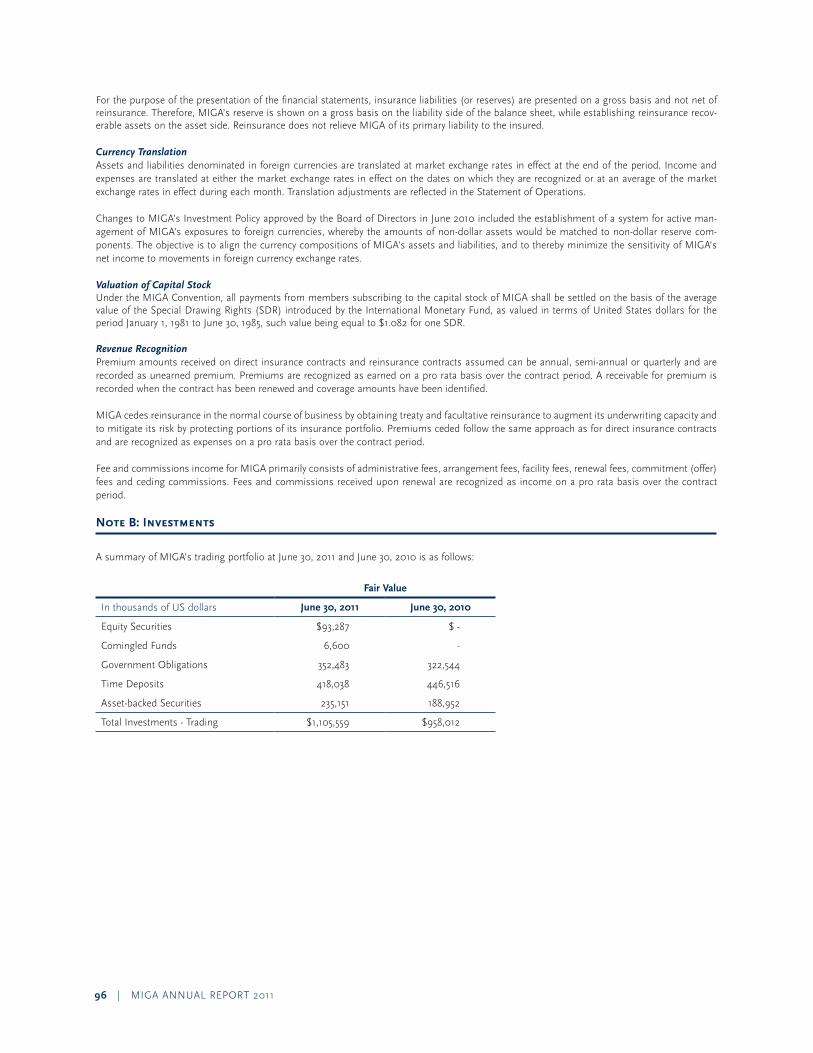
96 | MIGa annual report 2011
For the purpose of the presentation of the financial statements, insurance liabilities (or reserves) are presented on a gross basis and not net of reinsurance. therefore, MIGa’s reserve is shown on a gross basis on the liability side of the balance sheet, while establishing reinsurance recov-erable assets on the asset side. reinsurance does not relieve MIGa of its primary liability to the insured. Currency Translation assets and liabilities denominated in foreign currencies are translated at market exchange rates in effect at the end of the period. Income and expenses are translated at either the market exchange rates in effect on the dates on which they are recognized or at an average of the market exchange rates in effect during each month. translation adjustments are reflected in the Statement of operations.
Changes to MIGa’s Investment policy approved by the Board of Directors in June 2010 included the establishment of a system for active man-agement of MIGa’s exposures to foreign currencies, whereby the amounts of non-dollar assets would be matched to non-dollar reserve com-ponents. the objective is to align the currency compositions of MIGa’s assets and liabilities, and to thereby minimize the sensitivity of MIGa’s net income to movements in foreign currency exchange rates. Valuation of Capital Stock under the MIGa Convention, all payments from members subscribing to the capital stock of MIGa shall be settled on the basis of the average value of the Special Drawing rights (SDr) introduced by the International Monetary Fund, as valued in terms of united States dollars for the period January 1, 1981 to June 30, 1985, such value being equal to $1.082 for one SDr.
Revenue Recognitionpremium amounts received on direct insurance contracts and reinsurance contracts assumed can be annual, semi-annual or quarterly and are recorded as unearned premium. premiums are recognized as earned on a pro rata basis over the contract period. a receivable for premium is recorded when the contract has been renewed and coverage amounts have been identified.
MIGa cedes reinsurance in the normal course of business by obtaining treaty and facultative reinsurance to augment its underwriting capacity and to mitigate its risk by protecting portions of its insurance portfolio. premiums ceded follow the same approach as for direct insurance contracts and are recognized as expenses on a pro rata basis over the contract period.
Fee and commissions income for MIGa primarily consists of administrative fees, arrangement fees, facility fees, renewal fees, commitment (offer) fees and ceding commissions. Fees and commissions received upon renewal are recognized as income on a pro rata basis over the contract period.
Note B: Investments
a summary of MIGa’s trading portfolio at June 30, 2011 and June 30, 2010 is as follows:
Fair Value
In thousands of uS dollars June 30, 2011 June 30, 2010
equity Securities $93,287 $ -
Comingled Funds 6,600 -
Government obligations 352,483 322,544
time Deposits 418,038 446,516
asset-backed Securities 235,151 188,952
total Investments - trading $1,105,559 $958,012
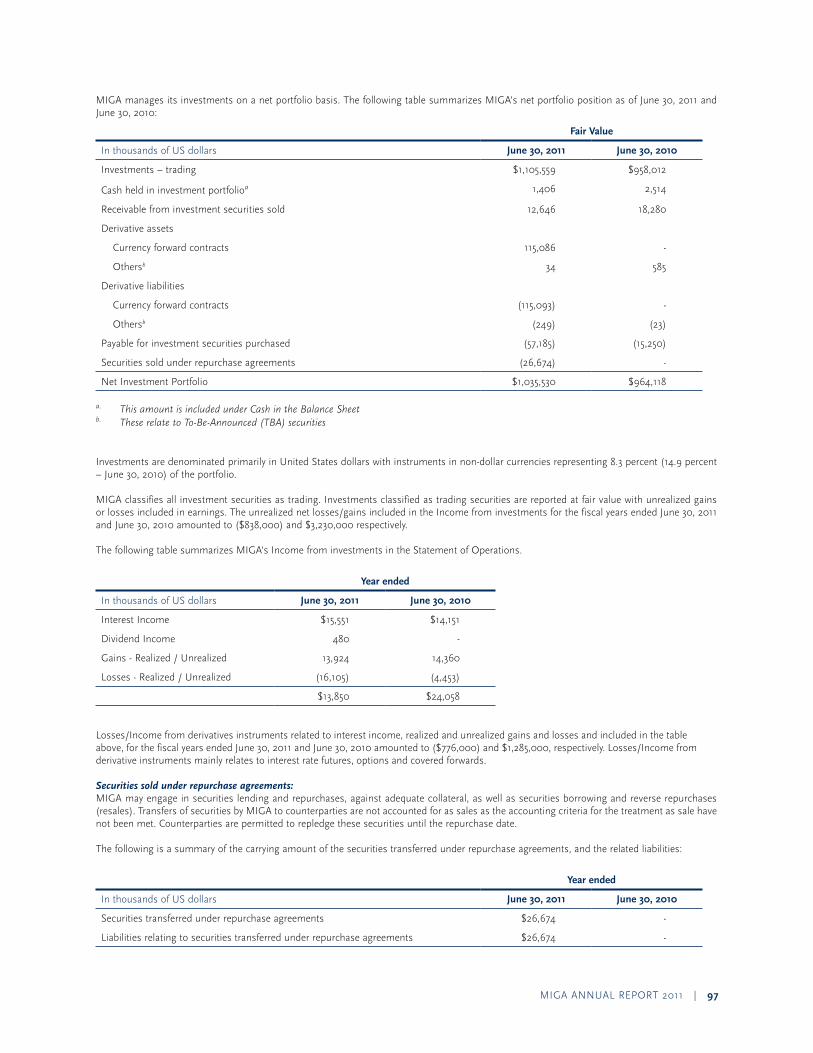
MIGa annual report 2011 | 97
MIGa manages its investments on a net portfolio basis. the following table summarizes MIGa’s net portfolio position as of June 30, 2011 and June 30, 2010:
Fair Value
In thousands of uS dollars June 30, 2011 June 30, 2010
Investments – trading $1,105,559 $958,012
Cash held in investment portfolioa 1,406 2,514
receivable from investment securities sold 12,646 18,280
Derivative assets
Currency forward contracts 115,086 -
othersb 34 585
Derivative liabilities
Currency forward contracts (115,093) -
othersb (249) (23)
payable for investment securities purchased (57,185) (15,250)
Securities sold under repurchase agreements (26,674) -
net Investment portfolio $1,035,530 $964,118
a. This amount is included under Cash in the Balance Sheetb. These relate to To-Be-Announced (TBA) securities
Investments are denominated primarily in united States dollars with instruments in non-dollar currencies representing 8.3 percent (14.9 percent – June 30, 2010) of the portfolio. MIGa classifies all investment securities as trading. Investments classified as trading securities are reported at fair value with unrealized gains or losses included in earnings. the unrealized net losses/gains included in the Income from investments for the fiscal years ended June 30, 2011 and June 30, 2010 amounted to ($838,000) and $3,230,000 respectively.
the following table summarizes MIGa’s Income from investments in the Statement of operations.
Year ended
In thousands of uS dollars June 30, 2011 June 30, 2010
Interest Income $15,551 $14,151
Dividend Income 480 -
Gains - realized / unrealized 13,924 14,360
losses - realized / unrealized (16,105) (4,453)
$13,850 $24,058
losses/Income from derivatives instruments related to interest income, realized and unrealized gains and losses and included in the table above, for the fiscal years ended June 30, 2011 and June 30, 2010 amounted to ($776,000) and $1,285,000, respectively. losses/Income from derivative instruments mainly relates to interest rate futures, options and covered forwards.
Securities sold under repurchase agreements:MIGa may engage in securities lending and repurchases, against adequate collateral, as well as securities borrowing and reverse repurchases (resales). transfers of securities by MIGa to counterparties are not accounted for as sales as the accounting criteria for the treatment as sale have not been met. Counterparties are permitted to repledge these securities until the repurchase date.
the following is a summary of the carrying amount of the securities transferred under repurchase agreements, and the related liabilities:
Year ended
In thousands of uS dollars June 30, 2011 June 30, 2010
Securities transferred under repurchase agreements $26,674 -
liabilities relating to securities transferred under repurchase agreements $26,674 -
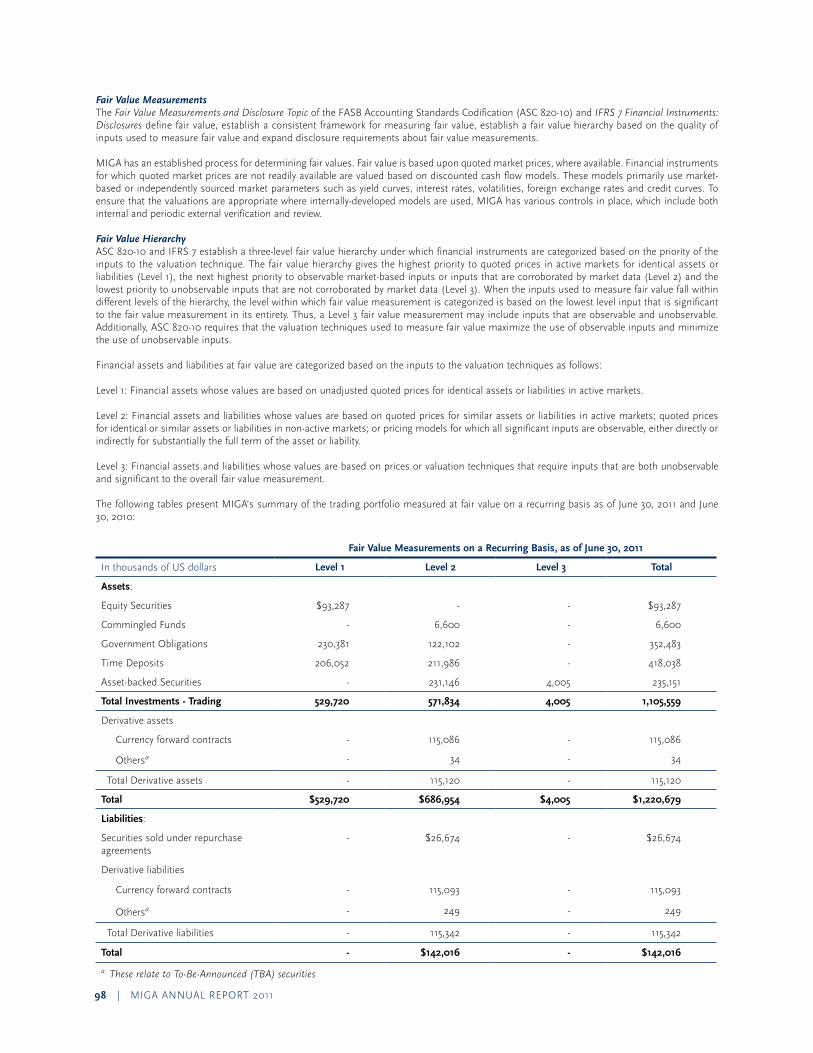
98 | MIGa annual report 2011
Fair Value Measurements the Fair Value Measurements and Disclosure Topic of the FaSB accounting Standards Codification (aSC 820-10) and IFRS 7 Financial Instruments: Disclosures define fair value, establish a consistent framework for measuring fair value, establish a fair value hierarchy based on the quality of inputs used to measure fair value and expand disclosure requirements about fair value measurements.
MIGa has an established process for determining fair values. Fair value is based upon quoted market prices, where available. Financial instruments for which quoted market prices are not readily available are valued based on discounted cash flow models. these models primarily use market-based or independently sourced market parameters such as yield curves, interest rates, volatilities, foreign exchange rates and credit curves. to ensure that the valuations are appropriate where internally-developed models are used, MIGa has various controls in place, which include both internal and periodic external verification and review.
Fair Value HierarchyaSC 820-10 and IFrS 7 establish a three-level fair value hierarchy under which financial instruments are categorized based on the priority of the inputs to the valuation technique. the fair value hierarchy gives the highest priority to quoted prices in active markets for identical assets or liabilities (level 1), the next highest priority to observable market-based inputs or inputs that are corroborated by market data (level 2) and the lowest priority to unobservable inputs that are not corroborated by market data (level 3). When the inputs used to measure fair value fall within different levels of the hierarchy, the level within which fair value measurement is categorized is based on the lowest level input that is significant to the fair value measurement in its entirety. thus, a level 3 fair value measurement may include inputs that are observable and unobservable. additionally, aSC 820-10 requires that the valuation techniques used to measure fair value maximize the use of observable inputs and minimize the use of unobservable inputs. Financial assets and liabilities at fair value are categorized based on the inputs to the valuation techniques as follows:
level 1: Financial assets whose values are based on unadjusted quoted prices for identical assets or liabilities in active markets.
level 2: Financial assets and liabilities whose values are based on quoted prices for similar assets or liabilities in active markets; quoted prices for identical or similar assets or liabilities in non-active markets; or pricing models for which all significant inputs are observable, either directly or indirectly for substantially the full term of the asset or liability.
level 3: Financial assets and liabilities whose values are based on prices or valuation techniques that require inputs that are both unobservable and significant to the overall fair value measurement.
the following tables present MIGa’s summary of the trading portfolio measured at fair value on a recurring basis as of June 30, 2011 and June 30, 2010:
Fair Value Measurements on a Recurring Basis, as of June 30, 2011
In thousands of uS dollars Level 1 Level 2 Level 3 Total
Assets:
equity Securities $93,287 - - $93,287
Commingled Funds - 6,600 - 6,600
Government obligations 230,381 122,102 - 352,483
time Deposits 206,052 211,986 - 418,038
asset-backed Securities - 231,146 4,005 235,151
Total Investments - Trading 529,720 571,834 4,005 1,105,559
Derivative assets
Currency forward contracts - 115,086 - 115,086
othersa - 34 - 34
total Derivative assets - 115,120 - 115,120
Total $529,720 $686,954 $4,005 $1,220,679
Liabilities:
Securities sold under repurchase agreements
- $26,674 - $26,674
Derivative liabilities
Currency forward contracts - 115,093 - 115,093
othersa - 249 - 249
total Derivative liabilities - 115,342 - 115,342
Total - $142,016 - $142,016
a. These relate to To-Be-Announced (TBA) securities
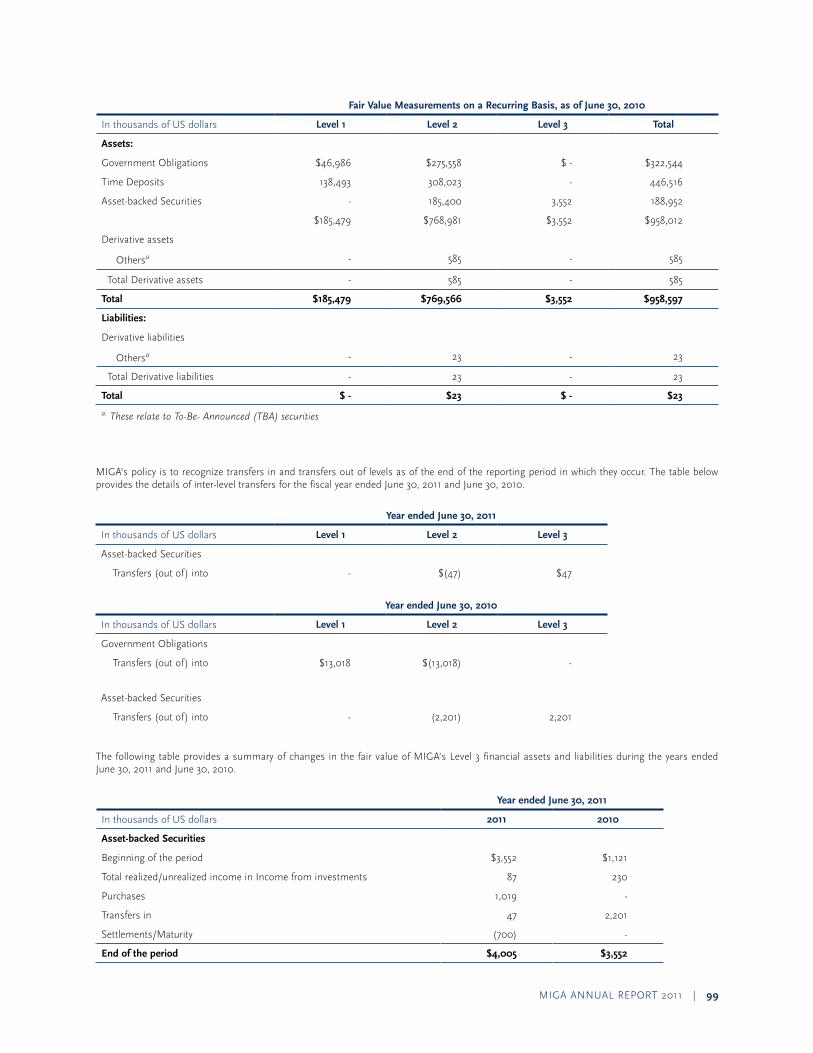
MIGa annual report 2011 | 99
Fair Value Measurements on a Recurring Basis, as of June 30, 2010
In thousands of uS dollars Level 1 Level 2 Level 3 Total
Assets:
Government obligations $46,986 $275,558 $ - $322,544
time Deposits 138,493 308,023 - 446,516
asset-backed Securities - 185,400 3,552 188,952
$185,479 $768,981 $3,552 $958,012
Derivative assets
othersa - 585 - 585
total Derivative assets - 585 - 585
Total $185,479 $769,566 $3,552 $958,597
Liabilities:
Derivative liabilities
othersa - 23 - 23
total Derivative liabilities - 23 - 23
Total $ - $23 $ - $23
a. These relate to To-Be- Announced (TBA) securities
MIGa’s policy is to recognize transfers in and transfers out of levels as of the end of the reporting period in which they occur. the table below provides the details of inter-level transfers for the fiscal year ended June 30, 2011 and June 30, 2010.
Year ended June 30, 2011
In thousands of uS dollars Level 1 Level 2 Level 3
asset-backed Securities
transfers (out of) into - $(47) $47
Year ended June 30, 2010
In thousands of uS dollars Level 1 Level 2 Level 3
Government obligations
transfers (out of) into $13,018 $(13,018) -
asset-backed Securities
transfers (out of) into - (2,201) 2,201
the following table provides a summary of changes in the fair value of MIGa’s level 3 financial assets and liabilities during the years ended June 30, 2011 and June 30, 2010.
Year ended June 30, 2011
In thousands of uS dollars 2011 2010
Asset-backed Securities
Beginning of the period $3,552 $1,121
total realized/unrealized income in Income from investments 87 230
purchases 1,019 -
transfers in 47 2,201
Settlements/Maturity (700) -
End of the period $4,005 $3,552
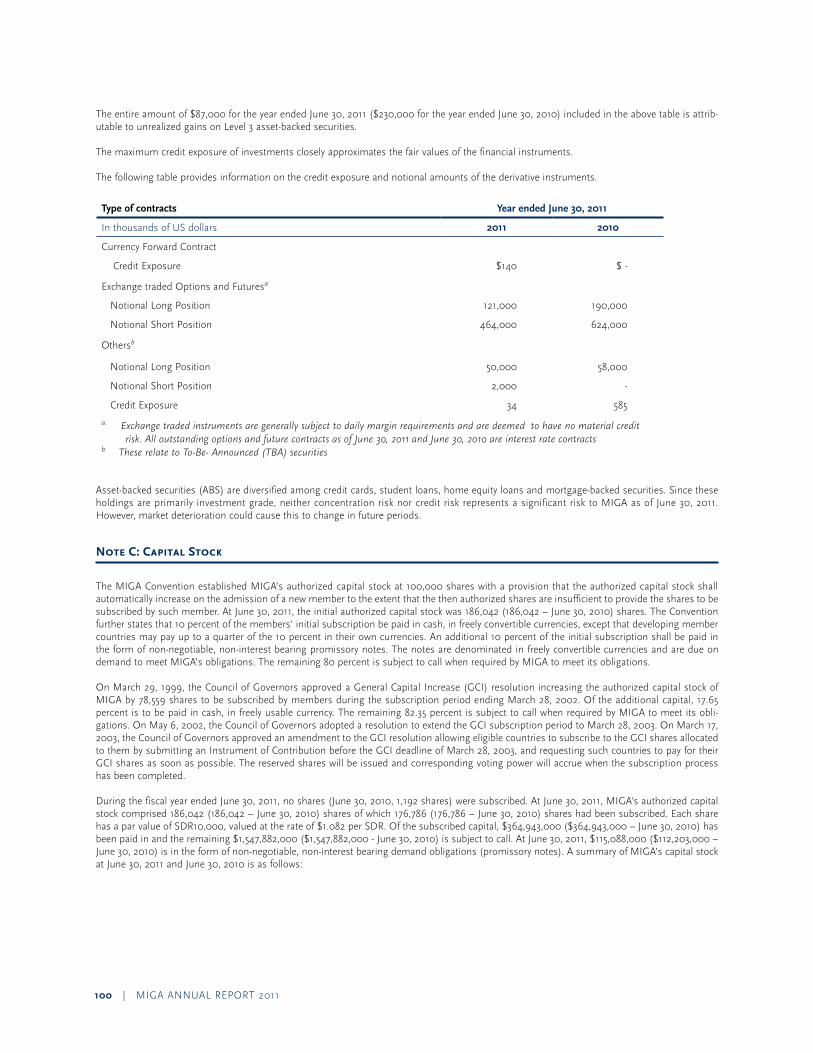
100 | MIGa annual report 2011
the entire amount of $87,000 for the year ended June 30, 2011 ($230,000 for the year ended June 30, 2010) included in the above table is attrib-utable to unrealized gains on level 3 asset-backed securities.
the maximum credit exposure of investments closely approximates the fair values of the financial instruments.
the following table provides information on the credit exposure and notional amounts of the derivative instruments.
Type of contracts Year ended June 30, 2011
In thousands of uS dollars 2011 2010
Currency Forward Contract
Credit exposure $140 $ -
exchange traded options and Futuresa
notional long position 121,000 190,000
notional Short position 464,000 624,000
othersb
notional long position 50,000 58,000
notional Short position 2,000 -
Credit exposure 34 585
a. Exchange traded instruments are generally subject to daily margin requirements and are deemed to have no material credit risk. All outstanding options and future contracts as of June 30, 2011 and June 30, 2010 are interest rate contracts
b. These relate to To-Be- Announced (TBA) securities
asset-backed securities (aBS) are diversified among credit cards, student loans, home equity loans and mortgage-backed securities. Since these holdings are primarily investment grade, neither concentration risk nor credit risk represents a significant risk to MIGa as of June 30, 2011. However, market deterioration could cause this to change in future periods.
Note C: Capital Stock
the MIGa Convention established MIGa’s authorized capital stock at 100,000 shares with a provision that the authorized capital stock shall automatically increase on the admission of a new member to the extent that the then authorized shares are insufficient to provide the shares to be subscribed by such member. at June 30, 2011, the initial authorized capital stock was 186,042 (186,042 – June 30, 2010) shares. the Convention further states that 10 percent of the members’ initial subscription be paid in cash, in freely convertible currencies, except that developing member countries may pay up to a quarter of the 10 percent in their own currencies. an additional 10 percent of the initial subscription shall be paid in the form of non-negotiable, non-interest bearing promissory notes. the notes are denominated in freely convertible currencies and are due on demand to meet MIGa’s obligations. the remaining 80 percent is subject to call when required by MIGa to meet its obligations.
on March 29, 1999, the Council of Governors approved a General Capital Increase (GCI) resolution increasing the authorized capital stock of MIGa by 78,559 shares to be subscribed by members during the subscription period ending March 28, 2002. of the additional capital, 17.65 percent is to be paid in cash, in freely usable currency. the remaining 82.35 percent is subject to call when required by MIGa to meet its obli-gations. on May 6, 2002, the Council of Governors adopted a resolution to extend the GCI subscription period to March 28, 2003. on March 17, 2003, the Council of Governors approved an amendment to the GCI resolution allowing eligible countries to subscribe to the GCI shares allocated to them by submitting an Instrument of Contribution before the GCI deadline of March 28, 2003, and requesting such countries to pay for their GCI shares as soon as possible. the reserved shares will be issued and corresponding voting power will accrue when the subscription process has been completed.
During the fiscal year ended June 30, 2011, no shares (June 30, 2010, 1,192 shares) were subscribed. at June 30, 2011, MIGa’s authorized capital stock comprised 186,042 (186,042 – June 30, 2010) shares of which 176,786 (176,786 – June 30, 2010) shares had been subscribed. each share has a par value of SDr10,000, valued at the rate of $1.082 per SDr. of the subscribed capital, $364,943,000 ($364,943,000 – June 30, 2010) has been paid in and the remaining $1,547,882,000 ($1,547,882,000 - June 30, 2010) is subject to call. at June 30, 2011, $115,088,000 ($112,203,000 – June 30, 2010) is in the form of non-negotiable, non-interest bearing demand obligations (promissory notes). a summary of MIGa’s capital stock at June 30, 2011 and June 30, 2010 is as follows:
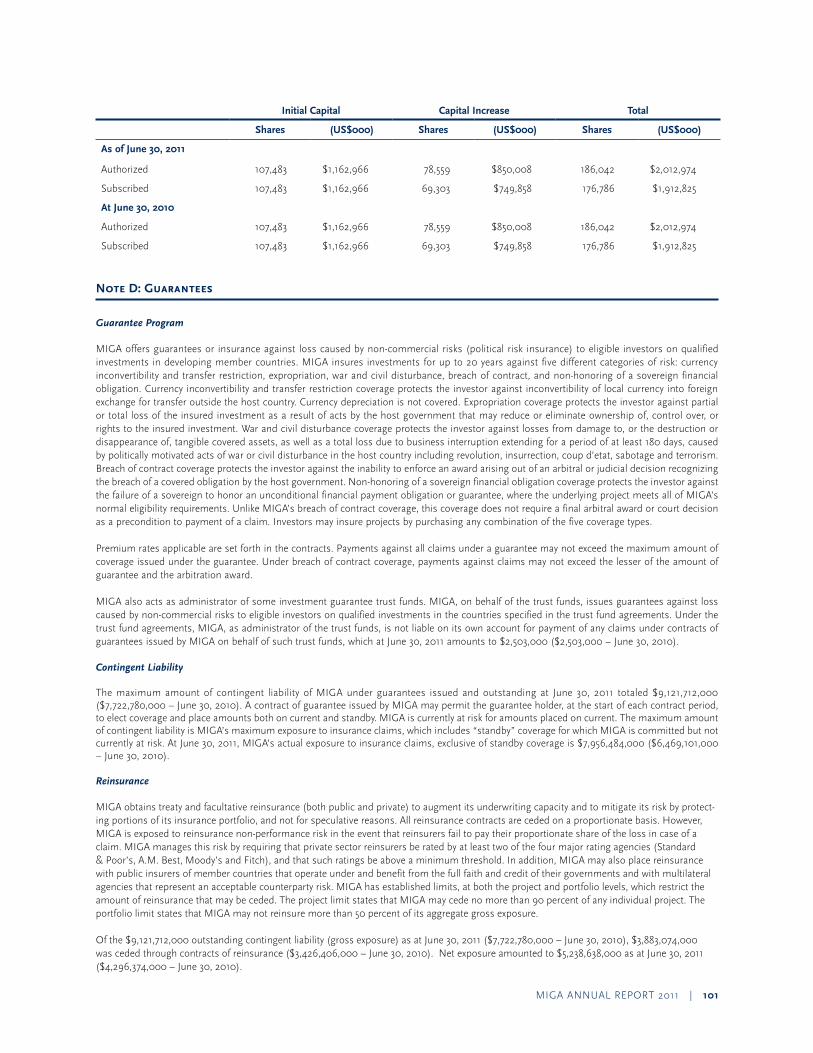
MIGa annual report 2011 | 101
Initial Capital Capital Increase Total
Shares (US$000) Shares (US$000) Shares (US$000)
As of June 30, 2011
authorized 107,483 $1,162,966 78,559 $850,008 186,042 $2,012,974
Subscribed 107,483 $1,162,966 69,303 $749,858 176,786 $1,912,825
At June 30, 2010
authorized 107,483 $1,162,966 78,559 $850,008 186,042 $2,012,974
Subscribed 107,483 $1,162,966 69,303 $749,858 176,786 $1,912,825
Note D: Guarantees
Guarantee Program
MIGa offers guarantees or insurance against loss caused by non-commercial risks (political risk insurance) to eligible investors on qualified investments in developing member countries. MIGa insures investments for up to 20 years against five different categories of risk: currency inconvertibility and transfer restriction, expropriation, war and civil disturbance, breach of contract, and non-honoring of a sovereign financial obligation. Currency inconvertibility and transfer restriction coverage protects the investor against inconvertibility of local currency into foreign exchange for transfer outside the host country. Currency depreciation is not covered. expropriation coverage protects the investor against partial or total loss of the insured investment as a result of acts by the host government that may reduce or eliminate ownership of, control over, or rights to the insured investment. War and civil disturbance coverage protects the investor against losses from damage to, or the destruction or disappearance of, tangible covered assets, as well as a total loss due to business interruption extending for a period of at least 180 days, caused by politically motivated acts of war or civil disturbance in the host country including revolution, insurrection, coup d’etat, sabotage and terrorism. Breach of contract coverage protects the investor against the inability to enforce an award arising out of an arbitral or judicial decision recognizing the breach of a covered obligation by the host government. non-honoring of a sovereign financial obligation coverage protects the investor against the failure of a sovereign to honor an unconditional financial payment obligation or guarantee, where the underlying project meets all of MIGa’s normal eligibility requirements. unlike MIGa’s breach of contract coverage, this coverage does not require a final arbitral award or court decision as a precondition to payment of a claim. Investors may insure projects by purchasing any combination of the five coverage types.
premium rates applicable are set forth in the contracts. payments against all claims under a guarantee may not exceed the maximum amount of coverage issued under the guarantee. under breach of contract coverage, payments against claims may not exceed the lesser of the amount of guarantee and the arbitration award.
MIGa also acts as administrator of some investment guarantee trust funds. MIGa, on behalf of the trust funds, issues guarantees against loss caused by non-commercial risks to eligible investors on qualified investments in the countries specified in the trust fund agreements. under the trust fund agreements, MIGa, as administrator of the trust funds, is not liable on its own account for payment of any claims under contracts of guarantees issued by MIGa on behalf of such trust funds, which at June 30, 2011 amounts to $2,503,000 ($2,503,000 – June 30, 2010).
Contingent Liability
the maximum amount of contingent liability of MIGa under guarantees issued and outstanding at June 30, 2011 totaled $9,121,712,000 ($7,722,780,000 – June 30, 2010). a contract of guarantee issued by MIGa may permit the guarantee holder, at the start of each contract period, to elect coverage and place amounts both on current and standby. MIGa is currently at risk for amounts placed on current. the maximum amount of contingent liability is MIGa’s maximum exposure to insurance claims, which includes “standby” coverage for which MIGa is committed but not currently at risk. at June 30, 2011, MIGa’s actual exposure to insurance claims, exclusive of standby coverage is $7,956,484,000 ($6,469,101,000 – June 30, 2010).
Reinsurance
MIGa obtains treaty and facultative reinsurance (both public and private) to augment its underwriting capacity and to mitigate its risk by protect-ing portions of its insurance portfolio, and not for speculative reasons. all reinsurance contracts are ceded on a proportionate basis. However, MIGa is exposed to reinsurance non-performance risk in the event that reinsurers fail to pay their proportionate share of the loss in case of a claim. MIGa manages this risk by requiring that private sector reinsurers be rated by at least two of the four major rating agencies (Standard & poor’s, a.M. Best, Moody’s and Fitch), and that such ratings be above a minimum threshold. In addition, MIGa may also place reinsurance with public insurers of member countries that operate under and benefit from the full faith and credit of their governments and with multilateral agencies that represent an acceptable counterparty risk. MIGa has established limits, at both the project and portfolio levels, which restrict the amount of reinsurance that may be ceded. the project limit states that MIGa may cede no more than 90 percent of any individual project. the portfolio limit states that MIGa may not reinsure more than 50 percent of its aggregate gross exposure.
of the $9,121,712,000 outstanding contingent liability (gross exposure) as at June 30, 2011 ($7,722,780,000 – June 30, 2010), $3,883,074,000 was ceded through contracts of reinsurance ($3,426,406,000 – June 30, 2010). net exposure amounted to $5,238,638,000 as at June 30, 2011 ($4,296,374,000 – June 30, 2010).
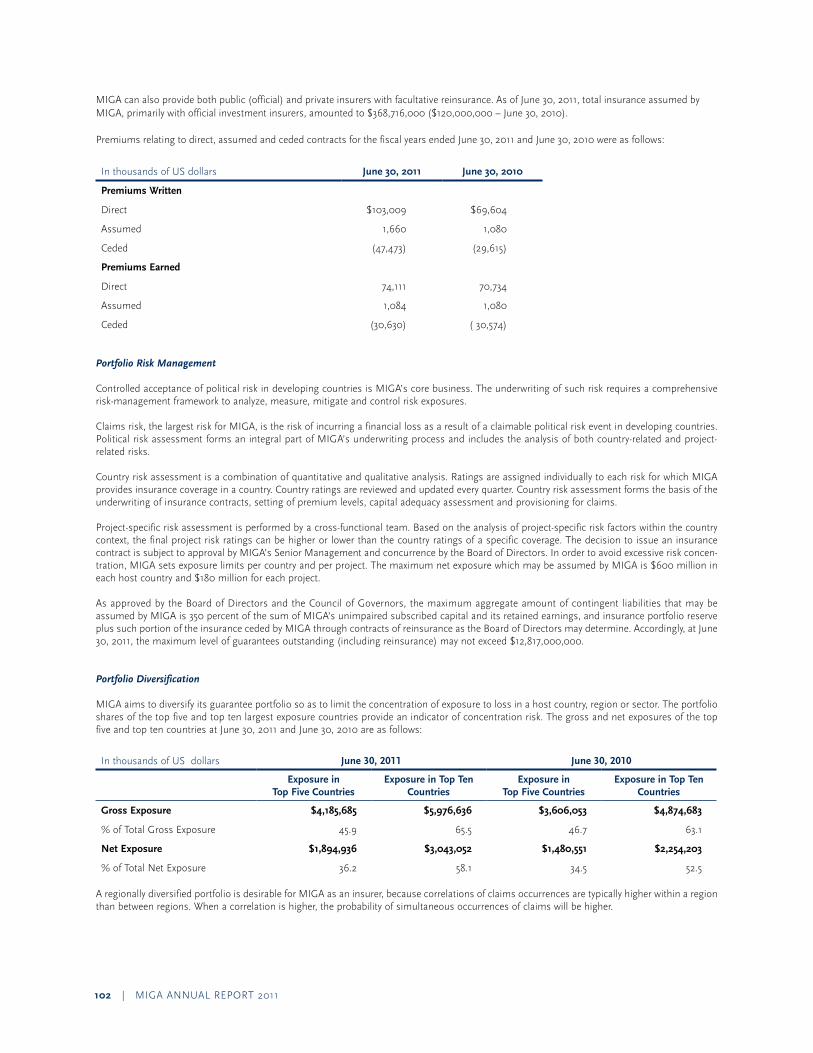
102 | MIGa annual report 2011
MIGa can also provide both public (official) and private insurers with facultative reinsurance. as of June 30, 2011, total insurance assumed by MIGa, primarily with official investment insurers, amounted to $368,716,000 ($120,000,000 – June 30, 2010).
premiums relating to direct, assumed and ceded contracts for the fiscal years ended June 30, 2011 and June 30, 2010 were as follows:
In thousands of uS dollars June 30, 2011 June 30, 2010
Premiums Written
Direct $103,009 $69,604
assumed 1,660 1,080
Ceded (47,473) (29,615)
Premiums Earned
Direct 74,111 70,734
assumed 1,084 1,080
Ceded (30,630) ( 30,574)
Portfolio Risk Management
Controlled acceptance of political risk in developing countries is MIGa’s core business. the underwriting of such risk requires a comprehensive risk-management framework to analyze, measure, mitigate and control risk exposures. Claims risk, the largest risk for MIGa, is the risk of incurring a financial loss as a result of a claimable political risk event in developing countries. political risk assessment forms an integral part of MIGa’s underwriting process and includes the analysis of both country-related and project-related risks. Country risk assessment is a combination of quantitative and qualitative analysis. ratings are assigned individually to each risk for which MIGa provides insurance coverage in a country. Country ratings are reviewed and updated every quarter. Country risk assessment forms the basis of the underwriting of insurance contracts, setting of premium levels, capital adequacy assessment and provisioning for claims.
project-specific risk assessment is performed by a cross-functional team. Based on the analysis of project-specific risk factors within the country context, the final project risk ratings can be higher or lower than the country ratings of a specific coverage. the decision to issue an insurance contract is subject to approval by MIGa’s Senior Management and concurrence by the Board of Directors. In order to avoid excessive risk concen-tration, MIGa sets exposure limits per country and per project. the maximum net exposure which may be assumed by MIGa is $600 million in each host country and $180 million for each project.
as approved by the Board of Directors and the Council of Governors, the maximum aggregate amount of contingent liabilities that may be assumed by MIGa is 350 percent of the sum of MIGa’s unimpaired subscribed capital and its retained earnings, and insurance portfolio reserve plus such portion of the insurance ceded by MIGa through contracts of reinsurance as the Board of Directors may determine. accordingly, at June 30, 2011, the maximum level of guarantees outstanding (including reinsurance) may not exceed $12,817,000,000.
Portfolio Diversification
MIGa aims to diversify its guarantee portfolio so as to limit the concentration of exposure to loss in a host country, region or sector. the portfolio shares of the top five and top ten largest exposure countries provide an indicator of concentration risk. the gross and net exposures of the top five and top ten countries at June 30, 2011 and June 30, 2010 are as follows:
In thousands of uS dollars June 30, 2011 June 30, 2010
Exposure in Top Five Countries
Exposure in Top Ten Countries
Exposure in Top Five Countries
Exposure in Top Ten Countries
Gross Exposure $4,185,685 $5,976,636 $3,606,053 $4,874,683
% of total Gross exposure 45.9 65.5 46.7 63.1
Net Exposure $1,894,936 $3,043,052 $1,480,551 $2,254,203
% of total net exposure 36.2 58.1 34.5 52.5
a regionally diversified portfolio is desirable for MIGa as an insurer, because correlations of claims occurrences are typically higher within a region than between regions. When a correlation is higher, the probability of simultaneous occurrences of claims will be higher.
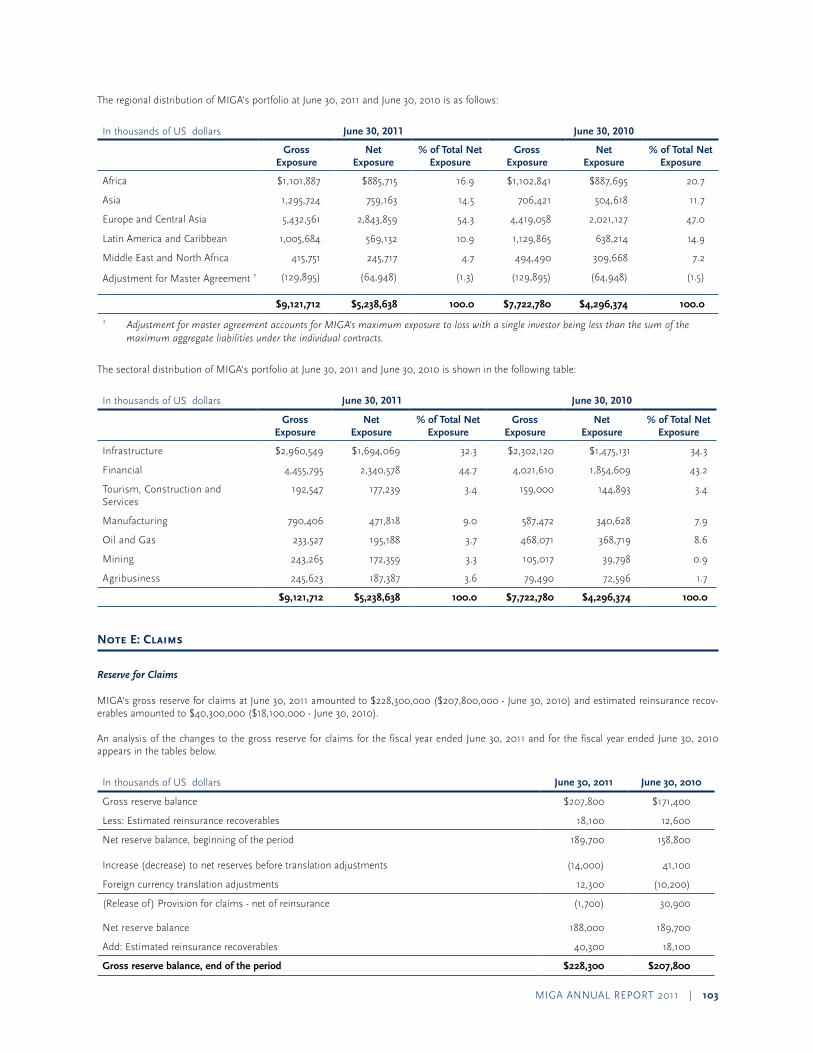
MIGa annual report 2011 | 103
the regional distribution of MIGa’s portfolio at June 30, 2011 and June 30, 2010 is as follows:
In thousands of uS dollars June 30, 2011 June 30, 2010
GrossExposure
NetExposure
% of Total Net Exposure
GrossExposure
NetExposure
% of Total Net Exposure
africa $1,101,887 $885,715 16.9 $1,102,841 $887,695 20.7
asia 1,295,724 759,163 14.5 706,421 504,618 11.7
europe and Central asia 5,432,561 2,843,859 54.3 4,419,058 2,021,127 47.0
latin america and Caribbean 1,005,684 569,132 10.9 1,129,865 638,214 14.9
Middle east and north africa 415,751 245,717 4.7 494,490 309,668 7.2
adjustment for Master agreement 1 (129,895) (64,948) (1.3) (129,895) (64,948) (1.5)
$9,121,712 $5,238,638 100.0 $7,722,780 $4,296,374 100.0
1 Adjustment for master agreement accounts for MIGA’s maximum exposure to loss with a single investor being less than the sum of the maximum aggregate liabilities under the individual contracts.
the sectoral distribution of MIGa’s portfolio at June 30, 2011 and June 30, 2010 is shown in the following table:
In thousands of uS dollars June 30, 2011 June 30, 2010
GrossExposure
NetExposure
% of Total Net Exposure
GrossExposure
NetExposure
% of Total Net Exposure
Infrastructure $2,960,549 $1,694,069 32.3 $2,302,120 $1,475,131 34.3
Financial 4,455,795 2,340,578 44.7 4,021,610 1,854,609 43.2
tourism, Construction and Services
192,547 177,239 3.4 159,000 144,893 3.4
Manufacturing 790,406 471,818 9.0 587,472 340,628 7.9
oil and Gas 233,527 195,188 3.7 468,071 368,719 8.6
Mining 243,265 172,359 3.3 105,017 39,798 0.9
agribusiness 245,623 187,387 3.6 79,490 72,596 1.7
$9,121,712 $5,238,638 100.0 $7,722,780 $4,296,374 100.0
Note E: Claims
Reserve for Claims
MIGa’s gross reserve for claims at June 30, 2011 amounted to $228,300,000 ($207,800,000 - June 30, 2010) and estimated reinsurance recov-erables amounted to $40,300,000 ($18,100,000 - June 30, 2010).
an analysis of the changes to the gross reserve for claims for the fiscal year ended June 30, 2011 and for the fiscal year ended June 30, 2010 appears in the tables below.
In thousands of uS dollars June 30, 2011 June 30, 2010
Gross reserve balance $207,800 $171,400
less: estimated reinsurance recoverables 18,100 12,600
net reserve balance, beginning of the period 189,700 158,800
Increase (decrease) to net reserves before translation adjustments (14,000) 41,100
Foreign currency translation adjustments 12,300 (10,200)
(release of) provision for claims - net of reinsurance (1,700) 30,900
net reserve balance 188,000 189,700
add: estimated reinsurance recoverables 40,300 18,100
Gross reserve balance, end of the period $228,300 $207,800
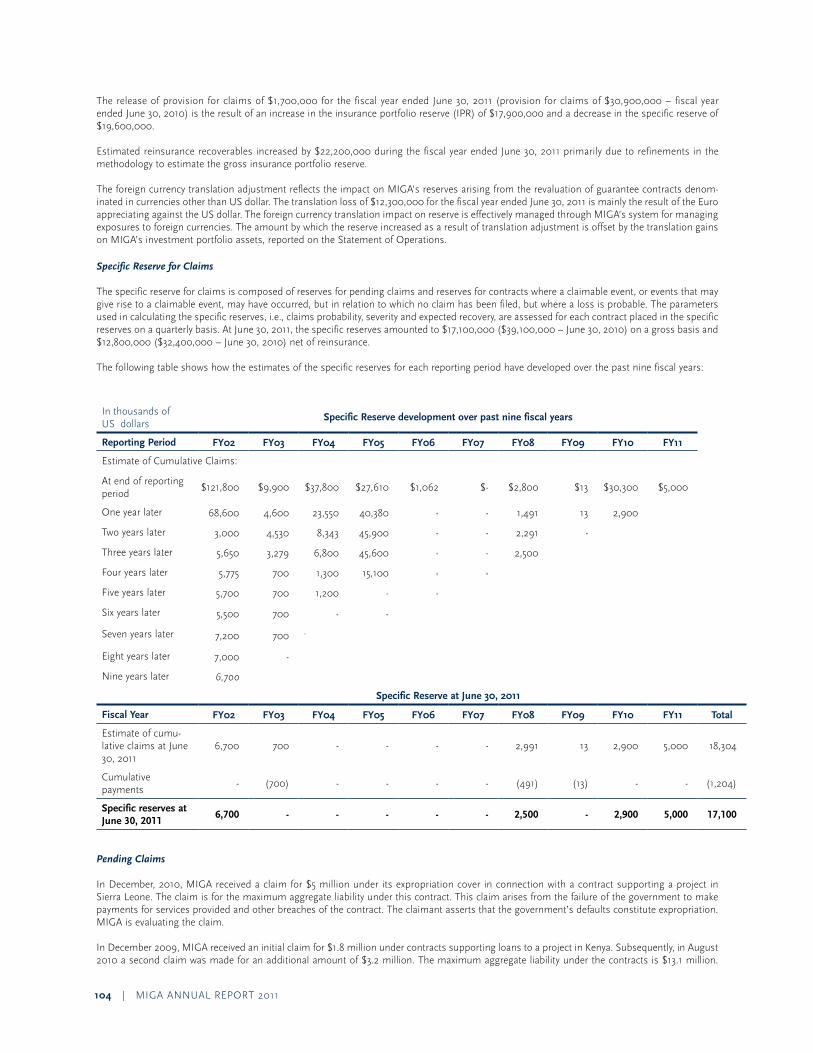
104 | MIGa annual report 2011
the release of provision for claims of $1,700,000 for the fiscal year ended June 30, 2011 (provision for claims of $30,900,000 – fiscal year ended June 30, 2010) is the result of an increase in the insurance portfolio reserve (Ipr) of $17,900,000 and a decrease in the specific reserve of $19,600,000.
estimated reinsurance recoverables increased by $22,200,000 during the fiscal year ended June 30, 2011 primarily due to refinements in the methodology to estimate the gross insurance portfolio reserve.
the foreign currency translation adjustment reflects the impact on MIGa’s reserves arising from the revaluation of guarantee contracts denom-inated in currencies other than uS dollar. the translation loss of $12,300,000 for the fiscal year ended June 30, 2011 is mainly the result of the euro appreciating against the uS dollar. the foreign currency translation impact on reserve is effectively managed through MIGa’s system for managing exposures to foreign currencies. the amount by which the reserve increased as a result of translation adjustment is offset by the translation gains on MIGa’s investment portfolio assets, reported on the Statement of operations.
Specific Reserve for Claims
the specific reserve for claims is composed of reserves for pending claims and reserves for contracts where a claimable event, or events that may give rise to a claimable event, may have occurred, but in relation to which no claim has been filed, but where a loss is probable. the parameters used in calculating the specific reserves, i.e., claims probability, severity and expected recovery, are assessed for each contract placed in the specific reserves on a quarterly basis. at June 30, 2011, the specific reserves amounted to $17,100,000 ($39,100,000 – June 30, 2010) on a gross basis and $12,800,000 ($32,400,000 – June 30, 2010) net of reinsurance.
the following table shows how the estimates of the specific reserves for each reporting period have developed over the past nine fiscal years:
In thousands of uS dollars
Specific Reserve development over past nine fiscal years
Reporting Period FY02 FY03 FY04 FY05 FY06 FY07 FY08 FY09 FY10 FY11
estimate of Cumulative Claims:
at end of reporting period
$121,800 $9,900 $37,800 $27,610 $1,062 $- $2,800 $13 $30,300 $5,000
one year later 68,600 4,600 23,550 40,380 - - 1,491 13 2,900
two years later 3,000 4,530 8,343 45,900 - - 2,291 -
three years later 5,650 3,279 6,800 45,600 - - 2,500
Four years later 5,775 700 1,300 15,100 - -
Five years later 5,700 700 1,200 - -
Six years later 5,500 700 - -
Seven years later 7,200 700 -
eight years later 7,000 -
nine years later 6,700
Specific Reserve at June 30, 2011
Fiscal Year FY02 FY03 FY04 FY05 FY06 FY07 FY08 FY09 FY10 FY11 Total
estimate of cumu-lative claims at June 30, 2011
6,700 700 - - - - 2,991 13 2,900 5,000 18,304
Cumulative payments
- (700) - - - - (491) (13) - - (1,204)
Specific reserves at June 30, 2011
6,700 - - - - - 2,500 - 2,900 5,000 17,100
Pending Claims
In December, 2010, MIGa received a claim for $5 million under its expropriation cover in connection with a contract supporting a project in Sierra leone. the claim is for the maximum aggregate liability under this contract. this claim arises from the failure of the government to make payments for services provided and other breaches of the contract. the claimant asserts that the government’s defaults constitute expropriation. MIGa is evaluating the claim.
In December 2009, MIGa received an initial claim for $1.8 million under contracts supporting loans to a project in Kenya. Subsequently, in august 2010 a second claim was made for an additional amount of $3.2 million. the maximum aggregate liability under the contracts is $13.1 million.
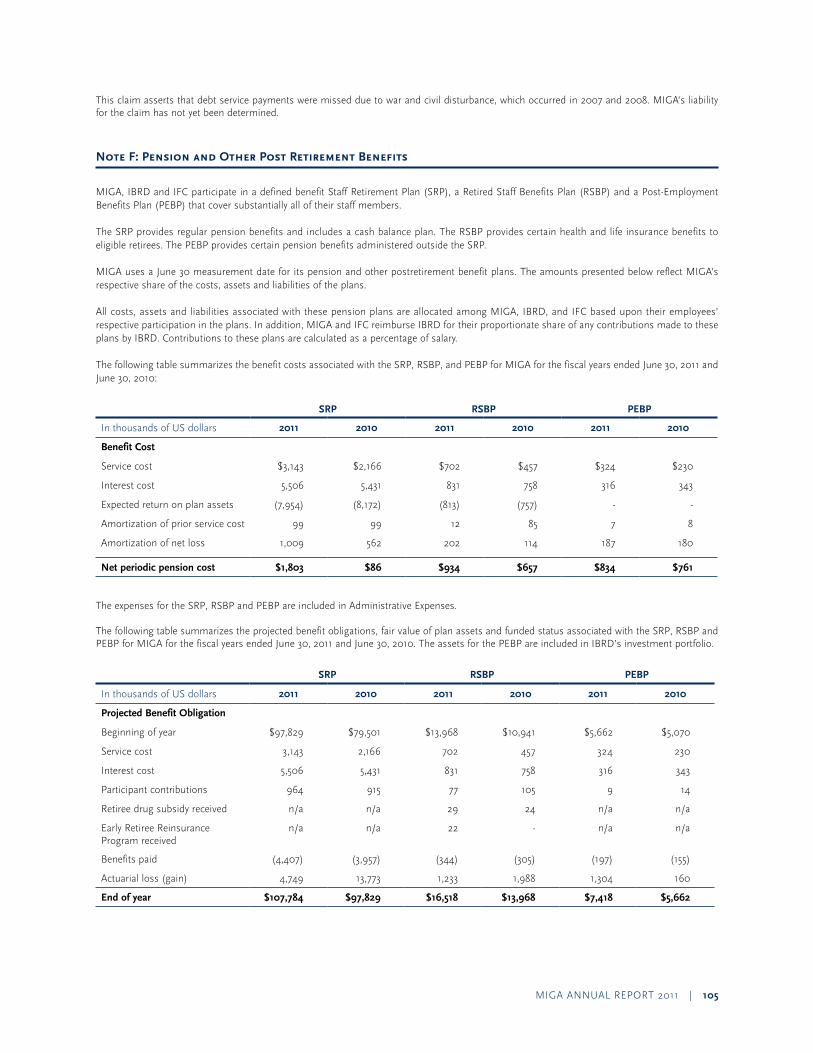
MIGa annual report 2011 | 105
this claim asserts that debt service payments were missed due to war and civil disturbance, which occurred in 2007 and 2008. MIGa’s liability for the claim has not yet been determined.
Note F: Pension and Other Post Retirement Benefits
MIGa, IBrD and IFC participate in a defined benefit Staff retirement plan (Srp), a retired Staff Benefits plan (rSBp) and a post-employment Benefits plan (peBp) that cover substantially all of their staff members.
the Srp provides regular pension benefits and includes a cash balance plan. the rSBp provides certain health and life insurance benefits to eligible retirees. the peBp provides certain pension benefits administered outside the Srp.
MIGa uses a June 30 measurement date for its pension and other postretirement benefit plans. the amounts presented below reflect MIGa’s respective share of the costs, assets and liabilities of the plans.
all costs, assets and liabilities associated with these pension plans are allocated among MIGa, IBrD, and IFC based upon their employees’ respective participation in the plans. In addition, MIGa and IFC reimburse IBrD for their proportionate share of any contributions made to these plans by IBrD. Contributions to these plans are calculated as a percentage of salary. the following table summarizes the benefit costs associated with the Srp, rSBp, and peBp for MIGa for the fiscal years ended June 30, 2011 and June 30, 2010:
SRP RSBP PEBP
In thousands of uS dollars 2011 2010 2011 2010 2011 2010
Benefit Cost
Service cost $3,143 $2,166 $702 $457 $324 $230
Interest cost 5,506 5,431 831 758 316 343
expected return on plan assets (7,954) (8,172) (813) (757) - -
amortization of prior service cost 99 99 12 85 7 8
amortization of net loss 1,009 562 202 114 187 180
Net periodic pension cost $1,803 $86 $934 $657 $834 $761
the expenses for the Srp, rSBp and peBp are included in administrative expenses.
the following table summarizes the projected benefit obligations, fair value of plan assets and funded status associated with the Srp, rSBp and peBp for MIGa for the fiscal years ended June 30, 2011 and June 30, 2010. the assets for the peBp are included in IBrD’s investment portfolio.
SRP RSBP PEBP
In thousands of uS dollars 2011 2010 2011 2010 2011 2010
Projected Benefit Obligation
Beginning of year $97,829 $79,501 $13,968 $10,941 $5,662 $5,070
Service cost 3,143 2,166 702 457 324 230
Interest cost 5,506 5,431 831 758 316 343
participant contributions 964 915 77 105 9 14
retiree drug subsidy received n/a n/a 29 24 n/a n/a
early retiree reinsurance program received
n/a n/a 22 - n/a n/a
Benefits paid (4,407) (3,957) (344) (305) (197) (155)
actuarial loss (gain) 4,749 13,773 1,233 1,988 1,304 160
End of year $107,784 $97,829 $16,518 $13,968 $7,418 $5,662
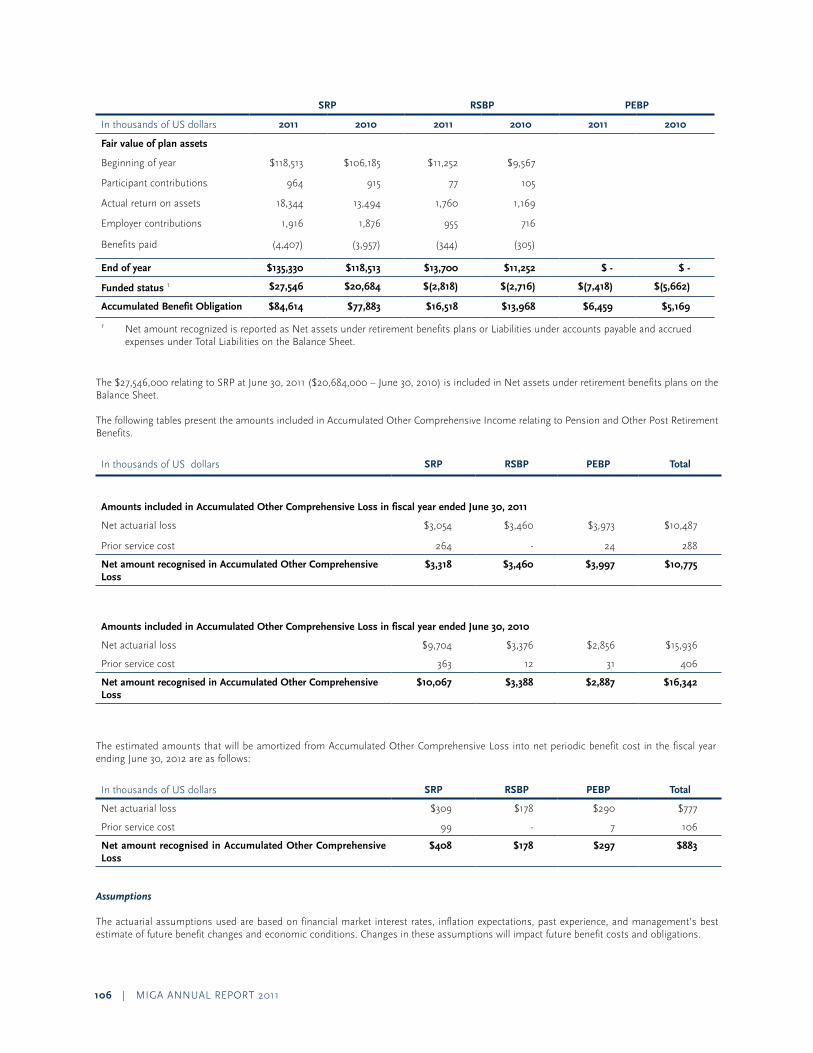
106 | MIGa annual report 2011
SRP RSBP PEBP
In thousands of uS dollars 2011 2010 2011 2010 2011 2010
Fair value of plan assets
Beginning of year $118,513 $106,185 $11,252 $9,567
participant contributions 964 915 77 105
actual return on assets 18,344 13,494 1,760 1,169
employer contributions 1,916 1,876 955 716
Benefits paid (4,407) (3,957) (344) (305)
End of year $135,330 $118,513 $13,700 $11,252 $ - $ -
Funded status 1 $27,546 $20,684 $(2,818) $(2,716) $(7,418) $(5,662)
Accumulated Benefit Obligation $84,614 $77,883 $16,518 $13,968 $6,459 $5,169
1 net amount recognized is reported as net assets under retirement benefits plans or liabilities under accounts payable and accrued expenses under total liabilities on the Balance Sheet.
the $27,546,000 relating to Srp at June 30, 2011 ($20,684,000 – June 30, 2010) is included in net assets under retirement benefits plans on the Balance Sheet.
the following tables present the amounts included in accumulated other Comprehensive Income relating to pension and other post retirement Benefits.
In thousands of uS dollars SRP RSBP PEBP Total
Amounts included in Accumulated Other Comprehensive Loss in fiscal year ended June 30, 2011
net actuarial loss $3,054 $3,460 $3,973 $10,487
prior service cost 264 - 24 288
Net amount recognised in Accumulated Other Comprehensive Loss
$3,318 $3,460 $3,997 $10,775
Amounts included in Accumulated Other Comprehensive Loss in fiscal year ended June 30, 2010
net actuarial loss $9,704 $3,376 $2,856 $15,936
prior service cost 363 12 31 406
Net amount recognised in Accumulated Other Comprehensive Loss
$10,067 $3,388 $2,887 $16,342
the estimated amounts that will be amortized from accumulated other Comprehensive loss into net periodic benefit cost in the fiscal year ending June 30, 2012 are as follows:
In thousands of uS dollars SRP RSBP PEBP Total
net actuarial loss $309 $178 $290 $777
prior service cost 99 - 7 106
Net amount recognised in Accumulated Other Comprehensive Loss
$408 $178 $297 $883
Assumptions
the actuarial assumptions used are based on financial market interest rates, inflation expectations, past experience, and management’s best estimate of future benefit changes and economic conditions. Changes in these assumptions will impact future benefit costs and obligations.
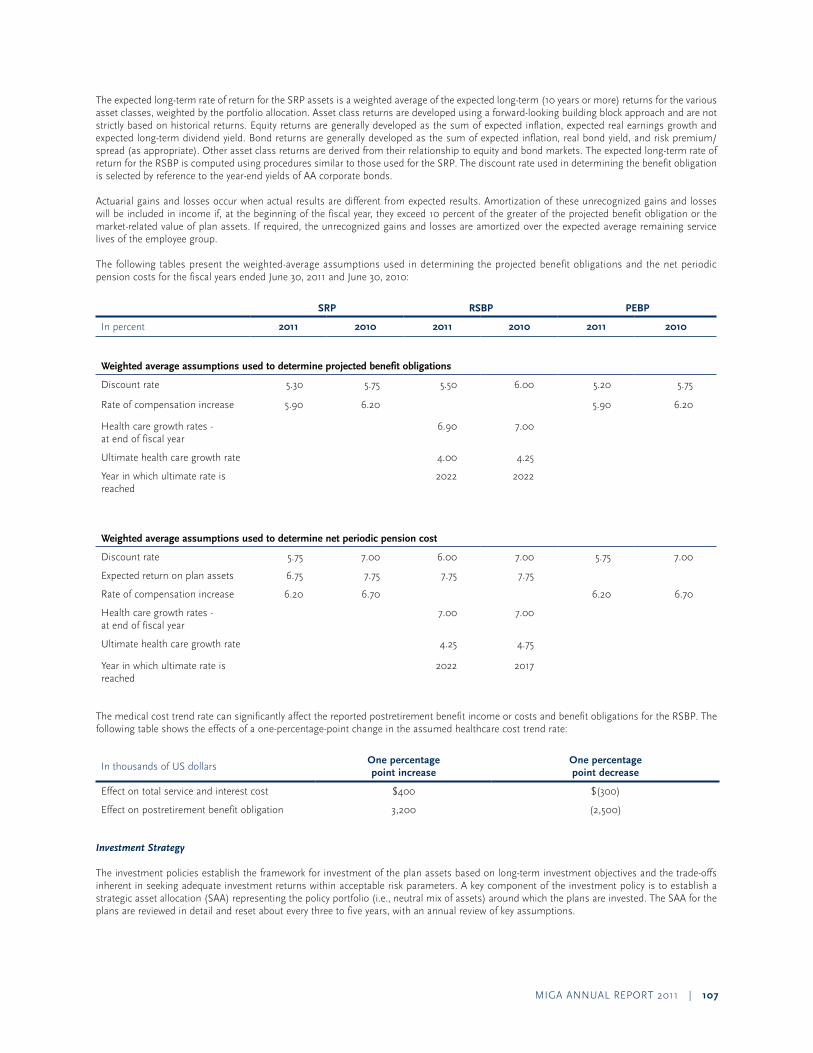
MIGa annual report 2011 | 107
the expected long-term rate of return for the Srp assets is a weighted average of the expected long-term (10 years or more) returns for the various asset classes, weighted by the portfolio allocation. asset class returns are developed using a forward-looking building block approach and are not strictly based on historical returns. equity returns are generally developed as the sum of expected inflation, expected real earnings growth and expected long-term dividend yield. Bond returns are generally developed as the sum of expected inflation, real bond yield, and risk premium/spread (as appropriate). other asset class returns are derived from their relationship to equity and bond markets. the expected long-term rate of return for the rSBp is computed using procedures similar to those used for the Srp. the discount rate used in determining the benefit obligation is selected by reference to the year-end yields of aa corporate bonds.
actuarial gains and losses occur when actual results are different from expected results. amortization of these unrecognized gains and losses will be included in income if, at the beginning of the fiscal year, they exceed 10 percent of the greater of the projected benefit obligation or the market-related value of plan assets. If required, the unrecognized gains and losses are amortized over the expected average remaining service lives of the employee group.
the following tables present the weighted-average assumptions used in determining the projected benefit obligations and the net periodic pension costs for the fiscal years ended June 30, 2011 and June 30, 2010:
SRP RSBP PEBP
In percent 2011 2010 2011 2010 2011 2010
Weighted average assumptions used to determine projected benefit obligations
Discount rate 5.30 5.75 5.50 6.00 5.20 5.75
rate of compensation increase 5.90 6.20 5.90 6.20
Health care growth rates - at end of fiscal year
6.90 7.00
ultimate health care growth rate 4.00 4.25
Year in which ultimate rate is reached
2022 2022
Weighted average assumptions used to determine net periodic pension cost
Discount rate 5.75 7.00 6.00 7.00 5.75 7.00
expected return on plan assets 6.75 7.75 7.75 7.75
rate of compensation increase 6.20 6.70 6.20 6.70
Health care growth rates - at end of fiscal year
7.00 7.00
ultimate health care growth rate 4.25 4.75
Year in which ultimate rate is reached
2022 2017
the medical cost trend rate can significantly affect the reported postretirement benefit income or costs and benefit obligations for the rSBp. the following table shows the effects of a one-percentage-point change in the assumed healthcare cost trend rate:
In thousands of uS dollarsOne percentage point increase
One percentage point decrease
effect on total service and interest cost $400 $(300)
effect on postretirement benefit obligation 3,200 (2,500)
Investment Strategy
the investment policies establish the framework for investment of the plan assets based on long-term investment objectives and the trade-offs inherent in seeking adequate investment returns within acceptable risk parameters. a key component of the investment policy is to establish a strategic asset allocation (Saa) representing the policy portfolio (i.e., neutral mix of assets) around which the plans are invested. the Saa for the plans are reviewed in detail and reset about every three to five years, with an annual review of key assumptions.

108 | MIGa annual report 2011
the key long-term objective is to target and secure asset performance that is reasonable in relation to the growth rate of the underlying liabilities and the assumed sponsor contribution rates. this is particularly so in the case of the Srp, which has liabilities that can be projected with a rea-sonable level of confidence based on the actuarial assumptions. Given the relatively long investment horizons of the Srp and rSBp of approxi-mately 10 years, and the relatively modest liquidity needs over the short-term to pay benefits and meet other cash requirements, the focus of the investment strategy is on generating sustainable long-term investment returns through various assets classes and strategies including equity, quasi-equity, private equity and real estate.
the Saa is derived using a mix of quantitative analysis that incorporates expected returns and volatilities by asset class as well as correlations across the asset classes, and qualitative considerations such as the desired liquidity needs of the plans. the strategic asset allocation is comprised of a diversified portfolio drawn from among fixed income, equity, real assets and absolute return strategies.
the revised target asset allocations for the Srp and rSBp were approved in December 2010 and april 2011, respectively, and the portfolio is cur-rently in transition to the new Saa. the following table presents the actual and target asset allocation at June 30, 2011 and June 30, 2010 by asset category for the Srp and rSrp.
In percent SRP RSBP
Target Allocation Effective
January 2011
% of Plan Assets
Target Allocation Effective May 2011
% of Plan Assets
Asset Class (%) 2011 2010 (%) 2011 2010
Fixed Income & Cash 31 32.6 40.6 24 33.2 35.7
public equity 27 23.9 15.5 29 26.6 22.6
private equity 15 20.2 19.8 20 24.9 25.6
Hedge Funds 15 10.8 13.3 15 8.1 10.4
real assets 12 12.5 10.8 12 7.2 5.7
Total 100 100 100 100 100 100
Significant Concentrations of Risk in Plan Assets
the assets of the Srp and rSBp are diversified across a variety of asset classes. Investments in these asset classes are further diversified across funds, managers, strategies, geographies and sectors to limit the impact of any individual investment. In spite of such level of diversification, equity market risk remains the primary source of the plans’ overall return volatility.
Risk Management Practices
risk management is an integral part of managing the assets of the plans. liability-driven management and asset diversification are central to the overall investment strategy and risk management approach for the Srp. the surplus volatility risk (defined as the annualized standard deviation of asset returns relative to that of liabilities) is considered the primary indicator of the Srp overall investment risk in the asset allocation process. the investment risk is regularly monitored at the absolute level, as well as at the relative levels with respect to policy benchmarks, and in the case of the Srp, to the liabilities. to assess the impact of extreme market events, stress tests are performed periodically using relevant market scenarios. Credit risk is controlled through the application of the eligibility criteria and concentration limits for transactions with individual issues. Counterparty risk exposure on over-the-counter derivatives is mitigated through the use of master netting arrangements and collateral. the plan manages its liquidity risk primarily by investing a portion of the asset base in securities that are either very liquid or can be liquidated at a fairly short notice at a reasonable price and by maintaining an adequate cash cushion. the level of illiquid asset classes appropriate in the portfolio also takes into account projected liquidity requirements.
risk management for different asset classes is tailored to their specific characteristics and is an integral part of external manager due diligence. In addition, monitoring of performance (both manager and asset class) against benchmarks and compliance with investment guidelines are carried out as part of the risk monitoring process.
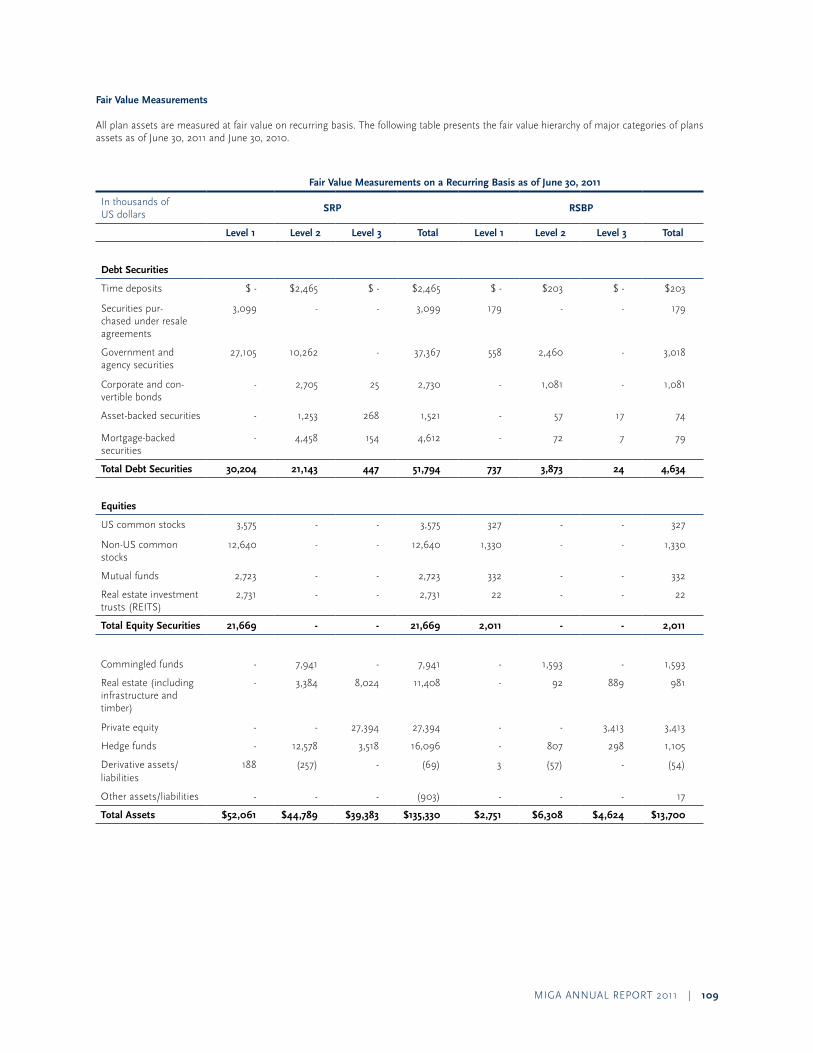
MIGa annual report 2011 | 109
Fair Value Measurements
all plan assets are measured at fair value on recurring basis. the following table presents the fair value hierarchy of major categories of plans assets as of June 30, 2011 and June 30, 2010.
Fair Value Measurements on a Recurring Basis as of June 30, 2011
In thousands of uS dollars
SRP RSBP
Level 1 Level 2 Level 3 Total Level 1 Level 2 Level 3 Total
Debt Securities
time deposits $ - $2,465 $ - $2,465 $ - $203 $ - $203
Securities pur-chased under resale agreements
3,099 - - 3,099 179 - - 179
Government and agency securities
27,105 10,262 - 37,367 558 2,460 - 3,018
Corporate and con-vertible bonds
- 2,705 25 2,730 - 1,081 - 1,081
asset-backed securities - 1,253 268 1,521 - 57 17 74
Mortgage-backed securities
- 4,458 154 4,612 - 72 7 79
Total Debt Securities 30,204 21,143 447 51,794 737 3,873 24 4,634
Equities
uS common stocks 3,575 - - 3,575 327 - - 327
non-uS common stocks
12,640 - - 12,640 1,330 - - 1,330
Mutual funds 2,723 - - 2,723 332 - - 332
real estate investment trusts (reItS)
2,731 - - 2,731 22 - - 22
Total Equity Securities 21,669 - - 21,669 2,011 - - 2,011
Commingled funds - 7,941 - 7,941 - 1,593 - 1,593
real estate (including infrastructure and timber)
- 3,384 8,024 11,408 - 92 889 981
private equity - - 27,394 27,394 - - 3,413 3,413
Hedge funds - 12,578 3,518 16,096 - 807 298 1,105
Derivative assets/ liabilities
188 (257) - (69) 3 (57) - (54)
other assets/liabilities - - - (903) - - - 17
Total Assets $52,061 $44,789 $39,383 $135,330 $2,751 $6,308 $4,624 $13,700

110 | MIGa annual report 2011
Fair Value Measurements on a Recurring Basis as of June 30, 2010
In thousands of uS dollars
SRP RSBP
Level 1 Level 2 Level 3 Total Level 1 Level 2 Level 3 Total
Debt Securities
time deposits $ - $1,864 $ - $1,864 $ - $149 $ - $149
Securities purchased under resale agreements
2,452 - - 2,452 291 - - 291
Government and agency securities
29,491 2,267 - 31,759 1,016.7 1,549 - 2,566
Corporate and con-vertible bonds
- 4,962 42 5,004 - 853 3 856
asset-backed securities - 1,288 545 1,832 - 53 18 70
Mortgage-backed securities
- 7,384 248 7,632 - 140 6 145
Total Debt Securities 31,943 17,765 834 50,542 1,308 2,743 26 4,077
Equities
uS common stocks 2,969 - - 2,969 253 - - 253
non-uS common stocks
9,435 - - 9,435 1,009 - - 1,009
Mutual funds 532 - - 532 48 - - 48
real estate investment trusts (reItS)
1,890 - - 1,890 12 - - 12
Total Equity Securities 14,826 - - 14,826 1,323 - - 1,323
Commingled funds - 6,001 - 6,001 - 1,179 - 1,179
real estate (including infrastructure and timber)
- - 7,892 7,892 - - 632 632
private equity - - 23,557 23,557 - - 2,888 2,888
Hedge funds - 12,378 4,499 16,877 - 800 367 1,167
Derivative assets/ liabilities
48 (146) - (98) 1 61 - 62
other assets/liabilities - - - (1,083) - - - (76)
Total Assets $46,816 $35,997 $36,782 $118,513 $2,632 $4,783 $3,913 $11,252
Valuation Methods and Assumptions
the following are general descriptions of asset categories, as well as the valuation methodologies and inputs used to determine the fair value of each major category of plan assets. It is important to note that the investment amounts in the asset categories shown in the table above may be different from the asset category allocation shown in the Investment Strategy section of the note. asset classes in the table above are grouped by the characteristics of the investments held. the asset class break-down in the Investment Strategy section is based on management’s view of the economic exposures after considering the impact of derivatives and certain trading strategies.
Debt securities include time deposits, u.S. treasuries and agencies, debt obligations of foreign governments and debt obligations in corporations of domestic and foreign issuers. Fixed income also includes investments in asset-backed securities such as collateralized mortgage obligations and mortgage-backed securities. these securities are valued by independent pricing vendors at quoted market prices for the same or similar securities, where available. If quoted market prices are not available, fair values are based on discounted cash flow models using market-based parameters such as yield curves, interest rates, volatilities, foreign exchange rates and credit curves. Some debt securities are valued using
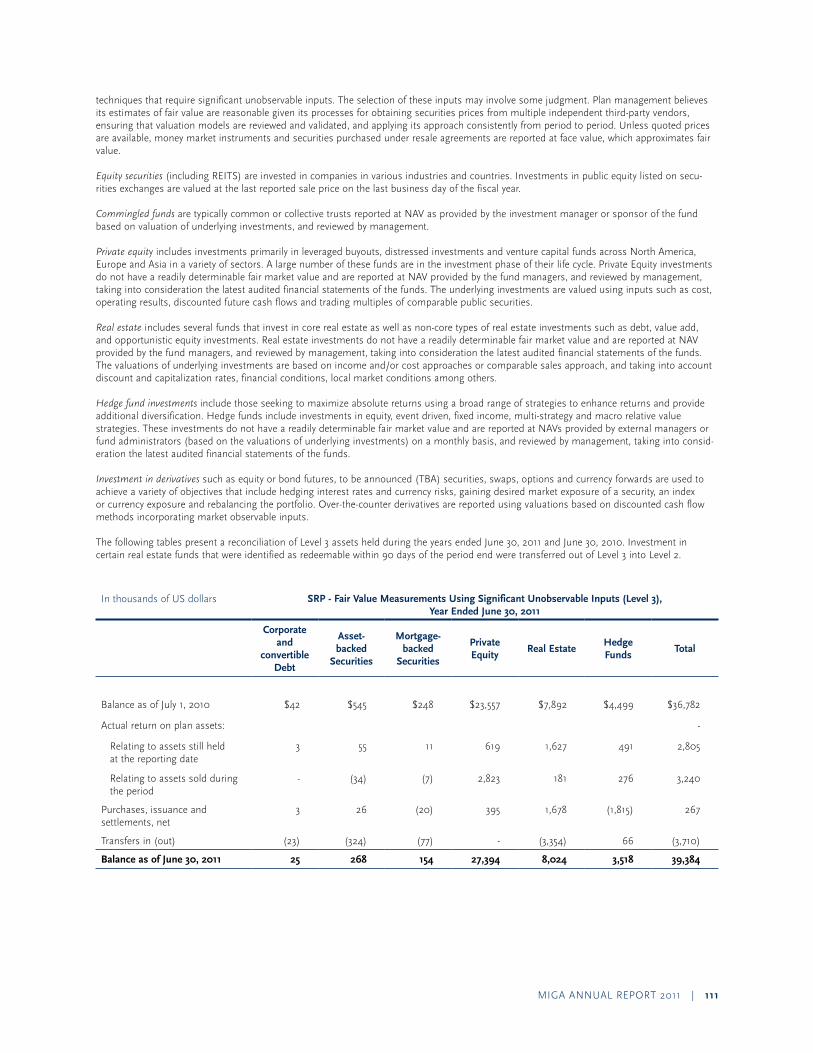
MIGa annual report 2011 | 111
techniques that require significant unobservable inputs. the selection of these inputs may involve some judgment. plan management believes its estimates of fair value are reasonable given its processes for obtaining securities prices from multiple independent third-party vendors, ensuring that valuation models are reviewed and validated, and applying its approach consistently from period to period. unless quoted prices are available, money market instruments and securities purchased under resale agreements are reported at face value, which approximates fair value.
Equity securities (including reItS) are invested in companies in various industries and countries. Investments in public equity listed on secu-rities exchanges are valued at the last reported sale price on the last business day of the fiscal year.
Commingled funds are typically common or collective trusts reported at naV as provided by the investment manager or sponsor of the fund based on valuation of underlying investments, and reviewed by management.
Private equity includes investments primarily in leveraged buyouts, distressed investments and venture capital funds across north america, europe and asia in a variety of sectors. a large number of these funds are in the investment phase of their life cycle. private equity investments do not have a readily determinable fair market value and are reported at naV provided by the fund managers, and reviewed by management, taking into consideration the latest audited financial statements of the funds. the underlying investments are valued using inputs such as cost, operating results, discounted future cash flows and trading multiples of comparable public securities.
Real estate includes several funds that invest in core real estate as well as non-core types of real estate investments such as debt, value add, and opportunistic equity investments. real estate investments do not have a readily determinable fair market value and are reported at naV provided by the fund managers, and reviewed by management, taking into consideration the latest audited financial statements of the funds. the valuations of underlying investments are based on income and/or cost approaches or comparable sales approach, and taking into account discount and capitalization rates, financial conditions, local market conditions among others.
Hedge fund investments include those seeking to maximize absolute returns using a broad range of strategies to enhance returns and provide additional diversification. Hedge funds include investments in equity, event driven, fixed income, multi-strategy and macro relative value strategies. these investments do not have a readily determinable fair market value and are reported at naVs provided by external managers or fund administrators (based on the valuations of underlying investments) on a monthly basis, and reviewed by management, taking into consid-eration the latest audited financial statements of the funds.
Investment in derivatives such as equity or bond futures, to be announced (tBa) securities, swaps, options and currency forwards are used to achieve a variety of objectives that include hedging interest rates and currency risks, gaining desired market exposure of a security, an index or currency exposure and rebalancing the portfolio. over-the-counter derivatives are reported using valuations based on discounted cash flow methods incorporating market observable inputs.
the following tables present a reconciliation of level 3 assets held during the years ended June 30, 2011 and June 30, 2010. Investment in certain real estate funds that were identified as redeemable within 90 days of the period end were transferred out of level 3 into level 2.
In thousands of uS dollars SRP - Fair Value Measurements Using Significant Unobservable Inputs (Level 3), Year Ended June 30, 2011
Corporate and
convertible Debt
Asset- backed
Securities
Mortgage-backed
Securities
Private Equity
Real EstateHedge Funds
Total
Balance as of July 1, 2010 $42 $545 $248 $23,557 $7,892 $4,499 $36,782
actual return on plan assets: -
relating to assets still held at the reporting date
3 55 11 619 1,627 491 2,805
relating to assets sold during the period
- (34) (7) 2,823 181 276 3,240
purchases, issuance and settlements, net
3 26 (20) 395 1,678 (1,815) 267
transfers in (out) (23) (324) (77) - (3,354) 66 (3,710)
Balance as of June 30, 2011 25 268 154 27,394 8,024 3,518 39,384
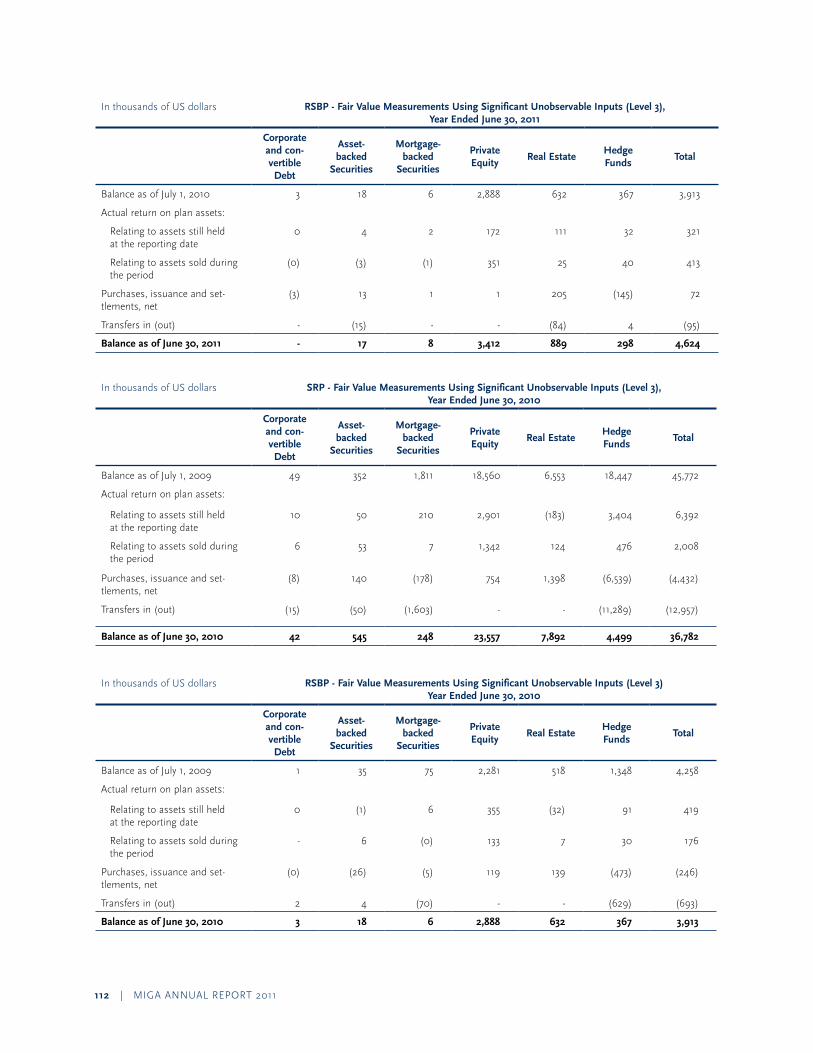
112 | MIGa annual report 2011
In thousands of uS dollars RSBP - Fair Value Measurements Using Significant Unobservable Inputs (Level 3), Year Ended June 30, 2011
Corporate and con-vertible
Debt
Asset- backed
Securities
Mortgage-backed
Securities
Private Equity
Real EstateHedge Funds
Total
Balance as of July 1, 2010 3 18 6 2,888 632 367 3,913
actual return on plan assets:
relating to assets still held at the reporting date
0 4 2 172 111 32 321
relating to assets sold during the period
(0) (3) (1) 351 25 40 413
purchases, issuance and set-tlements, net
(3) 13 1 1 205 (145) 72
transfers in (out) - (15) - - (84) 4 (95)
Balance as of June 30, 2011 - 17 8 3,412 889 298 4,624
In thousands of uS dollars SRP - Fair Value Measurements Using Significant Unobservable Inputs (Level 3), Year Ended June 30, 2010
Corporate and con-vertible
Debt
Asset- backed
Securities
Mortgage-backed
Securities
Private Equity
Real EstateHedge Funds
Total
Balance as of July 1, 2009 49 352 1,811 18,560 6,553 18,447 45,772
actual return on plan assets:
relating to assets still held at the reporting date
10 50 210 2,901 (183) 3,404 6,392
relating to assets sold during the period
6 53 7 1,342 124 476 2,008
purchases, issuance and set-tlements, net
(8) 140 (178) 754 1,398 (6,539) (4,432)
transfers in (out) (15) (50) (1,603) - - (11,289) (12,957)
Balance as of June 30, 2010 42 545 248 23,557 7,892 4,499 36,782
In thousands of uS dollars RSBP - Fair Value Measurements Using Significant Unobservable Inputs (Level 3) Year Ended June 30, 2010
Corporate and con-vertible
Debt
Asset-backed
Securities
Mortgage-backed
Securities
Private Equity
Real EstateHedge Funds
Total
Balance as of July 1, 2009 1 35 75 2,281 518 1,348 4,258
actual return on plan assets:
relating to assets still held at the reporting date
0 (1) 6 355 (32) 91 419
relating to assets sold during the period
- 6 (0) 133 7 30 176
purchases, issuance and set-tlements, net
(0) (26) (5) 119 139 (473) (246)
transfers in (out) 2 4 (70) - - (629) (693)
Balance as of June 30, 2010 3 18 6 2,888 632 367 3,913
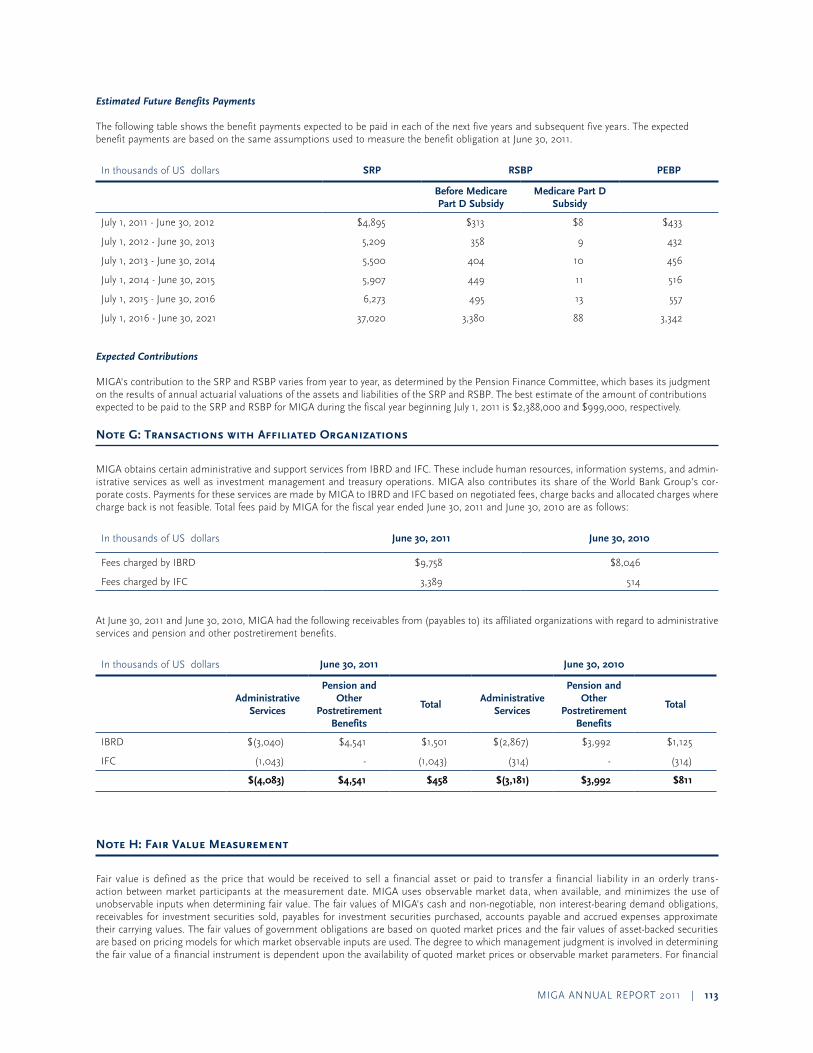
MIGa annual report 2011 | 113
Estimated Future Benefits Payments
the following table shows the benefit payments expected to be paid in each of the next five years and subsequent five years. the expected benefit payments are based on the same assumptions used to measure the benefit obligation at June 30, 2011.
In thousands of uS dollars SRP RSBP PEBP
Before Medicare Part D Subsidy
Medicare Part D Subsidy
July 1, 2011 - June 30, 2012 $4,895 $313 $8 $433
July 1, 2012 - June 30, 2013 5,209 358 9 432
July 1, 2013 - June 30, 2014 5,500 404 10 456
July 1, 2014 - June 30, 2015 5,907 449 11 516
July 1, 2015 - June 30, 2016 6,273 495 13 557
July 1, 2016 - June 30, 2021 37,020 3,380 88 3,342
Expected Contributions
MIGa’s contribution to the Srp and rSBp varies from year to year, as determined by the pension Finance Committee, which bases its judgment on the results of annual actuarial valuations of the assets and liabilities of the Srp and rSBp. the best estimate of the amount of contributions expected to be paid to the Srp and rSBp for MIGa during the fiscal year beginning July 1, 2011 is $2,388,000 and $999,000, respectively.
Note G: Transactions with Affiliated Organizations
MIGa obtains certain administrative and support services from IBrD and IFC. these include human resources, information systems, and admin-istrative services as well as investment management and treasury operations. MIGa also contributes its share of the World Bank Group’s cor-porate costs. payments for these services are made by MIGa to IBrD and IFC based on negotiated fees, charge backs and allocated charges where charge back is not feasible. total fees paid by MIGa for the fiscal year ended June 30, 2011 and June 30, 2010 are as follows:
In thousands of uS dollars June 30, 2011 June 30, 2010
Fees charged by IBrD $9,758 $8,046
Fees charged by IFC 3,389 514
at June 30, 2011 and June 30, 2010, MIGa had the following receivables from (payables to) its affiliated organizations with regard to administrative services and pension and other postretirement benefits.
In thousands of uS dollars June 30, 2011 June 30, 2010
Administrative Services
Pension and Other
Postretirement Benefits
TotalAdministrative
Services
Pension and Other
Postretirement Benefits
Total
IBrD $(3,040) $4,541 $1,501 $(2,867) $3,992 $1,125
IFC (1,043) - (1,043) (314) - (314)
$(4,083) $4,541 $458 $(3,181) $3,992 $811
Note H: Fair Value Measurement
Fair value is defined as the price that would be received to sell a financial asset or paid to transfer a financial liability in an orderly trans-action between market participants at the measurement date. MIGa uses observable market data, when available, and minimizes the use of unobservable inputs when determining fair value. the fair values of MIGa’s cash and non-negotiable, non interest-bearing demand obligations, receivables for investment securities sold, payables for investment securities purchased, accounts payable and accrued expenses approximate their carrying values. the fair values of government obligations are based on quoted market prices and the fair values of asset-backed securities are based on pricing models for which market observable inputs are used. the degree to which management judgment is involved in determining the fair value of a financial instrument is dependent upon the availability of quoted market prices or observable market parameters. For financial
114 | MIGa annual report 2011
instruments that trade actively and have quoted market prices or observable market parameters, there is minimal subjectivity involved in mea-suring fair value. Substantially all of MIGa’s financial instruments use either of the foregoing methodologies to determine fair values that are recorded on its financial statements.
Note I: Risk Management
the responsibility for approving MIGa’s risk management policies lies with the Board of Directors. the audit Committee of the Board deals with risk management issues. While the executive Vice president assumes the responsibility for overall risk management with the support of the senior management team, the responsibility for the design and operational implementation of the risk management framework lies with the Finance and risk Management Group with coordination from the legal affairs and Claims Group, the operations Group and the economics and policy Group.
Risk Categories
MIGa is exposed to a variety of risks and uses risk management programs, such as an economic Capital Framework, and reinsurance arrangements to manage its risk. Below is a description of risk management systems of the important risks for MIGa.
r Insurance Risk political risk assessment forms an integral part of MIGa’s underwriting process, and includes the analysis of both country-related and project-related risks. Insurance risk arises from MIGa’s core business of issuing investment guarantees. MIGa’s earnings depend upon the extent to which claims experience is consistent with assumptions used in setting prices for products and establishing technical pro-visions and liabilities for claims. If the actual claims experience of the agency is less favorable than underlying assumptions, then income would be reduced. MIGa monitors claim activities and provisions for pending claims. In addition, claims reserves for the guarantee portfolio are calculated using MIGa’s economic Capital model.
Economic Capital and Portfolio Risk Modeling
For portfolio risk management purposes, MIGa currently utilizes an economic Capital Model, based on the latent factor model of the Merton framework in credit risk modeling. the economic Capital (eC) concept is a widely recognized risk management tool in the banking and insurance industries, defining the amount of capital an organization needs to hold in order to sustain larger than expected losses with a high degree of certainty, over a defined time horizon and given the risk exposure and defined risk tolerance. MIGa defines its economic capital as the 99.99th per-centile of the aggregate loss distribution over a one year horizon, minus the mean of the loss distribution, which is in line with industry practice.
the model helps evaluate concentration risk in the guarantee portfolio and facilitates active, risk-based exposure management by allocating the economic Capital to particular regions, countries, sectors, covers, or individual contracts, based on their respective risk contribution. In order to prevent excessive risk concentration, MIGa uses the economic Capital model to set exposure limits per country and per project, and to support decision making in terms of pricing and exposure retention for new projects. MIGa’s reinsurance program, including treaty and facultative rein-surance, is linked to the portfolio risk modeling and helps manage the risk profile of the portfolio.
the economic Capital model also serves as the cornerstone of MIGa’s capital adequacy framework, and provides the analytical basis for risk-based pricing of its products as well as quantification of the need for prudent technical provisions for claims. In addition, the model-based capital adequacy assessment determines the size and duration targets for MIGa’s liquidity holdings. the economic capital, pricing models and underlying parameters are reviewed periodically. eC-based risk measures are combined with nominal exposures and income information in a comprehensive portfolio exposure and risk report prepared for MIGa management on a monthly basis.
r Credit Risk Counter-party credit risk in MIGa’s portfolio is the risk that reinsurers would fail to pay their share of a claim. MIGa requires that private sector reinsurers with which it conducts business be rated by at least two of the four major rating agencies (Standard & poor’s, a.M. Best, Moody’s and Fitch), and that the ratings be above a minimum threshold. also, MIGa has established limits at both the project and portfolio levels, which restrict the amount of reinsurance. at present MIGa’s investment portfolio does not have any significant credit risk exposure. MIGa currently invests in fixed income securities with high credit quality. the Investment authorization stipulates that government or agency sponsored debt securities be aa-rated or above, time deposits be a-rated or above, and corporate debt securities be aaa-rated.
r Interest Rate Risk Interest rate changes affect the market values of MIGa’s invested assets. a need to liquidate assets to pay for claims in an unfavorable interest rate environment may generate trading losses and reduce investment income. Changes in interest rates will also affect pre-payment speeds of mortgage and asset-backed security holdings, which may affect the duration of the asset portfolio. a 100 basis point parallel shift in the yield curve would impact the net income in FY11 by approximately $21.3 million (FY10: $6.1 million). this interest rate sensitivity is illustrative only and is based on simplified scenarios. the impact of a parallel shift in interest rates is determined using market value weighted portfolio duration applied to invested asset balance at year end.
r Foreign Exchange Rate Risk the majority of MIGa’s assets and contingent liabilities are denominated in uSD, but some guarantee contracts are issued in other currencies such as eur. to the extent that a claim is made in a non-uSD currency and requires payment in excess of MIGa’s holdings of that currency, MIGa may face a foreign exchange-related loss in converting to the needed currency to pay for a claim. a 10% change
MIGa annual report 2011 | 115
in the uSD/euro year-end exchange rate would impact net income in FY11 by approximately $8.1 million (FY10: $11.6 million) and net guarantee exposure by approximately $203.4 million (FY10: $132.2 million). the impact on the net income is mitigated by an offsetting effect due to exchange rate movement on provision for claims. this foreign exchange rate sensitivity is illustrative only and is based on simplified scenarios.
r Liquidity Risk adequate liquidity resources need to be maintained to sustain the agency over prolonged periods of cash payouts due to claims. MIGa assesses and monitors the availability of its liquid assets on a periodic basis and analyzes the impact on its finances (capital and liquidity) under severe stress scenarios where claims situations propagate through contagion across countries and regions. as of June 30, 2011, there were claims filed with the agency for $10 million. It is estimated that a claims payout would be made within a year, provided that the claim is valid.
r Operational Risk operational risk is intrinsic to financial institutions and is an important component of the agency-wide risk management framework. the most important types of operational risk involve breakdowns in internal controls and corporate governance.
MIGa mitigates operational risks by maintaining a sound internal control system. Since 2000, MIGa has adopted the Committee of Sponsoring organizations of the treadway Commission (CoSo)’s integrated internal control framework, in line with IBrD/IDa and IFC, to regularly evaluate the effectiveness of internal control system. In addition, MIGa has introduced an operational risk management system to strengthen monitoring of the operational risks and controls in the financial reporting process, and the effectiveness of key controls in the financial reporting process are assessed through the internal quality assurance review process.
MIGa’s internal controls are regularly evaluated through independent review by the Internal audit Department (IaD) of the World Bank Group.
With regard to information technology, all MIGa information systems and applications are hosted on the IBrD technology infrastructure that is configured and adherent to the information security policy and procedures of the World Bank Group. In addition, increased collaboration with the World Bank Group has allowed MIGa to gain access to a larger pool of specialized skill sets to support its information systems. MIGa’s client relationship management system (MIGa CrM) is fully integrated with the agency’s core financial system (Guarantee Database). Its content is reviewed and verified against an external anti-Money laundering (aMl) and Combating the Financing of terrorism (CFt) database service. MIGa redesigned its core information and financial system for managing and reporting data on activities supporting the guarantee process and imple-mented a new Guarantee Database on a Sap-based platform in March 2010.
For business continuity, MIGa’s corporate web services have now been added to MIGa’s information systems already hosted at the World Bank Group’s Business Continuity Center. In addition, MIGa departments have further documented their business processes required to support the agency’s effort to re-establish basic operations following a crisis. For data security, more robust reporting functions and security monitoring have been implemented to further enhance MIGa’s information security.
r Legal Risk legal risks arise primarily from changes in the legal parameters of MIGa’s member countries as a result of legislation or court decisions that may affect MIGa’s activities. there are also legal risks associated with MIGa being involved in legal disputes and arbitration pro-ceedings, especially in the context of claim resolution or settlement. MIGa manages these risks by monitoring current and prospective future developments by way of ongoing discussions with member countries’ representatives on the Board of Directors and Council of Governors. MIGa also shares information and analyses with other members of the World Bank Group, the IMF and the united nations. In addition, MIGa actively participates as a member of the Berne union in discussions and analyses of the changes in the operating investment environment in its member countries.
116 | MIGa annual report 2011
appendicesGovernors and alternatesDirectors and alternates: Voting powerMIGa Member Countries Signatories to MIGa’s ConventionSubscriptions to the General Capital IncreaseFacultative reinsurance obtained by MIGaFacultative reinsurance provided by MIGaGuarantee Clientsphoto Credits
appendices
MIGa annual report 2011 | 117
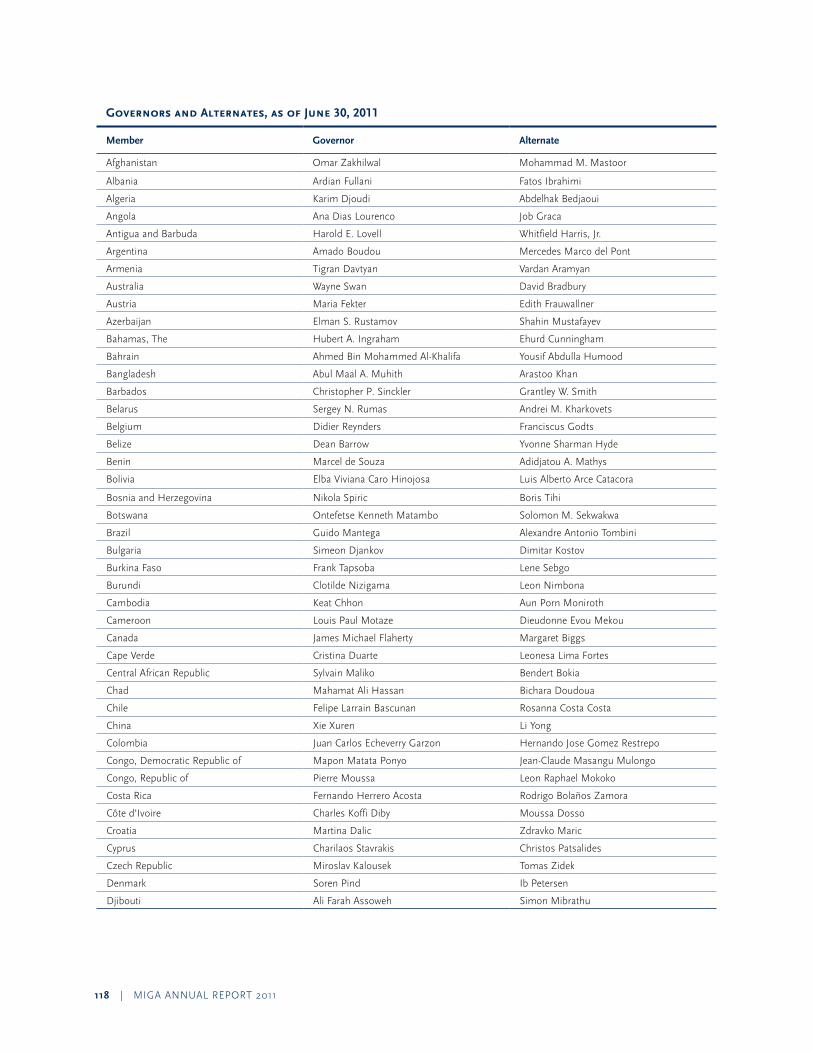
118 | MIGa annual report 2011
Governors and Alternates, as of June 30, 2011
Member Governor Alternate
afghanistan omar Zakhilwal Mohammad M. Mastoor
albania ardian Fullani Fatos Ibrahimi
algeria Karim Djoudi abdelhak Bedjaoui
angola ana Dias lourenco Job Graca
antigua and Barbuda Harold e. lovell Whitfield Harris, Jr.
argentina amado Boudou Mercedes Marco del pont
armenia tigran Davtyan Vardan aramyan
australia Wayne Swan David Bradbury
austria Maria Fekter edith Frauwallner
azerbaijan elman S. rustamov Shahin Mustafayev
Bahamas, the Hubert a. Ingraham ehurd Cunningham
Bahrain ahmed Bin Mohammed al-Khalifa Yousif abdulla Humood
Bangladesh abul Maal a. Muhith arastoo Khan
Barbados Christopher p. Sinckler Grantley W. Smith
Belarus Sergey n. rumas andrei M. Kharkovets
Belgium Didier reynders Franciscus Godts
Belize Dean Barrow Yvonne Sharman Hyde
Benin Marcel de Souza adidjatou a. Mathys
Bolivia elba Viviana Caro Hinojosa luis alberto arce Catacora
Bosnia and Herzegovina nikola Spiric Boris tihi
Botswana ontefetse Kenneth Matambo Solomon M. Sekwakwa
Brazil Guido Mantega alexandre antonio tombini
Bulgaria Simeon Djankov Dimitar Kostov
Burkina Faso Frank tapsoba lene Sebgo
Burundi Clotilde nizigama leon nimbona
Cambodia Keat Chhon aun porn Moniroth
Cameroon louis paul Motaze Dieudonne evou Mekou
Canada James Michael Flaherty Margaret Biggs
Cape Verde Cristina Duarte leonesa lima Fortes
Central african republic Sylvain Maliko Bendert Bokia
Chad Mahamat ali Hassan Bichara Doudoua
Chile Felipe larrain Bascunan rosanna Costa Costa
China Xie Xuren li Yong
Colombia Juan Carlos echeverry Garzon Hernando Jose Gomez restrepo
Congo, Democratic republic of Mapon Matata ponyo Jean-Claude Masangu Mulongo
Congo, republic of pierre Moussa leon raphael Mokoko
Costa rica Fernando Herrero acosta rodrigo Bolaños Zamora
Côte d’Ivoire Charles Koffi Diby Moussa Dosso
Croatia Martina Dalic Zdravko Maric
Cyprus Charilaos Stavrakis Christos patsalides
Czech republic Miroslav Kalousek tomas Zidek
Denmark Soren pind Ib petersen
Djibouti ali Farah assoweh Simon Mibrathu
MIGa annual report 2011 | 119
Governors and Alternates, as of June 30, 2011 (cont’d)
Member Governor Alternate
Dominica roosevelt Skerrit rosamund edwards
Dominican republic Juan temistocles Montas Daniel toribio
ecuador patricio rivera Yanez Katiuska King Mantilla
egypt, arab republic of Fayza aboulnaga Mounir Fakhry abdelnour
el Salvador alexander ernesto Segovia Juan ramon Carlos enrique Caceres
equatorial Guinea Jose ela oyana Montserat afang ondo
eritrea Berhane abrehe Kidane Martha Woldegiorghis
estonia Jurgen ligi tanel ross
ethiopia Sufian ahmed abi Woldemeskel Bayou
Fiji Josaia Voreqe Bainimarama Filimone Waqabaca
Finland Jyrki Katainen pentti pikkarainen
France Francois Baroin ramon Fernandez
Gabon Magloire ngambia roger owono Mba
Gambia, the Mambury njie Mod a.K. Secka
Georgia Dimitri Gvindadze Vera Kobalia
Germany Dirk niebel Joerg asmussen
Ghana Kwabena Duffuor Seth terkper
Greece Michalis Chrisochoidis Ioannis Drymoussis
Grenada V. nazim Burke timothy antoine
Guatemala erick Coyoy echeverria alfredo Del Cid pinillos
Guinea Kerfalla Yansane Souleymane Cisse
Guinea-Bissau Helena nosolini embalo Jose Carlos Varela Casimiro
Guyana Bharrat Jagdeo ashni Singh
Haiti ronald Baudin Charles Castel
Honduras William Chong Wong Maria elena Mondragon ordonez
Hungary roland natran laszlo orlos
Iceland ossur Skarphedinsson Steingrimur J. Sigfusson
India pranab Mukherjee r. Gopalan
Indonesia agus D.W. Martowardojo Darmin nasution
Iran, Islamic republic of Seyyed Shams al-din Hosseini Behrouz alishiri
Iraq rafe H. al-eissawi ali Gh. Baban
Ireland Michael noonan Kevin Cardiff
Israel Stanley Fischer Michal abadi-Boiangiu
Italy Mario Draghi Carlo Monticelli
Jamaica audley Shaw Wesley George Hughes
Japan Yoshihiko noda Shinichi nishimiya
Jordan Jafar Hassan Saleh al-Kharabsheh
Kazakhstan erbol orynbayev timur Suleimenov
Kenya uhuru Kenyatta Joseph Kanja Kinyua
Korea, republic of Jaewan Bahk Choongsoo Kim
Kosovo Bedri Hamza (vacant)
Kuwait Mustafa al-Shamali Bader Mohamed al-Saad
Kyrgyz republic Melis t. Mambetjanov uchkunbek tashbaev
120 | MIGa annual report 2011
Governors and Alternates, as of June 30, 2011 (cont’d)
Member Governor Alternate
lao people’s Democratic republic Somdy Douangdy Somphao phaysith
latvia andris Vilks artis Kampars
lebanon nicolas nahas Mohammad Safadi
lesotho timothy t. thahane Mosito Khethisa
liberia augustine Kpehe ngafuan amara Konneh
libya (vacant) (vacant)
lithuania Ingrida Simonyte rolandas Krisciunas
luxembourg luc Frieden arsene Jacoby
Macedonia, former Yugoslav republic of Zoran Stavreski Vladimir pesevski
Madagascar (vacant) (vacant)
Malawi Ken edward Kandodo abi Marambika Shawa
Malaysia Mohd. najib abdul razak Wan abdul aziz Wan abdullah
Maldives ali Hashim ahmed as-ad
Mali lassine Bouare Sambou Wague
Malta tonio Fenech alfred S. Camilleri
Mauritania Sidi ould tah Mohamed lemine ould ahmed
Mauritius pravind Kumar Jugnauth ali Michael Mansoor
Mexico ernesto Cordero arroyo Gerardo rodriguez regordosa
Micronesia, Federated States of (vacant) rose nakanaga
Moldova Veaceslav negruta Dumitru ursu
Mongolia Bayartsogt Sangajav purevdorj lkhanaasuren
Montenegro Milorad Katnic nemanja pavlicic
Morocco Salaheddine Mezouar nizar Baraka
Mozambique aiuba Cuereneia ernesto Gouveia Gove
namibia Saara Kuugongelwa-amadhila Ipumbu Shiimi
nepal Bharat Mohan adhikari Krishnahari Baskota
netherlands Jan Kees de Jager Ben Knapen
new Zealand Bill english Gabriel Makhlouf
nicaragua alberto Jose Guevara obregon antenor rosales Bolanos
nigeria olusegun o. aganga Danladi Kifasi
norway erik Solheim Ingrid Fiskaa
oman ahmed Macki Darwish bin Ismail al Balushi
pakistan Salman Siddique Muhammad Saleem Sethi
palau Kerai Mariur Dennis oilouch
panama alberto Vallarino Clement Dulcidio De la Guardia
papua new Guinea patrick pruaitch Simon tosali
paraguay Dionisio Borda Manuel Vidal Caballero Gimenez
peru Ismael alberto Benavides Ferreyros luis Miguel Castilla rubio
philippines Cesar V. purisima amando M. tetangco, Jr.
poland Michal Baj andrzej Ciopinski
portugal Fernando teixeira dos Santos Carlos Costa pina
Qatar Yousef Hussain Kamal abdullah Bin Saoud al-thani
romania Gheorghe Ialomitianu Cristian popa
russian Federation aleksei Kudrin elvira S. nabiullina

MIGa annual report 2011 | 121
Governors and Alternates, as of June 30, 2011 (cont’d)
Member Governor Alternate
rwanda John rwangombwa Kampeta Sayinzoga
St. Kitts and nevis Denzil Douglas Janet Harris
St. lucia Stephenson King Isaac anthony
St. Vincent and the Grenadines ralph e. Gonsalves laura anthony-Browne
Samoa Faumuina tiatia liuga Iulai lavea
Saudi arabia Ibrahim a. al-assaf Muhammad S. al-Jasser
Senegal abdoulaye Diop Mamadou abdoulaye Sow
Serbia Mirko Cvetkovic Verica Kalanovic
Seychelles ahmed afif Sherin renaud
Sierra leone Samura Mathew Wilson Kamara Sheku S. Sesay
Singapore tharman Shanmugaratnam peter ong Boon Kwee
Slovak republic Ivan Miklos Viliam ostrozlik
Slovenia Franc Krizanic Mitja Mavko
Solomon Islands Gordon Darcy lilo Shadrach Fanega
South africa pravin Jamnadas Gordhan lesetja Kganyago
Spain elena Salgado Jose Manuel Campa Fernandez
Sri lanka Mahinda rajapaksa p. B. Jayasundera
Sudan ali Mahmoud Mohamed abdelrasoul elfatih ali Siddig
Suriname Gillmore Hoefdraad adelien Wijnerman
Swaziland Bheki Sibonangaye Bhembe Sicelo M. Dlamini
Sweden anders Borg Gunilla Carlsson
Switzerland Beatrice Maser Mallor olivier Chave
Syrian arab republic Mohamad nedal al-Chaar (vacant)
tajikistan abdughaffor a. rahmonov Djamoliddin nuraliev
tanzania Mustafa Haidi Mkulo ramadhani Mussa Khijjah
thailand Korn Chatikavanij areepong Bhoocha-oom
timor-leste emilia pires Joao Goncalves
togo Dede ahoefa ekoue aheba Johnson
trinidad and tobago Winston Dookeran alison lewis
tunisia abdelhamid triki lamia Zribi
turkey Ibrahim H. Canakci evren Dilekli
turkmenistan annamuhammet Gochyev Gochmyrat a. Myradov
uganda Maria Kiwanuka Chris. M. Kassami
ukraine Sergiy tigipko Vasyl tsushko
united arab emirates (vacant) obaid Humaid al tayer
united Kingdom andrew Mitchell George osborne
united States timothy F. Geithner robert D. Hormats
uruguay Fernando lorenzo pedro Buonomo
uzbekistan ravshan Gulyamov Shukhrat Vafaev
Vanuatu Moana Kalosil Carcasses George Maniuri
Venezuela, república Bolivariana de Jorge Giordani (vacant)
Vietnam nguyen Van Giau nguyen Van Binh
Yemen, republic of abdulkarim I. al-arhabi Mutahar abdulaziz al-abbasi
Zambia Situmbeko Musokotwane likolo ndalamei
Zimbabwe tendai Biti Gideon Gono
122 | MIGa annual report 2011
Directors and Alternates: Voting Power, as of June 30, 2011
Director Alternate Casting votes of Total votes % of total
Elected by the votes of the six largest shareholders
Ian H. Solomon (Vacant) united States 32,805 15.03
nobumitsu Hayashi takaya Kishi Japan 9,220 4.23
Ingrid G. Hoven ruediger Von Kleist Germany 9,177 4.21
ambroise Fayolle anne touret-Blondy France 8,806 4.04
Susanna Moorehead Stewart James united Kingdom 8,806 4.04
Yang Shaolin Zou Ciyong China 5,771 2.64
Elected by the votes of other shareholders
rudolf treffers (netherlands)
tamara Solyanyk (ukraine)
armenia, Bosnia and Herzegovina, Bulgaria, Croatia, Cyprus, Georgia, Israel, Macedonia (former Yugoslav republic of), Moldova, Montenegro, netherlands, romania, ukraine
11,786 5.40
Gino alzetta (Belgium) Konstantin Huber (austria)
austria, Belarus, Belgium, Czech republic, Hungary, Kosovo, luxembourg, Slovak republic, Slovenia, turkey
11,049 5.06
Marie-lucie Morin (Canada)
Kelvin Dalrymple (Barbados)
antigua and Barbuda, the Bahamas, Barbados, Belize, Canada, Dominica, Grenada, Guyana, Ireland, Jamaica, St. Kitts and nevis, St. lucia, St. Vincent and the Grenadines
10,171 4.66
Merza H. Hasan (Kuwait) ayman alkaffas (arab republic of egypt)
Bahrain, egypt (arab republic of), Iraq, Jordan, Kuwait, lebanon, libya, Maldives, oman, Qatar, Syrian arab republic, united arab emirates, Yemen (republic of)
8,601 3.94
anna Brandt (Sweden) Jens Haarlov (Denmark)
Denmark, estonia, Finland, Iceland, latvia, lithuania, norway, Sweden
7,894 3.62
piero Cipollone (Italy) nuno Mota pinto (portugal)
albania, Greece, Italy, Malta, portugal, timor-leste
7,866 3.60
Hassan ahmed taha (Sudan)
Denny H. Kalyalya (Zambia)
Botswana, Burundi, eritrea, ethiopia, the Gambia, Kenya, lesotho, liberia, Malawi, Mozambique, namibia, rwanda, Seychelles, Sierra leone, Sudan, Swaziland, tanzania, uganda, Zambia, Zimbabwe
7,648 3.50
Marta Garcia (Spain) Juan Jose Bravo Moises (Mexico)
Costa rica, el Salvador, Guatemala, Honduras, Mexico, nicaragua, Spain, Venezuela (república Bolivariana de)
7,638 3.50
rogerio Studart (Brazil) Vishnu Dhanpaul (trinidad and tobago)
Brazil, Colombia, Dominican republic, ecuador, Haiti, panama, philippines, Suriname, trinidad and tobago
7,612 3.49
James Hagan (australia) In-Kang Cho (republic of Korea)
australia, Cambodia, Korea (republic of), Micronesia (Federated States of), Mongolia, new Zealand, palau, papua new Guinea, Samoa, Solomon Islands, Vanuatu
7,542 3.46
MIGa annual report 2011 | 123
Directors and Alternates: Voting Power, as of June 30, 2011 (cont’d)
Director Alternate Casting votes of Total votes % of total
Elected by the votes of other shareholders (cont’d)
pulok Chatterji (India) Kazi M. aminul Islam (Bangladesh)
Bangladesh, India, Sri lanka 7,171 3.29
Javed talat (pakistan) Sid ahmed Dib (algeria) afganistan, algeria, Ghana, Iran (Islamic republic of), Morocco, pakistan, tunisia
7,091 3.25
Jorg Frieden (Switzerland) Michal Krupinski (poland)
azerbaijan, Kazakhstan, Kyrgyz republic, poland, Serbia, Switzerland, tajikistan, turkmenistan, uzbekistan
6,914 3.17
agapito Mendes Dias (São tomé and principe)
Mohamed Sikieh Kayad (Djibouti)
Benin, Burkina Faso, Cameroon, Cape Verde, Central african republic, Chad, Congo (Democratic republic of), Congo (republic of), Côte d’Ivoire, Djibouti, equatorial Guinea, Gabon, Guinea-Bissau, Mali, Mauritania, Mauritius, Senegal, togo
6,864 3.15
Hekinus Manao (Indonesia)
Dyg Sadiah Binti abg Bohan (Malaysia)
Fiji, Indonesia, lao people’s Democratic republic, Malaysia, nepal, Singapore, thailand, Vietnam
6,452 2.96
Vadim Grishin (russian Federation)
eugene Miagkov (russian Federation)
russian Federation 5,769 2.64
abdulrahman M. almofadhi (Saudi arabia)
Ibrahim alturki (Saudi arabia)
Saudi arabia 5,769 2.64
Felix alberto Camarasa (argentina)
Varinia Cecilia Daza Foronda (Bolivia)
argentina, Bolivia, Chile, paraguay, peru, uruguay
5,731 2.63
renosi Mokate(South africa)
Mansur Muhtar (nigeria)
angola, nigeria, South africa 4,059 1.86
In addition to the directors and alternates shown in the foregoing list, the following also served after November 1, 2010:
Director End of period of service
Alternate director End of period of service
Michel Mordasini (Switzerland)
March 14, 2011 Irfa ampri (Indonesia)
May 1, 2011
Chang Junhong (China)
november 9, 2010
Michihiro Kishimoto (Japan)
February 7, 2011
Do-Hyeong Kim (republic of Korea)
april 26, 2011
Note: Guinea (332 votes) and Madagascar (417 votes) did not participate in the 2010 Regular Election of Directors.
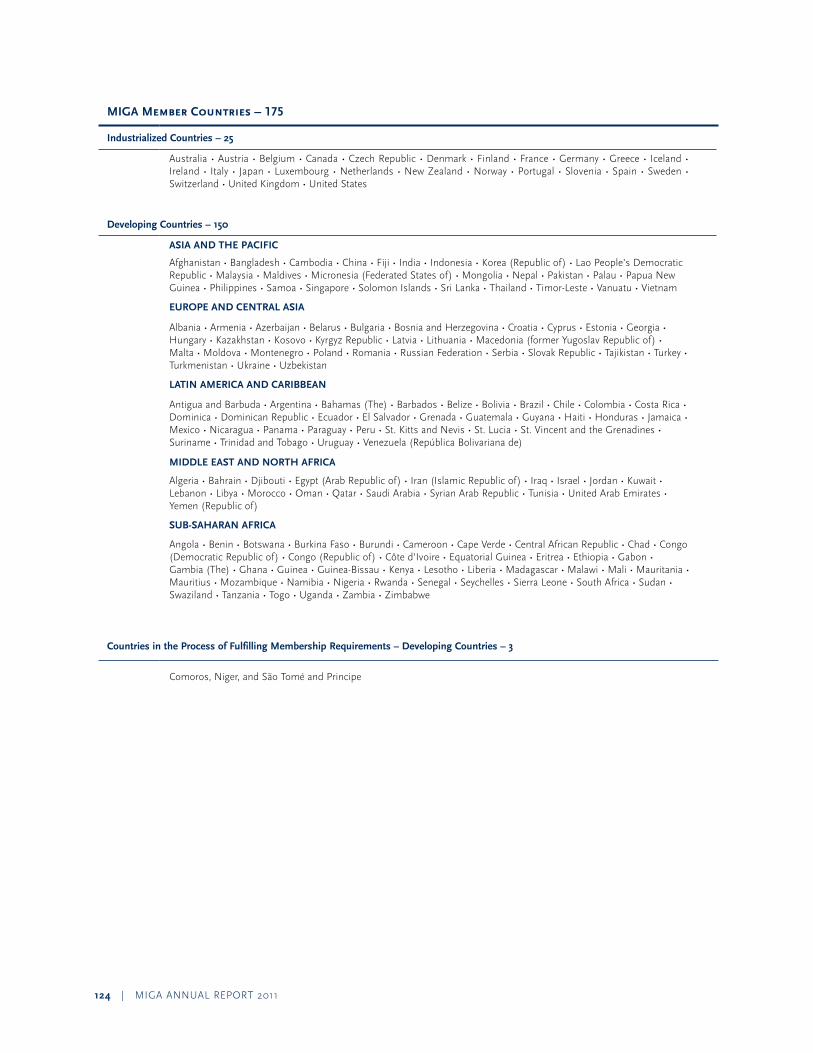
124 | MIGa annual report 2011
MIGA Member Countries – 175
Industrialized Countries – 25
australia • austria • Belgium • Canada • Czech republic • Denmark • Finland • France • Germany • Greece • Iceland • Ireland • Italy • Japan • luxembourg • netherlands • new Zealand • norway • portugal • Slovenia • Spain • Sweden • Switzerland • united Kingdom • united States
Developing Countries – 150
ASIA AND THE PACIFIC
afghanistan • Bangladesh • Cambodia • China • Fiji • India • Indonesia • Korea (republic of) • lao people’s Democratic republic • Malaysia • Maldives • Micronesia (Federated States of) • Mongolia • nepal • pakistan • palau • papua new Guinea • philippines • Samoa • Singapore • Solomon Islands • Sri lanka • thailand • timor-leste • Vanuatu • Vietnam
EUROPE AND CENTRAL ASIA
albania • armenia • azerbaijan • Belarus • Bulgaria • Bosnia and Herzegovina • Croatia • Cyprus • estonia • Georgia • Hungary • Kazakhstan • Kosovo • Kyrgyz republic • latvia • lithuania • Macedonia (former Yugoslav republic of) • Malta • Moldova • Montenegro • poland • romania • russian Federation • Serbia • Slovak republic • tajikistan • turkey • turkmenistan • ukraine • uzbekistan
LATIN AMERICA AND CARIBBEAN
antigua and Barbuda • argentina • Bahamas (the) • Barbados • Belize • Bolivia • Brazil • Chile • Colombia • Costa rica • Dominica • Dominican republic • ecuador • el Salvador • Grenada • Guatemala • Guyana • Haiti • Honduras • Jamaica • Mexico • nicaragua • panama • paraguay • peru • St. Kitts and nevis • St. lucia • St. Vincent and the Grenadines • Suriname • trinidad and tobago • uruguay • Venezuela (república Bolivariana de)
MIDDLE EAST AND NORTH AFRICA
algeria • Bahrain • Djibouti • egypt (arab republic of) • Iran (Islamic republic of) • Iraq • Israel • Jordan • Kuwait • lebanon • libya • Morocco • oman • Qatar • Saudi arabia • Syrian arab republic • tunisia • united arab emirates • Yemen (republic of)
SUB-SAHARAN AFRICA
angola • Benin • Botswana • Burkina Faso • Burundi • Cameroon • Cape Verde • Central african republic • Chad • Congo (Democratic republic of) • Congo (republic of) • Côte d’Ivoire • equatorial Guinea • eritrea • ethiopia • Gabon • Gambia (the) • Ghana • Guinea • Guinea-Bissau • Kenya • lesotho • liberia • Madagascar • Malawi • Mali • Mauritania • Mauritius • Mozambique • namibia • nigeria • rwanda • Senegal • Seychelles • Sierra leone • South africa • Sudan • Swaziland • tanzania • togo • uganda • Zambia • Zimbabwe
Countries in the Process of Fulfilling Membership Requirements – Developing Countries – 3
Comoros, niger, and São tomé and principe
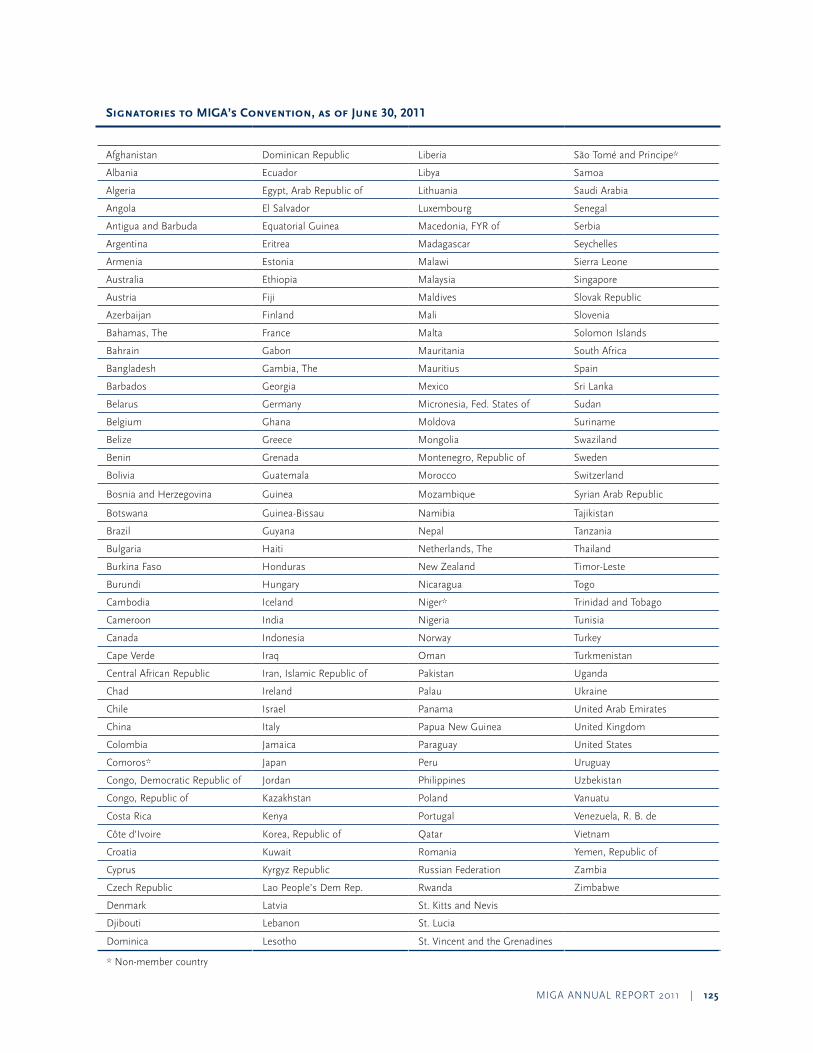
MIGa annual report 2011 | 125
Signatories to MIGA’s Convention, as of June 30, 2011
afghanistan Dominican republic liberia São tomé and principe*
albania ecuador libya Samoa
algeria egypt, arab republic of lithuania Saudi arabia
angola el Salvador luxembourg Senegal
antigua and Barbuda equatorial Guinea Macedonia, FYr of Serbia
argentina eritrea Madagascar Seychelles
armenia estonia Malawi Sierra leone
australia ethiopia Malaysia Singapore
austria Fiji Maldives Slovak republic
azerbaijan Finland Mali Slovenia
Bahamas, the France Malta Solomon Islands
Bahrain Gabon Mauritania South africa
Bangladesh Gambia, the Mauritius Spain
Barbados Georgia Mexico Sri lanka
Belarus Germany Micronesia, Fed. States of Sudan
Belgium Ghana Moldova Suriname
Belize Greece Mongolia Swaziland
Benin Grenada Montenegro, republic of Sweden
Bolivia Guatemala Morocco Switzerland
Bosnia and Herzegovina Guinea Mozambique Syrian arab republic
Botswana Guinea-Bissau namibia tajikistan
Brazil Guyana nepal tanzania
Bulgaria Haiti netherlands, the thailand
Burkina Faso Honduras new Zealand timor-leste
Burundi Hungary nicaragua togo
Cambodia Iceland niger* trinidad and tobago
Cameroon India nigeria tunisia
Canada Indonesia norway turkey
Cape Verde Iraq oman turkmenistan
Central african republic Iran, Islamic republic of pakistan uganda
Chad Ireland palau ukraine
Chile Israel panama united arab emirates
China Italy papua new Guinea united Kingdom
Colombia Jamaica paraguay united States
Comoros* Japan peru uruguay
Congo, Democratic republic of Jordan philippines uzbekistan
Congo, republic of Kazakhstan poland Vanuatu
Costa rica Kenya portugal Venezuela, r. B. de
Côte d’Ivoire Korea, republic of Qatar Vietnam
Croatia Kuwait romania Yemen, republic of
Cyprus Kyrgyz republic russian Federation Zambia
Czech republic lao people’s Dem rep. rwanda Zimbabwe
Denmark latvia St. Kitts and nevis
Djibouti lebanon St. lucia
Dominica lesotho St. Vincent and the Grenadines
* non-member country
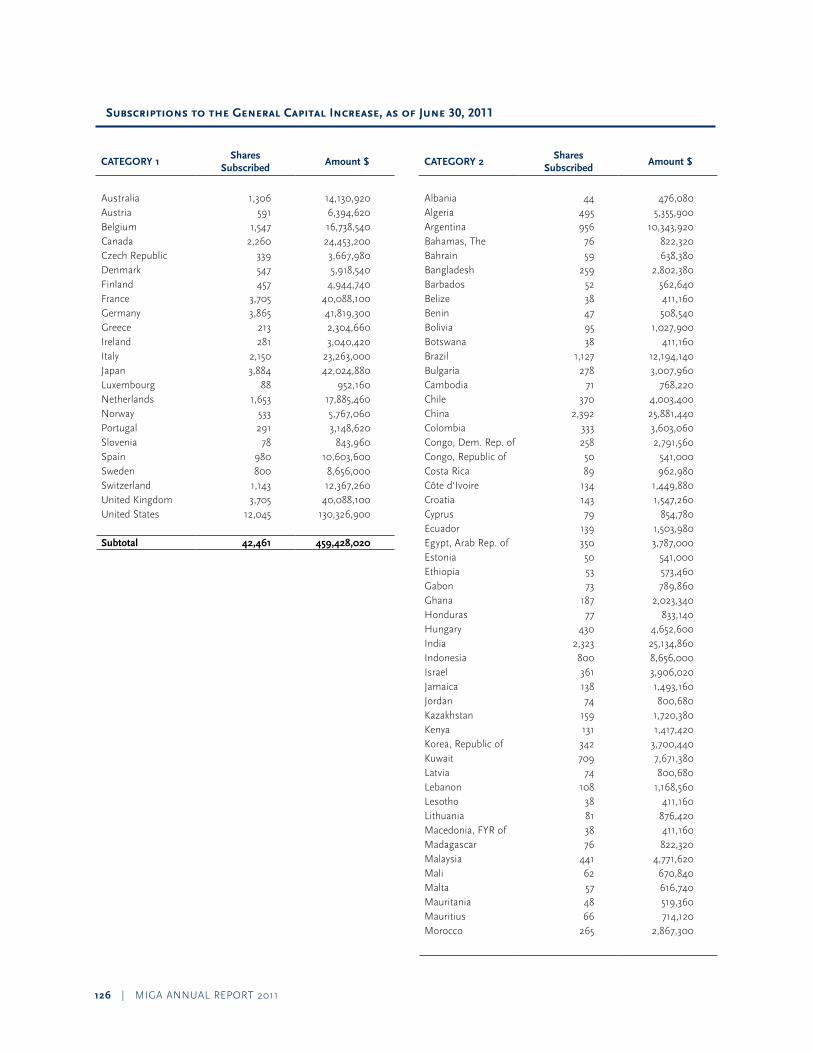
126 | MIGa annual report 2011
Subscriptions to the General Capital Increase, as of June 30, 2011
CATEGORY 1Shares
SubscribedAmount $
australia 1,306 14,130,920 austria 591 6,394,620 Belgium 1,547 16,738,540 Canada 2,260 24,453,200 Czech republic 339 3,667,980 Denmark 547 5,918,540 Finland 457 4,944,740 France 3,705 40,088,100 Germany 3,865 41,819,300 Greece 213 2,304,660 Ireland 281 3,040,420 Italy 2,150 23,263,000 Japan 3,884 42,024,880 luxembourg 88 952,160 netherlands 1,653 17,885,460 norway 533 5,767,060 portugal 291 3,148,620 Slovenia 78 843,960 Spain 980 10,603,600 Sweden 800 8,656,000 Switzerland 1,143 12,367,260 united Kingdom 3,705 40,088,100 united States 12,045 130,326,900
Subtotal 42,461 459,428,020
CATEGORY 2Shares
SubscribedAmount $
albania 44 476,080 algeria 495 5,355,900 argentina 956 10,343,920 Bahamas, the 76 822,320 Bahrain 59 638,380 Bangladesh 259 2,802,380 Barbados 52 562,640 Belize 38 411,160 Benin 47 508,540 Bolivia 95 1,027,900 Botswana 38 411,160 Brazil 1,127 12,194,140 Bulgaria 278 3,007,960 Cambodia 71 768,220 Chile 370 4,003,400 China 2,392 25,881,440 Colombia 333 3,603,060 Congo, Dem. rep. of 258 2,791,560 Congo, republic of 50 541,000 Costa rica 89 962,980 Côte d'Ivoire 134 1,449,880 Croatia 143 1,547,260 Cyprus 79 854,780 ecuador 139 1,503,980 egypt, arab rep. of 350 3,787,000 estonia 50 541,000 ethiopia 53 573,460 Gabon 73 789,860 Ghana 187 2,023,340 Honduras 77 833,140 Hungary 430 4,652,600 India 2,323 25,134,860 Indonesia 800 8,656,000 Israel 361 3,906,020 Jamaica 138 1,493,160 Jordan 74 800,680 Kazakhstan 159 1,720,380 Kenya 131 1,417,420 Korea, republic of 342 3,700,440 Kuwait 709 7,671,380 latvia 74 800,680 lebanon 108 1,168,560 lesotho 38 411,160 lithuania 81 876,420 Macedonia, FYr of 38 411,160 Madagascar 76 822,320 Malaysia 441 4,771,620 Mali 62 670,840 Malta 57 616,740 Mauritania 48 519,360 Mauritius 66 714,120 Morocco 265 2,867,300
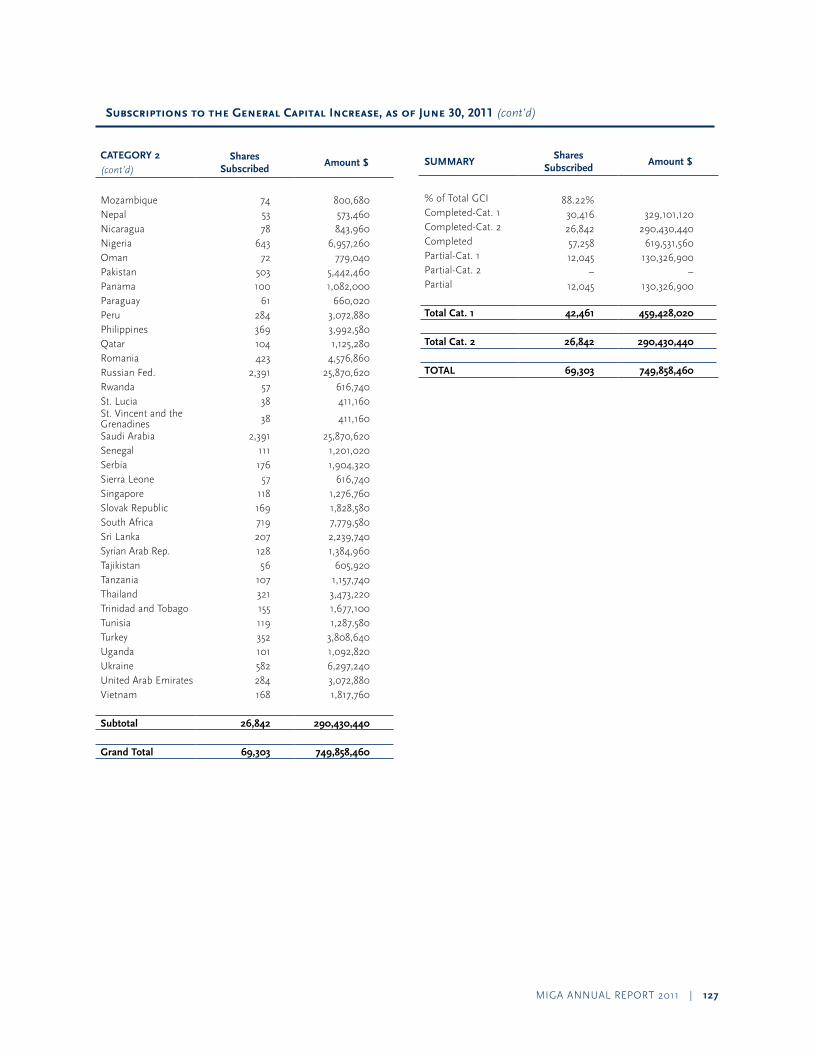
MIGa annual report 2011 | 127
Subscriptions to the General Capital Increase, as of June 30, 2011 (cont’d)
CATEGORY 2 (cont’d)
Shares Subscribed
Amount $
Mozambique 74 800,680 nepal 53 573,460 nicaragua 78 843,960 nigeria 643 6,957,260 oman 72 779,040 pakistan 503 5,442,460 panama 100 1,082,000 paraguay 61 660,020 peru 284 3,072,880 philippines 369 3,992,580 Qatar 104 1,125,280 romania 423 4,576,860 russian Fed. 2,391 25,870,620 rwanda 57 616,740 St. lucia 38 411,160 St. Vincent and the Grenadines 38 411,160
Saudi arabia 2,391 25,870,620 Senegal 111 1,201,020 Serbia 176 1,904,320 Sierra leone 57 616,740 Singapore 118 1,276,760 Slovak republic 169 1,828,580 South africa 719 7,779,580 Sri lanka 207 2,239,740 Syrian arab rep. 128 1,384,960 tajikistan 56 605,920 tanzania 107 1,157,740 thailand 321 3,473,220 trinidad and tobago 155 1,677,100 tunisia 119 1,287,580 turkey 352 3,808,640 uganda 101 1,092,820 ukraine 582 6,297,240 united arab emirates 284 3,072,880 Vietnam 168 1,817,760
Subtotal 26,842 290,430,440
Grand Total 69,303 749,858,460
SUMMARYShares
SubscribedAmount $
% of total GCI 88.22% Completed-Cat. 1 30,416 329,101,120 Completed-Cat. 2 26,842 290,430,440 Completed 57,258 619,531,560 partial-Cat. 1 12,045 130,326,900 partial-Cat. 2 – – partial 12,045 130,326,900
Total Cat. 1 42,461 459,428,020
Total Cat. 2 26,842 290,430,440
TOTAL 69,303 749,858,460
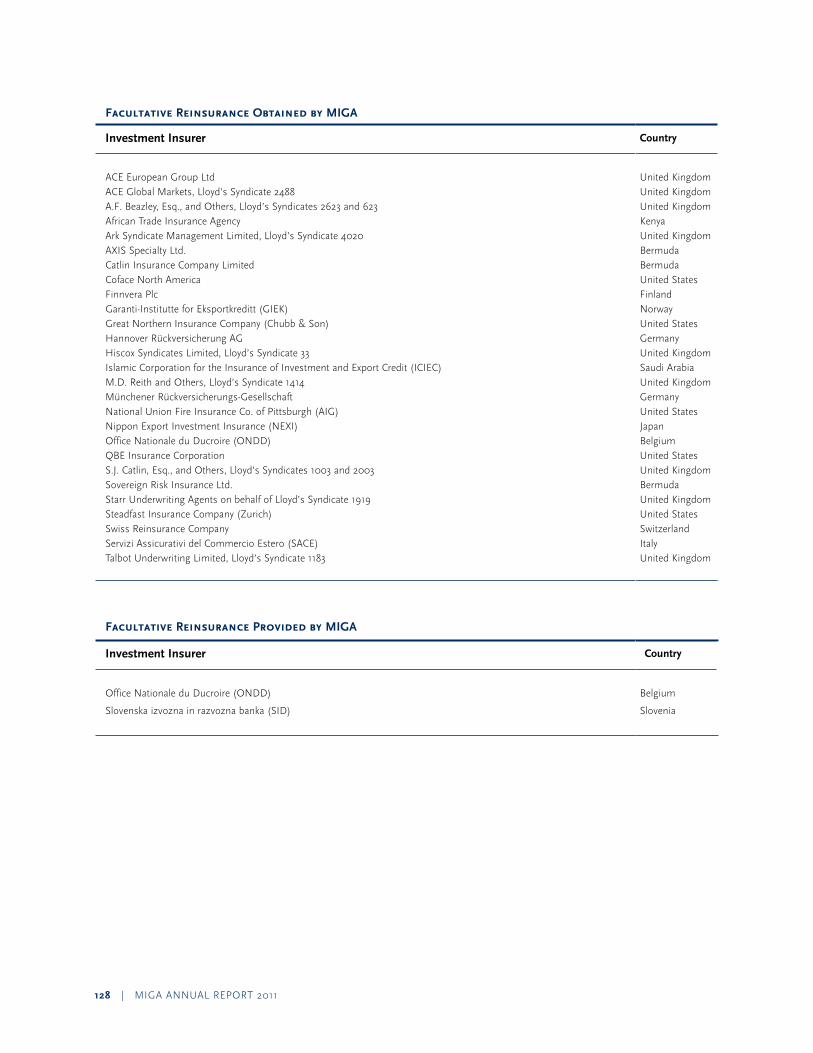
128 | MIGa annual report 2011
Facultative Reinsurance Obtained by MIGA
Investment Insurer Country
aCe european Group ltd united KingdomaCe Global Markets, lloyd’s Syndicate 2488 united Kingdoma.F. Beazley, esq., and others, lloyd’s Syndicates 2623 and 623 united Kingdomafrican trade Insurance agency Kenyaark Syndicate Management limited, lloyd’s Syndicate 4020 united KingdomaXIS Specialty ltd. BermudaCatlin Insurance Company limited BermudaCoface north america united StatesFinnvera plc FinlandGaranti-Institutte for eksportkreditt (GIeK) norwayGreat northern Insurance Company (Chubb & Son) united StatesHannover rückversicherung aG GermanyHiscox Syndicates limited, lloyd’s Syndicate 33 united KingdomIslamic Corporation for the Insurance of Investment and export Credit (ICIeC) Saudi arabiaM.D. reith and others, lloyd’s Syndicate 1414 united KingdomMünchener rückversicherungs-Gesellschaft Germanynational union Fire Insurance Co. of pittsburgh (aIG) united Statesnippon export Investment Insurance (neXI) Japanoffice nationale du Ducroire (onDD) BelgiumQBe Insurance Corporation united StatesS.J. Catlin, esq., and others, lloyd’s Syndicates 1003 and 2003 united KingdomSovereign risk Insurance ltd. BermudaStarr underwriting agents on behalf of lloyd’s Syndicate 1919 united KingdomSteadfast Insurance Company (Zurich) united StatesSwiss reinsurance Company SwitzerlandServizi assicurativi del Commercio estero (SaCe) Italytalbot underwriting limited, lloyd’s Syndicate 1183 united Kingdom
Facultative Reinsurance Provided by MIGA
Investment Insurer Country
office nationale du Ducroire (onDD) Belgium
Slovenska izvozna in razvozna banka (SID) Slovenia
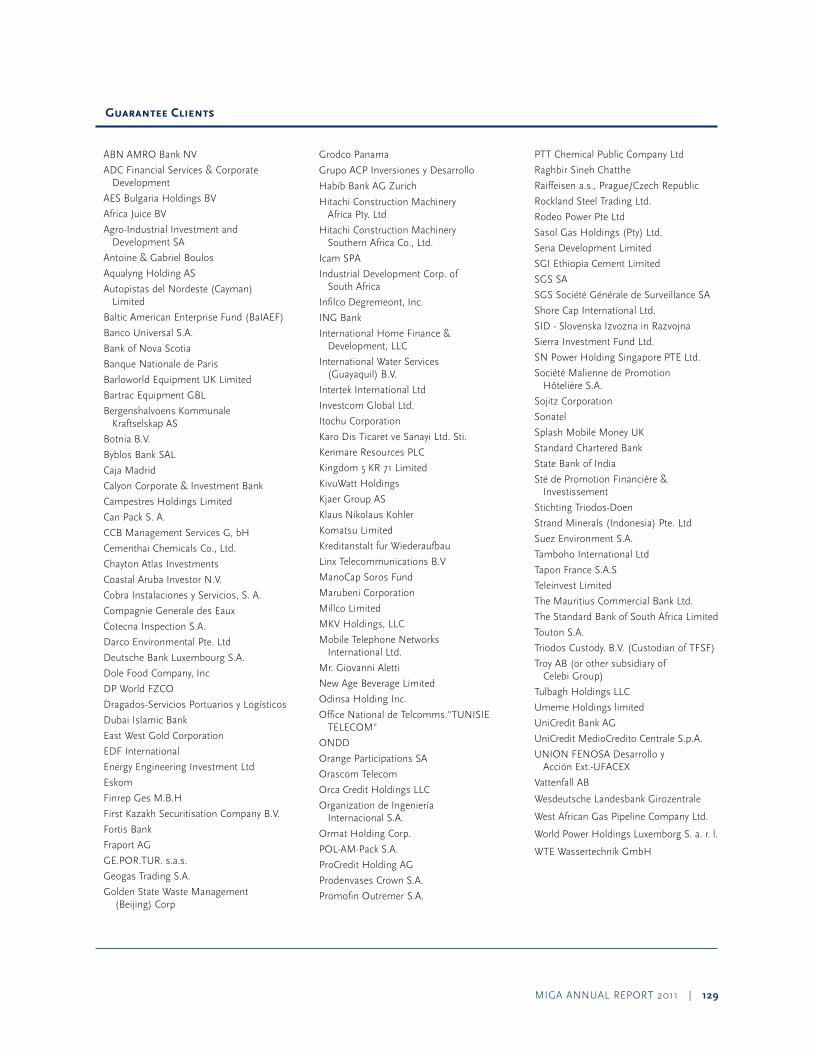
MIGa annual report 2011 | 129
Guarantee Clients
aBn aMro Bank nV
aDC Financial Services & Corporate Development
aeS Bulgaria Holdings BV
africa Juice BV
agro-Industrial Investment and Development Sa
antoine & Gabriel Boulos
aqualyng Holding aS
autopistas del nordeste (Cayman) limited
Baltic american enterprise Fund (BaIaeF)
Banco universal S.a.
Bank of nova Scotia
Banque nationale de paris
Barloworld equipment uK limited
Bartrac equipment GBl
Bergenshalvoens Kommunale Kraftselskap aS
Botnia B.V.
Byblos Bank Sal
Caja Madrid
Calyon Corporate & Investment Bank
Campestres Holdings limited
Can pack S. a.
CCB Management Services G, bH
Cementhai Chemicals Co., ltd.
Chayton atlas Investments
Coastal aruba Investor n.V.
Cobra Instalaciones y Servicios, S. a.
Compagnie Generale des eaux
Cotecna Inspection S.a.
Darco environmental pte. ltd
Deutsche Bank luxembourg S.a.
Dole Food Company, Inc
Dp World FZCo
Dragados-Servicios portuarios y logísticos
Dubai Islamic Bank
east West Gold Corporation
eDF International
energy engineering Investment ltd
eskom
Finrep Ges M.B.H
First Kazakh Securitisation Company B.V.
Fortis Bank
Fraport aG
Ge.por.tur. s.a.s.
Geogas trading S.a.
Golden State Waste Management (Beijing) Corp
Grodco panama
Grupo aCp Inversiones y Desarrollo
Habib Bank aG Zurich
Hitachi Construction Machinery africa pty. ltd
Hitachi Construction Machinery Southern africa Co., ltd.
Icam Spa
Industrial Development Corp. of South africa
Infilco Degremeont, Inc.
InG Bank
International Home Finance & Development, llC
International Water Services (Guayaquil) B.V.
Intertek International ltd
Investcom Global ltd.
Itochu Corporation
Karo Dis ticaret ve Sanayi ltd. Sti.
Kenmare resources plC
Kingdom 5 Kr 71 limited
KivuWatt Holdings
Kjaer Group aS
Klaus nikolaus Kohler
Komatsu limited
Kreditanstalt fur Wiederaufbau
linx telecommunications B.V
ManoCap Soros Fund
Marubeni Corporation
Millco limited
MKV Holdings, llC
Mobile telephone networks International ltd.
Mr. Giovanni aletti
new age Beverage limited
odinsa Holding Inc.
office national de telcomms."tunISIe teleCoM"
onDD
orange participations Sa
orascom telecom
orca Credit Holdings llC
organization de Ingeniería Internacional S.a.
ormat Holding Corp.
pol-aM-pack S.a.
proCredit Holding aG
prodenvases Crown S.a.
promofin outremer S.a.
ptt Chemical public Company ltd
raghbir Sineh Chatthe
raiffeisen a.s., prague/Czech republic
rockland Steel trading ltd.
rodeo power pte ltd
Sasol Gas Holdings (pty) ltd.
Sena Development limited
SGI ethiopia Cement limited
SGS Sa
SGS Société Générale de Surveillance Sa
Shore Cap International ltd.
SID - Slovenska Izvozna in razvojna
Sierra Investment Fund ltd.
Sn power Holding Singapore pte ltd.
Société Malienne de promotion Hôtelière S.a.
Sojitz Corporation
Sonatel
Splash Mobile Money uK
Standard Chartered Bank
State Bank of India
Sté de promotion Financière & Investissement
Stichting triodos-Doen
Strand Minerals (Indonesia) pte. ltd
Suez environment S.a.
tamboho International ltd
tapon France S.a.S
teleinvest limited
the Mauritius Commercial Bank ltd.
the Standard Bank of South africa limited
touton S.a.
triodos Custody. B.V. (Custodian of tFSF)
troy aB (or other subsidiary of Celebi Group)
tulbagh Holdings llC
umeme Holdings limited
uniCredit Bank aG
uniCredit MedioCredito Centrale S.p.a.
unIon FenoSa Desarrollo y acción ext.-uFaCeX
Vattenfall aB
Wesdeutsche landesbank Girozentrale
West african Gas pipeline Company ltd.
World power Holdings luxemborg S. a. r. l.
Wte Wassertechnik GmbH
130 | MIGa annual report 2011
Photo Credits
Cover Scott Wallace, World Bank Group; WestlB aG; Vattenfall aB
page 4 Mark elton, MIGa
page 6 Suzanne pelland, MIGa
page 8, 9 Mohamed abdmouleh; Wu Zhiyi, World Bank Group
page 10 ryan rayburn, World Bank Group
page 13 ryan rayburn, World Bank Group; Suzanne pelland, MIGa
page 15 Frank Vincent, World Bank Group
page 16, 17 upM Fray Bentos, uruguay; africaJuICe; Mark elton, MIGa
page 19 africaJuICe; rebecca post, MIGa
page 23 upM Fray Bentos, uruguay; Michael Foley, World Bank Group
page 24, 25 proCredit Holding©; Karo Dis ticaret ve Sanayi ltd. Sti.; alan narayadu, MIGa
page 27 WestlB aG; Suzanne pelland, MIGa; proCredit Holding©
page 36 Curt Carnemark, World Bank Group
page 40 World Bank Group
page 46 upM Fray Bentos, uruguay
page 49 Dana Smillie, World Bank Group
page 51 Mark elton, MIGa
page 60 Mark Green, Financial times
page 61 miga.org
page 62 Vattenfall aB
page 66 Mark elton, MIGa
page 68 Simone D. McCourtie, World Bank Group
page 70, 71 natalia Cieslik, World Bank Group; upM Fray Bentos, uruguay; proCredit Holding©
page 116, 117 Mark elton, MIGa; Mark elton, MIGa; Mohamed abdmouleh
ISBn 978-0-8213-8914
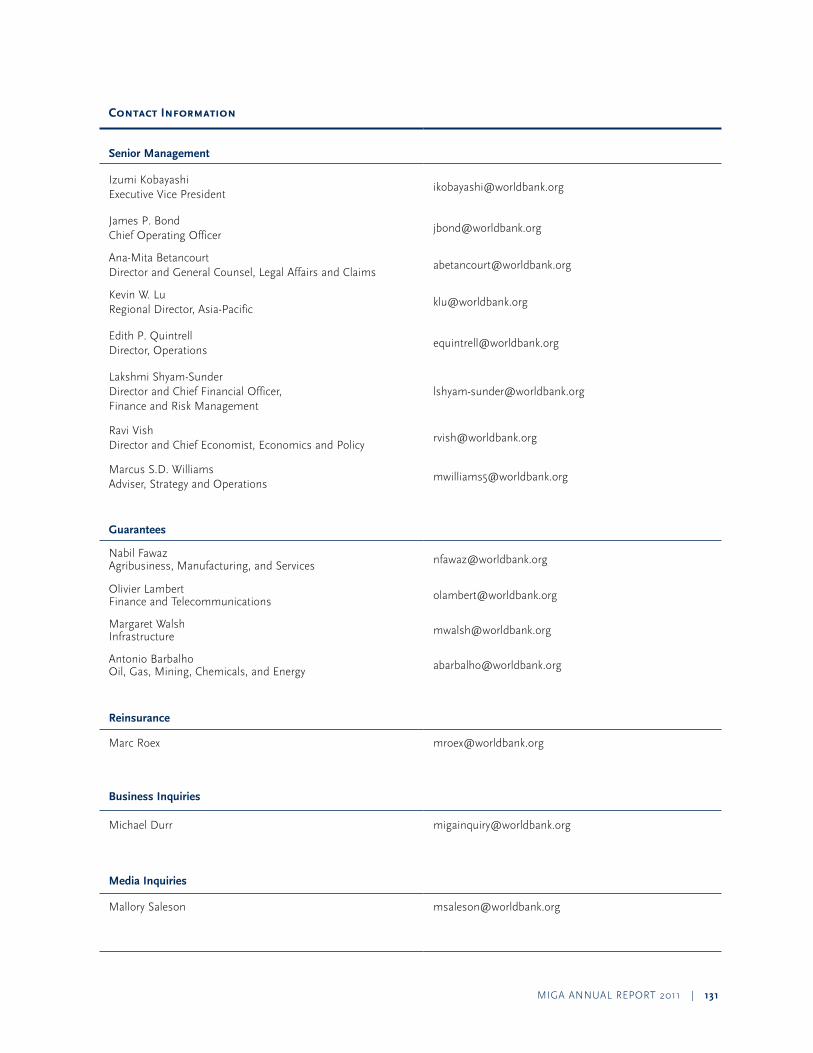
MIGa annual report 2011 | 131
Contact Information
Senior Management
Izumi Kobayashi executive Vice president
James p. Bond Chief operating officer
ana-Mita Betancourt Director and General Counsel, legal affairs and Claims
Kevin W. lu regional Director, asia-pacific
edith p. Quintrell Director, operations
lakshmi Shyam-Sunder Director and Chief Financial officer, Finance and risk Management
ravi Vish Director and Chief economist, economics and policy
Marcus S.D. Williams adviser, Strategy and operations
Guarantees
nabil Fawaz agribusiness, Manufacturing, and Services [email protected]
olivier lambert Finance and telecommunications [email protected]
Margaret Walsh Infrastructure [email protected]
antonio Barbalho oil, Gas, Mining, Chemicals, and energy [email protected]
Reinsurance
Marc roex [email protected]
Business Inquiries
Michael Durr [email protected]
Media Inquiries
Mallory Saleson [email protected]

132 | MIGa annual report 2011
InSurInG InVeStMentS r enSurInG opportunItIeS

Multilateral Investment Guarantee Agency World Bank Group1818 H Street, nW
Washington, DC 20433 uSa
t. 202.458.2538f. 202.522.0316
ISBn 978-0-8213-8914
w w w. m I g a . o r g