11a.2 the global monitoring of meteor-tropic effects
TRANSCRIPT

1
11A.2 THE GLOBAL MONITORING OF METEOR-TROPIC EFFECTS: RESULTS FOR THE REGION OF NORTH AMERICA AND THE CARIBBEAN
Luis B. Lecha Estela *, Orlando Luján Fernández and Ibis L. Trujillo Nodarse
Center for Environmental Researches and Services, Villa Clara, Cuba
1. INTRODUCTION
At the end of the XX century Lecha and Delgado (1996) developed a biometeorological forecasts model, programmed to calculate the 24-
hours (inter-daily) differences of the partial oxygen density of the air (PODA index). The index is calculated according to Ovcharova´s formula
(1981), applying adequate terms of the Clapeyron´s equation and given by the expression:
(1)
Where:
T: is the absolute air temperature (°K) e: is the vapor pressure in hPa P: is the atmospheric pressure reduced to the
mean sea level in hPa. The initial validation of the model was oriented
to demonstrate if a relationship between the PODA index behavior and the daily number of attentions due to some chronic illnesses in the medical
emergency services of three Cuban cities (Havana, Santa Clara and Sagua la Grande) will exist. Based upon the satisfactory results and a
good operational performance, the biometeorological forecast service for Cuba began experimentally in May of 2007, giving appropriate
information to the health system before the occurrence of significant meteor-tropic effects among the local population.
The effectiveness has shown different
success levels according to the illness: for the
increases of bronchial asthma crises (94%), in the hypertensive crises (88%), with the brain-vascular illnesses (85%), the migraines (82%) and they
were acceptable in the case of the cardiovascular diseases (75%). So, the worst result had 3 successes every 4 emitted forecasts. Later on,
applications were made for Brazil (2010), Spain (2011) and Mexico (2012-2013), being obtained satisfactory results in all these countries.
* Corresponding author address: Luis B. Lecha Estela, Centro de Estudios y Servicios Ambientales (CESAM), Carretera Central 716 entre Colón y Cabo Brito, Santa Clara C.P. 50200, Villa Clara, Cuba; email: [email protected], [email protected]
The official service to the health institutions of Villa Clara province began in February of 2012,
and the public model outputs for North America and the Caribbean are available on-line at http://www.cmp.vcl.cu/producto/show/codproducto/
000033. The emission of biometeorological forecasts
to the Cuban health institutions have had good acceptance by the medical community and the practical application of the service allows to the
medical counterpart the design and implementation of new procedures for the surveillance and treatment of the meteor-
pathological reactions that occurs in the population, associated to abrupt weather changes or to the presence of other adverse environmental
conditions. The procedures of surveillance and treatment of the arterial hypertension and the bronchial asthma attentions at Emergencies are
already working, and are under development new procedures for the attentions of medical urgencies due to brain-vascular and cardiovascular diseases.
The regional monitoring of meteor-tropic
effects using the normalized scale of the PODA
index like the main reference biometeorological indicator was also extended to South America, Europe and oriental Asia since the year 2008, as
well as personalized applications were programmed for isolated countries such as Australia, New Zealand, Spain and Mexico,
besides Cuba that also has a high resolution version of the “PronBiomet” model.
The regional distribution of meteor-tropic effects is expressed in synoptic-statistical terms by the mean number of days with contrasting and
very contrasting weather changes (Table 1), calculated for regular boxes of 5 x 5 degrees of latitude and longitude, containing each 100 nodes
of data from the GFS database (http://nomads.ncep.noaa.gov/cgi-bin/filter_gfs_hd.pl) with a space resolution of 0.5
degree. The original workspace for North America and the Caribbean extends from 10°N up to 80°N and from 50°W up to 140°W, with a total of 25,200
nodes with information of the variables needed to calculate the partial oxygen density of the air and its differences in 24 hours for each node of the
region and every day during the period from January of 2008 until the present date.

2
Table 1. Thresholds for weather contrast.
The results of the monitoring made for this
geographical region indicate that it was happened
a very remarkable increase of the biometeorological inter-daily contrasts during the last two years in a wide geographical area that
extends from Alberta in Canada to the southern states of the U.S. A clear regional difference exists in the spatial patterns of occurrence of inter-daily
weather contrasts, corresponding to the increase of the PODA index (hyperoxia sensations) most of the extreme contrasts in the northern part of the
area of more frequent contrasts; while in the southern portions of the area of maxima contrasts the decrease of the PODA index prevails (hypoxia
sensations) such as the cause of occurrence of the more outstanding meteor-tropic effects.
According with their genesis, the hyperoxia sensations are related with the influence of the polar air masses and the hypoxia sensations are in
correspondence with the frequent formation of extratropicales cyclones, that coming from the Gulf of Mexico or near areas move through the
southern and eastern states of the U.S. The maximum nuclei of inter-daily weather
contrasts are located and they displace, according to the season of the year, following the behavior of the main synoptic patterns, reaching in the quarter
December-February their maximum decline to the south and in the summer (quarter June-August) their maximum northern decline. However, the
behavior and influence of the subtropical anticyclones and the presence of hurricanes and tropical waves in the tropical zone of the region
and along the Pacific oceanic coast, including most of the west coast of Mexico, determines the highest or smaller occurrence of inter-daily
weather contrasts able to produce significant meteor-tropics effects.
The increment of meteor-tropic impacts associated to intense winter storms on the U.S.
and Canada during the winters 2012-2013 and 2013-2014 coincide with the remarkable increase of winter cyclones affecting Europe, especially
Spain, France and UK. Also the presence of a "polar vortex" was observed in the half troposphere in the middle of the United States. It
favored the occurrence of significant biometeorological contrasts in the region. Such evidences may be early signals of a new global
very meteor-tropic pattern of the general circulation of the atmosphere, that would be consequence of the increasing unbalance of mass
and energy through latitudes, derived from an increase, already physically perceptible, of the temperature of the whole climate system.
2. SOME SIGNIFICANT CASES
The inter-daily change of the PODA index at a regional or local scale can be observed with an adequate slide-show sequence. The following part
of this Extended Abstract will present some Case Studies showing the close relationship that may be observed between intense weather changes
(represented by the PODA index) and the occurrence of health crisis in a given population.
The most difficult task is the obtaining of the daily dataset from the medical counterpart, in order to be compared with the inter-daily behavior of the
biometeorological complex. Such dataset into the region is available only for Cuba and include daily information on medical attentions at Emergencies
(cities of Havana, Santa Clara and Sagua la Grande) and the daily total mortality of the 13 Villa Clara´s municipalities. It would be very desirable
and well received any cooperation, in order to prepare a daily database on meteor-pathological responses for several representative samples in
the United States and Canada.
2.1 The January “Polar Vortex” in 2013-2014
January 2014 was the globe's 4th warmest
January since records began in 1880, according to
NOAA's National Climatic Data Center (NCDC) and NASA (Fig. 1). January 2013 global land temperatures were the 4th warmest on
record, and global ocean temperatures were the 7th warmest on record. In the Southern Hemisphere, land temperatures were the warmest
on record. Global satellite-measured temperatures in January 2013 for the lowest 8 km of the atmosphere were 9th or 6th warmest in the 36-
year record, according to Remote Sensing Systems and the University of Alabama Huntsville

3
(UAH), respectively. Northern Hemisphere January snow cover was the 10th lowest in the 48-year
record. Also in January 2013 North American had five
days of bitter cold to Canada and the Midwest and Northeast U.S. In the U.S., below-zero temperatures were recorded in just six states east
of the Rockies. The coldest spot was Saranac Lake in New York's Adirondack Mountains, which bottomed out at -28°C. In nearby Malone, NY,
flooding is occurring, thanks to an ice jam on the Salmon River caused by this week's cold weather. The weather was a bit warmer on Mt. Washington,
New Hampshire, where the temperature of -27°C combined with a wind of 81 mph to create a wind chill of -52°C. The most dangerous winter weather
conditions were related with frequent and intense winter cyclones, such as the storm “Kahn”.
Figure 1. Departure of temperature from average for January 2014. Image credit: National Climatic Data Center (NCDC)
According to Masters (The future of intense winter storms, 2010), he discuss how evidence for an observed increase in intense wintertime
cyclones in the North Atlantic is uncertain. In particular, intense Nor'easters affecting the Northeast U.S. showed no increase in number
over the latter part of the 20th century. However, the U.S. Global Change Research Program (USGCRP) concluded this in their 2009 U.S.
Climate Impacts Report: "Cold-season storm tracks are shifting northward and the strongest storms are likely to become stronger and more
frequent". The USGRP concluded that an increase of between four and twelve intense wintertime extratropical storms per year could be expected
over the Northern Hemisphere by 2100, depending upon the amount of greenhouse gases put into the air (Fig. 2).
The frequent and severe behavior of winter extratropical storms during the last two years in the
region, together with the alternative influence of intense cold continental air masses is giving an important signal on the necessity to consider these
types of weather processes such as very dangerous conditions for human health, able to produce intense and extended meteor-tropic
effects in a broad region, from Central Canada to the Caribbean basin.
Figure 2. Projected change in intense winter time extratropical storms with central pressures < 970 hPa for the Northern Hemisphere under various emission scenarios. Source: U.S. Climate Impacts Report, 2009
2.2 The Cuban cold wave of January 2010
The weather conditions during December
2009 on the North American continent were
characterized by the development of an early and intense winter, with frequent intense winter storms and cold temperatures. The biometeorological map
for Saturday December 26 of 2009 at 00 GMT shows one of these intense extratropical cyclones, accompanied by severe weather conditions,
dominating the weather conditions of the whole central region of the United States (Fig. 3).
This increase in the frequency and severity of the winter cyclones on the continent was coincident with the development of “El Niño” event
of 2009, which reached full maturity in December, with positive anomalies of the sea surface temperature in the East Pacific between 1 and 3
Celsius degrees (INSMET, 2009). The excess of heat and energy in tropical latitudes over the East Pacific waters increases the occurrence of intense
subtropical Jet Stream currents over Mexico, the western tip of Cuba and the southeast of the United States. It temporary blocked the advance to

4
the south of the intense winter systems that already dominated the weather conditions in most
of the continent.
Figure 3. Biometeorological map of the region for December 26 of 2009 at 00 GMT
However, as soon as diminished the intensity of subtropical jets, the atmospheric conditions changed very fast during the beginning of January
2010, and the intense cold air mass over the continent moved to the south, producing the more intense meteor-tropic impact due to cold stress
observed in Cuba since 1981. The biometeorological maps in Fig. 4 illustrate the intense process of cold air transport that happens
from polar latitudes directly to Cuba in two successive dates: on January 3 and 10 of 2010 at 00 GMT.
January 3 January 10 Figure 4. Biometeorological maps of the region for January 3 and 10 of 2010 at 00 GMT.
The more detailed biometeorological maps of Fig. 5 show the spatial distribution and intensity of two successive strong hyperoxia conditions
affecting Cuba and their adjacent geographical area on January 3 and 11, 2010, respectively.
Figure 5. Biometeorological maps for January 3 and 11, 2010, at 00 GMT
The alternative influence of strong hypoxia
and hyperoxia conditions all over the country during the first half of January 2010 express very well the magnitude of the inter-daily weather
contrasts occurred during this period, after long time with steady warm and fair weather inside the tropical air mass. So, the genesis of short term
meteor-tropic effects are related with the specific impact of abrupt weather changes; but also long term meteor-tropic effects may be identified related
with the continuous influence of health-stressing weather condition, such as maintained intense cold or heat stress.
January 9 January 10
January 11 January 12
January 13 January 14
Figure 6. Daily anomalies of PODA on southeast U.S. and Cuba between January 9 and 14 of 2010.
The maps of daily anomalies of PODA in Fig.
6 show the accumulative cold stress affecting the
Cuban population during the period between January 9 and 14 of 2010. This kind of picture is not usual in operational biometeorological

5
forecasts, but it will be included soon as part of the outputs of the Cuban PronBiomet model, in order
to detect the occurrence of sustained long-term meteor-tropic effects.
From the medical side, the composite Fig. 7 presents the daily affluence of patients assisted in all the Emergency Services of Sagua la Grande,
affected by meteor-pathological responses: acute respiratory infections (IRA), bronchial asthma crisis (CAAB), headaches and migraines (CEFA),
hypertensive crisis (HTA) and cardiovascular diseases. Similar results were observed in the municipality of Playa located in Havana city,
considered to assure the synchronic time occurrence of meteor-tropic effects and in order to avoid the possible influences of local
environmental factors.
Figure 7. Number of attentions in Emergencies during the first half of January 2010 in Sagua la Grande.
The meteor-tropic impact was too strong and it had quantitative expression also on the daily general mortality rate of the 13 municipalities of Villa Clara province. As it`s shown in Fig. 8, the
daily total mortality increases in this period with heavy cold stress, producing 32 deaths in excess only in four days (January 10, 13, 14 and 17).
Figure 8. Daily total mortality in Villa Clara province during January 2010.
Associated to the intense and sustained cold
stress, plus internal administrative deficiencies, the death by hypothermia of more than 20 patients was reported at the main psychiatric hospital of
Havana between January 10 and 11 of 2010. Considering only the deaths in excess calculated for Villa Clara (deaths above the January´s
monthly mean plus the standard deviation). It means more than 200 % of all deaths occurred in the country related with hurricane impacts since
1990 up to the present. So, the prevention of meteor-tropic effects must be considered by the Civil Defense authorities with the same priority that
they give to hurricane preparedness, floods or other dangerous meteorological phenomena.
2.3 Hurricane “Sandy” in October 2012. Hurricane “Sandy” produced big social and
economic impacts on a broad area, from the Caribbean to Canada, especially along the northeast coast of the United States. Several
deaths were reported in Haiti, Cuba, the Bahamas and the United States. But, generally, the impact of major hurricanes or other weather-related
disasters are not considered such as meteor-tropic effects. However, “Sandy” had the characteristic that it produced, additionally, significant meteor-
tropic effects far away from the direct influence area of the storm.
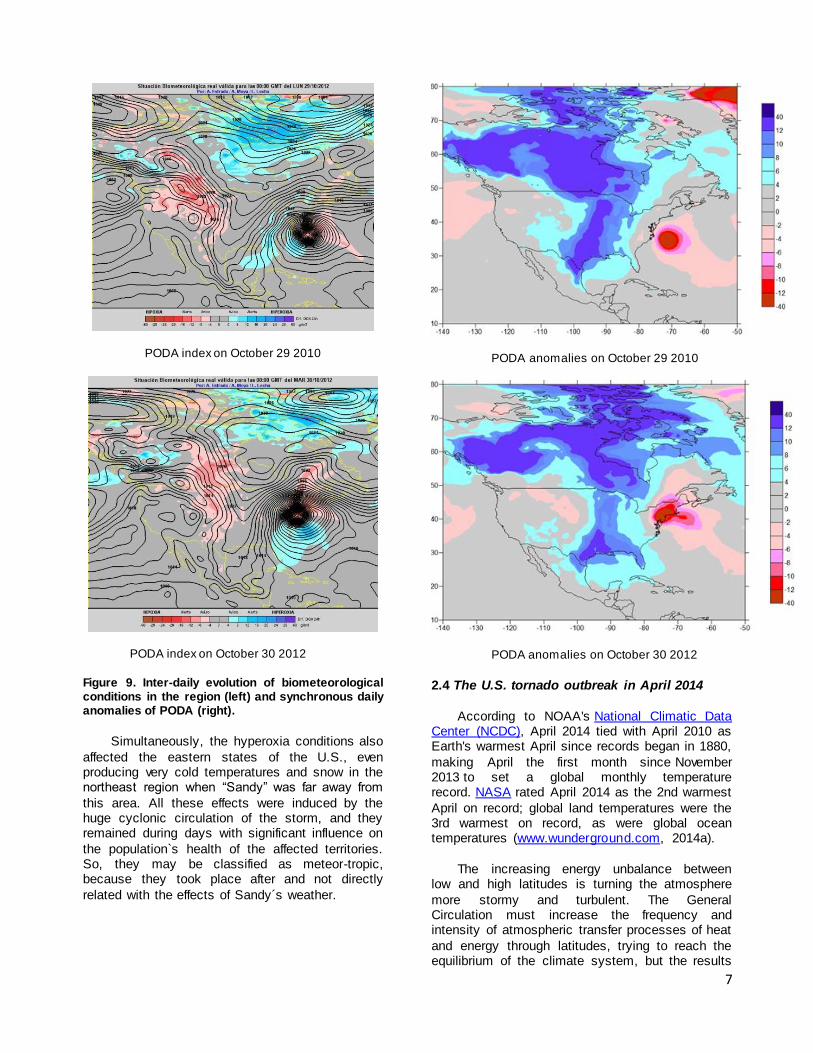
The combination of Fig. 9 express the day-by-day evolution of biometeorological conditions in the region (left column), together with the
synchronous daily anomalies of PODA over the same territory (right column). The sequence covers the period among October 26 to 30, 2012.
“Sandy” transformed so fast in a very strong
extratropical cyclone. Also, a well-defined area of
positive anomalies (hyperoxia conditions) of PODA was gradually formed on the continent. This area moved fast to the south and affected the Florida
and Cuba some days after the strike of the storm on these territories. This situation produced complex weather conditions far away from the
location of the hurricane and multiple meteor-tropic effects.
0
20
40
60
1 2 3 4 5 6 7 8 9 10 11 12 13 14 15
IRA CAAB
0
10
20
30
1 2 3 4 5 6 7 8 9 10 11 12 13 14 15
CEFA
0
2
4
6
1 2 3 4 5 6 7 8 9 10 11 12 13 14 15
ECV

6
PODA index on October 26 2010
PODA index on October 27 2010
PODA index on October 28 2010
PODA anomalies on October 26 2010
PODA anomalies on October 27 2010
PODA anomalies on October 28 2010
7
PODA index on October 29 2010
PODA index on October 30 2012
Figure 9. Inter-daily evolution of biometeorological conditions in the region (left) and synchronous daily anomalies of PODA (right).
Simultaneously, the hyperoxia conditions also
affected the eastern states of the U.S., even producing very cold temperatures and snow in the northeast region when “Sandy” was far away from
this area. All these effects were induced by the huge cyclonic circulation of the storm, and they remained during days with significant influence on
the population`s health of the affected territories. So, they may be classified as meteor-tropic, because they took place after and not directly
related with the effects of Sandy´s weather.
PODA anomalies on October 29 2010
PODA anomalies on October 30 2012
2.4 The U.S. tornado outbreak in April 2014
According to NOAA's National Climatic Data Center (NCDC), April 2014 tied with April 2010 as Earth's warmest April since records began in 1880,
making April the first month since November 2013 to set a global monthly temperature record. NASA rated April 2014 as the 2nd warmest
April on record; global land temperatures were the 3rd warmest on record, as were global ocean temperatures (www.wunderground.com, 2014a).
The increasing energy unbalance between
low and high latitudes is turning the atmosphere
more stormy and turbulent. The General Circulation must increase the frequency and intensity of atmospheric transfer processes of heat
and energy through latitudes, trying to reach the equilibrium of the climate system, but the results

8
are more stormy weather, more severe weather, more frequent and intense extratropical cyclones
and hurricanes, while the global warming will continue.
Of course, under this framework, the number of weather-related disasters is increasing, as well as the number of abrupt weather changes able to
produce intense and massive meteor-tropic effects. One of these examples was the tornado outbreak of April 27 to 30, 2014. The death toll
from nature’s 4-day rampage of deadly tornadoes, extreme flooding, and damaging severe thunderstorms has killed at least 39 people, and
will end up costing more than $1 billion USD. Additionally, a preliminary list with more than 100 tornadoes was reported during these four days in
14 states (www.wunderground.com, 2014b).
Figure 10. The PODA index and PODA anomalies during the days of tornado outbreak in central U.S.
The combined sequences of the PODA index and the PODA anomalies during the period of Tornado outbreak present a very interesting
picture on the biometeorological contrast that
characterize this kind of severe weather impact on human health (Fig. 10).
Due to the formation in middle latitudes of
intense and extended extratropical cyclones,
together with the typical spring increase influence of the North Atlantic subtropical anticyclone, over the U.S. territory deeply converge and penetrate
the tropical hot and humid air mass, moving north ward along the east side of the cyclone circulation. This section of the cyclone is characterized by
intense hypoxia conditions (red areas). The cold air moves from the north across the
west side of the cyclone, producing moderate to severe hyperoxia conditions (blue areas). Then, in the frontal zone the weather contrast is very
intense, being optimal the conditions for severe weather outbreaks. This classical picture is becoming more and more frequent, while the
latitudinal unbalance of heat and energy keeps high, especially at the end of the winter season and in spring time. A clear increasing tendency of
tornado occurrence is observed (Fig. 11).
Figure 11 January-December number of tornadoes
Therefore, it is consistent also with the
increase thunderstorm loss trends and the amount of damages due to these events (Fig. 12).
Figure 12. U.S. thunderstorm loss trends (1980-2012)

9
3. CLIMATOLOGICAL PATTERN OF PODA
The monthly mean behavior of the partial oxygen density in the air (PODA) was calculated for the period 2008-2013. This parameter gives an
operational and complex view from the atmosphere, not only considering the classical synoptic approach, but also including the thermal
and humidity behavior of the lower troposphere. That`s a thermodynamic vision of the atmospheric processes, very useful for general
biometeorological studies and human health applications.
During winter time (January) the mean values of PODA are higher than 275 g/m
3 over all the U.S.
and Canadian territories. High values of PODA are
observed too along the Mexican territory, cutting the steady distribution of this element into the tropical region (Fig. 13).
In spring time the influence of the tropical air
mass becomes more important in the southern
U.S. The threshold of 275 g/m3 reaches all the
southern states of the country, with a minimum below 270 g/m
3 located in the west portion of the
Gulf of Mexico. It`s close related with the frequent formation of extratropical cyclones in this area. During the studied period, the number of spring
extratropical cyclones formed in this region has increased, especially during the spring seasons of 2013 and 2014. This weather situation is one of
the most significant meteor-tropic patterns that influence on the Cuban population (the Lent´s strong southerly winds).
The same spring extratropical cyclones
formed in the northwest of the Gulf of Mexico
moved east-northeast ward over the southern or central states of the Union, usually generating outbreaks of severe weather. So, this is also a
seasonal and significant meteor-tropic pattern for the U.S. population in these regions.
In summer the tropical air mass reaches its maximum penetration into the continent. The threshold of 275 g/m
3 is now located in the
southern and western parts of Canada, but during the studied period a major penetration of the warm and humid tropical air has been observed. It may
explain the frequency increase of summer heat waves in several central and eastern big cities of the United States and Canada along the recent
years. Finally, during the autumn season the circulation patterns move backward, giving pass to the predominant influence of extratropical
processes on the whole region, ending the seasonal cycle.
January February
March April
May June
July August
September October
November December
Figure 13. Monthly mean regional distribution of PODA during the period 2008-2013
As it should be expected, the PODA values
decrease with latitude, but it is possible to identify annual anomalies and peculiarities of this complex element in certain years and regions. Also the
analysis of tendencies gives interesting results.
A very important tool to study the genesis of
meteor-tropic effects is the calculation of the

10
PODA anomalies. The Fig. 14 shows the annual anomalies of PODA in the region. It can be
observed a year-by-year variation of the index, representing the annual predominant biometeorological condition. This analysis may be
done by months, related to the annual mean value or even with the daily data, related to the monthly mean values of PODA.
2008 2009
2010 2011
2012 2013
Figure 14. Sequence of annual anomalies of PODA during the period 2008-2013
The sequence of map anomalies per year shows important negative anomalies of PODA in the major part of Canada during the year 2010, in
the central U.S. during 2012 and in the northern portion of Canada in 2013. On the other side, significant positive anomalies were observed in
western Canada during the year 2008 and in the central part of the United States in 2013.
The monthly mean behavior of PODA has a remarkable seasonal variation. That is very important, because it explains the seasonal
occurrence of meteor-tropic effects in the region and permits the analysis of seasonal picks by diseases. The seasonal increase of meteor-tropic
effects is known, but it is very important to forecast in advance the date when it will begin.
A general relationship between the annual predominant hyperoxia conditions and the annual increase of respiratory and cardiovascular
diseases (including hypertensive crisis) has been
established in Cuban researches, while another significant relationship has been established
between annual predominant hypoxia conditions and the annual increase of brain-vascular diseases, strokes and migraines.
The increasing deep penetration of the warm
and humid tropical air mass into the continental
area during the summer time, while during the winter season the inverse penetration of cold & continental air masses have been less frequent
into the tropical latitudes are consistent with the global warming process, but has some significant biometeorological consequences:
a) The duration of the winter seasons in tropical areas becomes shorter and intermittent. The local population doesn´t properly adapt to
winter conditions, and each cold front arrival or the influence of other extratropical winter weather produce significant meteor-tropic
effects. b) The duration of the summer season increases
in middle and high latitudes. The warm and
humid tropical air mass penetrates to areas where the population isn´t adapted to heat stress. So, the occurrence of heat waves
increases as well as the occurrence of massive meteor-tropic effects due to heat stress.
c) During the transition seasons (spring and
autumn) the energy unbalance between low and high latitudes is increasing. The dynamic of atmospheric circulation responds to this with
more frequent and intense winter storms and tropical cyclones. It implies more weather-related disasters and more frequent severe
weather episodes.
Also, the annual anomalies of PODA are
closely related with the prevailing circulation patterns in the region, giving an objective picture on the potential relationships that would be
expected with other global processes, i.e. “El Niño” event. So, the PODA parameter behavior is very useful to understand the genesis of meteor-tropic
effects. As it`s shown in the combination of Fig. 15,
the monthly anomalies of PODA in latitudes above 55 degrees North were significant in January 2008 (positives) and 2009 (negatives), as well as in July
were significant in the year 2009 (positives) and 2012 (negatives), but with lower absolute values, practically the half, of the January`s behavior.
Therefore, the year 2009 appears such as the most seasonal contrasting, being predominant hypoxia conditions in winter and hyperoxia
conditions in summer.

11
Figure 15. Anomalies of PODA in January (left) and July (right) by rings of 5 degrees North latitude
In January, the latitude circles between 35 to
55 degrees north present a remarkable fluctuation
of the anomalies behavior, with three maxima (hyperoxia conditions) in the years 2009, 2011, 2013, and two minima (hypoxia conditions) in the
years 2010 and 2012. In July month (summer season) the anomalies are synchronic with the characteristics of higher latitudes already
described. So, the summer behavior of PODA anomalies results steady and synchronic in the continental region above 35 degrees North
latitude.
The anomalies of PODA calculated for the circles of latitude among 25 to 35 degrees north express a transition pattern between the upper and
lower latitude circles. In January, the anomalies of the circle among 30 to 35 degrees north present predominant hypoxia conditions in the year 2012,
increasing to light hyperoxia conditions in 2013. However, the anomalies of PODA in the circle among 25 to 30 degrees north are lower than ± 0.5
g/m3 all the years, being not significant. Finally, the winter anomalies of PODA in the
tropical latitudes show the prevalence of light hyperoxia conditions in the years 2008 and 2011-2012, while in the years 2010 and 2013 light
hypoxia conditions were predominant. During the summer season in the tropics, the PODA anomalies were not significant, lower than ± 0.5
g/m3 all the years, except 2009.
These characteristics of the regional bioclimatic behavior of the PODA parameter
should be considered such as the reference framework to understand the biggest or smaller occurrence of meteor-tropic effects associated to
abrupt weather changes in a given region. Also, there is a close relationship between the occurrence of massive and intense meteor-tropic
effects in a given place or region and the occurrence of monthly anomalies of the PODA parameter, generally related with infrequent or
abnormal characteristics of the regional synoptic processes or the main circulation patterns.
4. PREVENTION - MITIGATION - ADAPTATION TO METEOR-TROPIC EFFECTS
The prevention of meteor-tropic effects can be made through adequate biometeorological forecast services within the short-range time scale of
weather processes. Based upon effective and operational Early Health Alerts, the medical counterpart may develop new therapeutic (for
Emergencies) or preventive procedures (for known individuals already identified and with treatment) to mitigate meteor-tropic effects in the most sensitive
groups of population (children, pregnant women, ancients, sick people). But the real challenge is to work on the adaptation to future and increasing
meteor-tropic effects, completely inside the long term time-scale of climate variability.
The preliminary bioclimatology of meteor-tropic effects and it tendencies in the region of North America and the Caribbean is under
development. Considering the sample of contrasting weather changes due to hyperoxia conditions (PODA index higher than 4, 8 and 12
g/m3) during February 2008, there is a significant
reduction of the frequency and extension of the areas potentially affected by meteor-tropic effects
(Fig. 16).
% of days w ith
PODA > 4 % of days w ith
PODA > 8 % of days w ith
PODA > 12
Figure 16. Percent of days with the PODA index above 4, 8 and 12 g/m
3 for February 2008
The same picture can be observed from the
sample of contrasting weather changes due to hypoxia conditions (PODA index lower than selected thresholds (Fig. 17). The health
counterpart working in these areas can develop
JANUARY JULY

12
strategies in order to strengthen the population´s health. This is a specific example on how to
contribute to climate change adaptation from the human health perspective.
% of days w ith
PODA < -4 % of days w ith
PODA < -8 % of days w ith
PODA < -12
Figure 17. Percent of days with the PODA index below -4, -8 and -12 g/m
3 for February 2008
On the other hand, the spatial distributions of the monthly frequencies with non-contrasting
weather changes (PODA index between -4 and 4 g/m
3) along the same year 2008 offer a reverse but
consistent picture.
The maps in Fig. 18 show a definite seasonal variation with an increasing number of days with
non-contrasting weather changes in summer, being practically 100 % in the tropical latitudes, and lowest frequencies in the other seasons of the
year. In these maps, the areas with minimum frequencies represent the locations with major potential occurrence of meteor-tropic effects, being
coincident with the distributions of extreme contrasts of the PODA index mentioned before.
January February March
April May June
July August September
October November December
Figure 18. Monthly distribution in 2008 of the PODA index between -4 and 4 g/m
3 in the region
5. FINAL REMARKS.
The monitoring of meteor-tropic effects for North America and the Caribbean gives a clear regional picture on the main synoptic processes
and weather conditions affecting human health, through both: social and economic perspectives.
The opportune prevention of these effects based upon biometeorological forecast services may produce significant economic and social
benefit. This kind of services increase the quality of medical assistance and strengthens the health surveillance in the regional and local scales. It
contributes to develop new therapeutic methods and preventive procedures directed to mitigate the negative effects of weather variability on the most
sensitive individuals in the region. In terms of adaptation to future scenarios with
more frequent occurrence of significant meteor-tropic effects, with the aim of effective biometeorological forecast services may diminish
the morbidity and mortality rates due to several chronic diseases, especially those close related with the climate or weather variability. However, in
spite of the successful existing results, it’s very desirable to continue and to extend the daily monitoring of meteor-tropic effects to other
scenarios and regions. The interpretation and application of bio-
forecasts are very easy; but still the participation from the medical side is very limited and it should increase. The medical side is not only the user; it
must be a real scientific partner. More research work must be done, in order to
understand better the main starting mechanisms of meteor-tropic responses by diseases, as well as to design new organizational, therapeutic and
preventive procedures for the medical institutions and services.
6. BIBLIOGRAPHY Institute of Meteorology (INSMET), 2009: Climate
Monitoring Bulletin, December. Kalkstein, L.S., 1991: A new approach to evaluate
the impact of climate change upon human mortality. Environmental Health Perspectives, 96: 145-150.
----------, 1995: Lessons from a very hot summer. Lancet, 346: 857-859.

13
----------, 1996: A new spatial synoptic classification: application to air mass analysis. Int.
Journal of Climatology, 16(8): 1-22. Kalkstein, L.S., P.F. Jamason and J.S. Greene,
1996: The Philadelphia hot weather-health watch/warning system: development and application. Bull. of the AMS, 77(7): 56-64.
Kirch, W., B. Menne and R. Bertollini, 2005: Extreme weather events and public health
responses. Editorial Springer-Verlag, ISBN 3-540-24417-4.
Kovacs, S., K.I. Ebi and B. Menne, 2003: Methods of assessing human health vulnerability and public health adaptation to climate change. In: Health and
Global Environmental Change, serie 1, ISBN 92 890 1090 8, World Health Organization.
Lecha, L., 1993: Estudio bioclimático de la provincia de Cienfuegos. Edit. Academia, La Habana.
----------, 1998: Biometeorological classification of daily weather types for the humid tropics. Int.
Journal of Biometeorology, 42, 2; 77-83. Lecha L., V. Morozov, M. Nieves y M. Sardiñas,
1986: Influencia de las bajas extratropicales sobre los estados del tiempo en Cuba y tipos de circulación asociados. Rev. Cub. Meteorología, 2,
18-25. Lecha, L. y A. Llanes, 1989: Características
estacionales de la circulación atmosférica sobre Cuba. Rev. Cub. Meteorología, 1, 1; 49-56.
Lecha, L., L. Paz y B. Lapinel, 1994: El clima de Cuba. Edit. Academia, La Habana.
Lecha, L. and T. Delgado, 1996: On a regional health watch and warning system. In: Proceedings of the 14th Int. Congress of Biometeorology,
Ljubljana, Slovenia; Part 2, Vol. 3; 94-107. McMichael, A.J., A. Haines, R. Sloof and S.
Kovacs, 1996: Climate change and human health. World Health Organization, Geneva.
Ovcharova, V.F., 1981: Calculation of the oxygen content in the air upon the base of meteorological parameters (pressure, temperature and humidity)
for the forecast of the effects of hypoxia conditions [in Russian]. Problems of Climatotherapy, Physiotherapy and Physical Culture, 2: 29-34.
-----------------, 1987a: Homeokines in weather hypoxia and hyperoxia. In: Proceeding of the
Climate and Health Symposium. WHO/WMO, 2; 149.
-----------------, 1987b: New approach to the forecast of meteor-pathological reactions [in Russian]. Problems of Climatotherapy,
Physiotherapy and Physical Culture, 5; 40-44. Tromp, S.W., 1963: Medical Biometeorology.
Weather, climate and the living organism. Ed. Elsevier, Amsterdam – London - New York.
Voronin, I.M., 1954: Experimental study of the effect of the climatotherapeutic factors on the human organism [in Russian]. In: Documents of
the 2nd Inter-Institutional Conference on climatotherapeutic experiences. Moscow, November 25-27.
World Climate Applications and Services Program, 1999a: Report of the planning meeting for the
Shanghai CLIPS showcase project: heat/health warning system. WMO/TD No. 984, WCASP-49.
----------, 2004: Proceeding of the meeting of experts to develop guidelines on heat-health warning systems. WMO/TD No. 1212, WCASP-63.
www.wunderground.com, 2014a: April 27-30 Severe Weather Outbreak: 39 Dead, $1 Billion+ in
Damage. Posted by: Dr. Jeff Masters, 5:24 PM GMT on May 1, 2014.
www.wunderground.com, 2014b: April 2014 Tied for Earth's Warmest April on Record. Posted by: Dr. Jeff Masters, 3:21 PM GMT on May 20,
2014.