114369-43-6 (unstated steriochemistry) c19h17cln4
TRANSCRIPT

349
FENBUCONAZOLE (197)
ISO common name: fenbuconazole
Chemical nameIUPAC: 4-(4-chlorophenyl)-2-phenyl-2-(1H-1,2,4-triazol-1-yl)methybutyronitrileCA: α-[2-(4-chlorophenyl)ethyl]-α-phenyl-1H-1,2,4-triazole-1-propanenitrile
CAS registry no: 114369-43-6 (unstated steriochemistry)119611-00-6 (with chiral properties specified)
Synonyms: Fenethanil, RH-7592, RH-57592.
Structural formula:
C CH 2 Cl
CN
CH 2
NN
N
CH 2
Molecular formula: C19H17ClN4
Molecular weight: 336.8
Physical and chemical properties
Pure active ingredient
Physical state: solid
Appearance: white crystalline
Melting point: 126.5-127.0°C (Graves, 1991; Batra 1997)
Solubility: water, mg/l: 3.77/25oC; 7.01/40oC (bead elution/HPLC method, unbufferedwater) 2.04-2.26 (22oC shake flask method, unbuffered water) (Jacobson,1988)
3.6/pH 7; 3.6/pH9 (20oC, shake flask method) (Kellner, 1992) soluble inketones, esters, alcohols and aromatic hydrocarbons; insoluble in aliphatichydrocarbons
Vapour pressure: <10-5 Pa at 20°C (OECD method 104) (Kellner, 1992)

fenbuconazole350
4.9 x 10⁻⁶ Pa. (Purity unstated but test carried out on “recrystallised fenbuconazole”)(Graves, 1991)
Hydrolysis:Not hydrolysed 30 days under sterile conditions in the dark at pH 5, 7, and 9.Estimated minimum half-life 2210 days at pH 5, 3740 days at pH 7, 1340days at pH 9 (O’Dowd, 1990d)
Photolysis:Stable in pH 7 aqueous buffer at 25oC for 30 days with 12-hour light/darkcycles (Wang,1991b)
Degraded at a concentration of 1.5mg/l in natural pond water. Assumingpseudo-first-order kinetics, calculated half-life was 86.7 days. (Baur 1994)
Octanol/water partition coefficient:log Pow = 3.22 at 25ºC. Determined from 14C-fenbuconazole (radiochemicalpurity 99.5%) solutions of 100, 500 and 1,000 ppm which were partitioned intriplicate between octanol and water, and the concentration in each phasewas determined by radioassay. (O’Dowd, 1987).
Henry’s Law Constant: 7.63 x 10⁻⁹ [atm.m3/g.mol] at 25ºC (Chong, 1992)
Technical material
Purity: 98.3% (94% minimum)Physical state: Off-white to white powderMelting point: 124°-126°C
Solubility in water: 3.8 mg/l at 25°C, 7.0 mg/l at 40°C (unspecified pH) (Graves, 1991;Costlow, 1997b)
Solubility, g/l 25°C: 231 in acetonitrile(by HPLC) 77 in aromatic 200 (C9 & C10 hydrocarbons)
445 in cyclohexanone159 in ethyl acetate39 in ethanol1 in heptane13 in n-octanol(Graves, 1991)
Fat solubility at 37°C: 1052.2 mg/100g (MacDonald et al., 1990a; Batra, 1997)
Surface tension:69.5 mN/m (as a 90% saturated water solution at 22°C. (fenbuconazole purity stated as “94 to99.5%”). Test carried out according to EU method A5. (MacDonald et al., 1990c; Costlow,1997b)
Relative density: D20 = 1.27 (EU method A3) (MacDonald et al., 1990b)
fenbuconazole 351
Formulations
Fenbuconazole is a triazole fungicide and is formulated mainly as an EC or an EW (oil inwater emulsion).
METABOLISM AND ENVIRONMENTAL FATE
The studies were carried out with [14C]fenbuconazole uniformly incorporated in theunsubstituted phenyl ring (phenyl-labelled) or the triazole ring (“triazole-labelled”), as shownby the asterisks in the structures shown below.
C CH2
Cl
CN
CH2
N
N
N
CH2
C CH2
Cl
CN
CH2
N
N
N
CH2
*
*
Triazole-labelledPhenyl-labelled
**
*
* *
*
Animal metabolism
Rats. In a 1987 study (Hanauer, 1991), four groups of 4 Crl:CD BR rats were orally dosedwith phenyl-labelled [14C]fenbuconazole (radiochemical purity >99%). A 0.5% suspension ofmethyl cellulose was used as the vehicle. Dosing was by gavage at 100 mg/kg bw. Allanimals were killed 7 days after dosing.
In group 1 (four males) whole blood samples were taken for liquid scintillationcounting 0.25, 1, 3, 6, 24, 48, 72, 96 and 168 hours after dosing. In group 2 (four males) urineand faeces were collected at 0, 6, 24, 48, 72, 96 and 168 hours, and 14C was determined in theexpired air and in selected tissues and organs after 7 days. In groups 3 and 4 (four animals ofeach sex) urine and faeces collected as in group 2 were frozen over liquid nitrogen forsubsequent analysis.
The average total recovery of 14C from the animals in group 2 was 67% of theadministered dose, about 62% in the faeces and 4% in the urine. Radioactivity detected inexpired CO² accounted for only 0.05% of the administered dose. Most of the excretion hadoccurred by 48 hours. Peak blood and plasma levels of the radiolabel were detected at 6hours. A biphasic elimination pattern was seen with a rapid first phase (half-life 7 hours)followed by a slower second phase (half-life about 50 hours for plasma and 187 hours forwhole blood). After 7 days <0.5% of the administered dose was detected in the tissues, wherethe radiolabel levels were all lower than 2.5 mg/kg fenbuconazole equivalents (liver levelswere highest at 2.48 mg/kg or 0.13% of the dose). Of the average total of 0.53% of the dosedradiolabel found in the bodies after 7 days, 0.24% was found in the carcase.

fenbuconazole352
The combined faeces and urine samples of each sex were analysed, using a variety ofextractions, solvent partitions and chromatographic separations, and the purified componentsof the residue were identified by mass spectrometry or chromatographic comparison withsynthesized samples of the suspected metabolites. The metabolite profile in the excreta isshown in Table 1.
Table 1. Metabolite profile of fenbuconazole in excreta of rats.
Percentage of total activity in excretaCompoundMale Female
Fenbuconazole 7.9 13.0Lactones (both diasterioisomers) 12.9 8.1Iminolactone 2.5 0.9Benzylic alcohols (including non-sulfate conjugates) 7.1 3.3Benzylic sulfates (both diasterioisomers) 4.1 11.2Phenols (3-OH and 4-OH isomers, including conjugates) 9.3 14.3Phenol lactones (both isomers, including conjugates) 6.5 5.8Ketoacid 2.4 1.0Phenol ketoacid 5.1 0.0RH-79681 <1 <1Triazole 1.92 1.52
14-(4-chlorophenyl)-2-hydroxymethyl-2-phenylbutyronitrile2Percentage of dose
In a 1992 study, groups of male and female Crl:CD BR rats were dosed by gavagewith phenyl-labelled [14C]fenbuconazole (98.7% radiochemical purity) using a 0.5%suspension of methyl cellulose as the vehicle. Three groups of 5 males and 5 females weregiven single doses of 1 or 100 mg/kg bw [14C]fenbuconazole or a labelled dose of 1 mg/kg bwafter a 14-day treatment with 10 ppm of the unlabelled compound in the diet. Urine andfaeces samples were taken at 0, 6, 24, 48, 72 and 96 hours after dosing and the animals werethen killed. Two groups of 3 males and 3 females were dosed with 1 mg/kg bw, and excretasamples were taken at the time of dosing and when the rats were killed after 3 or 12 hours.One group of 5 males and 5 females were biliary canulated and dosed at 1 mg/kg bw. Excretasamples were taken up to 72 hours, when the animals were killed, and blood samples at 0, 6,24, 48 and 72 hours. Tissues, organs and the carcases except those from the last group wereanalysed for radioactivity, but only the whole carcases of the canulated group were analysed.
The average total recoveries of 14C in the groups killed after 4 days were 96-104.7%of the administered doses, mainly in the faeces and within the first 48 hours (Table 2).
fenbuconazole 353
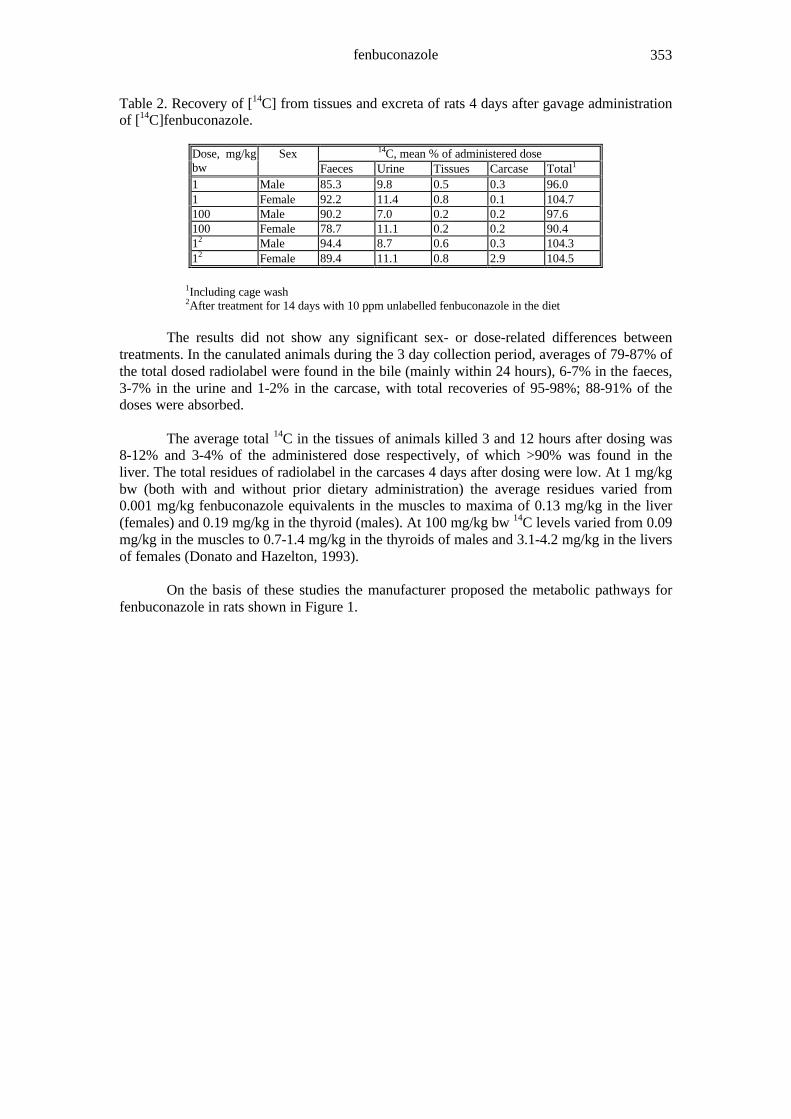
Table 2. Recovery of [14C] from tissues and excreta of rats 4 days after gavage administrationof [14C]fenbuconazole.
14C, mean % of administered doseDose, mg/kgbw
SexFaeces Urine Tissues Carcase Total1
1 Male 85.3 9.8 0.5 0.3 96.01 Female 92.2 11.4 0.8 0.1 104.7100 Male 90.2 7.0 0.2 0.2 97.6100 Female 78.7 11.1 0.2 0.2 90.412 Male 94.4 8.7 0.6 0.3 104.312 Female 89.4 11.1 0.8 2.9 104.5
1Including cage wash2After treatment for 14 days with 10 ppm unlabelled fenbuconazole in the diet
The results did not show any significant sex- or dose-related differences betweentreatments. In the canulated animals during the 3 day collection period, averages of 79-87% ofthe total dosed radiolabel were found in the bile (mainly within 24 hours), 6-7% in the faeces,3-7% in the urine and 1-2% in the carcase, with total recoveries of 95-98%; 88-91% of thedoses were absorbed.
The average total 14C in the tissues of animals killed 3 and 12 hours after dosing was8-12% and 3-4% of the administered dose respectively, of which >90% was found in theliver. The total residues of radiolabel in the carcases 4 days after dosing were low. At 1 mg/kgbw (both with and without prior dietary administration) the average residues varied from0.001 mg/kg fenbuconazole equivalents in the muscles to maxima of 0.13 mg/kg in the liver(females) and 0.19 mg/kg in the thyroid (males). At 100 mg/kg bw 14C levels varied from 0.09mg/kg in the muscles to 0.7-1.4 mg/kg in the thyroids of males and 3.1-4.2 mg/kg in the liversof females (Donato and Hazelton, 1993).
On the basis of these studies the manufacturer proposed the metabolic pathways forfenbuconazole in rats shown in Figure 1.

fenbuconazole354
Figure 1. Metabolism of fenbuconazole in rats.
NN
N
Cl
OHO
unsaturated keto m-chlorophenol
NN
N
CN
ClHO
HO OH
hydroxy-dihydrodiol
NN
N
CN
Cl
OH
RH-4911
NN
N
CN
Cl
RH-7592N
N
N
CN
ClHO
HOdihydrodiol
NN
N
CN
Cl
HO
3- or 4-phenol
NN
N
Cl
OO
HO
3- or 4-phenollactones
NN
N
CN
Cl
OH
benzylic alcoholsRH-6648
NN
N
CN
Cl
OHO
keto-m-chlorophenol
NN
N
CN
Cl
O
ketoneRH-6467
NN
N
CN
Cl
OHO
keto-phenol
NN
N
Cl
OHN
iminolactonesRH-6468
NN
N
Cl
OO
lactonesRH-9129/ RH-9130N
N
N
Cl
OHO
unsaturatedketo-phenol
CN
ClHO
RH-7968
NHN
Ntriazole, RH-0118
keto-acid
+
NN
N
Cl
OCO2H
The hydroxylated compounds may also be conjugated with sulfate, but were mainly present asglucuronide (Batra, 1997; Ross, 1997b).
Goats. Nine lactating goats each received seven daily doses of [14C] fenbuconazole, five withthe phenyl label at rates equivalent to 1, 10 and 100 ppm in the feed and four with the triazolelabel at a rate equivalent to 100 ppm. The goats were slaughtered 24 after the last dose. Allsamples were analysed by LSC after combustion. The samples were also extracted with

fenbuconazole 355
methanol and then partitioned successively with ethyl acetate, n-butanol, hexane and water.The resulting organic and aqueous phases were analysed by TLC and HPLC.
The overall recoveries of 14C were 72.7-87.3% from the phenyl label and 74.3-81.2%from the triazole labels. Most of the radioactivity was excreted (79.7-86.0% of the phenyllabel and 72.3-80.0% of the triazole), with less than 0.1% of the phenyl label and 0.2-0.4% ofthe triazole label in the milk and 0.8-1.2% of the phenyl and 1.1-1.6% of the triazole label inthe tissues.
The total 14C in the milk, expressed as fenbuconazole equivalent, was less than 0.01mg/kg at the 1 and 10 ppm feeding levels. At the 100 ppm level it reached plateaux of 0.07mg/kg after 4 days with the phenyl label and 0.4 mg/kg after 5 days with the triazole label.
The triazole-labelled compound yielded two major metabolites in the milk, triazole(0.24 mg/kg) and triazolylalanine (0.15 mg/kg). The parent compound and six othermetabolites were also identified, but were present at levels below 0.02 mg/kg (Table 3).
Table 3. Fenbuconazole and its metabolites in goat milk.
14C, mg/kg as fenbuconazoleCompoundPhenyl label Triazole label
Fenbuconazole 0.02 <0.01Lactones and phenols 0.02 <0.01Triazole - 0.24Triazolylalanine - 0.15RH-7968 <0.01 <0.01Benzylic glucuronides 0.02 <0.01Total 0.06 0.40
The total 14C in the tissues (expressed as fenbuconazole) from the phenyl label wasless than 0.05 mg/kg from the 1 and 10 ppm feeding levels, except in liver which contained0.10 and 0.62 mg/kg. The 100 ppm feeding level produced 0.07 mg/kg in the muscle, 0.16mg/kg in the fat, 0.89 mg/kg in the kidneys and 7.9 mg/kg in the liver. The triazole label at100 ppm gave average total 14C residues in the tissues of 0.23 mg/kg in the muscle, 0.02mg/kg in the fat, 0.94 mg/kg in the kidneys and 12.1 mg/kg in the liver.
Table 4 shows the averages of the residues from the two labels for the 100 ppmfeeding level.
Table 4. Fenbuconazole and its metabolites in goat tissues.
14C, mg/kg as fenbuconazoleCompoundLiver Kidneys Muscle Fat
Fenbuconazole 0.95 0.10 0.02 0.02Lactones1
PhenolIminolactones1
KetoacidBenzylic alcohols1
Benzylic sulfates1
0.840.470.560.160.130.40
0.060.13
<0.01<0.010.050.03
<0.01<0.01<0.01<0.01<0.01<0.01
<0.01<0.01<0.01<0.01<0.01<0.01
Triazole 1.79 0.11 0.09 <0.01TriazolylalanineRH-7968Benzylic glucuronides1
Total
4.950.951.23
12.43
0.240.130.13
0.97
0.070.01
<0.01
0.22
<0.010.040.01
0.11
1Diasterioisomers

fenbuconazole356
The six major components identified in the liver were the parent (0.95 mg/kg), thelactones (0.84 mg/kg), 4-(4-chlorophenyl)-2-hydroxymethyl-2-phenylbutyronitrile (RH-7968,0.95 mg/kg), the benzylic glucuronides (1.23 mg/kg), triazole (1.79 mg/kg) andtriazolylalanine (4.95 mg/kg). Five other metabolites were identified at levels below 0.6mg/kg.
In the kidneys the six main components were the parent (0.10 mg/kg), RH-7968 (0.13mg/kg), the phenol (0.13 mg/kg), glucuronides (0.13 mg/kg), triazole (0.11 mg/kg) andtriazolylalanine (0.24 mg/kg). Five other metabolites were identified at levels of [0.06 mg/kg.
In muscle the main components were the parent (0.02 mg/kg), RH-7968 (0.01 mg/kg),triazole (0.09 mg/kg) and triazolylalanine (0.07 mg/kg). Six other metabolites were identifiedat levels below 0.01 mg/kg.
In fat all the compounds except the parent (0.02 mg/kg), RH-7968 (0.04 mg/kg) andthe glucuronides (0.01 mg/kg) were at levels below 0.01 mg/kg (Jameson, 1989a; Predmore,1990; Sharma 1992a).
The conversion of the two isomers of the iminolactones RH-6468 to thecorresponding isomers of the lactones RH-9129 and RH-9130 during the analysis of cow liversamples was demonstrated. Samples fortified with RH-6468 were processed by the analyticalmethod of Filchner (1994) and the conversion was shown to occur during clean-up on silicagel and C-18 SPE columns (Staurowsky and Wu, 1994).
The manufacturer has proposed the metabolic pathways in lactating goats shown inFigure 2.

fenbuconazole 357
Figure 2. Metabolic pathways of fenbuconazole in lactating goats (Batra, 1997).
CN
Cl
O
O
NN
NCl
CN
ClNN
N
OSO3H
O
NN
N
NH
NN
NCl
CN
ClNN
N
OH CN
ClNN
N
O
CN
ClNN
N
OGluCO2H
CO2H
ClNN
N
O
NN
N COOH
NH2
NNH
N
CN
HO
CN
ClNN
N
ClOH
triazole RH-0118
4-phenol RH-1311
ketoacid RH-1745 lactones
RH-9129 + RH-9130
iminolactones RH-6468
benzylic glucuronides
benzylic sulfates RH-6649
ketoneRH-6467benzylic alcohols
RH-6648
RH-7592 RH-7968
triazolealanine RH-3968
+
Hens. Thirty five laying hens each received seven daily doses of [14C]fenbuconazole at ratesequivalent to 100 ppm in the feed, ten with the phenyl label and 25 with the triazole. The henswere killed 24 hours after the last dose. Samples were analysed by LSC after combustion, andwere extracted with methanol and then partitioned into ethyl acetate, n-butanol and water. Theresulting organic and aqueous phases were analysed by TLC and HPLC.
The overall recoveries of radioactivity were 94.9-99.4% from the phenyl label and87.1-95.8% from the triazole label. Excretion accounted for 93.4-97.8% of the phenyl labeland 85.1-93.8% of the triazole label, with only 0.4-0.5% of the phenyl label and 0.6-0.7% ofthe triazole label in the eggs and 0.6% of the phenyl label and 0.6-0.8% of the triazole label inthe tissues.
The total 14C in the eggs reached levels after 6 days of 2.0 mg/kg expressed asfenbuconazole with the phenyl label and 2.7 mg/kg with the triazole label. The majorcomponents identified in the eggs were the parent (0.9 mg/kg), its lactone (0.6 mg/kg) and,
fenbuconazole358
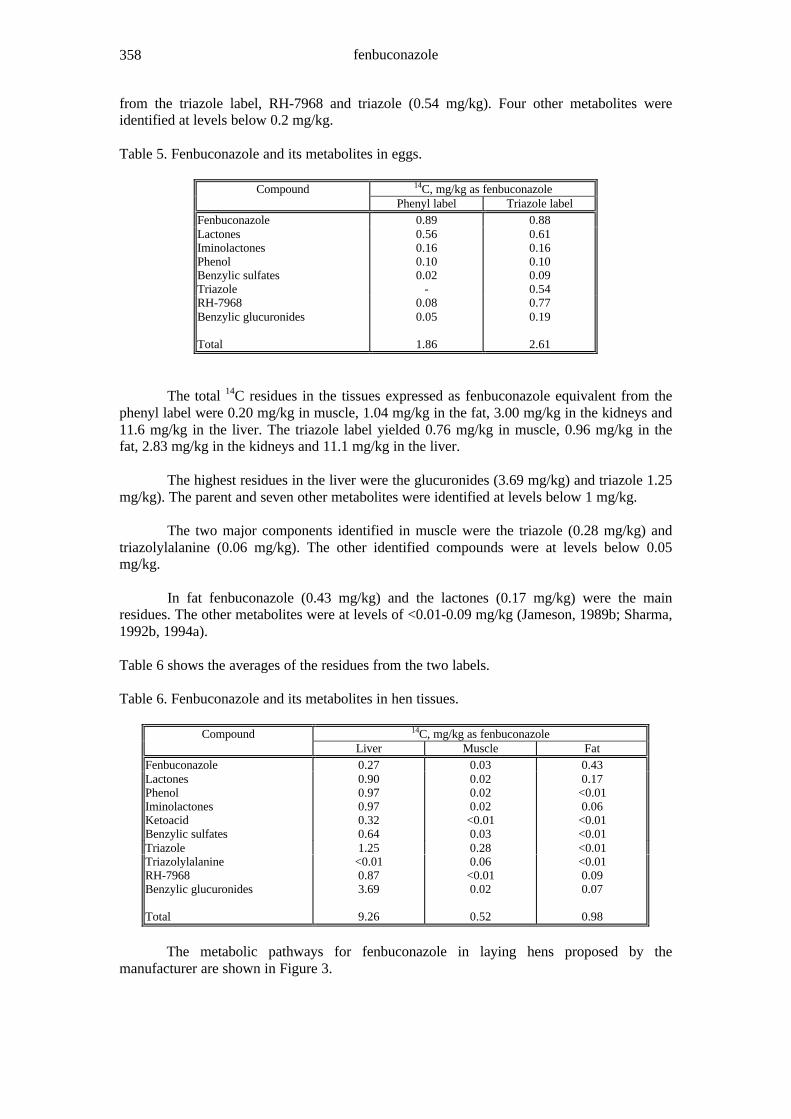
from the triazole label, RH-7968 and triazole (0.54 mg/kg). Four other metabolites wereidentified at levels below 0.2 mg/kg.
Table 5. Fenbuconazole and its metabolites in eggs.
14C, mg/kg as fenbuconazoleCompoundPhenyl label Triazole label
Fenbuconazole 0.89 0.88LactonesIminolactonesPhenolBenzylic sulfates
0.560.160.100.02
0.610.160.100.09
Triazole - 0.54RH-7968Benzylic glucuronides
Total
0.080.05
1.86
0.770.19
2.61
The total 14C residues in the tissues expressed as fenbuconazole equivalent from thephenyl label were 0.20 mg/kg in muscle, 1.04 mg/kg in the fat, 3.00 mg/kg in the kidneys and11.6 mg/kg in the liver. The triazole label yielded 0.76 mg/kg in muscle, 0.96 mg/kg in thefat, 2.83 mg/kg in the kidneys and 11.1 mg/kg in the liver.
The highest residues in the liver were the glucuronides (3.69 mg/kg) and triazole 1.25mg/kg). The parent and seven other metabolites were identified at levels below 1 mg/kg.
The two major components identified in muscle were the triazole (0.28 mg/kg) andtriazolylalanine (0.06 mg/kg). The other identified compounds were at levels below 0.05mg/kg.
In fat fenbuconazole (0.43 mg/kg) and the lactones (0.17 mg/kg) were the mainresidues. The other metabolites were at levels of <0.01-0.09 mg/kg (Jameson, 1989b; Sharma,1992b, 1994a).
Table 6 shows the averages of the residues from the two labels.
Table 6. Fenbuconazole and its metabolites in hen tissues.
14C, mg/kg as fenbuconazoleCompoundLiver Muscle Fat
Fenbuconazole 0.27 0.03 0.43LactonesPhenolIminolactonesKetoacidBenzylic sulfates
0.900.970.970.320.64
0.020.020.02
<0.010.03
0.17<0.010.06
<0.01<0.01
Triazole 1.25 0.28 <0.01TriazolylalanineRH-7968Benzylic glucuronides
Total
<0.010.873.69
9.26
0.06<0.010.02
0.52
<0.010.090.07
0.98
The metabolic pathways for fenbuconazole in laying hens proposed by themanufacturer are shown in Figure 3.

fenbuconazole 359
Figure 3. Metabolic pathways of fenbuconazole in laying hens (Batra,1997).
CN
Cl
O
O
NN
NCl
CN
ClNN
N
OSO3H
O
NN
N
NH
NN
NCl
CN
ClNN
N
OH CN
ClNN
N
O
CN
ClNN
N
OGluCO2H
CO2H
ClNN
N
O
NN
N COOH
NH2
NNH
N
CN
HO
CN
ClNN
N
ClOH
triazoleRH-0118
4-phenolRH-1311
keto acidRH-1745 lactones
RH-9129 + RH-9130
iminolactones RH-6468
benzylic glucuronides
benzylic sulfates RH-6649
ketoneRH-6467benzylic alcohols
RH-6648
RH-7592 RH-7968
triazolylalanine RH-3968
+
Fenbuconazole appeared to be extensively metabolised in all the animal speciesstudied. Residues have been found which result from four metabolic pathways. The first isoxidation at the benzylic carbon linked to the chlorophenyl ring to produce the isomericbenzylic alcohols and their sulfate and glucuronide conjugates, the iminolactones, lactones,and the keto acid. The second pathway is oxidation of the unchlorinated benzene ring toproduce the 3- and 4-phenols and their conjugates. Combinations of paths 1 and 2 producephenol-lactones and their conjugates. The third path is cleavage of the triazole moiety whichproduces free triazole and its conjugates, and the alcohol RH-7968. The fourth pathwayconsists in hydroxylation of the chlorophenyl ring in the 3- position, followed by oxidation tothe ketone of the chlorophenol and elimination of HCN to yield the α-unsaturated ketone. Anoverview of the metabolism of fenbuconazole in animals is shown in Figure 4.

fenbuconazole360
Figure 4. Overview of the metabolic pathways of fenbuconazole in animals (Costlow 1997a;Batra 1997; Ross 1997b).
NN
N
CN
Cl
RH-7592
NN
N
CN
Cl
OH
benzylic alcoholsRH-6648 R, G
NN
N
Cl
OHN
iminolactonesRH-6468 R, H, G
+NH
N
Ntriazole, RH-0118
R, H, G
NN
N
CN
Cl
OH
RH-4911R
CN
ClHO
RH-7968 R, H, G
NN
N
COOH
NH2
TriazolealanineRH-3968 H, G
3-phenol R4-phenol RH-1311 R, H, G
NN
N
CN
Cl
HO
3- or 4-phenol
keto-acidNN
N
Cl
OCO2H
RH-1745 R, H, G
NN
N
Cl
OO
lactonesRH-9129/ RH-9130
R, F, H, GN
N
N
CN
Cl
OSO3H
Benzylic sulfatesR, F, H, G
NN
N
CN
Cl
OGluCOOH
benzylic glucuronidesR, F, H, G
NN
N
CN
Cl
OHO
keto-m-chlorophenolR
(+ unsaturated version)
NN
N
CN
Cl
HO2CGluO
NN
N
CN
Cl
HO3SO
+
phenol conjugates, R
NN
N
Cl
OO
HO
3- or 4-phenollactones R
NN
N
CN
Cl
O
ketoneRH-6467, F
NN
N
CN
Cl
O
HO2CGluO
NN
N
CN
Cl
O
HO3SO
+phenol-lactoneconjugates, R
R = ratF = fishH = henG = goat
PATHWAY 1
PATHWAY 3
PATHWAY 2
PATHWAY 4
Plant metabolism
Wheat. In a study carried out in the USA (Pennsylvania) in 1987 phenyl- and triazole-labelledfenbuconazole (radiochemical purities 99.0 and 98.5%) were applied as emulsifiableconcentrates twice to field-grown winter wheat at 0.4 kg ai/ha 218 and 226 days after sowing(growth stages 45 and 55). Samples were taken at harvest, 39 days after the last treatment. Allsamples were analysed by LSC after combustion, and were also soxhlet-extracted with

fenbuconazole 361
methanol. Straw and chaff were further extracted with sodium hydroxide/methanol, and grainwith HC1/methanol. The extracts were evaporated to dryness and reconstituted in ethylacetate/water and the aqueous layers were partitioned with butanol, chloroform and hexane.The resulting organic and aqueous phases were analysed by TLC, HPLC and GC-MS. Theunextractable material was combusted and analysed by LSC.
The total 14C residues at harvest (expressed as fenbuconazole equivalent) were 0.44mg/kg in the grain, 10.6 mg/kg in the straw and 6.1 mg/kg in the chaff from the phenyl label,and 0.14 mg/kg in the grain, 9.8 mg/kg in the straw and 6.1 mg/kg in the chaff from thetriazole. On re-analysis of the samples after drying and freezer storage before extraction, theresidues found were 0.05 mg/kg in the grain, 18.3 mg/kg in the straw and 7.6 mg/kg in thechaff from the phenyl label, and 0.53 mg/kg in the grain, 13.5 mg/kg in the straw and 6.4mg/kg in the chaff from the triazole label.
The percentage recoveries of radiolabelled material in the separate extracts are shownin Table 7 and the identities of components of the residues in Table 8. Five components wereidentified. In the grain the two major compounds identified with the triazole label weretriazolylalanine (0.25 mg/kg) and triazolylacetic acid (0.11 mg/kg); the parent was detected,but at less than 0.01 mg/kg. In the straw and chaff the three components identified werefenbuconazole, the lactone and the ketone at respective levels of 8.8-11.8, 1.1-1.4 and 0.59-0.62 mg/kg in the straw, and 3.7-4.5, 0.45-0.49 and 0.16-0.19 mg/kg in the chaff (all residuesexpressed as fenbuconazole).
Because two sugar conjugates of the chlorophenol RH-4911 were identified in peanutvines in another metabolism study the straw from the wheat treated with the triazole label wasre-examined. After soxhlet extraction with methanol the extract was evaporated to dryness,re-constituted in water and the aqueous solution partitioned with ethyl acetate and butanol.The ethyl acetate extract was then partitioned with chloroform to remove the parentcompound and the lactone metabolite, and the resulting ethyl acetate and butanol extractswere analysed by TLC. One of the two sugar conjugates, identified as the glucoside of RH-4911, was present at a level of 0.43 mg/kg expressed as fenbuconazole (Hawkins 1989, 1994;Sharma, 1993b).
Table 7. Distribution of extractable radioactivity in wheat at harvest.
14C, % of total in sampleGrain Straw Chaff
Extract
Phenyl label Triazole label Phenyl label Triazole label Phenyl label Triazole labelSoxhletEthyl acetate 25.3 5.4 85.5 79.8 69.2 77.6Butanol 15.4 6.8 2.4 1.6 6.6 1.8Aqueous 4.9 32.6 0.4 1.0 0.2 0.9BlenderEthyl acetate {11.6 1.1 - - - -Aqueous { 45.5 - - - -BaseHexane - - 0.7 - - -Chloroform - - 1.1 1.5 3.2 -Ethyl acetate - - 4.1 6.0 2.8 3.7Butanol - - 1.2 1.8 2.8 -Aqueous - - 4.9 5.7 2.7 8.9Unextractable 43.7 6.9 - 2.8 12.1 7.2Total 100.9 98.3 100.3 100.2 99.6 100.1

fenbuconazole362
Table 8. Distribution of fenbuconazole and its identified metabolites in wheat.
14C, % of total in sample (mg/kg as fenbuconazole)Phenyl label Triazole label
Compound
Grain Straw Chaff Grain Straw ChaffFenbuconazole 12.4(<0.01) 64.9 (11.8) 58.6 (4.49) 1.4 (<0.01) 60.2 (8.81) 57.9 (3.67)Lactone 1.6 (<0.01) 7.7 (1.40) 6.5 (0.49) 0.1 (<0.01) 7.5 (1.10) 7.1 (0.45)Ketone 0.0 (<0.01) 3.2 (0.59) 2.2 (0.16) 0.0 (<0.01) 4.2 (0.62) 3.0 (0.19)Triazolylalanine - - - 48.4 (0.25) - -Triazolylacetic acid - - - 20.1 (0.11) - -
Wheat and grapes. In a laboratory study of uptake and translocation under ambienttemperatures and fluorescent lighting, wheat (Fielder variety) and grape plants (Delawarevariety) were grown hydroponically in Hoagland nutrient solution for 14 days. Plants at the 3to 4 leaf growth stage were treated with phenyl-labelled fenbuconazole (radiochemical purity>98%) either through the roots by adding 2.55 mg/l fenbuconazole to the solution or byapplying 1 µl of 0.8% EC formulated fenbuconazole to one of the leaves of the plant with amicrocapillary tube. Samples were taken at intervals for 14 days. The whole plants wereautoradiographed and the combusted foliage and roots, the residual nutrient solution and theroot washings were radioassayed. The results are given in Table 9. TLC analyses indicatedthat the test substance was not degraded significantly. The assays and autoradiogramaindicated that uptake from the solution through the roots to the aerial plant parts was rapid,and that the radioactivity migrated rapidly to the tip of the leaf which had been treated. Therewas evidence of movement of the radioactivity downwards and to adjacent leaves from day 5in wheat. The same pattern of movement was observed in grapes, but was generally slower.The radioactivity was shown to be highly mobile in the xylem and slightly mobile in thephloem (Sharma, 1993a).
Table 9. Distribution of radioactivity in wheat and grape plants grown hydroponically aftertreatment of roots or leaves with phenyl-labelled [14C]fenbuconazole.
14C, mg/kg as fenbuconazole
Root treatment Leaf treatment
Crop Days
Foliage Roots Nutrientsolution
Root Treated leaf Untreatedleaf
Wheat 1 173 867 1.49 0.06 85 0.7
3 302 940 0.69 0.13 223 3.1
5 352 208 0.25
7 269 319 0.15 0.36 137 3.8
14 301 425 0.09 0.13 203 2.5
Grapes 1 1 938 1.95 0.05 167 0.08
3 37 596 0.51 0.05 90 0.7
5 112 219 0.25 0.16 119 1.9
7 53 726 0.21 0.17 104 0.9
14 51 284 0.14 0.54 107 1.3
Peanuts. In a field experiment in 1990 in North Carolina, peanuts (Florigiant variety)were treated four times at monthly intervals with either phenyl- or triazole-labelledfenbuconazole (formulated as 6% EC formulations) at 0.57 kg ai/ha. The field plots wereirrigated throughout the study. Nuts (separated into kernels and shells) and vines wereharvested 28 days after the last treatment. Each sample was ground to a fine powder andradioassayed after combustion to determine the total radioactive residues (Table 10).

fenbuconazole 363
Table 10. Total radioactive residues in peanuts and vines after treatment with either phenyl-or triazole-labelled fenbuconazole.
14C, mg/kg as fenbuconazoleSamplePhenyl label Triazole label
Vine 13.68 13.49Shells 1.04 1.30
Kernels 0.064 3.98
Each sample was extracted with methanol/water. Vines and shells were furtherextracted with KOH/methanol and kernels also with HCl/methanol. The total extractionefficiencies were >88% for all samples except kernels with the phenyl label from which only44% of the initial activity could be extracted even after treatment with both acid and base.
Vine extracts were analysed by TLC using various solvent systems and the spotswere autoradiographed to identify metabolites by comparison with reference standards. Someextracts were purified on C-18 columns and by TLC and HPLC. The structures of the sugarconjugates were established by β-glucosidase and acid hydrolysis, acetylation, andexamination of the products by mass spectrometry. The shell extracts were passed through C-18 columns which were eluted with water and acetonitrile. The acetonitrile fraction was co-chromatographed with standards by TLC.
Because of the low levels of residue in the kernels from the phenyl label comparedwith the triazole label, it was postulated that the kernels would contain only polar residues.When the kernels were further extracted with KOH/methanol/water there was no furtherrelease of radioactivity. It was concluded that the remaining 56% of the phenyl-labelledresidue was bound. The extractable residue was reconstituted in water and partitioned withethyl acetate and butanol. These extracts were shown to contain similar components to thosefrom the conjugates found in the vines.
The extractable triazole-labelled residues in the kernels and shells were analysed byTLC and cation-exchange column chromatography (which separated triazolylacetic acid andtriazolylalanine.
The distributions of the identified compounds are shown in Table 11.
Table 11. The nature of radioactive residues in peanuts treated with triazole-labelledfenbuconazole.
14C, % of TRR and mg/kg as fenbuconazoleVine Shell Kernel
Compound
% Mg/kg % mg/kg % mg/kgFenbuconazole 48.3 6.73 33.5 0.45 0 <0.002Lactone A, RH-9129 4.48 0.62 0.97 0.013 0 <0.002Ketone, RH-6467 8.82 1.23 7.51 0.10 0 <0.002Iminolactones, RH-6468 0 0 2.45 0.033 0 <0.002Sugar conjugates of RH-4911 23.8 3.32 17.2 0.23 0.50 0.019(glucoside and malonylglucoside)Triazolylalanine, RH-3968 6.57 0.91 22.2 0.30 91.8 3.50Triazolylacetic acid, RH-4098 0 0 4.24 0.057 1.9 0.07Unknown 2.08 0.028 1.36 0.052 - -Bound 8.00 1.11 9.9 0.13 4.4 0.17

fenbuconazole364
The identified compounds accounted for 88-94% of the total radioactivity recoveredfrom all of the samples except the kernels containing the phenyl label.
The vines and shells contained mainly compounds in which the framework of theoriginal molecule remained intact, namely fenbuconazole, small quantities of the lactone RH-9129, the ketone RH-6467 and the iminolactones RH-6468, and larger quantities of the sugarconjugates (mainly glucoside with some malonylglucoside) of the phenol RH-4911. Thekernels contained traces of these but the main residue consisted of triazolylalanine andtriazolylacetic acid in which only the triazole ring remained (Sharma, 1992c, 1993b).
Peaches. A study was carried out in the USA (Pennsylvania) in 1987. Phenyl- andtriazole-labelled fenbuconazole (radiochemical purities 98.5 and 98.8%), formulated asemulsifiable concentrates were sprayed five times on outdoor peach trees, from blossom until22 days before harvest (no rainfall on the days of application, except the first where 3.8mmfell, average temperature 21°C), at a rate of 0.2 kg ai/ha (0.7 for apples). Samples were takenat harvest and analysed by LSC after combustion. The samples were also extracted withmethanol in Soxhlets, 'polytrons' and blenders. The extracts were evaporated to dryness andreconstituted in chloroform/water, and the resulting aqueous layers were partitioned withethyl acetate, ether and butanol. The organic and aqueous phases were analysed by TLC,HPLC and GC-MS. The unextractable material was combusted and analysed by LSC.
The total 14C residues in the peaches at harvest (expressed as fenbuconazole) were0.08 mg/kg from the phenyl label and 0.12 mg/kg from the triazole label.
The distributions of the radiolabels are shown in Tables 12 and 13. The two maincomponents of the residue were triazolylalanine and the parent compound, which werepresent at levels of 0.06 and 0.02-0.04 mg/kg (as fenbuconazole) respectively. The lactoneand triazolylacetic acid were also identified. Five unknown compounds were present at levelsbelow 0.01 mg/kg.
TLC of the ethyl acetate extract showed that a component of the residue was similarto the conjugates of RH-4911 found in peanuts. Co-chromatography with the conjugatesidentified in the peanut metabolism study showed that they were identical (Hawkins, 1988;Sharma, 1993b).
Table 12. Distribution of extractable radioactivity in peaches at harvest.
% of extractable 14C in fruitExtractPhenyl label Triazole label
Chloroform 70.5 21.5
Ethyl acetate 15.7 -
Ether - 0.3
Butanol 5.8 7.9
Aqueous 1.6 64.6
Unextractable 6.4 4.6
Total 100.0 98.9
Table 13. Fenbuconazole and its metabolites in fruit at harvest.
14C, % of TRR (mg/kg as fenbuconazole)CompoundPhenyl label Triazole label
Parent 45.0 (0.04) 15.5 (0.02)Lactone 14.2 (0.01) 4.3 (<0.01)Triazolylalanine - 47.5 (0.06)

fenbuconazole 365
14C, % of TRR (mg/kg as fenbuconazole)CompoundPhenyl label Triazole label
Sugar conjugates of RH-4911 - 4.4 (<0.01)Triazolyl acetic acid - 6.7 (<0.01)
A further study on sugar beet in 1997 was referenced by the manufacturer but notsubmitted for review. The manufacturer has proposed the metabolic pathway in plants shownin Figure 5.
Figure 5. Metabolic pathways of fenbuconazole in plants (Costlow, 1997a).
CN
Cl
O
O
NN
NCl
NN
N COOH
NH2
NNH
N
NN
NCOOH
NN
N COOH
O
O
NN
N
NH
NN
NCl
CN
ClNN
N
OH
CN
ClNN
N
O
CN
ClNN
N
CN
ClNN
N OGlu
NN
N COOH
CN
ClNN
N OH
OGluOCOCH2COOH
symmetricaltriazoleacetic acid Ro
benzylic alcohol RH-6648
malonyl glucoside, Pt,W,P
glucoside, Pt,W,P
+
iminolactones RH-6468, Pt
triazolepyruvic acid
ketone RH-6467 W, Pt, Ro
triazoleacetic acid RH-4098 W, P, Pt, Ro
triazolealanine RH-3968 W, P, Pt, Ro
1,2,4-triazole RH-0118
lactonesRH-9129 and RH-9130 W, P, Pt, Ro
RH-7592
W = wheatP = peachPt = peanutRo = rotation crops
PATHWAY 1
PATHWAY 2
RH-4911
PATHWAY 3
fenbuconazole366
Metabolism and distribution in rotational crops
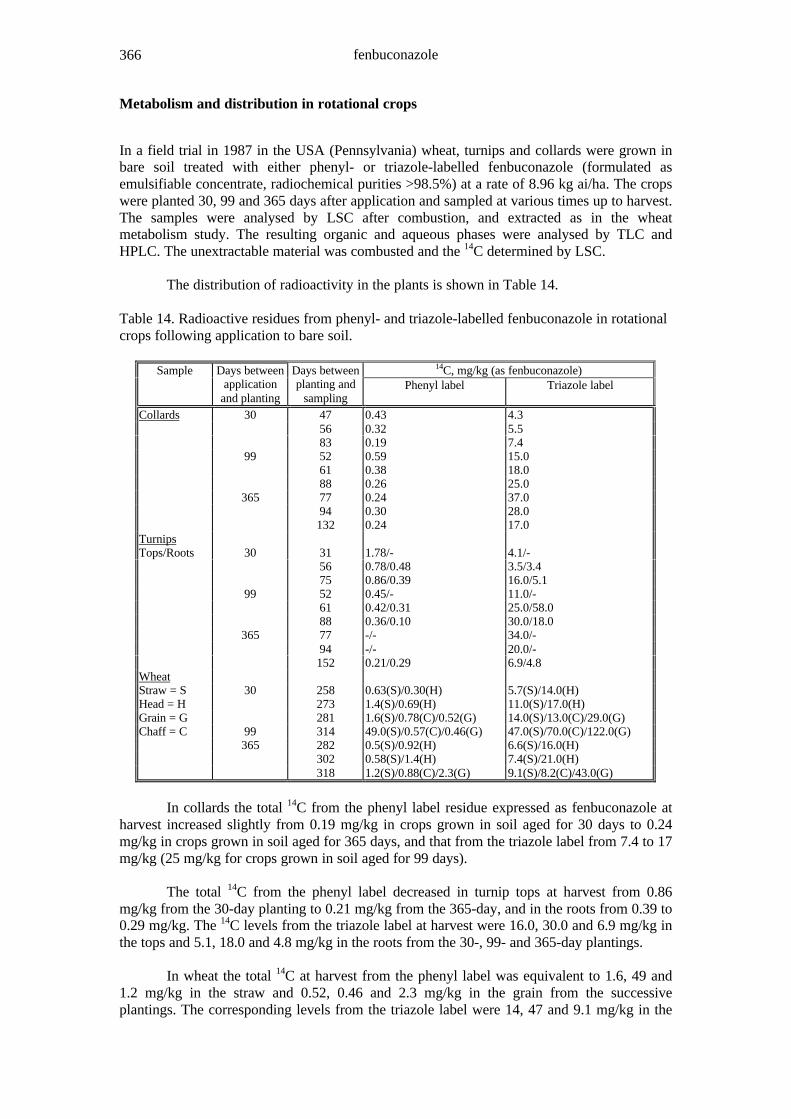
In a field trial in 1987 in the USA (Pennsylvania) wheat, turnips and collards were grown inbare soil treated with either phenyl- or triazole-labelled fenbuconazole (formulated asemulsifiable concentrate, radiochemical purities >98.5%) at a rate of 8.96 kg ai/ha. The cropswere planted 30, 99 and 365 days after application and sampled at various times up to harvest.The samples were analysed by LSC after combustion, and extracted as in the wheatmetabolism study. The resulting organic and aqueous phases were analysed by TLC andHPLC. The unextractable material was combusted and the 14C determined by LSC.
The distribution of radioactivity in the plants is shown in Table 14.
Table 14. Radioactive residues from phenyl- and triazole-labelled fenbuconazole in rotationalcrops following application to bare soil.
14C, mg/kg (as fenbuconazole)Sample Days betweenapplication
and planting
Days betweenplanting and
samplingPhenyl label Triazole label
Collards 30 47 0.43 4.356 0.32 5.583 0.19 7.4
99 52 0.59 15.061 0.38 18.088 0.26 25.0
365 77 0.24 37.094 0.30 28.0132 0.24 17.0
TurnipsTops/Roots 30 31 1.78/- 4.1/-
56 0.78/0.48 3.5/3.475 0.86/0.39 16.0/5.1
99 52 0.45/- 11.0/-61 0.42/0.31 25.0/58.088 0.36/0.10 30.0/18.0
365 77 -/- 34.0/-94 -/- 20.0/-152 0.21/0.29 6.9/4.8
WheatStraw = S 30 258 0.63(S)/0.30(H) 5.7(S)/14.0(H)Head = H 273 1.4(S)/0.69(H) 11.0(S)/17.0(H)Grain = G 281 1.6(S)/0.78(C)/0.52(G) 14.0(S)/13.0(C)/29.0(G)Chaff = C 99 314 49.0(S)/0.57(C)/0.46(G) 47.0(S)/70.0(C)/122.0(G)
365 282 0.5(S)/0.92(H) 6.6(S)/16.0(H)302 0.58(S)/1.4(H) 7.4(S)/21.0(H)318 1.2(S)/0.88(C)/2.3(G) 9.1(S)/8.2(C)/43.0(G)
In collards the total 14C from the phenyl label residue expressed as fenbuconazole atharvest increased slightly from 0.19 mg/kg in crops grown in soil aged for 30 days to 0.24mg/kg in crops grown in soil aged for 365 days, and that from the triazole label from 7.4 to 17mg/kg (25 mg/kg for crops grown in soil aged for 99 days).
The total 14C from the phenyl label decreased in turnip tops at harvest from 0.86mg/kg from the 30-day planting to 0.21 mg/kg from the 365-day, and in the roots from 0.39 to0.29 mg/kg. The 14C levels from the triazole label at harvest were 16.0, 30.0 and 6.9 mg/kg inthe tops and 5.1, 18.0 and 4.8 mg/kg in the roots from the 30-, 99- and 365-day plantings.
In wheat the total 14C at harvest from the phenyl label was equivalent to 1.6, 49 and1.2 mg/kg in the straw and 0.52, 0.46 and 2.3 mg/kg in the grain from the successiveplantings. The corresponding levels from the triazole label were 14, 47 and 9.1 mg/kg in the

fenbuconazole 367
straw and 29, 122 and 43 mg/kg in the grain. The manufacturer stated that the high levels inthe wheat planted 99 days after treatment were possibly due to the low yield and near cropfailure two weeks before harvest.
The recoveries of 14C from the triazole label are shown in Table 15. Only samples atharvest with this label were completely analysed: analysis of selected samples with the phenyllabel did not show any compound that was not seen with the triazole label. Two majormetabolites were identified as triazolylacetic acid and triazolylanine, which accountedrespectively 4.4-19.0 and 68-76% of the total radioactivity in collards, 19-21 and 58-62% inturnip tops, 1.7-7.8 and 81-90% in turnip roots, 27-34 and 56-65% in wheat grain, and 49-68and 8.1-29% in wheat straw. Three other components were identified as the parent compoundand the ketone and lactone metabolites, none of which accounted for more than 4% of thetotal radioactivity in any of the crops (the highest residue was 0.45 mg/kg fenbuconazole inwheat straw). The distributions of the identified compounds are shown in Table 16 (O’Dowd,1990b; Hawkins, 1992).
Table 15. Distribution of 14C at harvest in rotational crops treated with thiazole-labelledfenbuconazole.
14C, % of TRRSample Days betweenapplication and
plantingEthyl acetate phase Aqueous phase Unextractable
Collards 30 2.3 91.6 6.199 1.0 92.1 6.9365 0.8 91.1 8.1
Turnips 30 3.0/2.7 83.8/91.6 13.2/5.7Tops/Roots 99 1.1/0.7 89.7/96.1 9.2/3.2
365 1.1/0.9 84.9/92.0 14.0/7.1WheatGrain/Straw 30 0.2/9.6 94.8/87.9 5.0/2.5
99 0.3/2.7 94.5/92.2 5.2/5.1365 0.1/4.5 94.5/87.0 5.3/8.5
Table 16. Distribution of identified compounds in residues from treatments with triazole-labelled tebuconazole.
14C, % of TRR and (mg/kg as fenbuconazole)Sample Days betweenapplication and
plantingParent Lactone Ketone TAA TA
Collards 3099
365
0.8 (0.06)--
---
---
4.4 (0.62)18.5 (4.6)14.4 (2.4)
76.0 (5.6)67.7 (17.0)71.4 (12.0)
TurnipsTops 30
99365
1.6 (0.24)--
1.2 (0.17)--
0.4 (0.06)--
18.8 (2.8)21.3 (6.6)19.6 (1.4)
58.3 (8.8)62.4 (19.0)60.7 (4.2)
Roots 3099
365
1.5 (0.08)--
0.4 (0.02)--
---
2.6 (0.13)1.7 (0.31)7.8 (0.37)
83.9 (4.3)89.8 (16.0)80.9 (3.9)
WheatGrain 30
99365
---
---
---
26.8 (7.8)31.8 (39.0)34.2 (15.0)
64.8 (19.0)57.6 (70.0)55.8 (24.0)
Straw 3099
365
3.4 (0.45)-0.2 (0.05)
0.9 (0.11)-0.2 (0.03)
0.5 (0.06)--
55.5 (7.8)68.1 (32.0)49.0 (4.4)
26.0 (3.6)8.1 (3.8)29.2 (2.7)
TAA: triazoleylacetic acidTA: triazolylalanine

fenbuconazole368
Two further studies were carried out with phenyl-labelled fenbuconazole(radiochemical purities >99% and >96%). In one a 3% EC formulation was applied to sandyloam soil at 4 x 0.28 kg ai/ha. Lettuce (Buttercrunch variety), radishes (White icicle), andsorghum (Pioneer 8222) were planted 210 days after treatment and harvested at maturity(lettuce and radishes 291 days, sorghum 399 days after treatment).
In the other trial a 2% EC formulation was applied to sandy loam soil at 3 x 0.07 kgai/ha. Lettuce (Waldmans Greenleaf), carrots (Imperator 58) and barley (BB82-425) wereplanted 35 and 260 days after treatment. Samples of lettuce and barley from the 35-dayplantings were taken 133 days after treatment and the three crops were harvested at maturity:lettuce 210, carrots 288 and barley 253 days after treatment (DAT). Barley planted 260 DATwas sampled immediately after treatment, and all three crops were sampled at maturity: 360DAT for lettuce, 260 DAT for carrots and barley].
All the samples were assayed for 14C after combustion. Those with total radioactiveresidues of >0.01 mg/kg as fenbuconazole were Soxhlet-extracted with methanol andpartitioned with sodium chloride and dichloromethane. After clean-up on silica gel, Florisiland C-18 columns the extracts were analysed by GLC. The analyses revealed no quantifiableresidues of fenbuconazole (one sample of barley forage showed 0.008 mg/kg) or themetabolites RH-9129, RH-9130 and RH-6467. The limits of determination were 0.01 to 0.05mg/kg depending on the sample. The samples were therefore analysed by TLC withradiometric detection and co-chromatography with reference standards. The TLC spots werecharacterized as either “non-polar” (radioactivity in the region of metabolite standards) or“polar” according to their Rf values. The extracts from the above extraction procedure wereradioassayed by LSC, and the crop samples remaining after extraction were radioassayed aftercombustion.
The total radioactive residues and the characteristics of the residue components aregiven in Tables 17 and 18.
Table 17. Radioactive residues from phenyl-labelled fenbuconazole in rotational crops afterapplication to bare soil at 4 x 0.28 kg ai/ha.
Extracted Bound Extracted,
non-polar
Extracted,polar
Sample TRR, mg/kg asfenbuconazole
% mg/kg % mg/kg % mg/kg % mg/kg
Lettuce 0.039 55 0.022 41 0.016 35 0.013 20 0.008
Radish roots 0.008
Radish leaves 0.033 51 0.017 42 0.014 27 0.009 27 0.009
Sorghum forage 0.039 79 0.030 23 0.009 40 0.015 39 0.015
Sorghum grain 0.0047
Sorghum stover 0.033 28 0.009 43 0.017
After application at 4 x 0.28 kg ai/ha the TRR in all samples was below 0.04 mg/kg.The residues in radish roots and sorghum grain were below 0.001 mg/kg, and in lettuce,radish leaves and sorghum forage between 0.03 and 0.04 mg/kg and sorghum stover residuewas 0.033 mg/kg.

fenbuconazole 369
Table 18. Radioactive residues from phenyl-labelled fenbuconazole in rotational crops afterapplication to bare soil at 3 x 0.07 kg ai/ha.
Extracted Bound Extracted,non-polar
Extracted, polarSample TRR, mg/kg asfenbuconazole
% mg/kg % mg/kg % mg/kg % mg/kg35-day plantingLettuce 0.004Carrot root 0.008Carrot leaf 0.008 44 0.004 38 0.003Barley forage 0.016 46 0.007 19 0.003Barley grain1 0.008Barley straw 0.019 52 0.01 16 0.003 38 0.007 14 0.003260-day plantingLettuce 0.009 81 0.007 33 0.003Carrot root 0.005Carrot leaf 0.016 69 0.011 31 0.005 13 0.002 61 0.009Barley forage 0.082 73 0.06 16 0.013 21 0.017 52 0.042Barley grain1 0.033Barley straw 0.162 70 0.113 32 0.051 23 0.037 47 0.075
1 Sample was not sufficient for further analysis
After application at 3 x 0.07 kg ai/ha, the residues in lettuce and carrot roots werebelow 0.01 mg/kg. The TRR in the grain samples was much lower from the 35-day than the260-day planting. The company postulated that this may be because fenbuconazole is nottranslocated well via the roots, whereas degradation products formed in the soil may be takenup by the plants after a planting interval of 260 days. The highest residue found was 0.16mg/kg, in barley straw. Only two samples (barley straw and forage) in the two studies hadresidues above 0.05 mg/kg.
TLC analyses confirmed the GLC results. No individual component was found above0.03 mg/kg equivalents. The non-polar components altogether accounted for 13-38% of theTRR in each sample; the residues were equivalent to 0.002-0.037 mg/kg of fenbuconazole.Another 14-61% of the TRRs was characterized as polar and comprised 2 or 3 components ineach sample, the range of residues being equivalent to 0.003-0.076 mg/kg. No single polarcomponent exceeded 0.029 mg/kg fenbuconazole equivalents. The polar components werethought by the manufacturer to be the glucoase conjugates of RH-4911 (Sharma, 1994b).
The manufacturer has proposed the metabolic pathways for fenbuconazole inrotational crops shown in Figure 6 (Batra, 1997).

fenbuconazole370
Figure 6. Metabolic pathways of fenbuconazole in rotational crops
CN
Cl
O
O
NN
NCl
NN
N COOH
NH2
NNH
N
NN
NCOOH
NN
N COOH
O
O
NN
N
NH
NN
NCl
CN
ClNN
N
OH
CN
ClNN
N
O
NN
N COOH
symmetricaltriazoleacetic acid
benzylic alcohol RH-6648
iminolactones RH-6468
triazolepyruvic acid
ketone RH-6467
triazoleacetic acid RH-4098
triazolealanine RH-3968
1,2,4-triazole RH-0118
lactonesRH-9129 and RH-9130
RH-7592
Environmental fate in soil and water/sediment systems
Degradation on soil
An aerobic degradation study was conducted according to the German BBA guidelines.Triazole-labelled fenbuconazole (0.1 mg/kg dry soil, radiochemical purity 99.1%, specificactivity 835 MBq/g) was added to Itingen III silt loam, Sisseln I sandy loam and Speyer 2.2sandy loam soil (100 g dry weight) at 40% field capacity. Samples of each soil were

fenbuconazole 371
incubated in the dark at 20°C and CO2 and organic volatiles were trapped in NaOH andethylene glycol respectively. Samples were taken after 0, 5, 7, 14, 33, 50, 70 and 96 days andextracted several times with acetonitrile and after the later times also with acetonitrile/water,and subsequently with methanol by Soxhlet. Radioactivity in liquid samples was measureddirectly by LSC, soil extracts were analysed by LSC and TLC and the residual radioactivity inthe soil after extraction was determined by combustion and LSC.
Over the course of the experiment (96 days) the recovered 14C for all the soils wasalways >95% of the applied radioactivity (AR). Volatile compounds were <0.1% of the ARand the evolved 14CO2 increased up to 2.3% of the AR after 96 days (in Sisseln I soil). Up tofive degradation products were observed in each of the three soils during the course of theexperiment but only one was identified, as RH-6467, and constituted <10% of the AR. Oneproduct from the Speyer 2.2 incubation and one from the Sisseln I incubation reached 15% ofthe AR towards the end of the experiment but it is not clear whether this was the samecompound in both cases. No other compound accounted for >10 % of the AR. Unextractableradioactivity reached only 15.1% after 96 days in the Itingen III soil but amounted to 45.5 and36.3% in the Sisseln I and Speyer 2.2 soils respectively. This was consistent with the half-lives where first order kinetics gave 269 (r²=0.79), 38 (r²=0.93) and 74 (r²=0.96) days forItingen III, Sisseln I and Speyer 2.2 respectively (Mamouni, 1992).
A second aerobic and anaerobic degradation study was conducted according to USEPA guidelines. [14C]Fenbuconazole (radiochemical purity 98 or 98.6%, specific activity 771or 775 MBq/g) labelled in the phenyl or triazole ring was added to Lawrenceville silty clayloam (200 g, moisture content 15%) or Pasquotank sandy loam (200 g, moisture content 20%)in cellulose at a rate of 1 mg/kg (and at 30 mg/kg to identify degradation products). Somesamples were sterilized and all were incubated in the dark at 25°C. After 30 days somesamples were purged with nitrogen and then flooded with water to provide anaerobicconditions. CO2 evolved from samples under aerobic conditions was trapped in NaOH.Samples of soil (10 g) incubated under aerobic conditions were taken after 7, 14, 21, 28, 44,61, 90, 120, 181, 240 and 363 days, and 25-ml samples of slurry were taken 17, 30 and 60days after the establishment of anaerobic conditions. The samples were extracted withacetonitrile/acetic acid and after later times with NaOH (the anaerobic slurry was first filteredand dried) and analysed by TLC. Overall radioactivity balances were generally 90-105%during the experiment.
The products RH-9129, RH-9130 and RH-6467 were confirmed by TLC, HPLC andGC-MS as present in both the aerobic and anaerobic incubations with both labels. In theaerobic incubations the concentrations of RH-9129, RH-9130 and RH-6467 reached maximaof <10%, <4.5% and <7.9% respectively. In the aerobic incubations with the triazole labelfree triazole was also identified at levels up to 13.6%. Levels of 14CO2 reached 1.5% from thetriazole label and 37% from the phenyl label after 365 days. Apart from this there was nodifference between the two label positions and both were used to calculate half-lives forfenbuconazole, assuming first-order kinetics. They were as shown below.
Lawrenceville(silty clay loam)
Pasquotank(sandy loam)
Aerobic conditions 258 days 367 daysAnaerobic conditions 464 days 655 days
No degradation was observed under sterile conditions during the 363 days of the study(Schieber, 1988a).
In a photolysis study according to US EPA guidelines phenyl-labelled fenbuconazole(10 mg/kg, specific activity 753 MBq/g, 96.2% pure) was applied to the surface of a Camdencounty sandy loam soil layer (2 g) which was maintained at 26°C and irradiated with a xenon

fenbuconazole372
lamp (approx. 150 W/m², of similar intensity to sunlight in New Jersey) for periods of 12 hfollowed by 12 h darkness for 30 days. Volatile compounds were trapped with polyurethaneplugs, KOH and sulfuric acid. Duplicate soil samples were extracted with acetonitrile/aceticacid after 0, 3, 7, 14, 21, 30 days and the extracts analysed by TLC. After extraction the soilwas combusted and the unextracted radioactivity quantified by TLC. At all sampling times theoverall recovery of radioactivity was >90%.
The levels of trapped volatiles reached 0.02% after 30 days, at which time theunextractable radioactivity reached its maximum of 4%. Fenbuconazole was the onlycompound identified in the extract and had a half-life of 79 days according to first orderkinetics. No degradation observed in the dark control (Wang, 1991a).
Adsorption and desorption
In a study according to US EPA guidelines triazole-labelled fenbuconazole (specific activity775 MBq/g, purity 98%) was dissolved in 0.01M CaCl2 (0.33, 0.22, 0.11 and 0.03 µg/l) and10-40 ml aliquots were added in duplicate to five different soils (2-2.5 g). The soils wereequilibrated for 24 h at 25°C. After centrifugation the supernatant was removed anddesorption was measured by equilibrating the soil with fresh 0.01M CaCl2 (10-40 ml) for 72h. The 14C in the solutions was quantified by LSC and that in the soils by combustion andLSC. TLC analysis of the solutions showed that fenbuconazole was the only source ofradioactivity. The results are shown in Table 19 (Schieber, 1988c).
Table 19 Freundlich adsorption/desorption coefficients for fenbuconazole in five soils.
Adsorption Desorptionn1 Kd Koc n Kd Koc
Cecil (clay) 0.93 5.1 2185 0.95 7.1 3087Keeton (loam) 1.01 75.2 5402 1.01 147.7 10625Lakeland (sand) 1.22 7.6 2607 0.93 2.3 793Pasquotank (sandy loam) 1.00 115.4 9042 0.96 132.2 10328Lawrenceville (silty clay loam) 0.85 20.1 2884 0.87 33.0 4714
1 Slope of Freundlich adsorption isotherm
Mobility in soil
In a study according to US EPA guidelines Pasquotank sandy loam soil was treated withtriazole- or phenyl-labelled fenbuconazole (1 mg/kg, specific activity 775 or 771 MBq/g,purity 98%) and aerobically aged at 25 °C for 30 days. At this time <1% of the AR had beenlost as 14CO2 and >90% was fenbuconazole. Duplicate columns, 5.5 cm diameter, were filledto a height of 30 cm with untreated Pasquotank soil, wetted from the bottom until saturatedand allowed to drain overnight. Aged treated soil (40 g) was added and the columns wereleached for 7-14 days with 1000 ml water (42 cm depth). The leachate was assayed forradioactivity by LSC and the soil column divided into segments, extracted withacetonitrile/acetic acid and analysed by LSC and TLC.
The average 14C balance at the end of the leaching was 98%. Radioactivity in theleachate accounted for 0.2% of the AR and the leachate was not analysed further. About 97%of the radiolabel was located on the top 6 cm segment of the column and was almost all due tofenbuconazole; trace amounts of RH-9129, RH-9130 and RH-6467 were also identified(Schieber, 1988b)
In a study according to German BBA guidelines sieved air-dried German standardsoils (2.1, 2.2 and 2.3) were used to fill duplicate glass columns (5 cm diameter) to a height of30 cm. The soils were saturated from the top and fenbuconazole (15 µg) was added after

fenbuconazole 373
draining. Water (393 ml, equivalent to 200 mm depth) was passed through the columns fortwo days and the leachate collected. The leachate was analysed by GLC (recovery 76%, limitof detection 0.75 µg/l) but no fenbuconazole was detected in any sample (Specht, 1992).
Soil dissipation under field conditions
In a study conducted according to German BBA guidelines fenbuconazole (75 g/ha) wassprayed onto bare soil plots (5 m x 5 m) at four sites in Northern Germany (Klein-Offenseth,Bad Oldesloe, Hamburg and Walsrode) in April 1989. Samples (20 per plot) taken to a depthof 15 cm were bulked at 0, 7, 28, 56, 112, 224, 365 and 504 days after application. The soilswere extracted with methanol and after clean-up the extracts were analysed by GLC. Thelimit of detection was 0.01 mg/kg. In the Bad Oldesloe soil RH-9129 was identified after 8weeks at 5 µg/kg dry soil, but at no other time was RH-9129, RH-9130 or RH-6467detectable.
Table 20. Fenbuconazole concentrations in German soils at intervals after field application.
Fenbuconazole, mg/kg dry soilDays after application
Bad Oldesloe Klein-Offenseth Walsrode Hamburg
Before application nd nd nd nd
0 45 29 30 65
7 42 38 34 23
48 22 16 17 17
56 26 19 19 8
112 13 15 11 11
224 9 7 18 19
365 5 6 16 15
504 10 1 15 13
Graphically estimated half-lives for fenbuconazole in these soils were approximately56, 70, 84 and 28 days. Weather conditions were generally within the 30 year maxima andminima for monthly temperature and precipitation (Bieber et al., 1990).
In a study according to EPA guidelines undertaken at four US locationsfenbuconazole was applied twice or five times. At Minnesota (loamy soil) 2 x 0.14 kg/hawere applied to bare soil on 14 and 31 May 1990. At Georgia (loamy sand) 2 x 0.14 kg/hawere applied to bare soil on 19 July and 2 August 1989. At the Northern California site (clay)5 x 0.22 kg/ha were applied to bare soil on 7 and 21 August, 5 and 21 September and 5October 1989. At the Southern California site (sandy loam, 5 x 0.22 kg/ha) were applied towheat on 1, 15 and 29 August and 12 and 26 September.
At all sites there were three treated plots and one control plot (30 x 6 m). Sampleswere taken at 0, 14, 30, 60, 90, 120, 150, 180, 210, 240, 300, 360, 420, 510 and 550 days afterthe last application. Five samples were taken from the control and each treated plot, dividedinto 0-15, 15-30, 30-45, 45-60, 60-90 and 90-120 cm sections, (0-7.5 and 7.5-15 cm inMinnesota) and composited. The soils were extracted with methanol and the residuesdetermined by GLC with a quoted limit of determination of 0.01 mg/kg and recoveries of>90%. The residues found are shown graphically in Figure 7, and the calculated DT-50 andDT-90 values in Table 21.

fenbuconazole374
Figure 7. Concentrations of fenbuconazole in 0-15 cm soil layers (USA, 1989-90).
Time (day)
Con
cent
ratio
n (m
g/kg
)
0
0.1
0.2
0.3
0 200 400 600
Minnesota
Georgia
N. California
S. California
Table 21. DT-50 and DT-90 values for fenbuconazole in 0-15 cm soil layers.
Location DT-50, days DT-90, days
Minnesota 30 >364
Georgia 10 360
N. California 425 >550
S. California 200 >545
RH-9130, RH-9129 and RH-6467 were consistently found in the 0-15 cm layer up tothe end of sampling in Southern California at levels up to 0.01, 0.031 and 0.016 mg/kgrespectively. RH-9129 was found consistently, but at lower levels, in Northern Californiawhere fenbuconazole was regularly found at 15-30 cm at varying concentrations up to 0.021mg/kg throughout the trial. In the trials in Georgia and Minnesota fenbuconazole was notidentified below 15 cm and no degradation products were detected at any depth. The soiltemperatures were recorded and are shown in Table 22.
Table 22. Soil temperatures at 5 cm depth averaged over 60-day periods in the US trials.
Soil temperature, °CLocation
0-60 days 60-120 days 120-180 days 180-240 days 240-300 days
Minnesota 23.3 21.9 5.7 -2.8 -2.41
Georgia2 30.6 19.4 10.6 16.7 24.4
N. California 12 7.2 10.9 19.7 22.91
S. California 16.5 7.7 12.2 22.2 35.8
1Temperatures at 10 cm depth2Days 240-270 only
No evaporation data were available for the Georgia site but data for the other sitesindicated that the only net downward flow of water would be in the 60-120 day period in boththe California trials and the 180-270 day period in the Minnesota trial (Deakyne andStavinski, 1991)
In another study according to EPA guidelines by the same authors fenbuconazole wasapplied at 0.28 or 1.12 kg/ha to bare plots of 5 x 20 m in Southern California (the samelocation as above) on 16 May 1991, with a control plot of the same size. Five samples from
fenbuconazole 375
each plot taken at 0, 14, 29, 60, 90, 120, 151, 180, 210, 239, 300 and 362 days were dividedinto 0-15 or 0-7.5 and 7.5-15 cm depth segments and the corresponding groups of segmentsbulked. The samples were analysed for fenbuconazole, RH-9130, RH-9129 and RH-6467 asin the previous study. Recoveries were >88% with a limit of determination of 0.01 mg/kg.
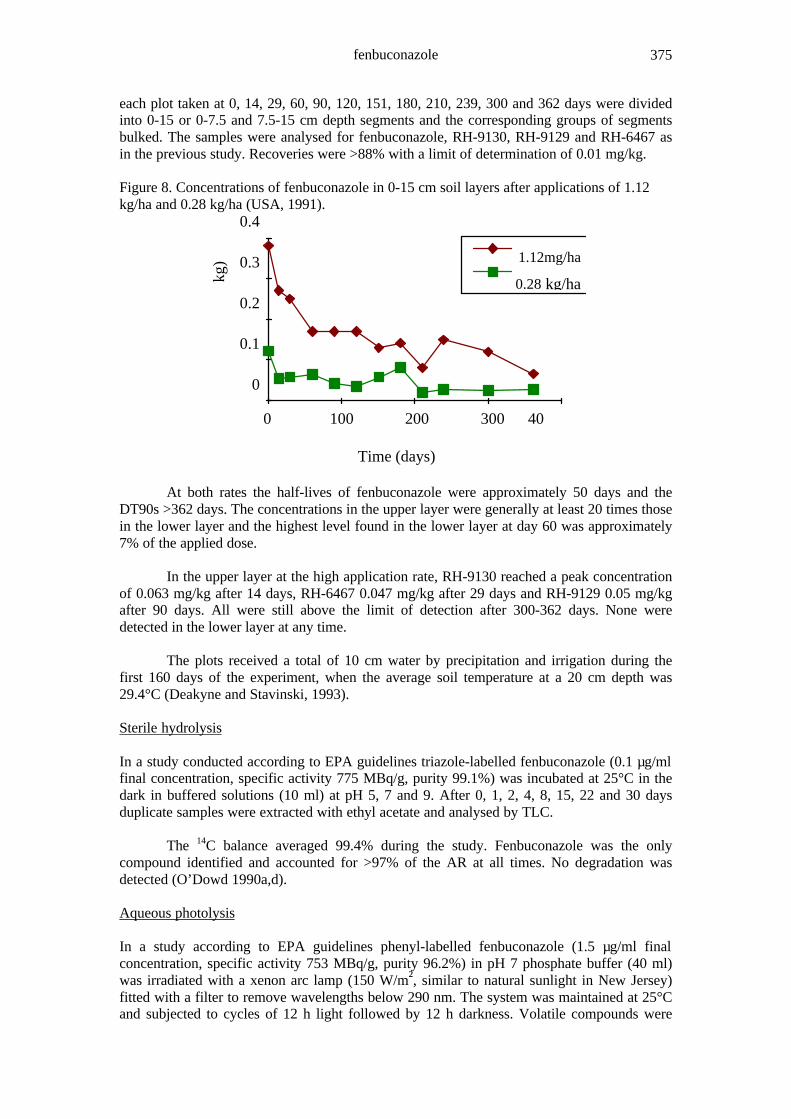
Figure 8. Concentrations of fenbuconazole in 0-15 cm soil layers after applications of 1.12kg/ha and 0.28 kg/ha (USA, 1991).
Time (days)
kg)
0
0.1
0.2
0.3
0.4
0 100 200 300 40
1.12mg/ha
0.28 kg/ha
At both rates the half-lives of fenbuconazole were approximately 50 days and theDT90s >362 days. The concentrations in the upper layer were generally at least 20 times thosein the lower layer and the highest level found in the lower layer at day 60 was approximately7% of the applied dose.
In the upper layer at the high application rate, RH-9130 reached a peak concentrationof 0.063 mg/kg after 14 days, RH-6467 0.047 mg/kg after 29 days and RH-9129 0.05 mg/kgafter 90 days. All were still above the limit of detection after 300-362 days. None weredetected in the lower layer at any time.
The plots received a total of 10 cm water by precipitation and irrigation during thefirst 160 days of the experiment, when the average soil temperature at a 20 cm depth was29.4°C (Deakyne and Stavinski, 1993).
Sterile hydrolysis
In a study conducted according to EPA guidelines triazole-labelled fenbuconazole (0.1 µg/mlfinal concentration, specific activity 775 MBq/g, purity 99.1%) was incubated at 25°C in thedark in buffered solutions (10 ml) at pH 5, 7 and 9. After 0, 1, 2, 4, 8, 15, 22 and 30 daysduplicate samples were extracted with ethyl acetate and analysed by TLC.
The 14C balance averaged 99.4% during the study. Fenbuconazole was the onlycompound identified and accounted for >97% of the AR at all times. No degradation wasdetected (O’Dowd 1990a,d).
Aqueous photolysis
In a study according to EPA guidelines phenyl-labelled fenbuconazole (1.5 µg/ml finalconcentration, specific activity 753 MBq/g, purity 96.2%) in pH 7 phosphate buffer (40 ml)was irradiated with a xenon arc lamp (150 W/m², similar to natural sunlight in New Jersey)fitted with a filter to remove wavelengths below 290 nm. The system was maintained at 25°Cand subjected to cycles of 12 h light followed by 12 h darkness. Volatile compounds were

fenbuconazole376
trapped and duplicate samples were taken at 0, 3, 7, 14, 21 and 30 days, extracted with ethylacetate and analysed by TLC or HPLC. The overall 14C balance averaged 105% of the AR andthe only compound detected was fenbuconazole (always >99% of the AR over the 30-dayperiod). At no time was radioactivity detectable in the traps. Dark controls also showed nodegradation (Wang, 1991b).
The photolysis of triazole-labelled fenbuconazole (>99% radiochemical purity, 1.5mg/l) was also examined in natural pond water. It was moderately unstable in the presence ofsimulated sunlight (xenon arc lamp) at 24.1+0.6°C. Irradiation was intermittent with light anddark cycles of 12 hours each day for 30 days. Samples were taken at 0, 3, 7, 14, 21, and 30days and analysed by solvent-solvent extraction, LSC, TLC, and HPLC with radiometricdetection. Overall recoveries were high at 101-107% from the irradiated samples and 104-109% from the control samples. In addition to fenbuconazole, which accounted for 75-94% ofthe total applied radioactivity after 30 days of irradiation, at least eight photodegradationproducts were detected but none exceeded 10% of the TRR. Radioactivity in water-solublecompounds gradually increased with time, reaching about 18% of the applied radioactivity atday 30. Less than 0.1% of the applied radioactivity was volatile. The identified productsincluded RH-6467 (2.8%), triazole (3.3%) and RH-1311 (2.7%). A mixture of polarcompounds totalling 17.9% was stated to be an artifact of the co-solvent used in the samplepreparation. Assuming pseudo-first-order kinetics, the half-life of fenbuconazole under thetest conditions was calculated to be 86.7 days (Baur, 1994).
Sediment/water systems
In a study conducted according to BBA guidelines Rhine and pond systems containing water(550 ml, approximately 6 cm depth) and sediment (250 g, approximately 2.5 cm depth) wereallowed to equilibrate for approximately 20 days. Triazole-labelled fenbuconazole (0.13 or0.0134 mg, specific activity 835 MBq/g, purity 97.3%) was then added and traps for volatilecompounds were connected to the flasks (NaOH solution to trap CO2, ethylene glycol to traporganic volatiles). The flasks were incubated in the dark at 20°C while CO2-free air wascontinuously passed through and the water phase was agitated. Duplicate samples of waterand sediment were taken at 0, 7, 30, 62 and 105 days, and from the higher rate systems also at6 h, 1, 2 and 14 days. Water samples were passed through solid-phase extraction columns foranalyses by HPLC. Sediment samples were extracted with acetonitrile/acetic acid and theextracts analysed by TLC. After extraction, soil was combusted to determine theunextractable radioactivity.
At all time intervals the total 14C balance for both systems and both rates was >93%.There was very little difference between the results from the high and low rates and onlyresults at the high rate are reported here. Volatile compounds accounted for 0.1% of the AR)and evolved 14CO2 reached 0.3% after 105 days. Unextractable residues reached 6.6 and 12%of the AR after 105 days in the Rhine and pond sediments respectively. In both systemsfenbuconazole was the major source of the radioactivity in the water and sediment and onlyvery small amounts of other unidentified compounds were detected in either system (<0.7% inwater, <4% in sediment). The fenbuconazole partitioned from the water to the sediment with acalculated first-order dissipation half-life from the water phase of 3.4 and 1.2 days in theRhine and pond systems respectively and after 105 days the fenbuconazole in the sedimentaccounted for 79.4% of the AR in the Rhine system and 80.3% in the pond system (Volkl,1992).
Biodegradability
In a study conducted according to OECD guidelines standard BOD bottles filled with nutrientmedium (280 ml, containing inorganic salts), activated sludge bacterial inoculum andfenbuconazole (2 mg/l, 94-99.5% purity) were incubated in the dark at 20°C, together with

fenbuconazole 377
negative and positive controls. Duplicate bottles were analysed for dissolved oxygen at days0, 5, 15, and 28. The chemical oxygen demand (COD) was determined by sample digestion.After 28 days the degradation was 17%. The manufacturer has proposed the degradationpathways for fenbuconazole in soil shown in Figure 9 (Costlow, 1997a; Douglas,1990).
Figure 9. Degradation pathways of fenbuconazole in soil.
CN
Cl
O
O
NN
NCl
NNH
N
O
NN
N
NH
NN
NCl
CN
ClNN
N
OH
CN
ClNN
N
O
RH-7592
RH-9129RH-9130
RH-0118
RH-6468
RH-6467
CO2
A number of studies on bioaccumulation in fish were also submitted but notreviewed (Forbis 1987; O’Dowd 1988, 1990c).

fenbuconazole378
The names and structures of fenbuconazole and its degradation products andmetabolites are given in Table 23.
Table 23. Names and structures of fenbuconazole and its degradation products andmetabolites.
Table 23. Names and structures of fenbuconazole and its degradation products andmetabolites.
Number Structure Name (code name/chemical name)
Occurrence
1N
NN
CN
Cl
fenbuconazole(RH-7592)
Soil, wheat, peach,peanut, rotationcrops, hen, goat,fish, rat
2 CN
N N
N
Cl
O
ketone(RH-6467)
Soil, wheat, peanut,rotation crops, fish,rat
3N
NN
O
O
Cl
lactone A(RH-9129)
Soil, wheat, peach,peanut, rotationcrops, hen, goat,fish, rat
4
O
N
N
N
O
Cl
lactone B(RH-9130)
Soil, rotation crops,hen, goat, rat
5
NNH
Ntriazole(RH-0118)
Soil, hen, goat, rat
6
NN
NCOOH
NH2
triazolylalanine(RH-3968)
Wheat, peach,peanut, rotationcrops, hen, goat

fenbuconazole 379
Number Structure Name (code name/chemical name)
Occurrence
7
NN
N
COOH
triazol-1-ylacetic acid(TAA, RH-4098)
Wheat, peach,peanut, rotationcrops
8
NN
NCOOH
O
triazolylpyruvic acid Peach
9
N
NN COOHtriazol-4-ylacetic acidsymmetrical TAA
Rotational crops
10CN
NN
N
OSO3H
Cl
benzylic sulfates(RH-6649)
Hen, goat, fish, rat
11CN
NN
N
Cl
OGluCO2Hbenzylic glucuronides Hen, goat, fish, rat
12
Cl
NH
N
N
N
O
iminolactones(RH-6468)
Peanut, hen, goat, rat
13CN
N N
N
Cl
OH
4-chloro-3-hydroxyphenyl derivative(RH-4911)
Rat
14
O
HOHO
HO OClHO
NCN
NN
glucoside of RH-4911 Wheat, peach,peanut

fenbuconazole380
Number Structure Name (code name/chemical name)
Occurrence
15
O
HOHO
HO OCl
O OH
O O
NCN
NN
malonylglucoside of RH-4911
Wheat, peach,peanut
16
Cl
CN
HO
intermediate I(RH-7968)
Hen, goat
17 CN
N N
N
Cl
HO
4-phenol(RH-1311)
Hen, goat, rat
18
NN
N
CO2H
Cl
Oketo acid(RH-1745)
Hen, goat, rat
19
HO
CN
N N
N
Cl
benzylic alcohols(RH-6648)
Goat, rat
20
Cl
CN
NN
N
HO3-phenol Rat

fenbuconazole 381
Number Structure Name (code name/chemical name)
Occurrence
21
O
O
Cl
NN
N
HO
phenol lactone Rat
22HO2CGluO
Cl
CN
NN
N
HO3SO
Cl
CN
NN
N
phenol conjugates Rat
23
O
O
ClN
N
N
HO3SO
NN
N
O
O
Cl
HO2CGluO
phenol lactoneconjugates
Rat
24
ClN
N
N
O
OH
unsaturated keto m-chlorophenol
Rat
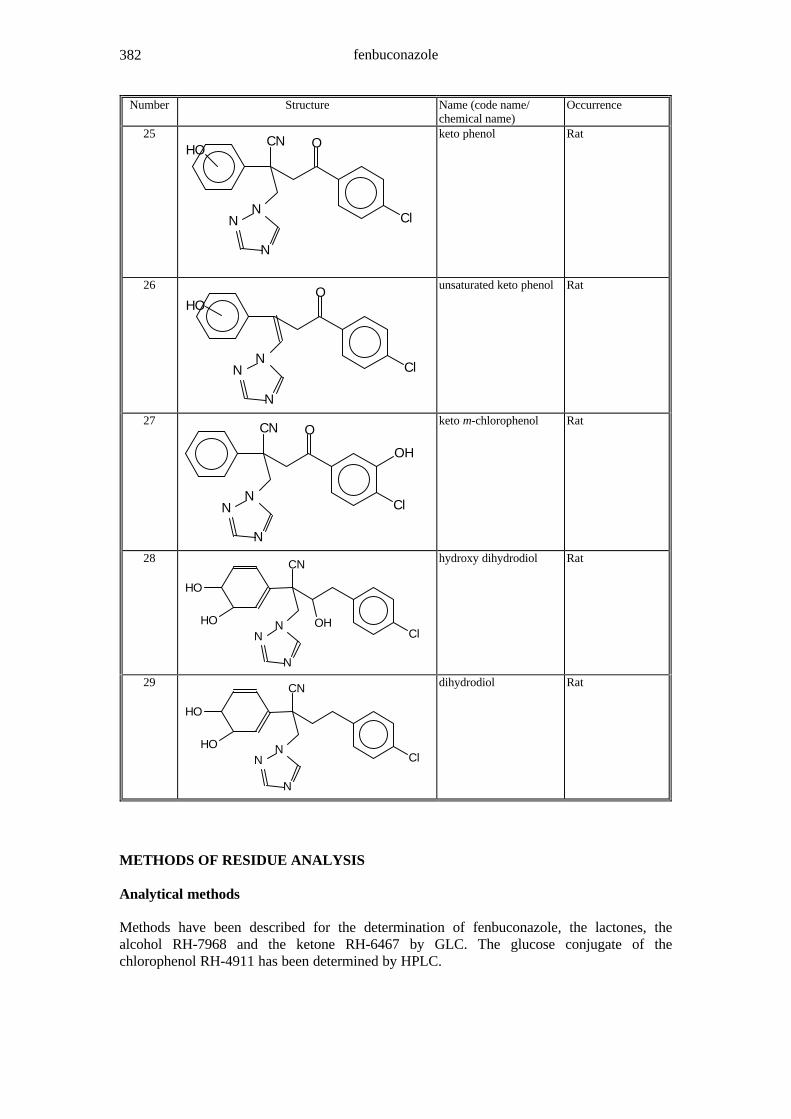
fenbuconazole382
Number Structure Name (code name/chemical name)
Occurrence
25
ClN
N
N
OCNHO
keto phenol Rat
26
ClN
N
N
OHO
unsaturated keto phenol Rat
27
ClN
N
N
O
OH
CNketo m-chlorophenol Rat
28
OH
CN
NN
N
Cl
HO
HO
hydroxy dihydrodiol Rat
29 CN
NN
N
Cl
HO
HO
dihydrodiol Rat
METHODS OF RESIDUE ANALYSIS
Analytical methods
Methods have been described for the determination of fenbuconazole, the lactones, thealcohol RH-7968 and the ketone RH-6467 by GLC. The glucose conjugate of thechlorophenol RH-4911 has been determined by HPLC.

fenbuconazole 383
Animal products
a) Several studies were submitted, all with the same method for the determination offenbuconazole, the lactones and 4-(4-chlorophenyl)-2-hydroxymethyl-2-phenylbutyronitrile(RH-7968) in meat, fat, milk and eggs. Samples (apparently from goats and hens, althoughthis was not clear) were first homogenised and then extracted by blending with methanol(hexane for fat). The extract was partitioned with hexane/water (methanol/water for fat). Afteradding 10% sodium chloride, the aqueous layer was partitioned with dichloromethane, thedichloromethane extract evaporated to dryness and the residual material dissolved in toluenefor clean-up and separation on a silica gel column. The first eluate containing RH-7968 wasfurther cleaned up on a Florisil column, and the second fraction containing the parentcompound and the lactones on a C-18 solid-phase extraction column. The separate fractionswere analysed by capillary GLC with NP detection. The limit of determination was 0.01mg/kg for fenbuconazole and the lactones and 0.05 mg/kg for RH-7968. Acceptablerecoveries were demonstrated at fortification levels of 0.02-0.2 mg/kg (0.06-0.6 mg/kg forRH-7968). Recoveries were higher (124-138%) at the lowest fortification level of 0.01 mg/kg.Acceptable chromatograms were submitted (Filchner et al., 1992,1994a; Haines et al., 1992).
The results of validation experiments are shown in Table 24.
Table 24. Validation of residue method a) for products of animal origin.
Substrate Analyte Recovery, % Limit of determination,mg/kg
Milk fenbuconazole 94 (mean) 0.01
lactones 92 (mean) 0.01
RH-7968 0.05
Muscle fenbuconazole 98 (mean) 0.01
lactones 95 (mean) 0.01
RH-7968 0.05
Liver fenbuconazole 103 (mean) 0.01
lactones 102 (mean) 0.01
RH-7968 79 (mean) 0.05
Kidneys fenbuconazole 82 (mean) 0.01
lactones 84 (mean) 0.01
RH-7968 85 (mean) 0.05
Fat fenbuconazole 104 (mean) 0.01
lactones 107 (mean) 0.01
RH-7968 106 (mean) 0.05
Egg fenbuconazole 95 (mean) 0.01
lactones 96 (mean) 0.01
RH-7968 0.05
Milk fenbuconazole 80-114 0.01
RH-9130 74-113 0.01
RH-9129 75-116, 142 0.01
Egg fenbuconazole 84-138 0.01
RH-9130 85-128 0.01
RH-9129 83-124 0.01

fenbuconazole384
Some additional recoveries by method a) were reported for cow and hen tissues.Fortification levels were 0.01 to 0.05 mg/kg. The results are shown in Table 25 (Stavinski,1994a).
Table 25. Recoveries of fenbuconazole and the lactones from cow and hen tissues. Limit ofdetermination 0.01 mg/kg for all samples.
Recovery, %
Fortification level
Substrate Analyte
0.01 mg/kg 0.02 mg/kg 0.05 mg/kg
Cow muscle fenbuconazole 103-113 97-104 90-93
RH-9130 106-131 96-102 92-96
RH-9129 92-117 102-113 93-101
Cow liver fenbuconazole 97-108 99-140 92-102
RH-9130 92-108 83-101 93-100
RH-9129 84-102 93-96 88-92
Cow kidney fenbuconazole 83-100 82-110 81-94
RH-9130 89-116 88-113 85-100
RH-9129 93-138 90-114 98-101
Cow fat fenbuconazole 31-99 50-92 58-90
RH-9130 83-117 55-100 56-116
RH-9129 56-114 65-94 62-116
Hen muscle fenbuconazole 93-120 80-117 88-97
RH-9130 112-155 87-119 90-100
RH-9129 109-166 84-120 92-96
Hen liver fenbuconazole 98-108 90-111 90-106
RH-9130 103-137 93-139 98-105
RH-9129 91-112 93-109 92-102
Hen fat fenbuconazole 110-128 103-112 96-104
RH-9130 110-131 105-114 100-110
RH-9129 101-125 108-115 101-107
In a study by Sharma and Robinson (1996) samples of liver and fat from a goatmetabolism study were analysed both by method a) and by TLC with radiometric detection.The results were well correlated indicating that method a) adequately extracts and quantifiesthe residues. The results are summarized in Table 26.
Table 26. Comparison of analyses of liver and fat by radio-TLC and analytical method a).
Residues, mg/kg
Liver Fat
Analyte
Analyses by
radio-TLC
Analyses by
method a)1
Analyses by
radio-TLC
Analyses by
method a)1
Fenbuconazole 1.43 1.09 0.17 0.13
RH-7968 0.05 0.03 0.04 0.04
RH-9129 0.18 0.26 0.11 0.04
RH-9130 0.44 0.24 0.04 0.02

fenbuconazole 385
Residues, mg/kg
Liver Fat
Analyte
Analyses by
radio-TLC
Analyses by
method a)1
Analyses by
radio-TLC
Analyses by
method a)1
RH-6468 0.12 quantified as RH-9129/RH-9130
not detected Quantified as RH-9129/RH-9130
Sum of RH-9129, RH-9130, and RH-6468
0.74 0.50 0.16 0.05
1Means of triplicate analyses, except RH-7968
Plant commodities
Several minor variants of a basic method have been described for individual commodities.Most of the commodities in the supervised trials were analysed by a method validated forstone fruit or one for almonds.
b) This method was developed for the determination of fenbuconazole and the lactones RH-9129 and RH-9130 in stone fruit but was used for all the fruit and vegetables in the supervisedtrials except sugar beet. Fenbuconazole is extracted with methanol and partitioned withsodium chloride and dichloromethane. The dichloromethane is evaporated and the sampleredissolved in toluene/acetone and cleaned up by silica gel and Florisil chromatographybefore analysis by GLC with NP detection. The linearity of response and samplechromatograms was acceptable. The limit of determination was 0.01 mg/kg. The recoveriesare shown in Table 27 (Martin, 1998a, 1990, 1993a). A confirmatory method, with GLC on adifferent column, has been validated for stone fruit by Burnett (1991i).
Table 27. Recoveries of fenbuconazole and lactones from stone fruit.
Sample Fortification, mg/kg Recovery, % No Reference
Peaches/fenbuconazole 0.04 81 1 Martin, 1988a
0.08 78 1
0.10 82, 114 2
0.20 75-101 4
0.40 62-116 4
0.65 115 1
0.80 94 1
1.0 95-103 3
1.6 94 1
Cherries/fenbuconazole 0.10 110 1
0.20 84, 94 2
0.30 95-109 3
0.40 92 1
0.45 75 1
0.50 85, 92 2
Plums/fenbuconazole 0.01 75-93 3
0.10 93-97 3
0.20 94 1
0.50 91 1
Cherries/fenbuconazole 0.01 93, 100 2 Martin, 1990, 1993a
0.04 91 1
0.08 95 1

fenbuconazole386
Sample Fortification, mg/kg Recovery, % No Reference
0.10 87 1
0.40 84 1
2.0 90 1
3.0 78, 83 2
4.0 93 1
Cherries/RH-9130 0.01 88, 99 2
0.04 90 1
0.08 90 1
0.10 85 1
0.40 93 1
2.0 95 1
3.0 81, 83 2
4.0 98 1
Cherries/RH-9129 0.01 86, 94 2
0.04 77 1
0.08 88 1
0.10 74 1
0.40 90 1
2.0 87 1
3.0 60, 71 2
4.0 85 1
c) This method has been validated for the determination of fenbuconazole and the lactonesRH-9129 and RH-9130 in almonds, but also applied to fruits, vegetables, cereals and oilseedin the supervised trials. Almond hulls are Soxhlet-extracted with methanol, and kernels withtoluene/methanol. The analysis is completed as above, except that clean-up on a C-18 columnis included. Recoveries, linearity of response and sample chromatograms were acceptable.The limit of determination in almonds was 0.01 mg/kg for all the analytes. Recoveries areshown in Table 28 (Ross, 1996).
Table 28. Recoveries of fenbuconazole and lactones from almonds (Ross, 1996).
Sample/analyte Fortification, mg/kg Recovery, % No.
Hull/fenbuconazole 0.01 86 1
Nut/fenbuconazole 0.01 82, 86 2
Hull/fenbuconazole 0.02 97, 101 2
Kernel/fenbuconazole 0.05 103 1
Hull/fenbuconazole 0.10 90-105 3
Kernel/fenbuconazole 0.10 94, 112 2
Nut/fenbuconazole 0.25 104 1
Hull/fenbuconazole 0.25 102, 107 2
Nut/fenbuconazole 0.5 99 1
Hull/fenbuconazole 0.5 96, 107 2
Kernel/fenbuconazole 1.0 103 1
Hull/fenbuconazole 1.0 72 1
Hull/RH-9129 0.01 125 1
Nut/ RH-9129 0.01 75 1
Hull/ RH-9129 0.02 97, 98 2

fenbuconazole 387
Sample/analyte Fortification, mg/kg Recovery, % No.
Kernel/ RH-9129 0.05 103 1
Hull/ RH-9129 0.10 93-107 3
Kernel/ RH-9129 0.10 105, 115 2
Hull/ RH-9129 0.25 105, 110 2
Kernel/ RH-9129 0.5 97 1
Hull/ RH-9129 0.5 99, 108 2
Kernel/ RH-9129 1.0 107 1
Hull/ RH-9129 1.0 78 1
Hull/RH-9130 0.01 107 1
Nut/ RH-9130 0.01 77, 83 2
Hull/ RH-9130 0.02 76, 97 2
Kernel/ RH-9130 0.05 108 1
Hull/ RH-9130 0.10 97-102 3
Kernel/ RH-9130 0.10 93, 105 2
Nut/ RH-9130 0.25 105 1
Hull/ RH-9130 0.25 100, 109 2
Nut/ RH-9130 0.5 99 1
Hull/ RH-9130 0.5 93, 109 2
Kernel/ RH-9130 0.5 93 1
Kernel/ RH-9130 1.0 96 1
Hull/ RH-9130 1.0 72 1
The same method (Ross, 1996) has been validated for the determination offenbuconazole, the lactones, and the ketone RH-6467 in wheat. It was also applied to sugarbeet and oilseed in the supervised trials. The limit of determination for all the analytes was0.05 mg/kg in straw and 0.01 mg/kg in grain. The recoveries are shown in Table 29. Theidentities of the analytes were confirmed by GLC on a different column (Burnett et al.,1994a,b; Martin, 1991c).
Table 29. Recoveries of fenbuconazole, RH-9129, RH-9130 and RH-6467 from wheat(Burnett et al., 1994a,b; Martin, 1991c).
Sample/analyte Fortification, mg/kg Recovery-% No. Reference
Grain/fenbuconazole 0.01 77-106 3 Burnett et al., 1994a
0.02 63-101 4
0.03 69-81 3
0.04 78 1
0.05 68-104 6
0.10 90-106 6
Grain/RH-9130 0.01 92-101 3
0.02 68-110 4
0.03 74-83 3
0.04 81 1
0.05 70-106 6
0.10 92-109 6
Grain/RH-9129 0.01 75-96 3
0.02 63-103 4
0.03 69-73 3

fenbuconazole388
Sample/analyte Fortification, mg/kg Recovery-% No. Reference
0.04 72 1
0.05 66-106 6
0.10 80-108 6
Grain/RH-6467 0.01 79-111 3
0.02 73-118 4
0.03 80-94 3
0.04 91 1
0.05 72-112 6
0.10 83-117 6
Straw/fenbuconazole 0.05 80-91 6
0.10 66-109 3
0.20 70-93 4
0.50 82-109 7
1.0 79-99 4
2.0 89-113 5
Straw/RH-9130 0.05 79-92 6
0.10 67-101 3
0.20 82-102 4
0.50 76-109 7
1.0 79-90 4
2.0 89-113 5
Straw/RH-9129 0.05 79-96 6
0.10 69-100 3
0.20 85-95 4
0.50 77-123 7
1.0 75-92 4
2.0 93-114 5
Straw/RH-6467 0.05 81-94 6
0.10 62-112 3
0.20 78-115 4
0.50 78-114 7
1.0 79-92 4
2.0 89-122 5
Straw/fenbuconazole 1.0 78-100 4 Burnett et al., 1994b
5.0 88-99 3
10.0 80-108 6
15.0 79-114 6
Straw/RH-9130 1.0 79-97 4
5.0 92-98 3
10.0 78-107 6
15.0 77-114 6
Straw/RH-9129 1.0 81-100 4
5.0 79-93 3
10.0 74-109 6
15.0 81-114 6
Straw/RH-6467 1.0 75-93 4
5.0 82-88 3
10.0 56-94 6

fenbuconazole 389
Sample/analyte Fortification, mg/kg Recovery-% No. Reference
15.0 60-106 6
d) A method developed for the determination of the same compounds in pecans was identicalexcept that samples were Soxhlet-extracted with hexane/2-propanol and concentrated to anoily residue before dissolution in toluene/acetone. The limit of determination was 0.01 mg/kgfor all the analytes with the recoveries shown in Table 30 (Martin, 1991a,b; Wu, 1994). Aconfirmatory procedure, with GLC on a different column has been validated (Burnett, 1991i).
Table 30. Recoveries of fenbuconazole, the lactones and the ketone from pecans.
Compound Fortification, mg/kg Mean (+sd) Recovery,-% No.
fenbuconazole 0.01 85 (21) 49-104 7
0.02 98 (8) 84-108 6
0.04 92 (19) 70-122 8
RH-9130 0.01 91 (26) 55-123 7
0.02 101 (14) 75-113 6
0.04 91 (17) 67-114 8
RH-9129 0.01 89 (27) 51-122 7
0.02 91 (18) 67-112 6
0.04 79 (14) 64-99 8
RH-6467 0.01 100 (33) 84-153 7
0.02 105 (25) 71-134 6
0.04 93 (15) 61-111 8
e) The same method, but with GLC on a capillary column, has been used for thedetermination of fenbuconazole, the ketone and the lactones in wheat, and fenbuconazole andthe lactones in apples. The limit of determination was 0.01 mg/kg for wheat grain and 0.05mg/kg for straw and apples. Acceptable chromatograms were submitted. The recoveries areshown in Table 31 (Burnett et al., 1992a,b; Martin, 1989).
Table 31. Recoveries of fenbuconazole and metabolites from wheat and apples.
Recovery, %Sample Fortification,mg/kg fenbuconazole ketone lactones
Wheat grain 0.02-1.0 63-111
mean 91
72-118 63-110
mean 89
Straw 0.05-5.0 67-118
mean 94
62-122
mean 91
54-123
mean 89
Apples 0.1-1.0 71-114 - 65-109
mean 84
f) A somewhat simpler method has been used for the determination of fenbuconazole and thelactones RH-9129 and RH-9130 in wheat and grapes. Samples were extracted withacetone/petroleum ether or hexane, cleaned up on a Florisil column, and analysed by GLCwith an FID. The limit of determination was stated to be 0.01 mg/kg. Recoveries from wheatgrain and grapes fortified at 0.25 mg/kg were 92 + 8%. Recoveries from grapes fortified with

fenbuconazole390
fenbuconazole at 0.1 to 0.25 and 1 mg/kg and “its lactone” at 0.2 to 0.4 and 2 mg/kg wereabout 100 + 10%. A satisfactory sample chromatogram was submitted (Mestres, 1989).
g) A preliminary method for the determination of RH-7905, the glucose conjugate of thephenol RH-4911, in wheat grain, bananas and apples has been described. The conjugate washydrolysed to its phenol with acid in methanol and the hydrolysate partitioned with sodiumchloride solution and dichloromethane. The dichloromethane was evaporated and the residueredissolved in acetonitrile before LC-18 SPE clean-up and analysis by HPLC-MS.Satisfactory sample chromatograms were provided. The average recoveries were 87% (sd +2.5) from wheat grain, 84% (sd + 1.9) from apples, and 90% (sd + 7.3) from bananas. Onlysummary information was provided on recoveries; the report states that the limit ofdetermination will be determined in further experiments (Staurowsky and Novak, 1996).
The methods of analysis used in the residue trials on the individual commodities arelisted in Table 32.
Table 32. Summary of the methods of analysis used in supervised trials (Ross, 1997a).
MethodCommodity
b) d) c)
Citrus fruits
Grapefruit yes
Orange yes
Pome fruits
Apple yes yes
Loquat yes
Pear yes yes
Stone fruits
Apricot yes
Cherries yes
Nectarine yes
Peach yes
Plum / prune yes yes
Berries
Grape yes yes
Strawberry yes yes
Fruit, inedible peel
Banana yes
Mango yes
Fruiting veg., Cucurbits
Melons not watermelon yes yes
Cucumber yes yes
Squash, summer yes
Fruiting veg., other than cucurbit
Peppers yes yes
Tomato yes yes
Root and tuber vegetables
Sugar beet yes
Cereal grains
Barley yes

fenbuconazole 391
Method
Maize (corn) yes
Rye yes
Wheat yes
Tree nuts
Almond yes
Pecan yes
Oilseeds
Rape seed yes
Sunflower seed yes
Stability of pesticide residues in stored analytical samples
Apples, wheat grain and straw. Samples were fortified at 0.5 mg/kg with fenbuconazole andthe lactone metabolites, and wheat grain and straw also with the ketone, and stored in afreezer at -10oC for 36 months. Samples taken at intervals were analysed by method c).Uncorrected recoveries are shown in Tables 33-35. They show that all the analytes werestable for 36 months in wheat and apples. Procedural recoveries generally varied between 60and 120% being somewhat higher for apples (Batra, 1995c).
Table 33. Stability of residues in fortified wheat grain stored at -10°C.
Recoveries, %Storage period,months Fenbuconazole Lactone Ketone
0 74.9 73.5 76.7
3 66.3 66.4 82.9
6 80.0 77.9 81.1
12 74.9 69.0 86.4
18 79.0 81.1 100
24 94.9 92.4 90.7
30 98.3 98.1 119
36 90.4 86.2 90.3
Table 34. Stability of residues in fortified wheat straw stored at -10°C.
Recoveries, %Storage period,months Fenbuconazole Lactone Ketone
0 70.3 61.8 71.0
3 93.0 94.6 100
6 83.0 87.4 97.8
12 80.7 86.6 96.8
18 103 101 113
24 79.9 77.1 71.8
30 80.0 79.1 94.7
36 93.7 95.6 98.7

fenbuconazole392
Table 35. Stability of residues in fortified apples stored at -10°C.
Recoveries, %Storage period,months Fenbuconazole Lactone
0 110 111
3 94.1 93.6
6 81.7 80.4
12 79.1 74.8
14 94.2 87.9
18 84.7 78.2
24 86.7 82.7
30 78.0 73.1
36 102 96.0
Another study on the stability of residues in frozen wheat grain, bran and shorts/germshowed that residues of fenbuconazole were stable in these substrates for up to 29 months(Burnett, 1992g).
Wheat grain, bran, middlings, shorts, red dog, low grade flour, patent flour and breadwere analysed by, the method of analysis of Burnett (1994a) before and after frozen storagefor approximately 4.6 years. Residues did not decrease significantly in cleaned grain, bran,shorts/germ, and red dog, but losses were substantial in middlings, flour and bread.Recoveries of 70 to 125% were reported (Burnett, 1994c).
Table 36. Stability of total residues of fenbuconazole and its lactone and ketone metabolites inprocessed fractions of wheat stored at -10°C for approximately 4.6 years.
Residues, mg/kgSample
Before storage After storage
Cleaned grain 0.094 0.077 (-18%)
Bran 0.536 0.611 (+14%)
Middlings 0.108 0.074 (-31%)
Shorts/germ 0.270 0.262 (-3%)
Red dog 0.125 0.112 (-10%)
Flour (low grade) 0.066 0.042 (-36%)
Patent flour 0.104 0.045 (-57%)
Bread 0.110 0.072 (-34%)
Stone fruit. Peaches were fortified with fenbuconazole and its lactone metabolites at 0.5mg/kg and stored in a freezer at -10oC for 54 months. Samples taken at intervals wereanalysed by the method of Martin (1990). Uncorrected recoveries are recorded in Table 37and show that fenbuconazole and the lactones were stable for 54 months. Proceduralrecoveries of 65-120% were generally acceptable. CLICK HERE to continue