11/22/2010 ©evergreen public schools 2010 1 guessing ages teacher notes have fun today! slide 13...
TRANSCRIPT

11/22/2010
©Evergreen Public Schools 2010
1
Guessing AgesTeacher Notes
• Have fun today!• Slide 13 asks you to give students your age.
Purpose• Recall how to graph a scatter plot• Identify independent and dependent variables of a data
set.• Learn how to identify, understand, and apply an
understanding the correlation in a scatter plot: positive vs. negative and strong vs. weak.
©Evergreen Public Schools 2010
2
LaunchLaunchLaunchLaunchYou are going to guess ages of famous people.
How could you determine who at your table is the best guesser?
©Evergreen Public Schools 2010
3
Linear Models Target 2a I can describe the correlation of data in
scatter plots in terms of strong or weak, and positive or negative.
Write one math word you already know. Write one math word you expect to learn in this lesson.

©Evergreen Public Schools 2010
4
©Evergreen Public Schools 2010
5
Guessing AgesGuessing Ages
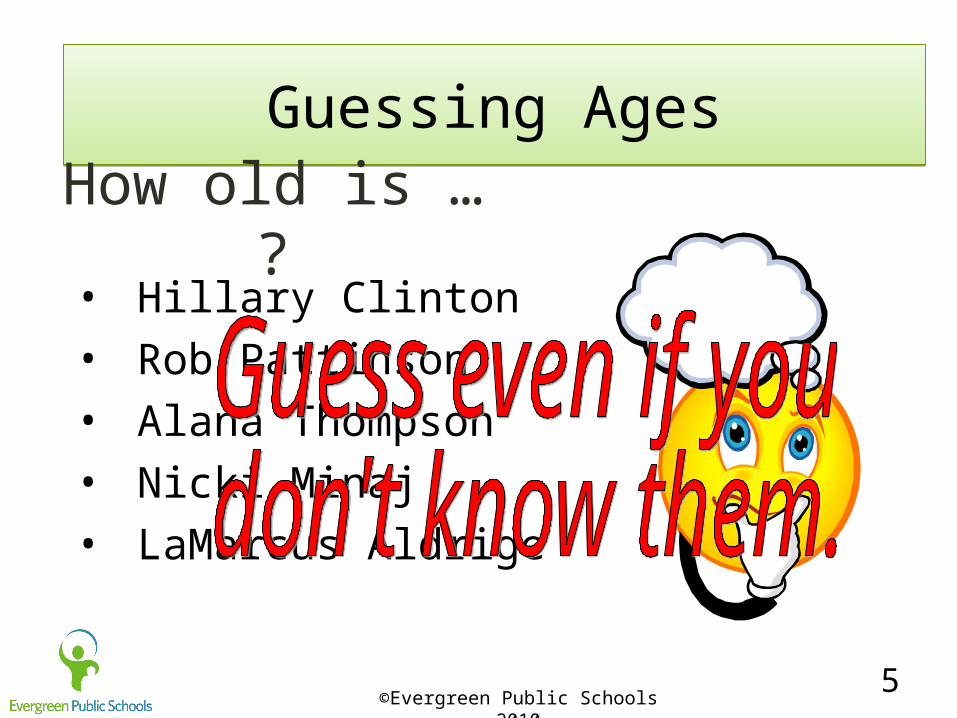
• Hillary Clinton• Rob Pattinson• Alana Thompson• Nicki Minaj• LaMarcus Aldrige
How old is … ?

©Evergreen Public Schools 2010
6
Guessing AgesGuessing Ages
• Teacher’s Choice• Samuel L Jackson• Jennifer Lawrence • Channing Tatum• Hugh Jackman
How old is … ?
©Evergreen Public Schools 2010
7
Guessing AgesGuessing Ages
The Actual Ages

©Evergreen Public Schools 2010
8
Hillary Clinton
• 65
©Evergreen Public Schools 2010
9
Rob Pattinson
• 26
©Evergreen Public Schools 2010
10
Alana Thompson
• 8
Honey Boo Boo
©Evergreen Public Schools 2010
11
Nicki Minaj
• 30
©Evergreen Public Schools 2010
12
LaMarcus Aldridge
• 27

©Evergreen Public Schools 2010
13
Teacher’s Choice
• __

©Evergreen Public Schools 2010
14
Samuel L Jackson
• 63

©Evergreen Public Schools 2010
15
Jennifer Lawrence
• 22
©Evergreen Public Schools 2010
16
Channing Tatum
• 32

©Evergreen Public Schools 2010
17
Hugh Jackman
• 44

©Evergreen Public Schools 2010
18
Make a prediction• Based on the information in your table,
who in your group is the best guesser?
Guessing AgesGuessing Ages
©Evergreen Public Schools 2010
19
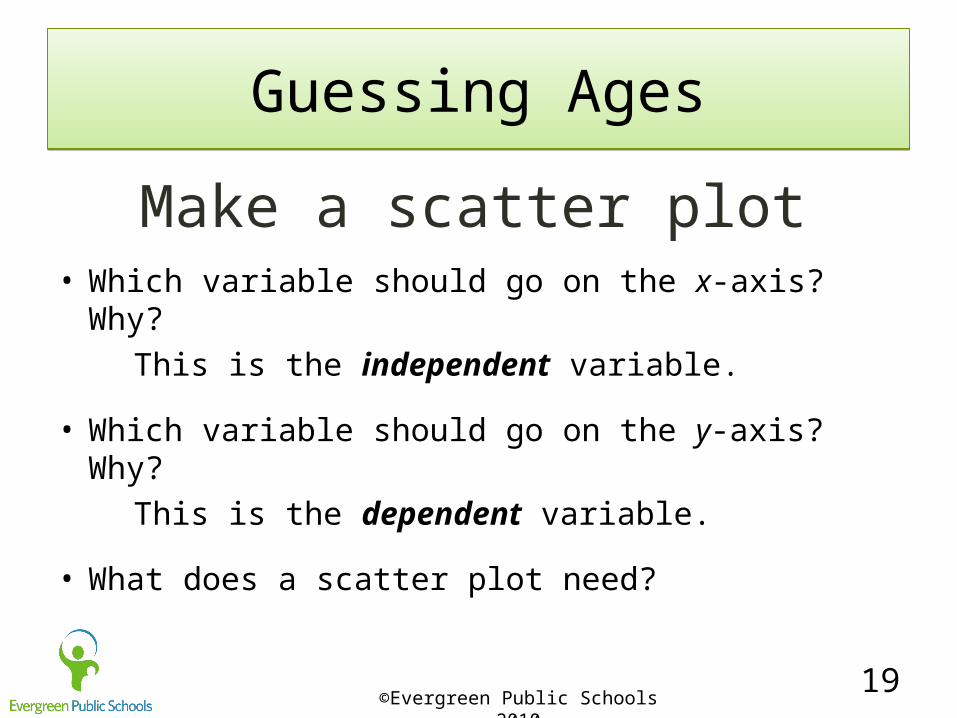
Make a scatter plot• Which variable should go on the x-axis? Why? This is the independent variable.
• Which variable should go on the y-axis? Why? This is the dependent variable.
• What does a scatter plot need?
Guessing AgesGuessing Ages

©Evergreen Public Schools 2010
20
• What do you think the word correlation means?
• If you’re not sure, what do you think this word means? Look for a part of the word you recognize.
• Does it look like any words you know?
Describing CorrelationDescribing Correlation

©Evergreen Public Schools 2010
21
Describ
ing
C
orre
latio
nD
escrib
ing
C
orre
latio
n
©Evergreen Public Schools 2010
22
Describing CorrelationDescribing Correlation
Let’s share.• Who has a graph with a
strong correlation?• Who has a graph with a
weak correlation?• Who has a graph with
no correlation?
Now, look at your Guessing Ages Scatter Plot
©Evergreen Public Schools 2010
23
DebriefDebrief
What do you think a perfect guesser’s scatter plot would look like?
Best Guesser
How can you determine who is the better guesser using the:
• table?• scatter plot?

©Evergreen Public Schools 2010
24
5
3
12
4
Did you hit the target? I can describe the
correlation of data in scatter plots in terms of strong or weak, and positive or negative.
Rate your understanding of the target from 1 to 5.
5 is a bullseye!

©Evergreen Public Schools 2010
25
Ticket Out
What would it mean about the guesser, if their scatter plot had a Strong Negative correlation?