11. chapter-vi allotment, lifting and distribution
TRANSCRIPT

Chapter 6 Allotment, Lifting and Distribution
The Central Government, through FCI has assumed the responsibility for procurement, storage, transportation and bulk allocation of foodgrain to the State Government. The operational responsibility including allocation and distribution within the State rests with the State Government. The Central Government also determines the issue prices (CIP1) at which foodgrain were to be procured by State Governments through its notified lifters for distribution to beneficiaries through FPSs. The State Government, however, determined the issue price of whole sellers and FPSs considering profit margins, transportation charges and other incidental charges except under AAY scheme where transportation and handling charges, to be borne by the State Government, were reimbursed directly to the whole sellers (lifters) and FPS owners.
In Assam, PDS commodities are being distributed to 63 lakh2 households in 27 districts (56 civil sub-divisions) through 34,536 FPSs (urban: 4,030; rural: 30,506, as of January 2010). In respect of Superior Kerosene Oil (SKO), distribution to beneficiaries is made through 12,438 hawkers and 3,307 retailers in addition to the FPSs, after procurement from 385 depots and 95 sub-depots. The flow diagram of PDS commodities is given below:
Chart Foodgrain
SKO
1 CIP – Central Issue Price. 2 APL: 43.94 lakh; BPL: 12.02 lakh and AAY: 7.04 lakh.

Performance Audit on Public Distribution System
16
Audit noticed that no monthly or even periodical requirement of PDS commodities/foodgrain had been placed with the Central authority during the period covered by the audit and the allocation of rice in respect of BPL and AAY beneficiaries had been made by the Centre on the basis of number of BPL/AAY families totaling 18.93 lakh during March 2005 to February 2006 and 19.06 lakh from March 2006 to March 2010. The State allocation and lifting of foodgrain in respect of AAY beneficiaries were made largely at the prescribed rates.
As regards allocation of foodgrain by the Centre in respect of APL beneficiaries neither any demand was placed by the State nor was the Central allocation based on number of households which resulted in allocation of APL rice/wheat by the Director without any basis and at much lower and varied scales. Comments in this regard have been made in Paragraph 6.1.4 and in chapter 7.
The distribution of SKO through hawkers and retailers was in violation of PDS (Control) Order 2001 which envisaged distribution through FPSs to the ration card holders only although the same was done as per directions of GOA. Comment in this regard have been made in Paragraph 6.3.
6.1 Foodgrain
6.1.1 Requirement and Central allocation of foodgrain Requirement of APL, BPL and AAY foodgrain for the State during 2005-10 as worked out by audit, based on number of households data furnished by the Director, FCS&CA was 88.12 lakh MT rice and wheat, 26.98 lakh MT rice and 12.97 lakh MT rice respectively. Against this requirement, GOI allocated 36.80 lakh MT of APL rice/wheat, 25.14 lakh MT of BPL rice and 13.70 lakh MT of AAY rice. Thus, there was short allocation of 51.32 lakh MT (58.24 per cent) of APL rice, 1.84 lakh MT (6.80 per cent) of BPL rice and excess allocation of 0.74 lakh MT (5.67 per cent) AAY rice during 2005-10 (Details in Appendix-III).
The short allocation indicates that either all the beneficiaries were not covered or the scale of distribution was compromised.
In reply the reason for short allocation was stated (July 2010) by the Director, FCS&CA to be due to sudden curtailment of State quota since 2007. Further, stated that the short allocation by the GOI for BPL families (33 kg) and for APL families (6 kg) was due to allotments made by the GOI on the basis of 2001 census. However, there was nothing on record to indicate that GOA had taken up the matter with the GOI to increase the allotment. As regards allotment of sugar allocations were made and lifting was done intermittently at varied scale.
6.1.2 Off-take by FCI from Central Pool
Records of FCI showing off-take of foodgrain from Central Pool against the requirement of State Government for the period from 2005-10, disclosed huge
Allotment, lifting and distribution
17
shortfall in off-take largely in respect of APL category and excess off-take of AAY rice during 2005-06 and 2006-07 only.
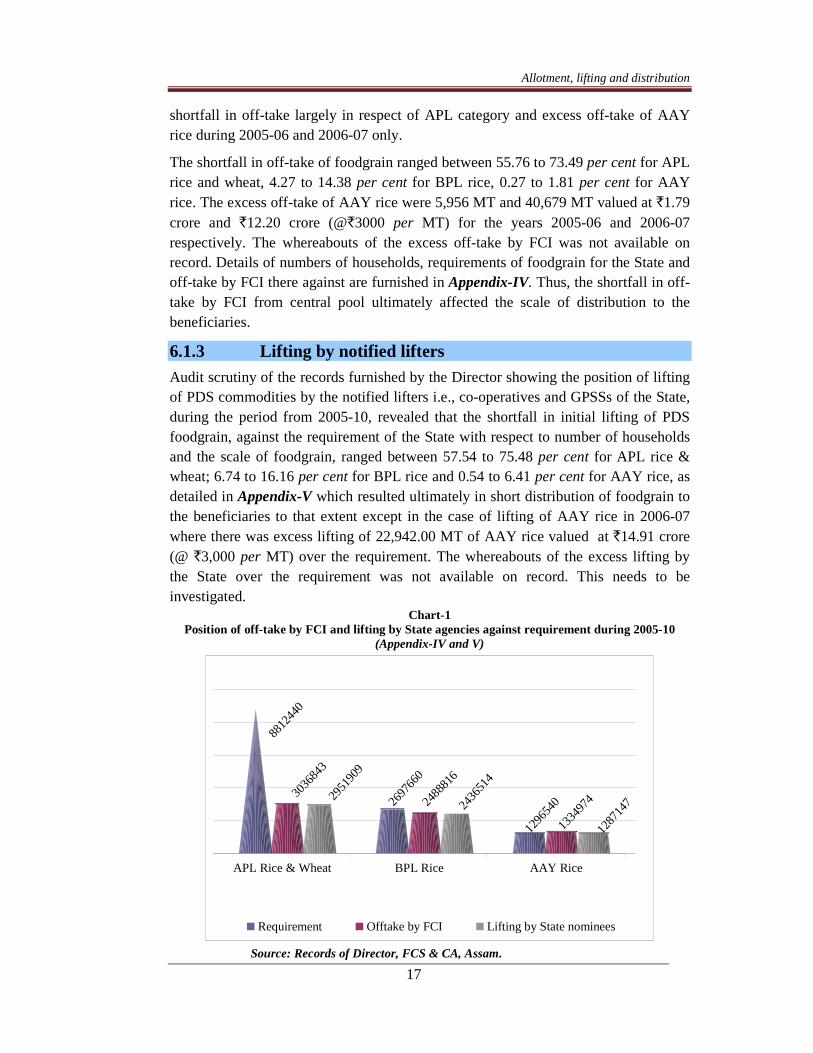
The shortfall in off-take of foodgrain ranged between 55.76 to 73.49 per cent for APL rice and wheat, 4.27 to 14.38 per cent for BPL rice, 0.27 to 1.81 per cent for AAY rice. The excess off-take of AAY rice were 5,956 MT and 40,679 MT valued at `1.79 crore and ̀ 12.20 crore (@̀3000 per MT) for the years 2005-06 and 2006-07 respectively. The whereabouts of the excess off-take by FCI was not available on record. Details of numbers of households, requirements of foodgrain for the State and off-take by FCI there against are furnished in Appendix-IV. Thus, the shortfall in off-take by FCI from central pool ultimately affected the scale of distribution to the beneficiaries.
6.1.3 Lifting by notified lifters Audit scrutiny of the records furnished by the Director showing the position of lifting of PDS commodities by the notified lifters i.e., co-operatives and GPSSs of the State, during the period from 2005-10, revealed that the shortfall in initial lifting of PDS foodgrain, against the requirement of the State with respect to number of households and the scale of foodgrain, ranged between 57.54 to 75.48 per cent for APL rice & wheat; 6.74 to 16.16 per cent for BPL rice and 0.54 to 6.41 per cent for AAY rice, as detailed in Appendix-V which resulted ultimately in short distribution of foodgrain to the beneficiaries to that extent except in the case of lifting of AAY rice in 2006-07 where there was excess lifting of 22,942.00 MT of AAY rice valued at ̀14.91 crore (@ `3,000 per MT) over the requirement. The whereabouts of the excess lifting by the State over the requirement was not available on record. This needs to be investigated.
Chart-1 Position of off-take by FCI and lifting by State agencies against requirement during 2005-10
(Appendix-IV and V)
8812
440
3036
843
2951
909
2697
660
2488
816
2436
514
1296
540
1334
974
1287
147
APL Rice & Wheat BPL Rice AAY Rice
Requirement Offtake by FCI Lifting by State nominees
Source: Records of Director, FCS & CA, Assam.

Performance Audit on Public Distribution System
18
Further, records of FCI disclosed that during the years 2005-10 against the off-take of PDS foodgrain from central pool by FCI, shortfall in lifting by the notified lifters of State Government were 2.80 per cent of APL rice and wheat; 2.10 per cent of BPL rice; 3.58 per cent of AAY rice, and 5.46 per cent of sugar, which ultimately affected the scale of distribution to the actual beneficiaries.
The details of short lifting for 2005-10 with respect to off-take by FCI are given in the table below:
Table-1
Short lifting of PDS items by State nominees for the period from 2005-10
(in MT)
Item Off-take by FCI Lifting by State Short lifting (per cent)
1 2 3 4
APL rice & Wheat
30,36,843 29,51,909 84,934 (2.80)
BPL rice 24,88,816 24,36,514 52,302 (2.10)
AAY rice 13,34,974 12,87,147 47,827 (3.58)
Sugar 4,05,767 3,83,622 22,145 (5.46) Source: FCI statement and data furnished by Director, FCS&CA, Assam
In reply the Director stated that the poor lifting of APL rice was due to availability of rice in open market at cheaper rate during 2005-06, which could not be substantiated with evidence.
6.1.4 Short allocation by the State
Audit scrutiny of the records revealed that against the Central allotments for the State, there was a remarkable shortfall in allocations made by the Director to all the civil sub-divisions of the State, for the years 2005-10. The shortfalls noticed were 20.04 to 27.53 per cent of APL rice with excess State allocation of 0.84 per cent in 2007-08; 5.72 per cent in 2008-09 with excess allocations ranging from 0.01 (2007-08) to 3.13 per cent (2006-07) of BPL rice and 3.29 to 5.36 per cent of AAY rice. The reasons for such shortfall as well as excess allocations of foodgrain, were not on record. The details of allotments by the Centre for the State and by the Director to all the sub-divisions are furnished in Appendix-VI.

Allotment, lifting and distribution
19
Chart - 2
Shortfall of Directorate allotment against Central allotment for the years 2005-10
2387356
1914222
473134
2514111
2505693
8418
1370073
1323451
46622
APL Rice BPL Rice AAY Rice
Central allotment Directorate allotment Shortfall
Source: Records of Director, FCS & CA, Assam
6.1.5 Re-allotment of lapsed rice
The Department had no system of reallotment of lapsed rice, which remained unlifted from FCI. Test check of the records revealed that:
In Kokrajhar sub-division, monthly allotment of PDS (APL) rice in respect of certain GPSSs lapsed as a result of non-lifting by them. The district authorities re-allotted the lapsed quantities amongst the GPSSs, sometime even to GPSSs whose normal allotment had lapsed. In August 2006, 1,469.50 quintals out of 3,409.10 quintals of lapsed PDS (APL) rice, was re-allotted to Charan Sing Basumatary, stated to be a whole-sale licensee of Kokrajhar. The re-allotted quantity was not lifted by Shri Basumatary and the entire quantity was further re-allotted amongst Balajan GPSS (291.20 qtls.), Salakati GPSS (573.60 qtls.), Titaguri GPSS (306.50 qtls.) and Kokrajhar WSCCS (298.20 qtls.) by the district authorities. However, FCI records revealed that Sri Basumatary had lifted 1,469.50 quintals whereas the four other GPSSs to whom 1,469.50 qtls. of lapsed rice was further re-allotted as per district records, did not lift the quantity from FCI. It, thus, cannot be ruled out that the entire quantity of 1,469.50 qtls. of rice valued at `12.20 lakh3 meant for APL beneficiaries under PDS, had found its way to the open market through the whole-sale licensee.
3 at CIP (APL) of ̀ 830 per qtl.
Performance Audit on Public Distribution System
20
6.2.1 Allotment and lifting of wheat
Audit scrutiny of the records revealed that during 2005-10, 11,84,092 MT of wheat was lifted against total GOI allocation of 12,92,611 MT and thereby there was total short lifting of 1,08,519 MT of wheat resulting in consequential short distribution of converted atta to the beneficiaries. The details are shown in the table below:
Table - 2
Position of allotment and lifting of wheat during 2005-10 (in MT)
Year Allotment by GOI Quantity lifted Shortfall in lifting
2005-06 3,37,024 2,54,342 82,682 2006-07 2,31,226 2,42,801 (-) 11,575 2007-08 2,49,062 2,49,373 (-) 311 2008-09 2,24,364 2,16,266 8,098 2009-10 2,50,935 2,21,310 29,625
Total 12,92,611 11,84,092 1,08,519 Source: Directorate Records
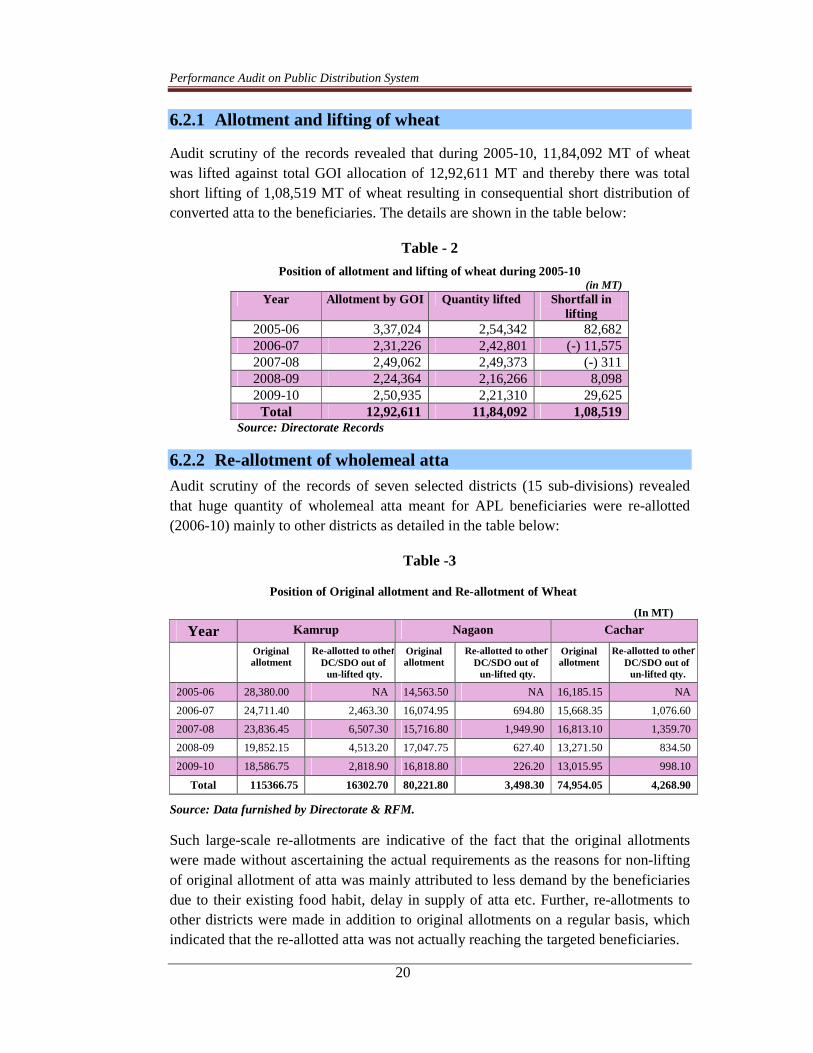
6.2.2 Re-allotment of wholemeal atta Audit scrutiny of the records of seven selected districts (15 sub-divisions) revealed that huge quantity of wholemeal atta meant for APL beneficiaries were re-allotted (2006-10) mainly to other districts as detailed in the table below:
Table -3
Position of Original allotment and Re-allotment of Wheat
(In MT)
Year Kamrup Nagaon Cachar
Original allotment
Re-allotted to otherDC/SDO out of un-lifted qty.
Original allotment
Re-allotted to other DC/SDO out of un-lifted qty.
Original allotment
Re-allotted to other DC/SDO out of un-lifted qty.
2005-06 28,380.00 NA 14,563.50 NA 16,185.15 NA
2006-07 24,711.40 2,463.30 16,074.95 694.80 15,668.35 1,076.60
2007-08 23,836.45 6,507.30 15,716.80 1,949.90 16,813.10 1,359.70
2008-09 19,852.15 4,513.20 17,047.75 627.40 13,271.50 834.50
2009-10 18,586.75 2,818.90 16,818.80 226.20 13,015.95 998.10
Total 115366.75 16302.70 80,221.80 3,498.30 74,954.05 4,268.90
Source: Data furnished by Directorate & RFM.
Such large-scale re-allotments are indicative of the fact that the original allotments were made without ascertaining the actual requirements as the reasons for non-lifting of original allotment of atta was mainly attributed to less demand by the beneficiaries due to their existing food habit, delay in supply of atta etc. Further, re-allotments to other districts were made in addition to original allotments on a regular basis, which indicated that the re-allotted atta was not actually reaching the targeted beneficiaries.

Allotment, lifting and distribution
21
Audit scrutiny of the records of Kamrup (Metro) district having only one sub-division further revealed that unlifted atta from flour mills of 4774.60 MT and bran of 419.10 MT were re-allotted to DC, Goalpara and Barpeta during 2006-10. Year-wise details of re-allotment to Goalpara district only are given in the table – 4.
Table - 4
Year-wise position of re-allotted atta to Goalpara district (in MT)
Year Atta Bran 2006-07 1,431.80 149.10 2007-08 1,822.80 162.40 2008-09 802.30 27.90 2009-10 717.70 79.70
Total 4,774.60 419.10 Source: Directorate Records.
Cross-check of the records of DC, Goalpara, however revealed that DC, Goalpara sub-allocated the atta 88 FPSs in the district in addition to their original allotments. No records or returns showing actual distribution of the re-allotted atta were made available to audit. Audit scrutiny of the records of only seven FPSs in the town area, however, disclosed that three FPSs had received excess quantity of wheat product against both original and subsequent allotments to the extent of two to seven times of their actual requirements in various months and distribution of atta to beneficiaries ranged between 3.78 kg to 266.14 kg per FIC per month during 2006-10 in addition to normal allotment of rice whereas approved limit of maximum monthly distribution for rice and atta together was 35 kg per FIC per month. These indicated that certain households received PDS commodities far in excess of their allotment. In the absence of records of actual distribution by FPSs these excess commodities finding its way to open market can also not be ruled out.
Besides, allotments of excess quantity of wheat or wheat products beyond requirement were made to certain districts4 on regular basis without going for re-adjustment in subsequent original allotments as per norms. The wheat products were also found to be re-allotted and diverted after gaps ranging from two to seven months from original allotment and thereby raising doubt about their quality for human consumption after distribution.
Wheat from FCI was allotted to various nominated Roller Flour Mills (RFM) and Chakki Mills (CM) for conversion to wholemeal atta and then sub-allotted to GPSSs and FPSs for distribution to beneficiaries. Anomalies in allocation, lifting and distribution were noticed during test-check. Three instances are cited below.
4 Barpeta, N.C. Hills, Karbi Anglong, Hailakandi and Karimganj.

Performance Audit on Public Distribution System
22
6.2.3 Allocation and lifting of wheat and wholemeal atta
Audit scrutiny revealed that 6,142.66 MT of sub-allotted atta in Kokrajhar district remained unlifted, stated (June 2010) by the Joint Director to be due low demand. The sub-divisional authority sub-allocated the same to three GPSSs (lifters) and 45 FPSs in the town area as shown in the table-5.
Table - 5 Re-allotment of unlifted atta
(In MT) Name of Nominees/GPSS Period of re-
allotment Re-allotted Qty.
1 2 3 Nominees (4) for town FPSs 5/06 to 2/10 3,497.01 Serfanguri GPSS 9/06 to 2/10 2,191.85 Ramfalbill GPSS 5/07 to 1/10 298.30 Patgaon GPSS 8/07 to 1/08 155.50
Total 6,142.66 Source: Re-allotment orders of Jt. Director, Kokrajhar.
As regards lifting and distribution of re-allotted atta, scrutiny of stock registers and sale registers of three GPSSs and four FPSs revealed that the re-allotted atta of 6,142.66 MT valued at ` 4.30 crore5 was not accounted for in their records and thus the whereabouts of the re-allotted quantity of atta could not be ascertained in audit. The individual lifters, representing the town area FPSs, also failed to produce any records showing actual lifting of re-allotted atta and details of issue to FPSs.
(in Kokrajhar) (in Nagaon; 4 February 2010)
Stock of un-lifted atta
Due to absence of accounting-receipt and their subsequent issue, the entire quantity of aforesaid re-allotted atta finding its way to open market cannot be ruled out.
� Audit scrutiny of the records of Lakhipur sub-division in Cachar district revealed that 1,169.9 MT of wheat, with 100 per cent lifting, was allotted during 2007-106 for conversion to wholemeal atta of 1,111.40 MT (95 per cent) which was sub-allotted to 12 Co-operative Societies and 362 FPSs for distribution to APL beneficiaries. Test-check of the records of two Co-operative Societies (Lifters) and
5 At CIP (atta) of ̀ 699.96 per qtl. 6 Position not available for the year 2005-06 and 2006-07.

Allotment, lifting and distribution
23
eight FPSs revealed that not a single kilogram of atta was lifted by them. The sub-divisional authority also stated (June 2010) that atta was not at all lifted by the nominated lifters during the period covered by audit and thereby distribution to beneficiaries was not done at all. Thus, the likelihood of converted 1,111.40 MT of atta valued at ̀77.79 lakh7 finding its way to open market cannot be ruled out. The authority in their reply stated (June 2010) that the FPSs were reluctant to lift the allotted atta due to low demand.
� Audit scrutiny of monthly returns of six8 nominated RF Mills of Silchar Sadar sub-division revealed that, in every month during 2007-10, there were closing balances of unlifted atta ranging from 218.45 qtls. to 1,585 qtl. The unlifted atta with three9 mills was re-allotted by the sub-divisional authorities in subsequent months while unlifted atta of balance three10 mills was stated (June 2010) to be re-allotted by district authorities, although no supporting documents could be shown to audit. Although, there was closing balance of unlifted atta in every month, no efforts were taken to rearrange the allotment according to demand by the district authorities.
The Department had not reviewed the demand for atta from FPSs at any stage and records showing basis of reallotment were also not available.
6.2.4 Un-milled wheat Audit scrutiny of data furnished by 37 out of 47 Roller Flour Mills (RFM) in seven test-checked districts for the years 2005-10 revealed that 28 RFMs of four districts were having significant stock balance of un-milled wheat in every month varying from 20 qtls. to 12,615 qtls. as closing balances in the returns furnished by them. The district-wise position of un-milled wheat in these 28 RFMs are shown in Appendix-VII and in the Table below:
Table - 6 Position of un-milled wheat
Name of the district
Total no. of RFM
Data furnished
by
Closing Balance (qtls.) Remarks
Min. Max.
Kamrup (M) 16 8 146 12,615 Min.146 qtls. (12/06) at Birjhora RF Mill and Max.12,615 qtls.(6 & 7/05) at Guwahati RF Mill.
Sonitpur 4 4 576 10,984 Min.576qtls. (1/06) at Tezpur RF Mill and Max.10,984 qtls. at Lahkar Udyog Pvt. Ltd.
Dibrugarh 10 10 20 3,990 Min. 20 qtls. (12/08) at Swastik Food Products and Max. 3990qtls. (5/06) at Jeevan Modern Griding Mill.
Silchar 6 6 63 3,190 Min. 63qtls. (9/08) and Max.3190 qtls. at 10/07 at Riya’s Flour Mill.
Total 36 28 Source: Data furnished by RFMs.
7 At CIP (atta) of ̀ 699.96. 8 (1) Cachar R.F. Mill, (2) Jai Commercial, (3) Lalit Flour Mill, (4) Navin Food Industries,
(5) Riyas Flour Mill and (6) U.F.M. Industries. 9 Jai, Riyas and Cachar (RF) Mills. 10 (1) UMR Industries, (2) Nabin and (3) Lalit (RF) Mills.

Performance Audit on Public Distribution System
24
These un-milled quantities of wheat and/or atta in the event of conversion were not carried over for adjustment in the wheat allocations of subsequent month, whereas the conditions laid down by the GOI (November 2005) clearly stipulated that the un-milled wheat and unlifted atta, if any, during the month would not exceed the actual utilisation of wheat for the scheme based on last six months’ average and would not be disposed of in the open market.
This indicated that the proper inspection and monitoring of milling of wheat was not carried out as envisaged and thereby kept the avenue open for undue financial benefit to the millers for years by selling the un-milled wheat/atta to open market.
6.3 Superior Kerosene Oil (SKO)
6.3.1 Allocation and lifting of SKO under PDS The Director, FCS&CA on receipt of allocation of SKO on quarterly/monthly basis from Ministry of Petroleum and Natural Gas, Government of India, allocates the same to the sub-divisions on the basis of population against which the sub-divisional authorities are to submit monthly lifting and distribution position to the Directorate for both urban and rural areas. The district authorities were also instructed (September 1993) to allocate 70 per cent under PDS and balance 30 per cent to hawkers out of the total allocation made.
Audit scrutiny of the records revealed that after allocation of SKO to the sub-divisions, the directorate failed to maintain sub-division wise position of lifting and distribution stated to be due to irregular submission of monthly returns for the same.
The detailed position of allocation and lifting of SKO for the State during 2005-10 as furnished by the Director, FCS&CA are shown in the Table below:
Table-7 Allocation and lifting of SKO for the State during 2005-10
Year Allocation Lifting
2005-06 2,57,982 2,57,669 2006-07 2,58,005 2,57,631 2007-08 2,57,998 2,57,854 2008-09 2,57,998 2,58,052 2009-10 2,57,869 2,57,869
Source: Director, FCS&CA,Assam
In the absence of accurate and regular data regarding actual lifting and distribution of SKO at sub-division level the position of actual intake of SKO at the end level under
Un-milled wheat lying with the millers in
Nagaon (4 February 2010)

Allotment, lifting and distribution
25
PDS could not be ascertained and thereby diversion of SKO to open market for adulteration of petrol /diesel and for any other unauthorized usage could not be ruled out.
6.3.2 Allocation and distribution of SKO through Hawkers and Retailers
SKO, being a major component of PDS, is allocated monthly to all the sub-divisions by the Director on the basis of quarterly allocation and release by the Ministry of Petroleum & Natural Gas, GOI.
Lifting of SKO under PDS by Hawkers in Goalpara (19 July 2010)
Audit scrutiny revealed that out of the monthly allocation made, the sub divisional authorities have been reallocating SKO to the hawkers and retailers as well as through PDS outlets. The order of the State Government for distribution of SKO to the hawkers and retailers was however, in contravention of GOI’s guidelines for implementation of PDS wherein it was stated that essential commodities are to be distributed to the card holders through Fair Price Shops only. The position of allocation, lifting and distribution of SKO in 15 test-checked sub-divisions are shown in the table and chart below:
Table - 8 Allocation, Lifting and Distribution of SKO to sub-divisions
(In KL) Year Allocation Lifting Distribution
(percentage) 2005-06 1,06,056.52 91,525.12 78,554.87 (86)
2006-07 1,02,039.23 87,435.81 80,165.77 (92)
2007-08 1,05,457.18 1,05,282.98 92,647.88 (88)
2008-09 1,05,069.51 1,04,674.24 95,586.28 (91)
2009-10 1,00,352.58 99,179.73 93,546.84 (94)
Total 5,18,975.02 4,88,097.88 4,40,501.64 (90) Source: Sub-divisional data.

Performance Audit on Public Distribution System
26
� On scrutiny of records of 15 sub-divisions11, it was noticed that sub allocations of SKO were made to hawkers, retailers and FPS agents for distribution to the PDS beneficiaries only. FICs were not tagged with the hawkers and retailers and no records of actual distribution of SKO to card holders were available at any level which raised doubts of selling SKO to card holders by hawkers and retailers.
The details of lifting by hawkers, retailers and FPSs during 2005-10 are shown in Chart below:
Chart -4
Lifting of SKO by the Hawkers, Retailers and FPSs during 2005-10 (In Kilolitre)
Source: Sub-divisional data.
It would be evident from the chart above that 1,28,060.13 KL of SKO, valued at `128.10 crore, lifted by hawkers and retailers, the distribution of which to the PDS card holders was doubtful due to non-maintenance of any records by them to disclose the distribution to FIC holders.
Thus, in the absence of data regarding actual distribution to the card holders, as well as in the absence of effective checks to ensure proper distribution
11 1. Kamrup (Metro) under Kamrup district; 2. Nagaon (Sadar), 3. Kaliabor & 4. Hojai under Nagaon district; 5. Tezpur, 6. Biswanath & 7. Gohpur under Sonitpur district; 8. Sadar sub-division of Dibrugarh district; 9. Bongaigaon & 10. North Salmara under Bongaigaon district; 11. Kokrajhar (Sadar), 12. Gossaigaon & 13. Parbotjhora under Kokrajhar district 14. Lakhipur & 15. Silchar under Cachar district.
Blue dyed SKO meant for distribution under PDS is being
sold in open market at Guwahati (15 April 2010)

Allotment, lifting and distribution
27
the fulfillment of objective of distribution of SKO to targeted people remained doubtful. Besides, no mechanism was put in place to ensure selling of allotted 30 per cent of kerosene through hawkers and retailers at the Government fixed rate to the card holders.
6.3.3 Lifting of SKO by Hawkers & Retailers with invalid license
In Tezpur sub-division of Sonitpur district, licenses for distribution of SKO were issued by the sub-divisional authorities to the hawkers and retailers by segregating them in four geographical areas of Tezpur, Dhekiajuli, Rangapara and Jamuguri with Sootea.
Audit scrutiny of license registers revealed that as of March 2010, 281 out of 760 licenses were invalid due to non-renewal, death, surrender, resignation etc. Details are shown in the table below:
Table - 9
Position of invalid Licenses as of March 2010 Area Total no. of
licenses issued Total no. of licenses
became invalid Total no. of valid license
Tezpur 287 99 188 Dhekiajuli 172 56 116 Rangapara 149 44 105 Jamuguri with Sootea 152 82 70 Total 760 281 479
Source: Sub divisional records.
As regards distribution of SKO by hawkers and retailers, the same has been done on lifting the allotted quantity from the depots and sub-depots as per the allocations made by the authorities. Test-check of the records of sub-division for the month of March 2010 disclosed that against 479 authorised hawkers and retailers, SKO was issued to 535 persons which included 56 hawkers and retailers without valid licenses @400 litres12 per month per person totaling 22,400 litres in that month alone. Thus, there were serious flaws in the system of allocating SKO to hawkers and retailers.
� In Nagaon (Sadar) sub-division of Nagaon district, audit scrutiny revealed that monthly allocation of SKO to retailers ranging from 167 to 180 was made during 2005-10. On verification of the lists of licensed retailers it was noticed that allocation was made to retailers without considering their renewal of licenses and without official endorsement in their permit/ lifting book. The position of year-wise number of retailers, renewal of license, official endorsement is shown in the table below:
12 Hawker @ 550 lit.
Hawker @ 500 lit. Hawker @ 300 lit. Hawker @ 250 lit. Total 1600 lit. Taking average @ 400 lit.

Performance Audit on Public Distribution System
28
Table: - 10 Year-wise number of Retailers having valid licenses and endorsements with
regard to SKO Year No. of retailers to
whom allocation made in Nagaon (Sadar).
No. of retailers with valid licenses (as per register) in Nagaon (Sadar).
Total endorsements made for lifting (no. of retailer X 12 months) on the lifting book as per register
2005-06 177 to 180 List Not maintained Records not maintained 2006-07 170 to 177 List Not maintained Records not maintained 2007-08 167 to 170 139 Records not maintained 2008-09 167 134 Records not maintained 2009-10 167 131 798 (since June 2009 to January
2010 i.e. average 100 in a year) Source: Records of Nagaon Sadar Sub-division.
� In Hojai sub-division of Nagaon district, scrutiny of the records revealed that more than 1000 Hawkers were getting allocation of SKO till December 2006. But on physical verification by the Executive Magistrate during 20 and 21 June 2007 only 756 hawkers could be located and verified. This indicated that allocations were made in favour of invalid/ non-existent/ unauthorized hawkers without ascertaining their actual existence and were also allowed to lift SKO from the depot without any endorsement. Thus, the selling out of SKO to open market in a big way could not be ruled out.
� In sum, distribution of SKO to the FIC holders through both licensed and unlicensed retailers and hawkers at Government approved rate remained doubtful.
6.4 Distribution of Iodized Salt
Until August 2009, the allocation of iodised salt for lifting by the nominees was made by the Government. Subsequently, from September 2009, the allocations were made by the Director FCS&CA. However this violated the notification of August 2001 of FCS&CA Department, GOA, wherein the district and sub-division-wise allocation of iodised salt was to be made by the Director. Thus, due to the violation of its own notification by the Government, the Director was kept outside the entire process of allocation, lifting and distribution of iodised salt and failed to provide any information regarding movement of the same by the importers to the units of distribution.
Consequently, audit could not ascertain the distribution of iodised salt to the targeted beneficiaries. The Director accepted (October 2010) the audit observation.

Allotment, lifting and distribution
29
6.5 Storage loss
Proper storage of foodgrain at all levels of procurement and distribution through FPSs plays an important role in successful implementation of PDS in addition to food security in the country as a whole.
Out of 31 WSCCSs/GPSSs test-checked, adequate provision for storage of foodgrain were not there in six GPSSs and four WSCSSs/GPSSs did not have their own godown and were functioning in rented godowns.
Test-check of the records of 31 GPSSs/WSCCSs revealed storage loss of food commodities and SKO during 2005-10 to the extent of 826.42 quintals of rice worth `4.67 lakh13, 26.91 quintals of wheat worth about ̀ 0.16 lakh14, 90.94 quintals of sugar worth about ̀1.22 lakh15 and 120.83 litres of SKO worth around ̀0.10 lakh before being issued to FPSs. The highest storage loss of commodities, more than 100 quintals, during 2005-10 was noticed in the following GPSSs/WSCCS.
i) Dibrugarh WSS Ltd.– 234.91 Qtls of APL rice for `1.95 lakh.
ii) Sakti Ashram GPSS– 110.67 Qtls of APL rice for `0.92 lakh.
iii) Kokrajhar sub-divisional WSCCS – 164.39 Qtls of APL rice for ̀ 1.36 lakh.
The aforesaid storage loss tantamounted to short issue of PDS commodities to the FPS owners with consequential short distribution to the beneficiaries. No action for replenishment of such losses was found to be taken by the FCS&CA authorities.
GPSS wise details of storage losses are furnished in Appendix-VIII.
13 At CIP (BPL) of ̀ 565.00 per quintal. 14 ` 610 .00 per quintal for wheat. 15 At CIP (̀ 1345.57 per qtl. of sugar and ` 8.66 per litre of SKO).
Unscientific storage and handling caused loss
of PDS foodgrain in gambaribill GPSS (22 May 2010)
Easy accessibility of animals to Mancotta GPSS
godown contributes to storage loss.

Performance Audit on Public Distribution System
30
6.6 Convergence
In addition to the PDS, different Ministries of Government of India launched various food based welfare scheme as under from time to time to the same group of beneficiaries.
Sl. No. Name of scheme Launched by
1 Annapurna scheme for senior citizen of 65 years of age or above.
M/o Rural Development
2 Scheme for supply of foodgrain to hostels/welfare institutions (5 per cent of BPL allocation)
M/o Consumer Affairs, Food and Public Distribution.
Source: Annual Report 2008-09 of Food & Public Distribution, GOI.
Audit scrutiny of the records of the Director, FCS&CA and seven districts selected for audit, revealed that while making allocation of foodgrain under TPDS, the benefits to families/ persons eligible under the aforesaid food based schemes were not taken into consideration for fixing the scale of foodgrain to be provided and thereby these beneficiaries getting food articles under both PDS and other foodgrain based schemes could not be ruled out.
Summarily, the intended benefits were not reaching to the beneficiaries on account of persistent short allocation and short lifting of foodgrain at different levels. The existing practice of selling SKO through hawkers to non card holders was also adversely affecting PDS. Adequate storage provisions were not there in some of the societies that caused storage loss.
Recommendations
Allotment of wheat to millers needs to be reviewed and restricted to the extent of need of the beneficiaries.
The State Government should ensure adequate allotments by the Centre, full lifting of the allotted foodgrain and timely distribution of PDS items as per scale.
The system of distribution of SKO should be reviewed to ensure that there is effective control over its distribution to the designated price, time and quality.