11-1 hansen & mowen cost management accounting and control
TRANSCRIPT
11-1
HANSEN & MOWENHANSEN & MOWEN
Cost ManagementCost ManagementACCOUNTING AND CONTROLACCOUNTING AND CONTROL

11-2
Strategic Cost ManagementStrategic Cost Management
11

11-3
There are three general strategies that have been identified:
cost leadership product differentiation focusing
Strategic Cost Management: Basic Strategic Cost Management: Basic ConceptsConcepts 1
11-4
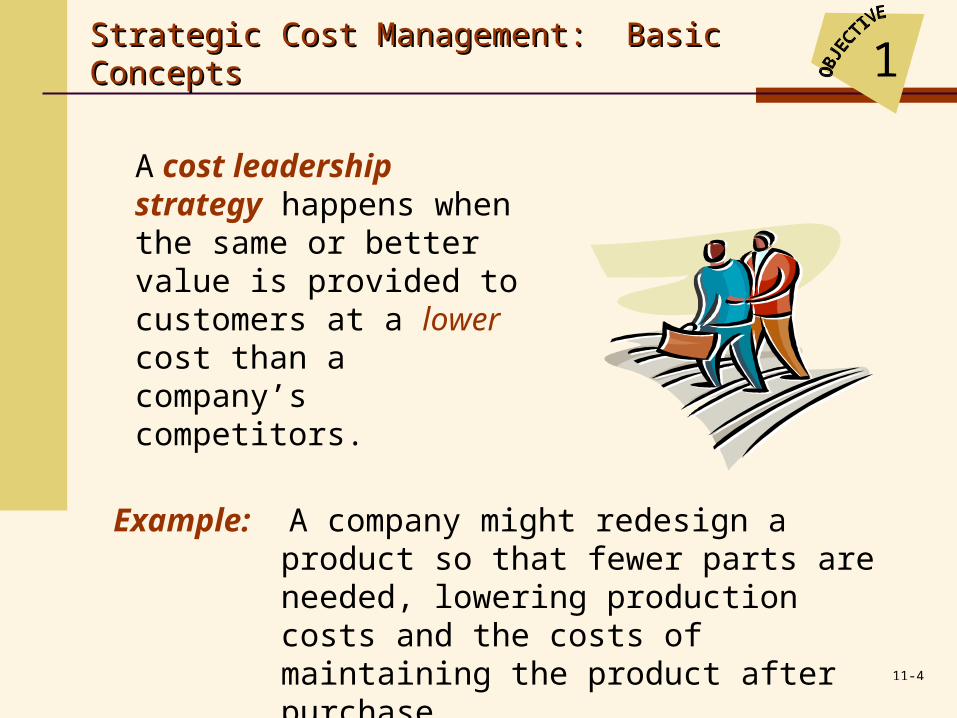
A cost leadership strategy happens when the same or better value is provided to customers at a lower cost than a company’s competitors.
Example: A company might redesign a product so that fewer parts are needed, lowering production costs and the costs of maintaining the product after purchase.
Strategic Cost Management: Basic Strategic Cost Management: Basic ConceptsConcepts 1
11-5
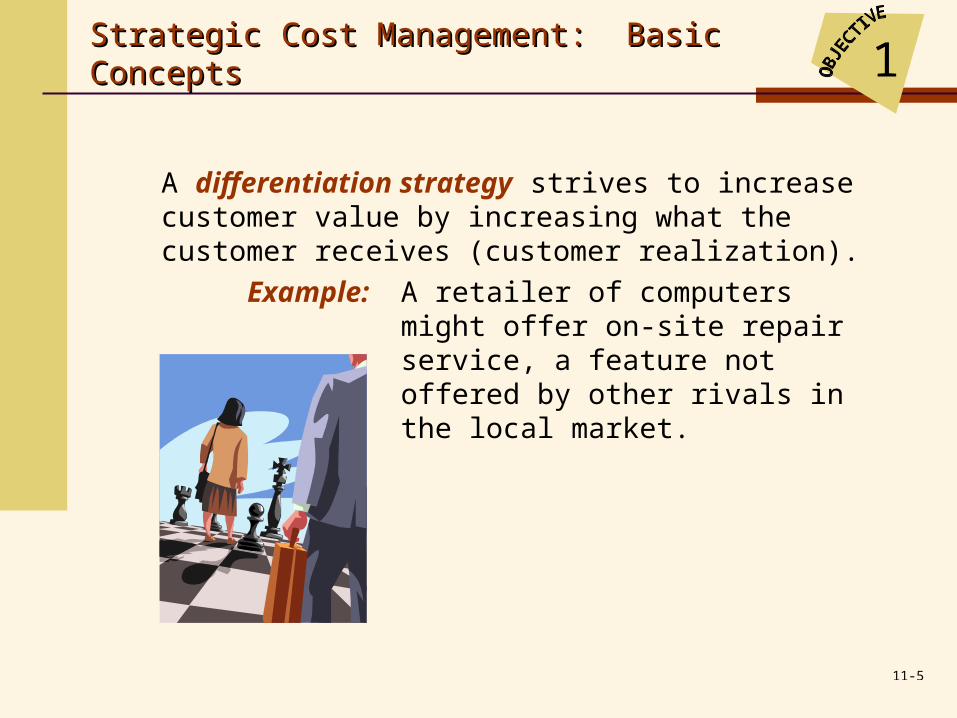
A differentiation strategy strives to increase customer value by increasing what the customer receives (customer realization).
Example: A retailer of computers might offer on-site repair service, a feature not offered by other rivals in the local market.
Strategic Cost Management: Basic Strategic Cost Management: Basic ConceptsConcepts 1
11-6
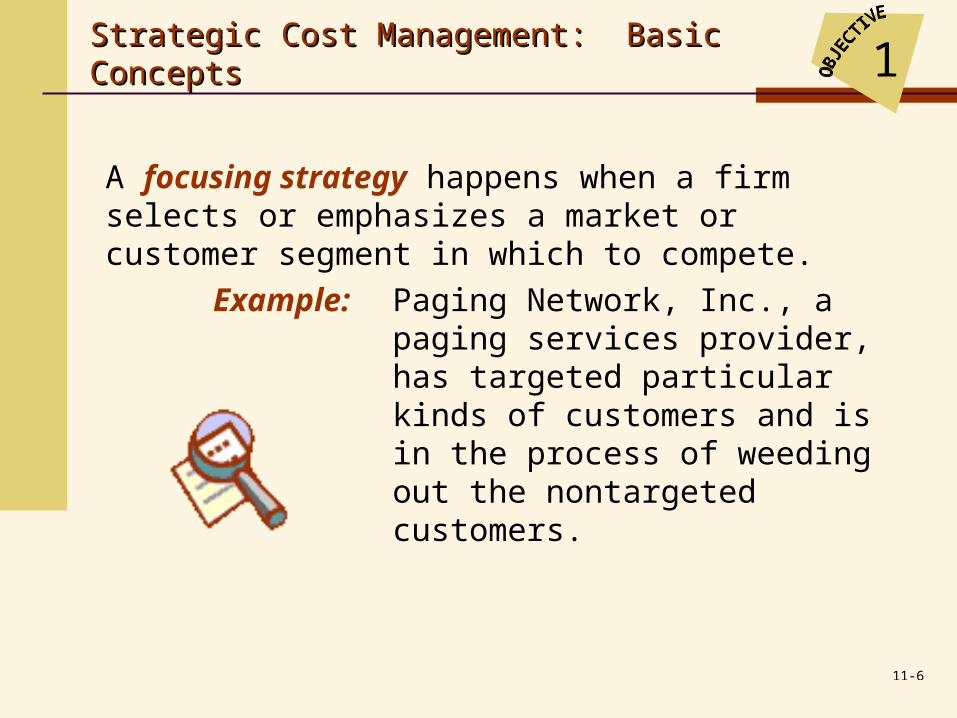
A focusing strategy happens when a firm selects or emphasizes a market or customer segment in which to compete.
Example: Paging Network, Inc., a paging services provider, has targeted particular kinds of customers and is in the process of weeding out the nontargeted customers.
Strategic Cost Management: Basic Strategic Cost Management: Basic ConceptsConcepts 1
11-7
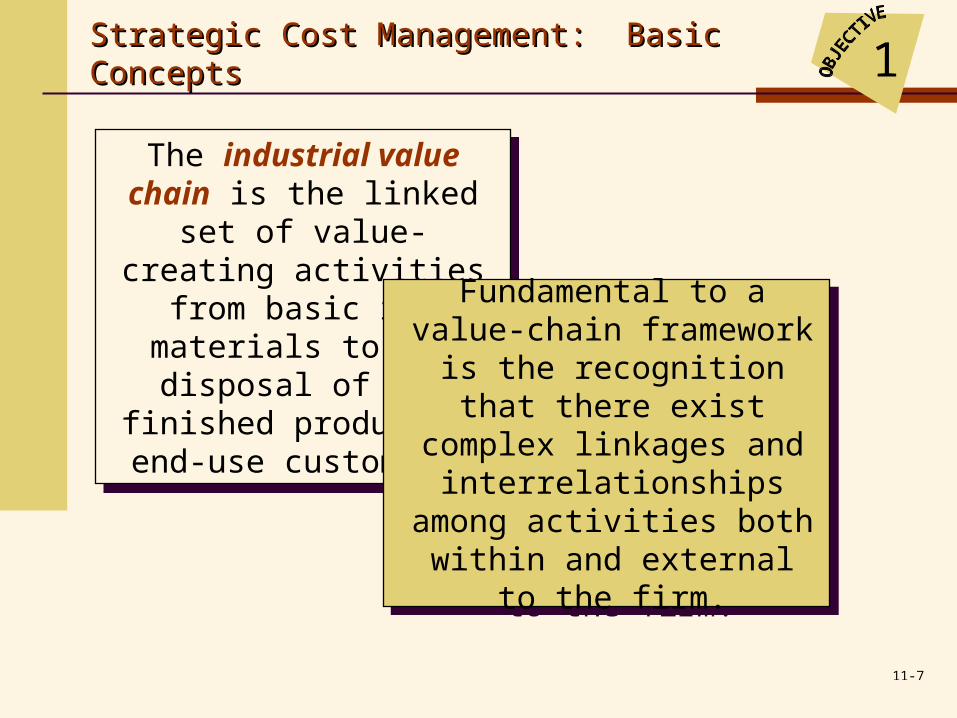
The industrial value chain is the linked set of value-creating activities from
basic raw materials to the disposal of the finished
product by end-use customers.
The industrial value chain is the linked set of value-creating activities from
basic raw materials to the disposal of the finished
product by end-use customers.
Fundamental to a value-chain framework is the
recognition that there exist complex linkages and
interrelationships among activities both within and
external to the firm.
Fundamental to a value-chain framework is the
recognition that there exist complex linkages and
interrelationships among activities both within and
external to the firm.
Strategic Cost Management: Basic Strategic Cost Management: Basic ConceptsConcepts 1
11-8
There are two types of linkages that must be analyzed and understood: internal and external linkages.
Internal linkages are relationships among activities that are performed within a firm’s portion of the value chain.External linkages describe the relationship of a firm’s value-chain activities that are performed with its suppliers and customers. There are two types: supplier linkages and customer linkages.
Strategic Cost Management: Basic Strategic Cost Management: Basic ConceptsConcepts 1
11-9
Strategic Cost Management: Basic Strategic Cost Management: Basic ConceptsConcepts 1
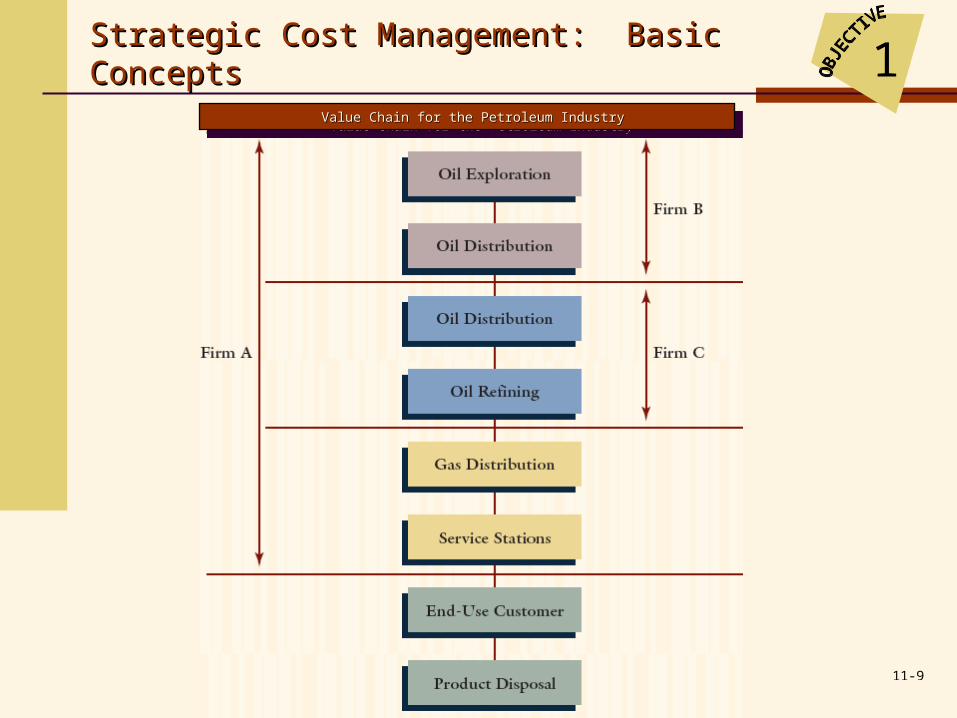
Value Chain for the Petroleum IndustryValue Chain for the Petroleum IndustryValue Chain for the Petroleum IndustryValue Chain for the Petroleum Industry
11-10
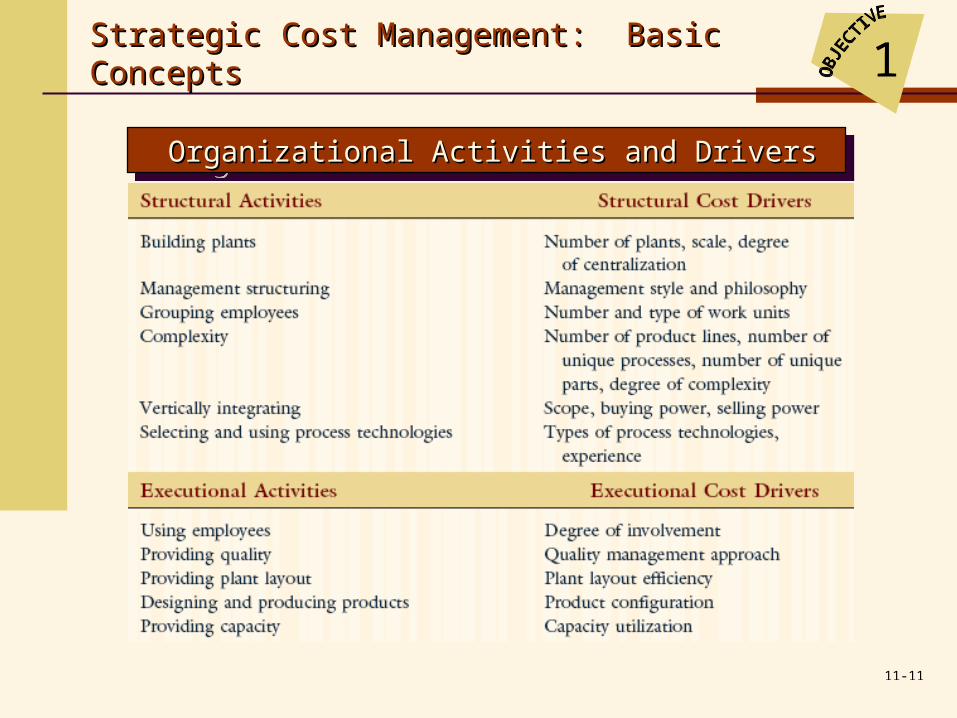
Organizational activities are of two types: structural and executional.
Structural activities are activities that determine the underlying economic structure of the organization.
Executional activities are activities that define the processes and capabilities of an organization and thus are directly related to the ability of an organization to execute successfully.
Strategic Cost Management: Basic Strategic Cost Management: Basic ConceptsConcepts 1
11-11
Strategic Cost Management: Basic Strategic Cost Management: Basic ConceptsConcepts 1
Organizational Activities and DriversOrganizational Activities and DriversOrganizational Activities and DriversOrganizational Activities and Drivers

11-12
Strategic Cost Management: Basic Strategic Cost Management: Basic ConceptsConcepts 1
Operational Activities and DriversOperational Activities and DriversOperational Activities and DriversOperational Activities and Drivers
11-13
Strategic Cost Management: Basic Strategic Cost Management: Basic ConceptsConcepts 1
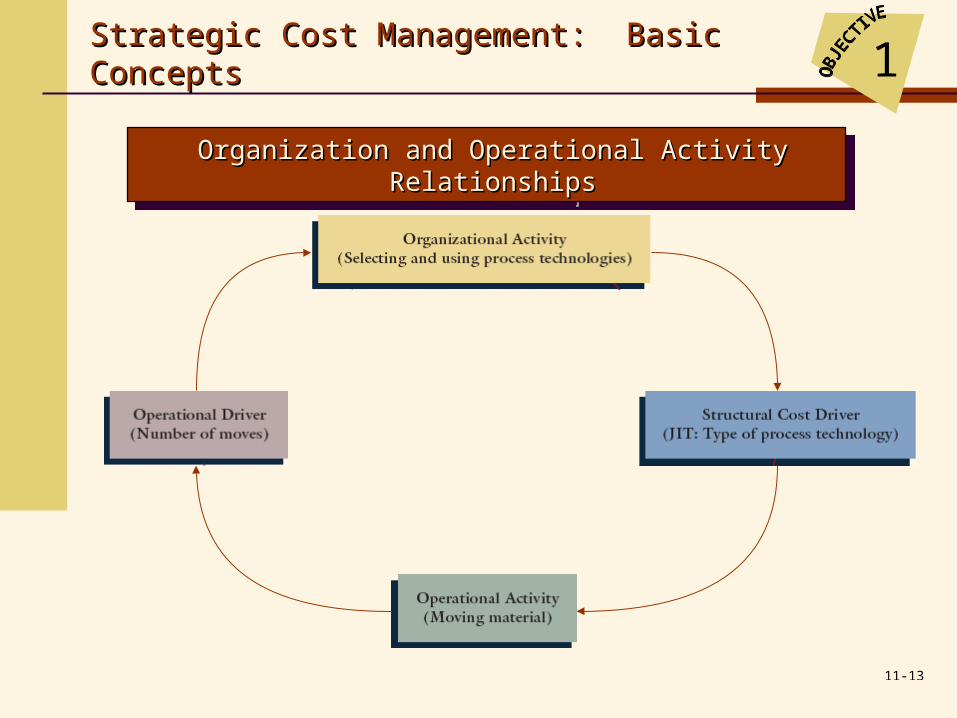
Organization and Operational Activity Organization and Operational Activity RelationshipsRelationships
Organization and Operational Activity Organization and Operational Activity RelationshipsRelationships
11-14
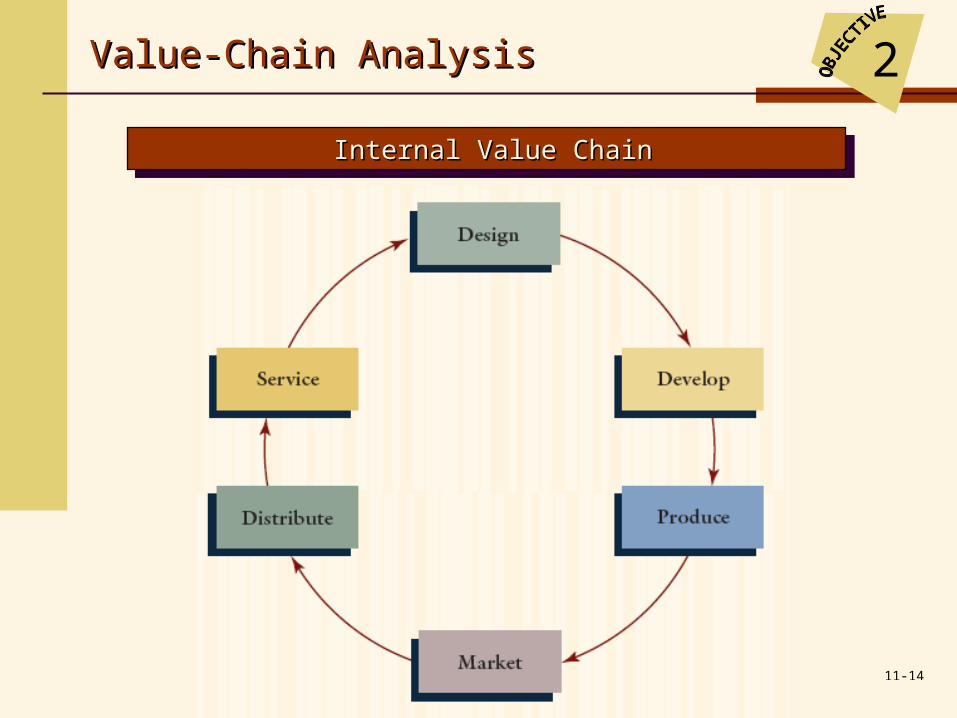
Internal Value ChainInternal Value ChainInternal Value ChainInternal Value Chain
2Value-Chain AnalysisValue-Chain Analysis

11-15
2Value-Chain AnalysisValue-Chain Analysis
Internal Linkage Analysis Example
Activities Activity DriverActivity
Capacity
Current Activity Demand
Expected Activity Demand
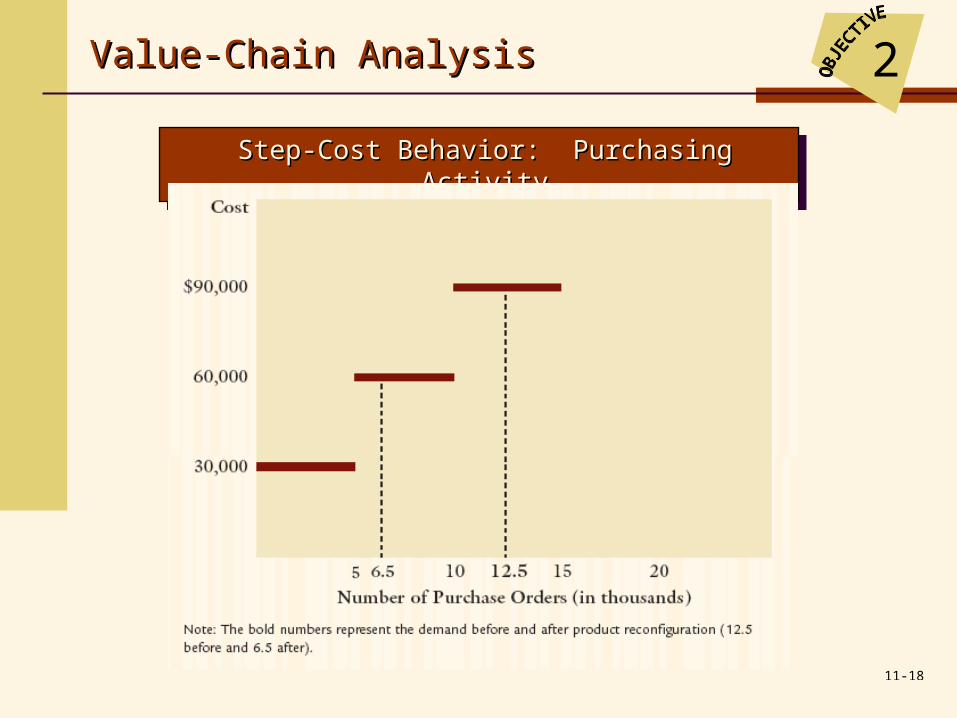
Material usage Number of parts 200,000 200,000 80,000Assembling parts Direct labor hours 10,000 10,000 5,000Purchasing parts Number of orders 15,000 12,500 6,500Warranty repair Number of defective products 1,000 800 500

11-16
2Value-Chain AnalysisValue-Chain Analysis
Internal Linkage Analysis Example
Additionally, the following activity cost data are provided:
Material usage: $3 per part used; no fixed activity cost.Assembly: $12 per direct labor hour; no fixed activity costPurchasing: Three salaried clerks, each earning a $30,000
annual salary; each clerk is capable of processing 5,000 purchase orders annually. Variable activity costs: $0.50 per purchase order processed for forms, postage, etc.
Warranty: Two repair agents, each paid a salary of $28,000 per year; each repair agent is capable of repairing 500 units per year. Variable activity costs: $20 per product repaired.
11-17
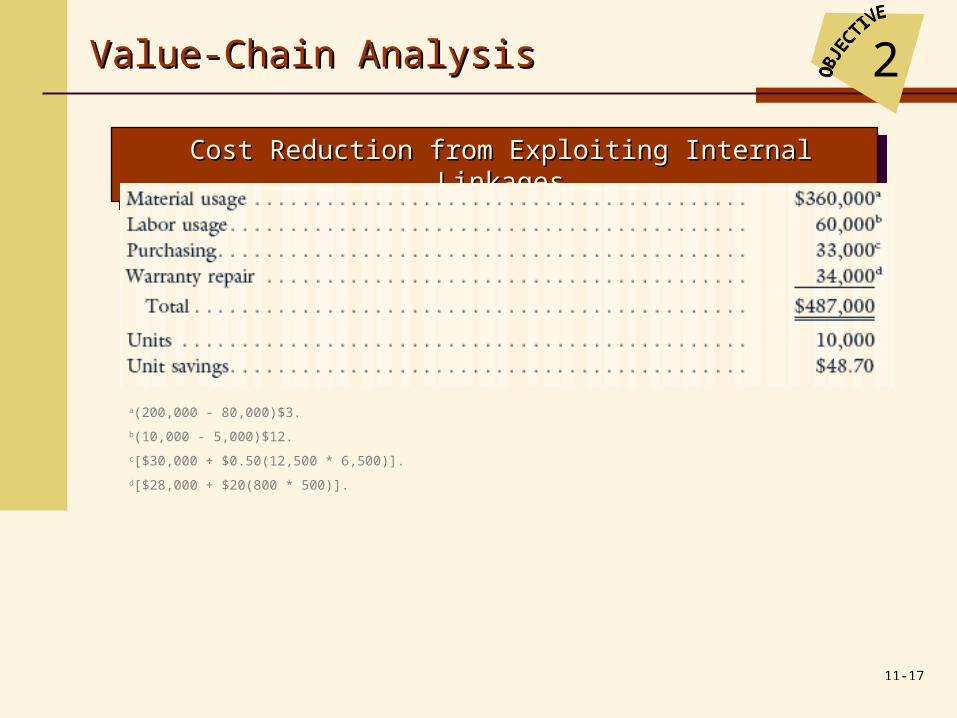
Cost Reduction from Exploiting Internal LinkagesCost Reduction from Exploiting Internal LinkagesCost Reduction from Exploiting Internal LinkagesCost Reduction from Exploiting Internal Linkages
2Value-Chain AnalysisValue-Chain Analysis
a(200,000 - 80,000)$3.
b(10,000 - 5,000)$12.
c[$30,000 + $0.50(12,500 * 6,500)].
d[$28,000 + $20(800 * 500)].
11-18
2Value-Chain AnalysisValue-Chain Analysis
Step-Cost Behavior: Purchasing ActivityStep-Cost Behavior: Purchasing ActivityStep-Cost Behavior: Purchasing ActivityStep-Cost Behavior: Purchasing Activity

11-19
2Value-Chain AnalysisValue-Chain Analysis
Data for Supplier Costing ExampleData for Supplier Costing ExampleData for Supplier Costing ExampleData for Supplier Costing Example
11-20
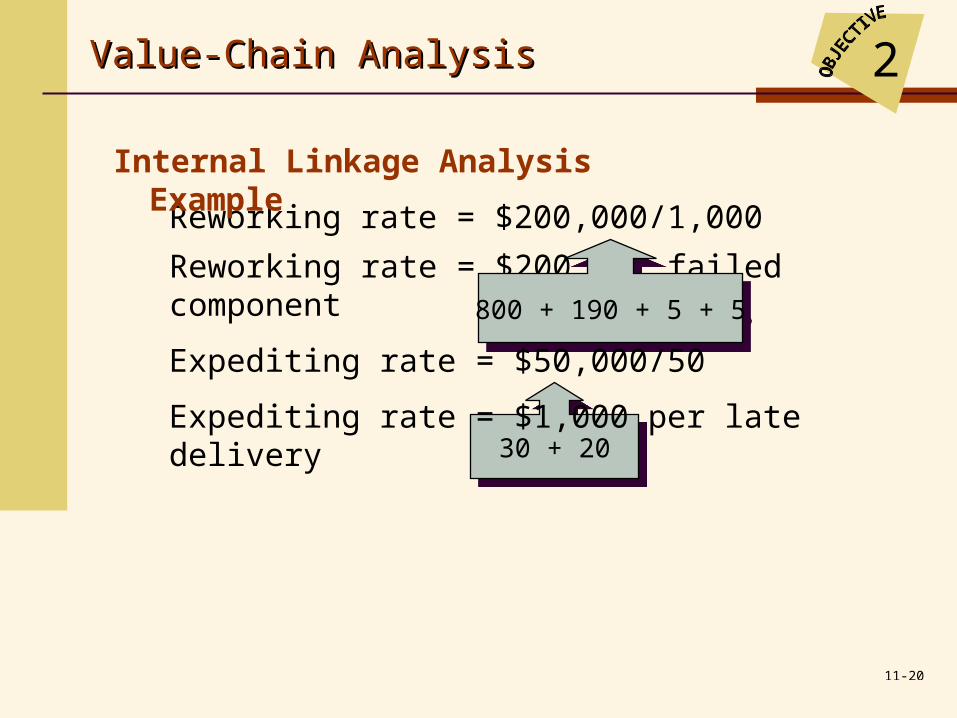
Reworking rate = $200,000/1,000
Reworking rate = $200 per failed component
800 + 190 + 5 + 5800 + 190 + 5 + 5
Expediting rate = $50,000/50
30 + 2030 + 20Expediting rate = $1,000 per late delivery
Internal Linkage Analysis Example
2Value-Chain AnalysisValue-Chain Analysis
11-21
2Value-Chain AnalysisValue-Chain Analysis
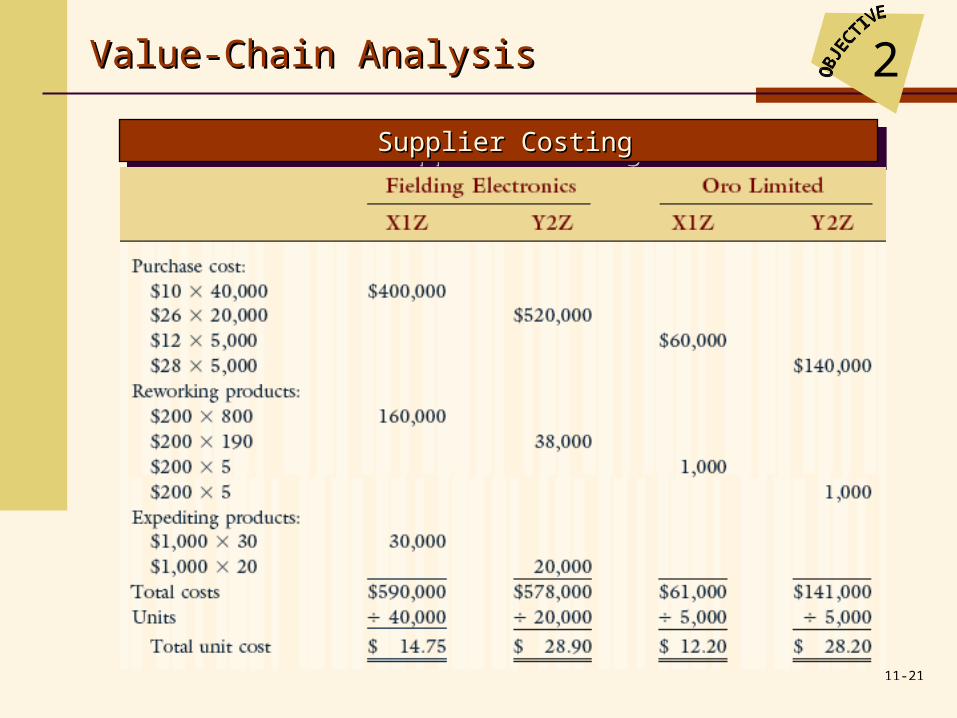
Supplier CostingSupplier CostingSupplier CostingSupplier Costing

11-22
Units purchased 500,000 500,000Orders placed 2 200Manufacturing cost $3,000,000 $3,000,000Order-filling cost allocated* $303,000 $303,000Order cost per unit $0.606 $0.606*Order-filling capacity is purchased in blocks of 45 (225 capacity), each block costing $40,400; variable order-filling activity costs are $2,000 per order; thus, the cost is [(5 x $40,400) + ($2,000 x 202)]
One Large TenCustomer Smaller Customers
2Value-Chain AnalysisValue-Chain Analysis
11-23
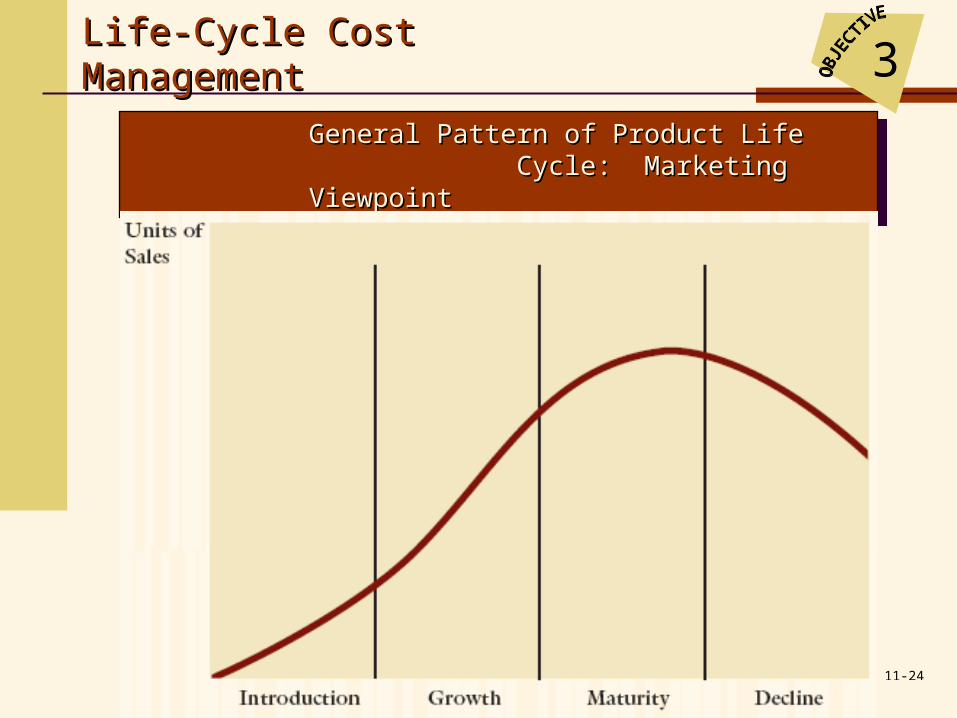
There are three basic views of the product life cycle: Marketing viewpoint Production viewpoint Consumable life viewpoint
3Life-Cycle Cost ManagementLife-Cycle Cost Management
11-24
3Life-Cycle Cost ManagementLife-Cycle Cost Management
General Pattern of Product Life General Pattern of Product Life Cycle: Marketing ViewpointCycle: Marketing Viewpoint
General Pattern of Product Life General Pattern of Product Life Cycle: Marketing ViewpointCycle: Marketing Viewpoint

11-25
3Life-Cycle Cost ManagementLife-Cycle Cost Management
Product Life Cycle: Production ViewpointProduct Life Cycle: Production ViewpointProduct Life Cycle: Production ViewpointProduct Life Cycle: Production Viewpoint
11-26
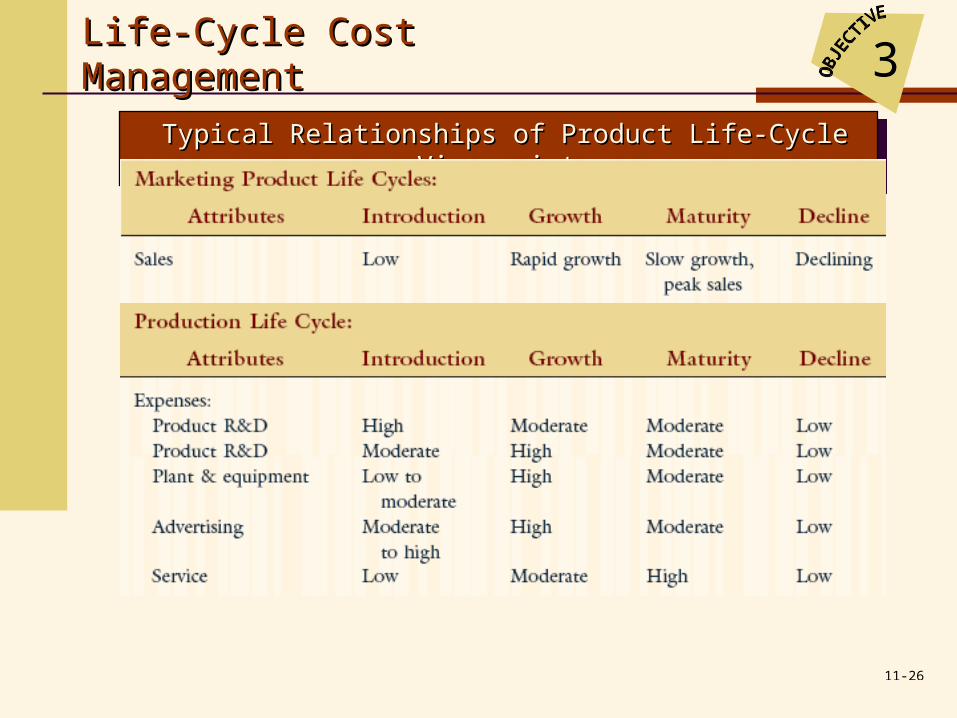
3Life-Cycle Cost ManagementLife-Cycle Cost Management
Typical Relationships of Product Life-Cycle View Typical Relationships of Product Life-Cycle View pointspoints
Typical Relationships of Product Life-Cycle View Typical Relationships of Product Life-Cycle View pointspoints
11-27
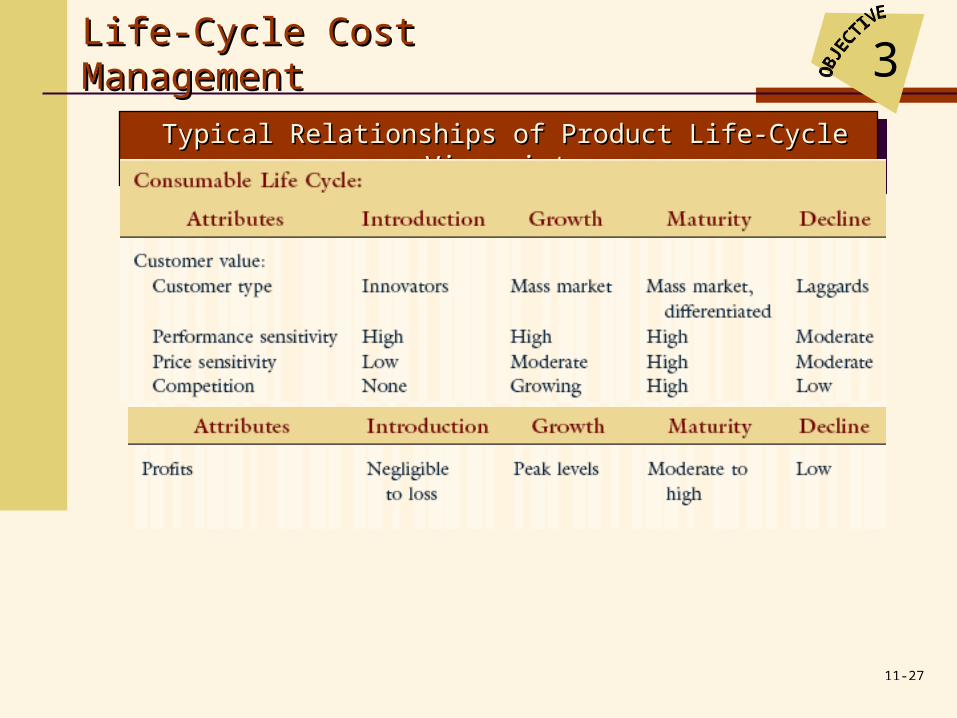
3Life-Cycle Cost ManagementLife-Cycle Cost Management
Typical Relationships of Product Life-Cycle ViewpointsTypical Relationships of Product Life-Cycle ViewpointsTypical Relationships of Product Life-Cycle ViewpointsTypical Relationships of Product Life-Cycle Viewpoints

11-28
Functional-based system:
Variable conversion activity rate: $40 per direct labor hour
Material usage rate: $8 per part
ABC system:
Labor usage $10 per direct labor hour
Material usage: $8 per part
Machining: $28 per machine hour
Purchasing activity: $60 per purchase order
Setup activity: $1,000 per setup hour
Warranty activity: $200 per returned unit
Customer repair cost: $10 per hour
Cost Behavior
Cost Reduction Example
3Life-Cycle Cost ManagementLife-Cycle Cost Management
11-29
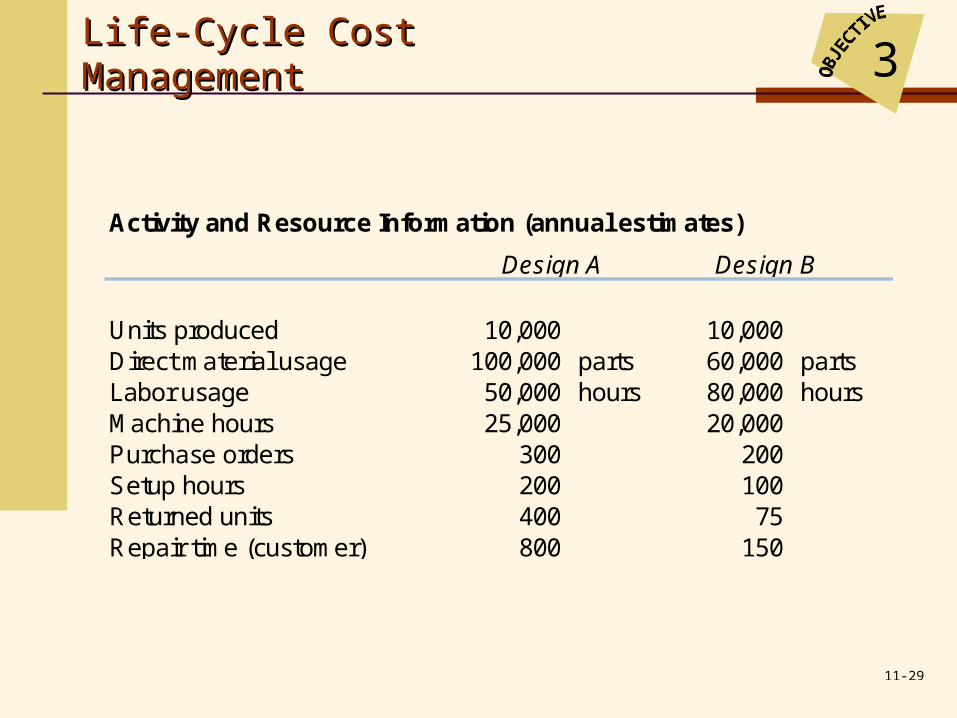
3Life-Cycle Cost ManagementLife-Cycle Cost Management
Activity and Resource Information (annual estimates)
Units produced 10,000 10,000Direct material usage 100,000 parts 60,000 partsLabor usage 50,000 hours 80,000 hoursMachine hours 25,000 20,000Purchase orders 300 200Setup hours 200 100Returned units 400 75Repair time (customer) 800 150
Design BDesign A
11-30
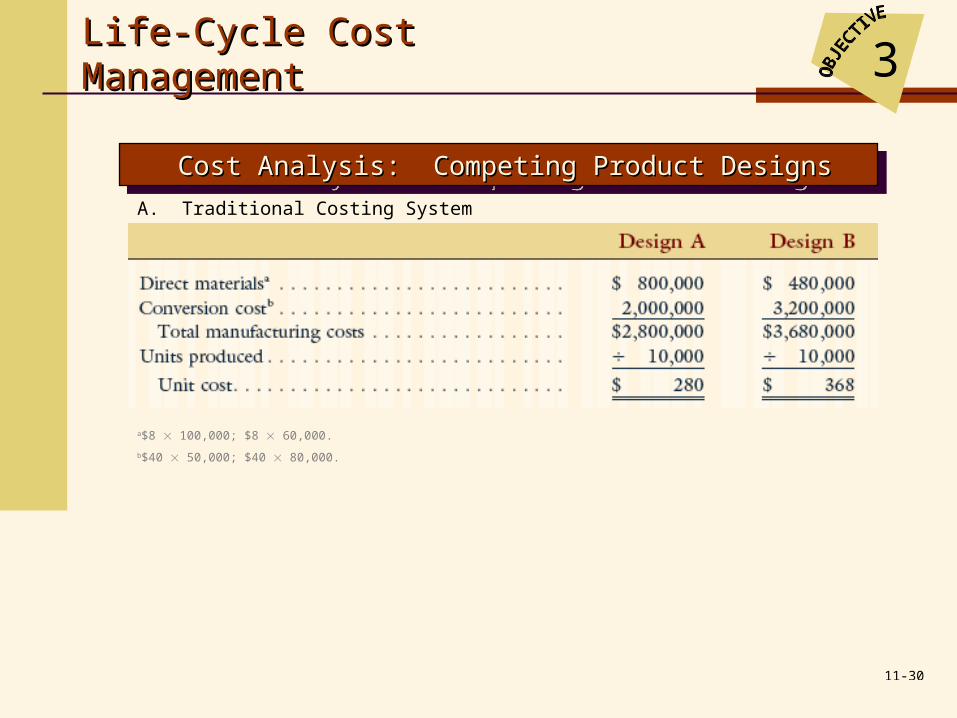
3Life-Cycle Cost ManagementLife-Cycle Cost Management
Cost Analysis: Competing Product DesignsCost Analysis: Competing Product DesignsCost Analysis: Competing Product DesignsCost Analysis: Competing Product Designs
A. Traditional Costing System
a$8 100,000; $8 60,000.
b$40 50,000; $40 80,000.

11-31
3Life-Cycle Cost ManagementLife-Cycle Cost Management
Cost Analysis: Competing Product DesignsCost Analysis: Competing Product DesignsCost Analysis: Competing Product DesignsCost Analysis: Competing Product Designs
B. ABC System
a$10 50,000; $10 80,000.
b$28 25,000; $28 20,000.
c$60 300; $60 200; $1,000 200; $1,000 100; $200 400; $200 75.
*Rounded to the nearest dollar.
11-32
Three cost reduction methods: reverse engineering value analysis process improvement
3Life-Cycle Cost ManagementLife-Cycle Cost Management
11-33
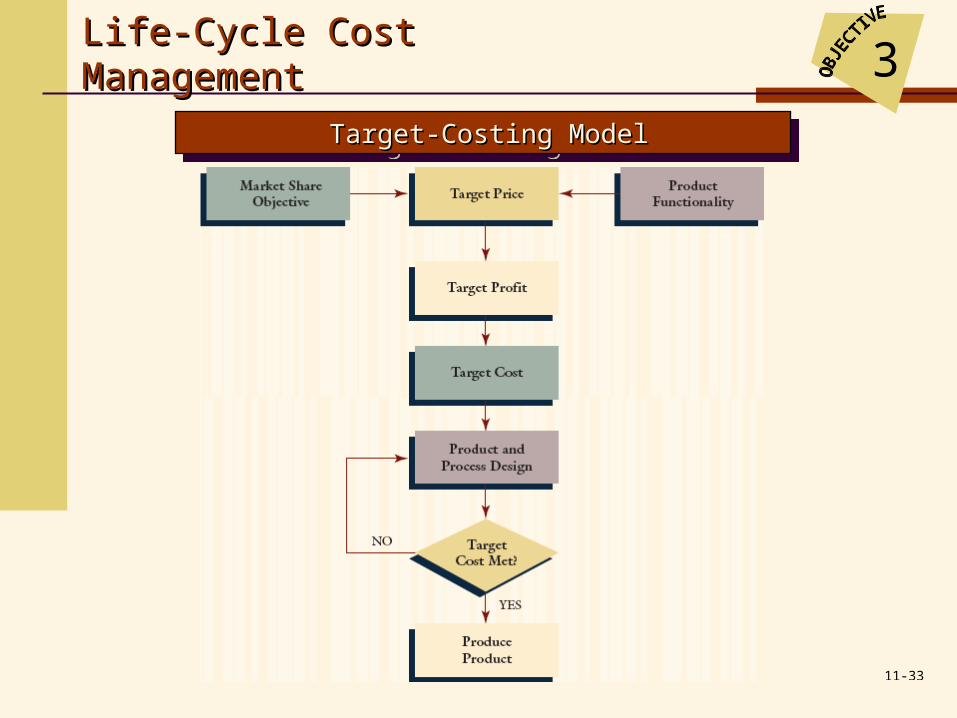
3Life-Cycle Cost ManagementLife-Cycle Cost Management
Target-Costing ModelTarget-Costing ModelTarget-Costing ModelTarget-Costing Model
11-34
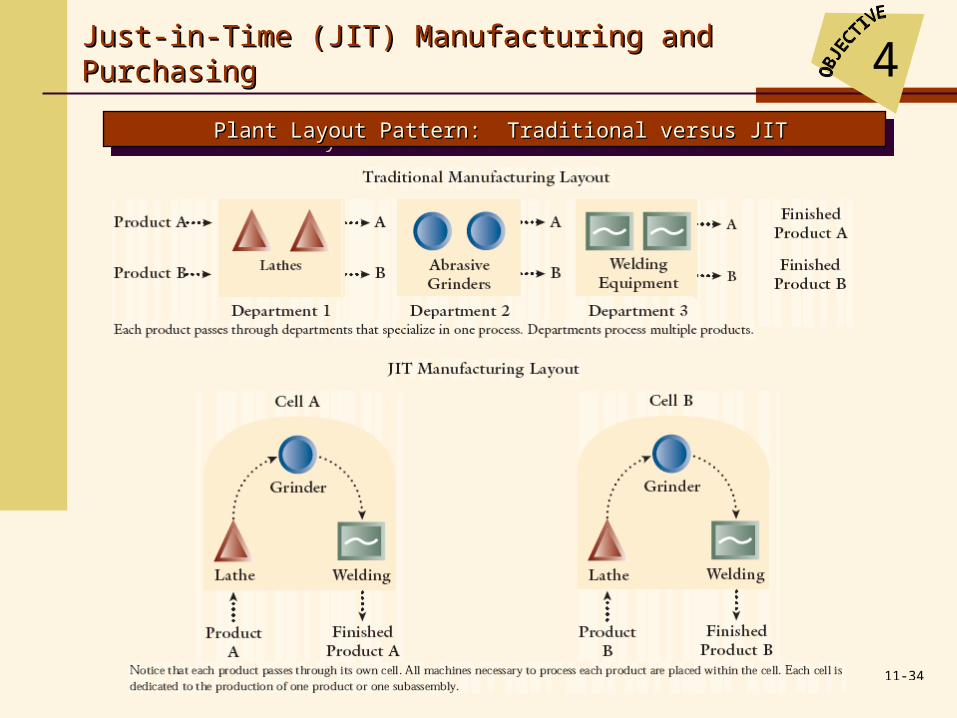
Just-in-Time (JIT) Manufacturing and PurchasingJust-in-Time (JIT) Manufacturing and Purchasing 4
Plant Layout Pattern: Traditional versus JITPlant Layout Pattern: Traditional versus JITPlant Layout Pattern: Traditional versus JITPlant Layout Pattern: Traditional versus JIT
11-35
5JIT and Its Effect on the JIT and Its Effect on the Cost Management Cost Management SystemSystem
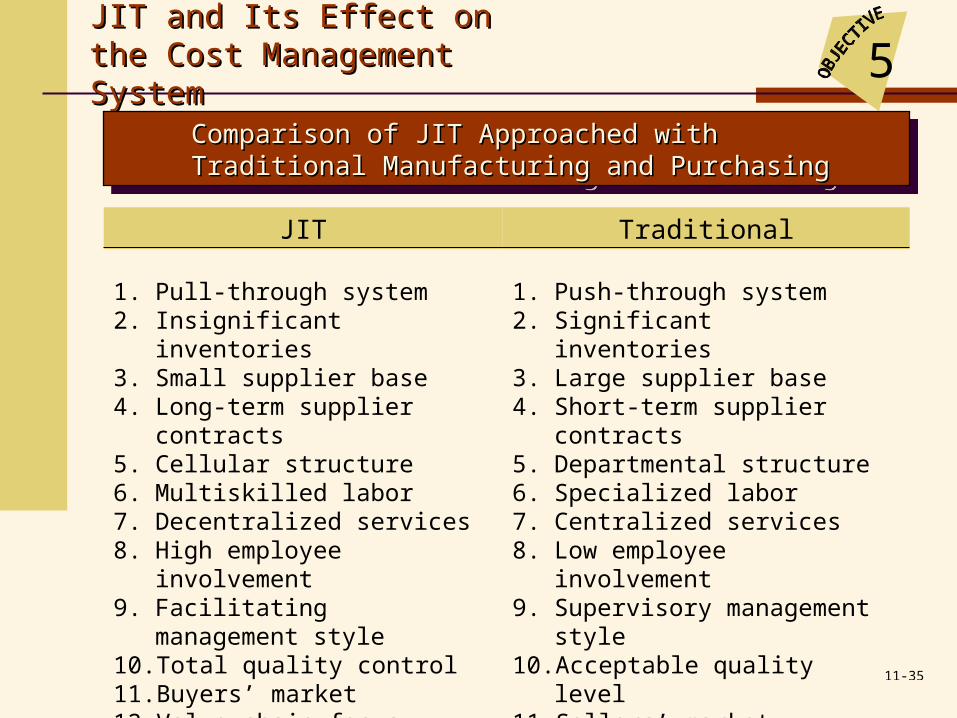
Comparison of JIT Approached with Traditional Comparison of JIT Approached with Traditional Manufacturing and PurchasingManufacturing and Purchasing
Comparison of JIT Approached with Traditional Comparison of JIT Approached with Traditional Manufacturing and PurchasingManufacturing and Purchasing
JIT Traditional
1. Pull-through system2. Insignificant inventories3. Small supplier base4. Long-term supplier contracts5. Cellular structure6. Multiskilled labor7. Decentralized services8. High employee involvement9. Facilitating management style10. Total quality control11. Buyers’ market12. Value-chain focus
1. Push-through system2. Significant inventories3. Large supplier base4. Short-term supplier contracts5. Departmental structure6. Specialized labor7. Centralized services8. Low employee involvement9. Supervisory management style10. Acceptable quality level11. Sellers’ market12. Value-added focus
11-36
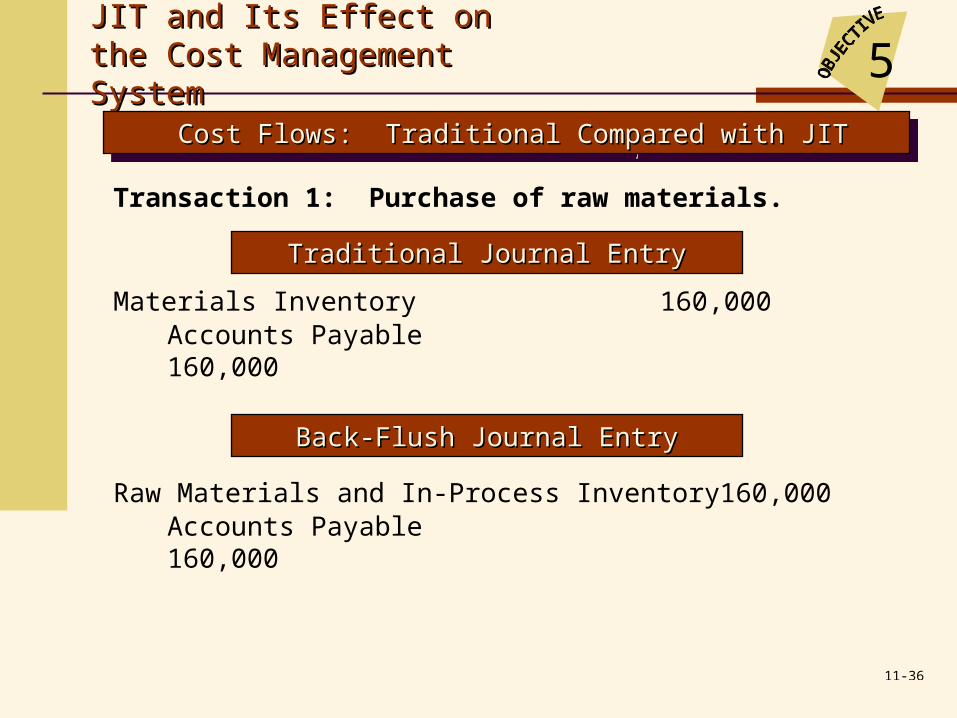
Transaction 1: Purchase of raw materials.
Back-FlushBack-Flush Journal Entry Journal Entry
Raw Materials and In-Process Inventory 160,000Accounts Payable160,000
5JIT and Its Effect on the JIT and Its Effect on the Cost Management Cost Management SystemSystem
Cost Flows: Traditional Compared with JITCost Flows: Traditional Compared with JITCost Flows: Traditional Compared with JITCost Flows: Traditional Compared with JIT
Traditional Journal EntryTraditional Journal Entry
Materials Inventory 160,000Accounts Payable160,000
11-37
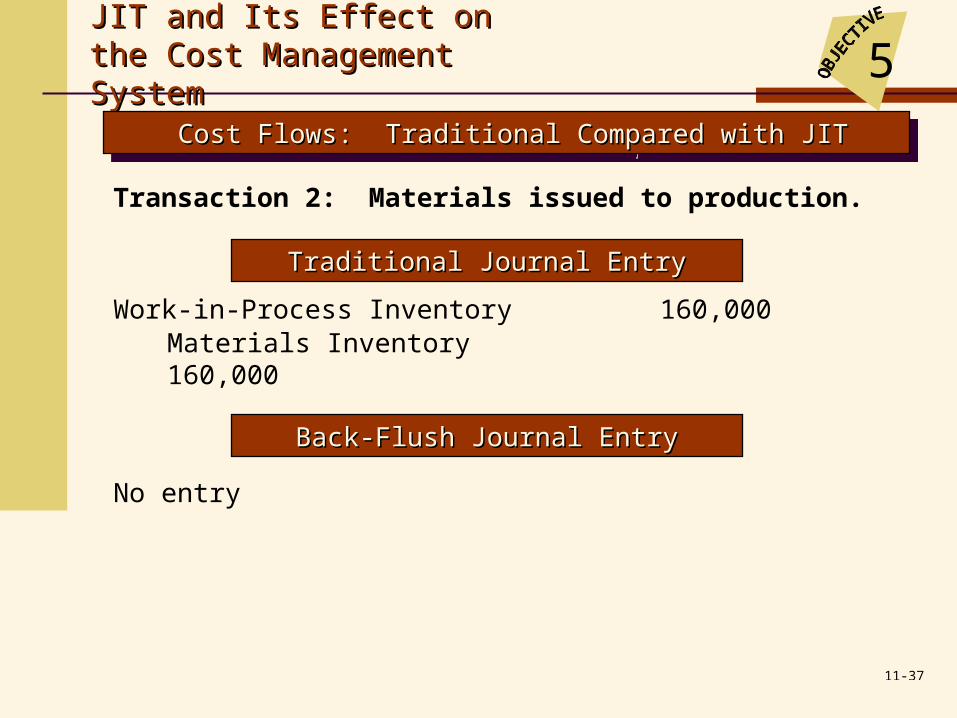
Transaction 2: Materials issued to production.
Traditional Journal EntryTraditional Journal Entry
Work-in-Process Inventory 160,000Materials Inventory160,000
Back-FlushBack-Flush Journal Entry Journal Entry
No entry
5JIT and Its Effect on the JIT and Its Effect on the Cost Management Cost Management SystemSystem
Cost Flows: Traditional Compared with JITCost Flows: Traditional Compared with JITCost Flows: Traditional Compared with JITCost Flows: Traditional Compared with JIT
11-38
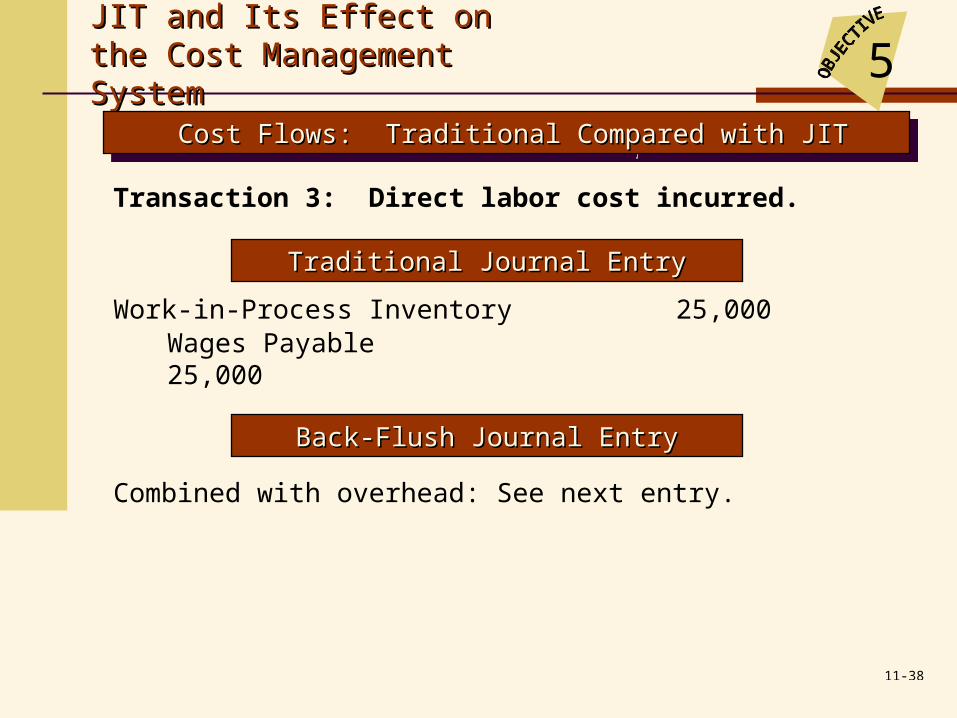
Transaction 3: Direct labor cost incurred.
Traditional Journal EntryTraditional Journal Entry
Work-in-Process Inventory 25,000Wages Payable25,000
Back-FlushBack-Flush Journal Entry Journal Entry
Combined with overhead: See next entry.
5JIT and Its Effect on the JIT and Its Effect on the Cost Management Cost Management SystemSystem
Cost Flows: Traditional Compared with JITCost Flows: Traditional Compared with JITCost Flows: Traditional Compared with JITCost Flows: Traditional Compared with JIT

11-39
Transaction 4: Overhead cost incurred.
Traditional Journal ntryTraditional Journal ntry
Overhead Control 225,000Accounts Payable225,000
Back-FlushBack-Flush Journal Entry Journal Entry
Conversion Cost Control 250,000Wages Payable25,000Accounts Payable225,000
5JIT and Its Effect on the JIT and Its Effect on the Cost Management Cost Management SystemSystem
Cost Flows: Traditional Compared with JITCost Flows: Traditional Compared with JITCost Flows: Traditional Compared with JITCost Flows: Traditional Compared with JIT

11-40
Transaction 5: Application of overhead.
Traditional Journal EntryTraditional Journal Entry
Work-in-Process Inventory 210,000Overhead Control210,000
Back-FlushBack-Flush Journal Entry Journal Entry
No entry.
5JIT and Its Effect on the JIT and Its Effect on the Cost Management Cost Management SystemSystem
Cost Flows: Traditional Compared with JITCost Flows: Traditional Compared with JITCost Flows: Traditional Compared with JITCost Flows: Traditional Compared with JIT
11-41
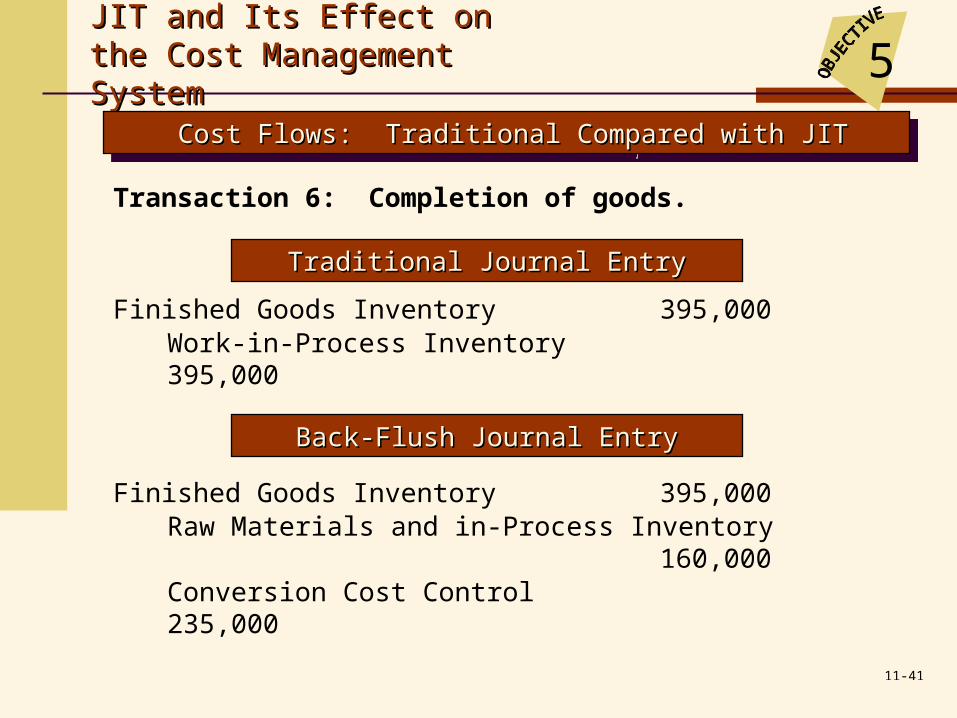
Transaction 6: Completion of goods.
Traditional Journal EntryTraditional Journal Entry
Finished Goods Inventory 395,000Work-in-Process Inventory395,000
Back-FlushBack-Flush Journal Entry Journal Entry
Finished Goods Inventory 395,000Raw Materials and in-Process Inventory160,000Conversion Cost Control235,000
5JIT and Its Effect on the JIT and Its Effect on the Cost Management Cost Management SystemSystem
Cost Flows: Traditional Compared with JITCost Flows: Traditional Compared with JITCost Flows: Traditional Compared with JITCost Flows: Traditional Compared with JIT
11-42
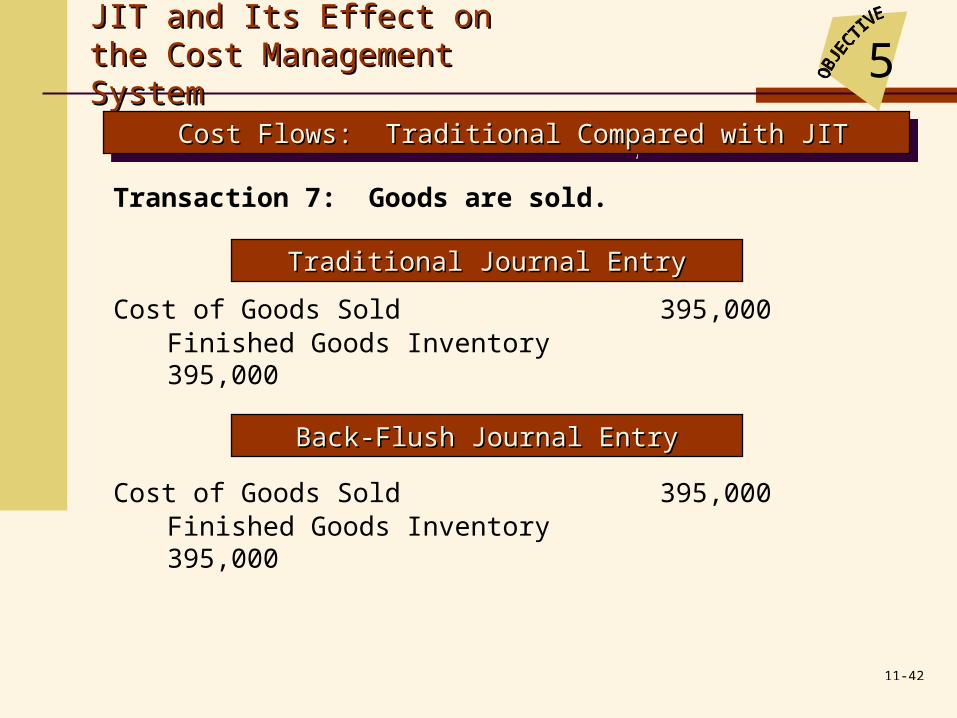
Transaction 7: Goods are sold.
Traditional Journal EntryTraditional Journal Entry
Cost of Goods Sold 395,000Finished Goods Inventory395,000
Back-FlushBack-Flush Journal Entry Journal Entry
Cost of Goods Sold 395,000Finished Goods Inventory395,000
5JIT and Its Effect on the JIT and Its Effect on the Cost Management Cost Management SystemSystem
Cost Flows: Traditional Compared with JITCost Flows: Traditional Compared with JITCost Flows: Traditional Compared with JITCost Flows: Traditional Compared with JIT

11-43
Transaction 8: Variance is recognized.
Traditional Journal EntryTraditional Journal Entry
Cost of Goods Sold 15,000Overhead Control15,000
Back-FlushBack-Flush Journal Entry Journal Entry
Cost of Goods Sold 15,000Conversion Cost Control15,000
5JIT and Its Effect on the JIT and Its Effect on the Cost Management Cost Management SystemSystem
Cost Flows: Traditional Compared with JITCost Flows: Traditional Compared with JITCost Flows: Traditional Compared with JITCost Flows: Traditional Compared with JIT
11-44
End of End of Chapter 11Chapter 11