10th nepc summer school - event report poverty … · 10th nepc summer school - event report...
TRANSCRIPT

10th NEPC SUMMER SCHOOL - Event Report
Poverty in Education: What Do We Know and
What Can We Do?
July 2 – 8, 2017
Kosovo/ Kosova (Amazona, K.K. Kastriot, Fshati Azizi - Mitrovicë)
www.edupolicy.net
Network of Education Policy
Centers (NEPC) is an international
non-governmental membership
organization that gathers 23
institutional members from 18
countries. NEPC has been founded in
2006 and formally established in 2008.
NEPC members are public and civil-
society organizations dealing with
education at different levels from
educational research and policy
analysis to teacher training and school-
based activities.
NEPC Secretariat, established in
Zagreb in 2006, has implemented over
a dozen multi-country projects
addressing and exploring current
issues in education, driven by the need
for independent and information-based
policy analyses, advocacy for equity,
and effective, sustainable solutions in
education policy processes in the last
couple of years.
The network’s contribution to improving
education policies in this region is
reflected in its highly diverse project
portfolio, which includes large projects
involving several countries.
Summer School is a traditional NEPC
annual learning event for teachers,
policy-makers, policy-analysts,
practioners, researchers and education
friends from all over the world.
Summer schools have covered wide
range of topics related to education
(teachers’ policy, inclusive education,
education for sustainability, managing
change and uncertainty) with the aim
of inspiring change in education
system and were attended by about 25
participants every year.
Summer School gathers faculty from
prestigious universities and highly
experienced trainers from all over the
world and it combines theory, practice
and interactive sessions.
Trainers & Faculty:
Radmila Rangelov Jusović, Executive
Director, Center for Educational Initiatives Step
by Step, Sarajevo, Bosnia and Herzegovina
Nedim Krajišnik, Youth Program Coordinator,
Center for Educational Initiatives Step by Step,
Sarajevo, Bosnia and Herzegovina
Klaudija Šterman Ivančič, researcher at the
Educational Research Institute, Ljubljana,
Slovenia (PISA – Day 2)
Mojca Štraus, Ministry of Education, Science
and Sports, Slovenia (PISA – Day 2)

Content
• Introduction ………………………………………………………………………….1
• Day by Day – Learning Sessions…………………………………………………..2
• Analyses of current situation and data in involved countries……………………3
• Bronfenbrenner's Bioecological Model of Development ………………………...7
• Effects of poverty on children………….…………………………………………...9
• Definitions of poverty……………………………………………………………….10
• International Assessment & Educational Equity - Programme for International
Student Assessment PISA)………...………………………………....................12
Average achievement by country – Scientific Literacy (2015)…..……………….…….13
PISA Educational Equity Analysis - Framework of Examining Equity in PISA…...…..13
Disadvantage in Education……………………………………........……………….…….14
Disadvantage and Achievement; Disadvantaged vs. Advantaged Achievement…….15
PISA Indicators of Educational Equity……………………………………………….…...16
Predicitve power of socio-economic and cultural status..…………………………..17
Analysis of Mediating Factors - Addressing Poverty in Education………………….....18
Aspects of resiliency (Werner, 1989); What PISA measures………..………………....19
Well-being in PISA………………………………………………………………….……….20
• Prejudices and stereotypes, discrimination and oppression………..………….21
• Seven forms of bias in curriculum materials……………………………………..22
• Blame the victim theory……………...…………………………………………….23
• Inter-Cultural Learning Session…………………………………………………...24
• Group work summaries.……………………………………………………………26
• Advocacy…………………………………………………………………………....32
• Advocacy campaign ideas…...…………………………………………………....33
• In conclusion………………………………………………………………………...36
• Further readings…………………………………………………………………….37
• List of participants……………………………………………………..……………38

1
Introduction
The main topic of Summer School 2017 was social justice with strong accent on the
effect of poverty in education. NEPC started exploring the issue of poverty and
education in 2014 and since has confirmed its starting belief that, in the region,
poverty in connection to education is not being directly addressed. It seems that
educators often put on a head blind and ignore the issue. In many cases in the belief
that solving the problem of poverty is beyond education.
The five day interactive programme provided knowledge and data about effects of
poverty in education and involved participants in designing research and school
based activities that can assist in mediating the effects of poverty
The countries of NEPC region face numerous economic and social challenges
caused by, among other things, long term economic recession. The situation
regarding the number of people living at risk of poverty or social exclusion is
particularly grave as statistics show there are high percentages of the region’s
population in this group. Poverty and social exclusion harm individuals and limit their
opportunities to achieve full potential by affecting their wellbeing and lowering
educational outcomes. This situation has heavy implications for both education
systems and schools.
The Summer School was based on the understanding that education has direct
impact on social justice and that students from low socio economic background, living
in poverty or at risk of poverty are multiply disadvantaged learners. Research
literature consistently shows that parental socio-economic status is related to
academic achievement of their children. Research (see: Further readings) also
shows that children living in poverty frequently have poor literacy and language skills
and have limited access to reading materials that negatively affects the learning
results; growing up in poverty contributes to having a negative perspective about the
future; children with lower socio-economic status background are often victims of
bullying in schools.
One of the measures of social justice in education is educational equity ie the degree
to which student academic achievements are patterned by group differences. In more
equitable national education systems group differences such as socio-economic
status have a minor influence on students’ academic achievement. Comparative
research can indicate how educational policies, structures and practices either
mediate or exacerbate group differences in student academic achievements. The
Programme for International Student Assessment (PISA) is an especially useful
cross-national dataset for measuring equity however national data sets should be
especially important for policy makers and practioners in detecting the national issues
and should be used for improvement of educational systems.
2
The main questions this year's program aimed to answer were:
* Are the social policies that are in place enough to address the issue of
poverty?
* Are schools perpetuating classism in society?
* Which school policies and practices contribute to alleviating the issue of
poverty in education?
* How to involve students, parents and local communities in design and
implementation of school policies and practices
* Can good practices for poverty alleviation contribute to segregation and
labelling?
* What relevant data is available through international assessment systems
such as PISA and how to exploit it through secondary analysis?
* How can secondary analysis of international assessment system of student’s
achievement, such as PISA, assist in addressing the issue of poverty and its impact
in education?
* Analyses of current situation and data in participating countries especially in
regard to low SES students.
Day by Day – Learning Sessions
Topics covered at this year's School included:
• Poverty as a concept
• Definition of poverty (historical, economic, social, hidden)
• Deconstruction of poverty
• Education & poverty
• Analyses of current situation and data in involved (participant) countries
• PISA (and Poverty)
• Ideas for Research Projects on Poverty
• Ideas for School Projects Tackling Poverty
• Advocacy Ideas
In addition to talks, lectures and workshops, participants were paired up to follow and
report back on certain issues and questions raised throughout each day. During
reflective sessions at the beginning of each following day the groups reflected upon
the topic they were assigned to follow (such as: Questions unanswered; Something
that happened that was 'out of this world'; and more). These morning reflections
enabled the group to revise the lessons learnt from the day before and provided the
introduction into discussions ahead.
3
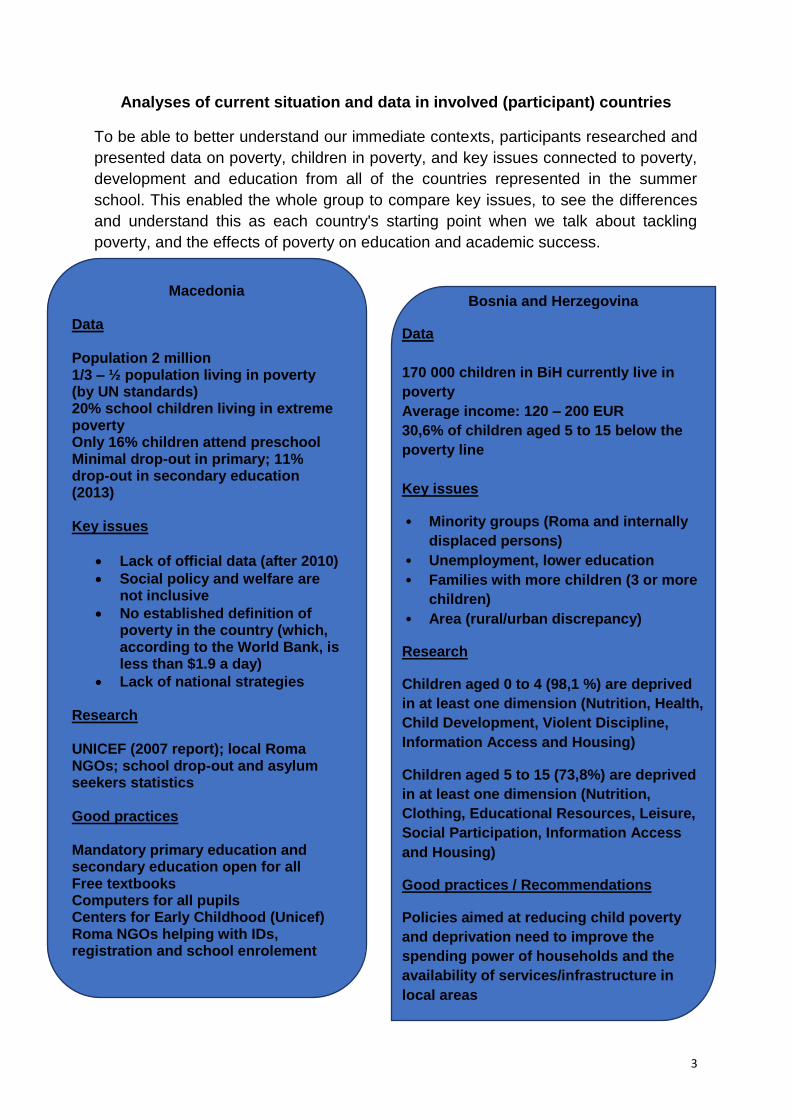
Analyses of current situation and data in involved (participant) countries
To be able to better understand our immediate contexts, participants researched and
presented data on poverty, children in poverty, and key issues connected to poverty,
development and education from all of the countries represented in the summer
school. This enabled the whole group to compare key issues, to see the differences
and understand this as each country's starting point when we talk about tackling
poverty, and the effects of poverty on education and academic success.
Macedonia Data Population 2 million 1/3 – ½ population living in poverty (by UN standards) 20% school children living in extreme poverty Only 16% children attend preschool Minimal drop-out in primary; 11% drop-out in secondary education (2013) Key issues
• Lack of official data (after 2010)
• Social policy and welfare are not inclusive
• No established definition of poverty in the country (which, according to the World Bank, is less than $1.9 a day)
• Lack of national strategies Research UNICEF (2007 report); local Roma NGOs; school drop-out and asylum seekers statistics Good practices Mandatory primary education and secondary education open for all Free textbooks Computers for all pupils Centers for Early Childhood (Unicef) Roma NGOs helping with IDs, registration and school enrolement
Bosnia and Herzegovina
Data
170 000 children in BiH currently live in
poverty
Average income: 120 – 200 EUR
30,6% of children aged 5 to 15 below the
poverty line
Key issues
• Minority groups (Roma and internally
displaced persons)
• Unemployment, lower education
• Families with more children (3 or more
children)
• Area (rural/urban discrepancy)
Research
Children aged 0 to 4 (98,1 %) are deprived
in at least one dimension (Nutrition, Health,
Child Development, Violent Discipline,
Information Access and Housing)
Children aged 5 to 15 (73,8%) are deprived
in at least one dimension (Nutrition,
Clothing, Educational Resources, Leisure,
Social Participation, Information Access
and Housing)
Good practices / Recommendations
Policies aimed at reducing child poverty
and deprivation need to improve the
spending power of households and the
availability of services/infrastructure in
local areas

4
Albania
Data
Nearly ¼ of the population lives in
extreme poverty, surviving with 2
dollars a day. That is 800 000 people.
Key issues
• The majority of population
comes from rural areas (51%)
• Political adjustment from
communist planned economy to
free market – people are unable
to sell their products.
Research: World vision; World Bank;
Instat (Albanian Institute of Statistics)
Good practices: Advocacy actions;
Improving of infrastructure
Turkey
Data: 25,3% of children in poverty, in 2013 (OECD). Poverty is
defined as earning less than 50% of the national annual income.
Key issues
• Syrian refugee children: 1,000,000 of Syrian children are
school age
• Child labour, especially in agriculture: 2,000,000 of children
working, a million of them cannot go to school
• 56 children lost their lives due to “accidents” at work, in
2016
• Early marriage
Good practices: Conditional Cash Transfer. However -- does it
work?
Kosovo
Data: 17,6 % of population living
in complete poverty with 1.82
euro per day; 5,2% with 1,30
euro per day
Key Issues
• Unemployment,
• Small salaries (women
especially)
• Absence of supplements
for children
• Insufficient education
Research: ASK - the Kosovo
Agency of Statistcs, World
Bank, United Nations
Good practices: Trainings –
Workshops, Stipends,
Mentoring, Tutoring, Mediators

5
Slovenia
Data: 2010 -> 15% at risk of poverty, 2015 -> 17% at risk, Poverty: 6%
Key Issues: low achievement, social exclusion, stigmatisation, weak access to social
educational services, weak life prospects, regional inequality
Research: Erasmus policy projects (Hand in hand), Raolla project, Tita project,
National assessment, International assessments
Good practices: Understanding that it is everybody’s (whole – school) responsibility,
subsidies, Activation of low achieving schools in raising reading literacy.
Mongolia
Data: 40% poor or very poor; 10% unemployed (registered); 10% migrant
workers (S. Korea, US, etc.)
Key Issues
• School dropout (school/education related costs)
• Child labour
• Stunting (restricted physical development-especially among young
children)
• Children of migrant workers taken care by grandparents, other
relatives or by themselves
Research: Household living standards measurement survey (Wb, Min. of
Hdsw) 2013, 2017 (ongoing), Multi indicator cluster survey (Unicef)
Good practice: Free textbook provision

6
Croatia
Data: 21 – 22% preschool children in poverty (2015)
20,9% up to 17 years old in poverty (2016)
General population 20% Zagreb 6% vs Karlovac county,
Vukovar – Srijem county about 30% (EU 17%)
7th in EU ranked in poverty
Key Issues: unemployment, regional differences, rural / urban,
one-parent families, 3 + children, parents who rely solely on
agriculture, Roma (2-3 times at higher risk of poverty)
Research: preschool Unicef 2015, Ministry of Regional
development RDC, RECI study 2015, UNDP, CPS –
INEQUALITIES
Good practices: REYN – Advocacy actions, awareness raising,
promotion of positive role models, state scholarship
Serbia
Data: ¼ of all children younger than 19 received aid from the government
20% of kids receive some sort of social aid
Key issues: unemployed parents; education level of parents;
poor design of major benefit programs; discrimination (Roma, children with
disabilities…); regional differences
Research: PEP, UK aid – Reduction of child poverty in Serbia, CEP, Unicef – Support
for educating children from poor families
Good practice: state aid

7
Bronfenbrenner's Bioecological Model of Development
Urie Bronfenbrenner was a Russian-American developmental psychologist whose
bioecological model was integral to the formation of American Headstart pre-
kindergarten programs. The model suggests the interactions between the individual
and their environment, categorized into various systems, shape their development
over time.
NESTED SYSTEMS
Bronfenbrenner conceptualized four ecological systems that an individual interacted
with, each nested within the others. Listed from closest to the person to furthest:
1. Microsystem The prefix “micro” comes from the Greek for “small,” and is the first
and most immediate layer of the nested systems. It encompasses an individual’s
human relationships, interpersonal interactions and immediate surroundings. An
example of this system would be the relationship between an individual and his or her
parents, siblings, or school environment.
2. Mesosystem The second layer from the individual, surrounding the microsystem
and encompassing the different interactions between the characters of the
microsystem. For example, the relationship between the individual’s family and their
school teachers or administrators. In order for an interaction to be considered part of
the mesosystem, it has to be a direct interaction between two aspects of the
microsystem that influences the development of the individual.
3. Exosystem The exosystem is the third layer, and contains elements of the
microsystem which do not affect the individual directly, but may do so indirectly. For
example, if a parent were to lose their job or have their hours cut back, this would
affect their child in an indirect way such as financial strain or increased parental
stress.
4.Macrosystem The prefix “macro” comes from the Greek for “large,” and is used
because this system was thought to be all-encompassing. The fourth and outermost
layer of the bioecological model, it encompasses cultural and societal beliefs and
programming that influence an individual’s development. Examples of this would
include gender norms or religious influence.
CRITICISM OF THE EARLY MODEL
Bronfenbrenner’s early model of the bioecological system has sometimes been
criticized for not emphasizing the active role of the individual in his or her own
development. As such, sometimes the individual’s own biological and identifying
characteristics, such as age, health, sex or gender are considered the unofficial first
layer of the nested systems.

8
In later iterations, a fifth stage is considered part of the bioecological model, called
the chronosystem. This system focuses on the interaction between the various
systems and how they affect one another over time. One instance of this would be
parents scolding a child for disobedience, which is an instance of microsystem-
macrosystem interaction. While the parents are members of the microsystem, they
are reinforcing a cultural belief that children should always listen to their parents. The
assumption is that over time, the child would grow up to be obedient.
LATER MODELS
Process — Person — Context — Time (PPCT)
This model was later adapted to include the chronosystem, based on four
establishing principles and their interactions which were Bronfenbrenner’s original
basis for the bioecological theory:
Process — The developmental processes that happen through the systematic
interactions mentioned above. What Bronfenbrenner referred to as proximal
processes functioned as the primary mechanism of an individual’s development.
Person — This principle was establish to indicate the role of the individual and their
personal characteristics in social interactions and their individual development. These
characteristics include age, sex, gender, physical or mental health, and others. Some
of these characteristics are more visible than others (such as age) and as such, are
more easily measured over time.
Context — The (now five) systems of the bioecological model serve as the context
for an individual’s development — the micro-, meso-, exo-, macro-, and
chronosystems.
Time — The most essential element of the bioecological model. Because this model
measures an individual’s development, these interactions occur on a measurable,
chronological scale. Time influences the systemic interactions within an individual’s
lifespan as well as across generations, such as in the case of “family values,” a set of
morals or beliefs that are passed down between generations and shape
development. This would be an example of microsystem interaction over time.
REFERENCES
1. Bronfenbrenner, Urie, and Pamela A. Morris. “The bioecological model of human
development.” Handbook of Child Psychology (2006).
2. Bronfenbrenner, U., & Ceci, S. J. (1994). Nature-nurture reconceptualized in developmental
perspective: A bioecological model. Psychological Review, 101(4), 568-586.
3. Bronfenbrenner, U. (1994). Ecological models of human development. Readings on the
Development of Children, 2(1), 37-43.

9
Effects of poverty on children
Poverty and its attendant risk factors are damaging to the physical, socioemotional,
and cognitive well-being of children and their families. Topics covered in group
conversation regarding the issue were: Health and nutrition; Vocabulary; Non-
cognitive skills; Hope and expectations; Chronic stress; Parents and relationships;
Social distance.
Practice session on four different imaginable scenario-assignments when it comes to
schools effected by poverty aimed at envisioning concrete measures that could ease
the negative effects of poverty on imagined students of described areas.
• You are teachers in a small rural school / in a school in a small industrial
town/ in a school near large Roma settlement/ in a downtown school --
It's August and you are preparing plans for the next school year. What internal
and external factors influences your students? What
problems/obstacles/challenges you might anticipate based on previous
experience? What strategies of prevention and intervention you might prepare
to overcome challenges and help each child thrive?
Assignment
Think about your school and how the following school activities contribute to the
social cohesion:
Extracurricular activities, exhibitions, competitions, school performances, best
student selection, excursions and fieldtrips, textbooks, school lunch, holidays and
celebrations, school rules and procedures, school aid and advocacy actions, school
projects, school symbols.

10
Definitions of poverty
(Dictionary)
Condition where people's basic needs for food, clothing, and shelter are not being
met. Poverty is generally of two types: (1) Absolute poverty is synonymous with
destitution and occurs when people cannot obtain adequate resources (measured in
terms of calories or nutrition) to support a minimum level of physical health. Absolute
poverty means about the same everywhere, and can be eradicated as demonstrated
by some countries. (2) Relative poverty occurs when people do not enjoy a certain
minimum level of living standards as determined by a government (and enjoyed by
the bulk of the population) that vary from country to country, sometimes within the
same country.
(Unesco)
In pure economic terms, income poverty is when a family's income fails to meet a
federally established threshold that differs across countries. Typically it is measured
with respect to families and not the individual, and is adjusted for the number of
persons in a family. Economists often seek to identify the families whose economic
position (defined as command over resources) falls below some minimally
acceptance level.1Similarly, the international standard of extreme poverty is set to
the possession of less than 1$ a day.
Absolute poverty measures poverty in relation to the amount of money necessary to
meet basic needs such as food, clothing, and shelter. The concept of absolute
poverty is not concerned with broader quality of life issues or with the overall level of
inequality in society. The concept therefore fails to recognise that individuals have
important social and cultural needs. This, and similar criticisms, led to the
development of the concept of relative poverty. Relative poverty defines poverty in
relation to the economic status of other members of the society: people are poor if
they fall below prevailing standards of living in a given societal context. An important
criticism of both concepts is that they are largely concerned with income and
consumption.
Three perspectives are relevant; the income perspective indicates that a person is
poor only if his or her income is below the country's poverty line (defined in terms of
having income sufficient for a specified amount of food); the basic needs perspective
goes beyond the income perspective to include the need for the provision by a
community of the basic social services necessary to prevent individuals from falling
into poverty; and finally, the capability (or empowerment)

11
(WHO)
Poverty is associated with the undermining of a range of key human attributes,
including health. The poor are exposed to greater personal and environmental health
risks, are less well nourished, have less information and are less able to access
health care; they thus have a higher risk of illness and disability. Conversely, illness
can reduce household savings, lower learning ability, reduce productivity, and lead to
a diminished quality of life, thereby perpetuating or even increasing poverty.
Poverty is often defined in absolute terms of low income – less than US$2 a day, for
example. But in reality, the consequences of poverty exist on a relative scale. The
poorest of the poor, around the world, have the worst health. Within countries, the
evidence shows that in general the lower an individual’s socioeconomic position the
worse their health. There is a social gradient in health that runs from top to bottom of
the socioeconomic spectrum. This is a global phenomenon, seen in low, middle and
high income countries.
(UNITED NATIONS)
Fundamentally, poverty is the inability of having choices and opportunities, a
violation of human dignity. It means lack of basic capacity to participate effectively in
society. It means not having enough to feed and clothe a family, not having a school
or clinic to go to, not having the land on which to grow one's food or a job to earn
one's living, not having access to credit. It means insecurity, powerlessness and
exclusion of individuals, households and communities. It means susceptibility to
violence, and it often implies living in marginal or fragile environments, without
access to clean water or sanitation.
(WORLD BANK)
Poverty is pronounced deprivation in well-being, and comprises many dimensions. It
includes low incomes and the inability to acquire the basic goods and services
necessary for survival with dignity. Poverty also encompasses low levels of health
and education, poor access to clean water and sanitation, inadequate physical
security, lack of voice, and insufficient capacity and opportunity to better one's life.
Poverty is usually measured as either absolute or relative (the latter being actually an
index of income inequality).

12
International Assessment & Educational Equity - Programme for International
Student Assessment (PISA)
• Introduction to PISA • Relevant data for low SES • Main findings of PISA 2015
regrading low SES (focus on NEPC countries) • How to read the data? • Examples
of Secondary Analyses • Low SES students’ vs Disadvantaged Schools implication
for policy & practice • Task for participants: What secondary analyses do I need and
for what?
What is PISA?
The Programme for International Student Assessment (PISA) is a triennial
international survey which aims to evaluate education systems worldwide by testing
the skills and knowledge of 15-year-old students. In 2015 over half a million students,
representing 28 million 15-year-olds in 72 countries and economies, took the
internationally agreed two-hour test. Students were assessed in science,
mathematics, reading, collaborative problem solving and financial literacy. The
results of the 2015 assessment were published on 6th December 2016.
[The 2017 Summer School report brings only a selection of the extensive
presentation on PISA. Should you be interested in the whole presentation, please
contact the NEPC Secreteriat.]
PISA 2015 – Summer School 2017 participant countries
Sample (n) Population of 15-year-old students (N)
Albania 5215 40896
Croatia 5809 40899
Kosovo 4826 22333
FYR Macedonia 5324 15847
Slovenia 6406 16774
Turkey 5895 925366

13
Average achievement by country –- Scientific Literacy (2015)
PISA Educational Equity Analysis
Framework of Examining Equity in PISA
PISA defines equity in education as providing all students, regardless of gender,
family background or socio-economic status, with high-quality opportunities to benefit
from education.
Mean
score
Comparison
country/economy
Countries and economies whose mean score is not statistically significantly
different from the comparison country's/economy's score
556 Singapore
538 Japan Estonia, Chinese Taipei
…
513 Slovenia B-S-J-G (China), Korea, New Zealand, Australia, United Kingdom, Germany,
…
…
…
475 Croatia Italy, Hungary, Lithuania, Iceland
…
427 Albania Romania, Cyprus, Moldova, Turkey, Trinidad and Tobago, Thailand
425 Turkey Romania, Cyprus, Moldova, Albania, Trinidad and Tobago, Thailand, Costa Rica, Qatar
…
384 FYR Macedonia Lebanon, Tunisia
378 Kosovo Algeria
…

14
Examining Equity in PISA
• It refers to creating the conditions for minimising any adverse impact of
students’ socio-economic status or immigrant background on their
performance.
• This understanding of equity in education enjoys wide support across
countries and is aligned with the Sustainable Development Goals (SDG),
adopted by the United Nations in September 2015.
• The goal has a truly global reach, as no country, rich or poor, can yet claim to
have attained it.
• By providing extensive and internationally comparable information on students’
skills and their family and community backgrounds, PISA offers a unique
measure to assess progress towards the SDGs and to analyse inclusion and
fairness in education from an international perspective (OECD, 2015).
Disadvantage in Education
Main indicator by which socio-economic disadvantage is defined in PISA is indicator
of socio-economic and cultural status – ESCS. The PISA index ESCS is derived from
three variables related to family background: parents' highest level of education
(PARED), parents' highest occupation status (HISEI), and home possessions
(HOMEPOS), including books in the home (self-reported dana). Index is designed on
the scale with OECD average 0 and standard deviation 1.
In this analysis:
Disadvantaged students:
achievement below 33rd
percentile
Advantaged students:
achievement above 67th
percentile
-2,50
-2,00
-1,50
-1,00
-0,50
0,00
0,50
1,00
Albania Croatia Kosovo FYRMacedonia
Slovenia Turkey
INDEX of ESCS
All 33rd percentile 67th percentileindex
15
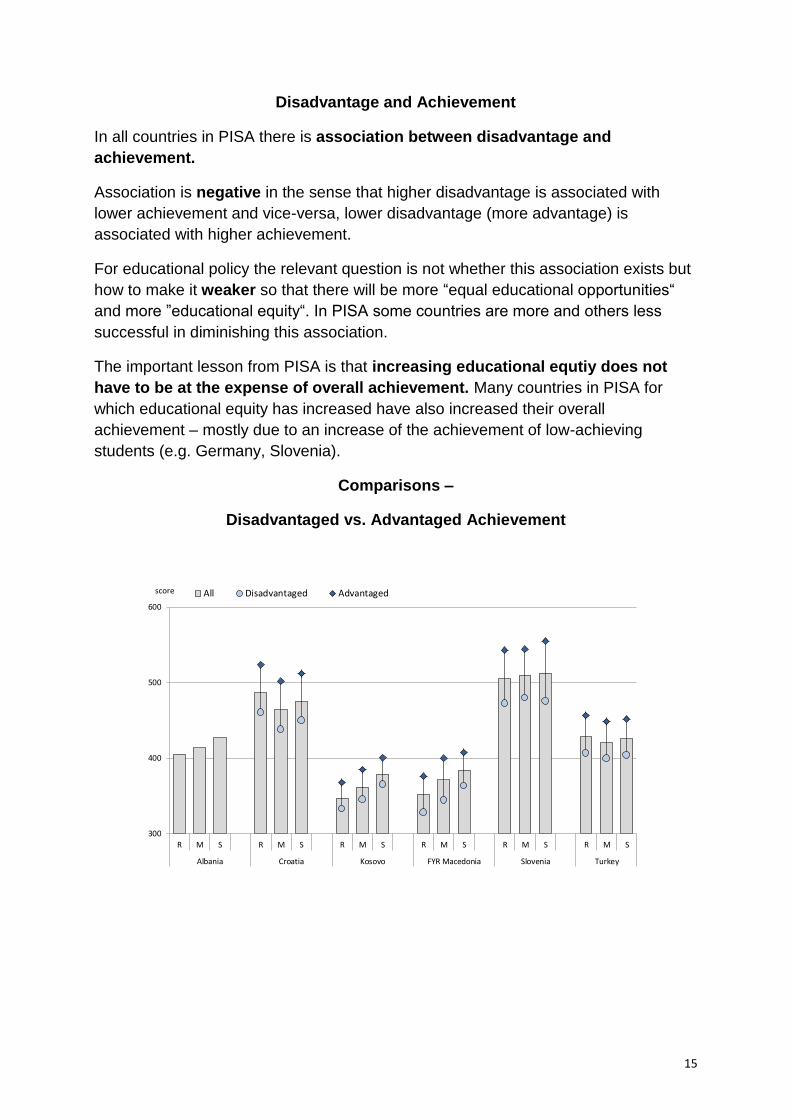
Disadvantage and Achievement
In all countries in PISA there is association between disadvantage and
achievement.
Association is negative in the sense that higher disadvantage is associated with
lower achievement and vice-versa, lower disadvantage (more advantage) is
associated with higher achievement.
For educational policy the relevant question is not whether this association exists but
how to make it weaker so that there will be more “equal educational opportunities“
and more ”educational equity“. In PISA some countries are more and others less
successful in diminishing this association.
The important lesson from PISA is that increasing educational equtiy does not
have to be at the expense of overall achievement. Many countries in PISA for
which educational equity has increased have also increased their overall
achievement – mostly due to an increase of the achievement of low-achieving
students (e.g. Germany, Slovenia).
Comparisons –
Disadvantaged vs. Advantaged Achievement
300
400
500
600
R M S R M S R M S R M S R M S R M S
Albania Croatia Kosovo FYR Macedonia Slovenia Turkey
All Disadvantaged Advantagedscore

16
PISA Indicators of Educational Equity
PISA uses several indicators of educational equity to monitor the achievement gap
between disadvantaged and advantaged students:
1. Percent of low-achieving students
- achivement below Level 2 on the PISA scales
- (minimal) educational opportunities for all
- ET2020 goal for this percent to be below 15 % in each EU country
2. Socio-economic gradient
- average increase of achievement associated with one unit increase (one standard
deviation) of ESCS – slope of the gradient
- percent explained variance in achievement with measure of ESCS – strength of the
gradient
3. Percent of resilient students
- disadvantaged students attaining high achievement
Attainment of Levels by Country ET2020 targets – PISA Reading literacy 2015
100 80 60 40 20 0 20 40 60 80 100
Slovenia
Croatia
Turkey
Albania
FYR Macedonia
Kosovo
%
Students at or below Level 1a
Students at or above Level 2
Level 6
Level 5
Level 4
Level 3
Level 2
Level 1a
Level 1b
Below Level 1b

17
Above: PISA 2012 Mathematics – Index of Social, Economic and Cultural Status
Predicitve power of ESCS
18
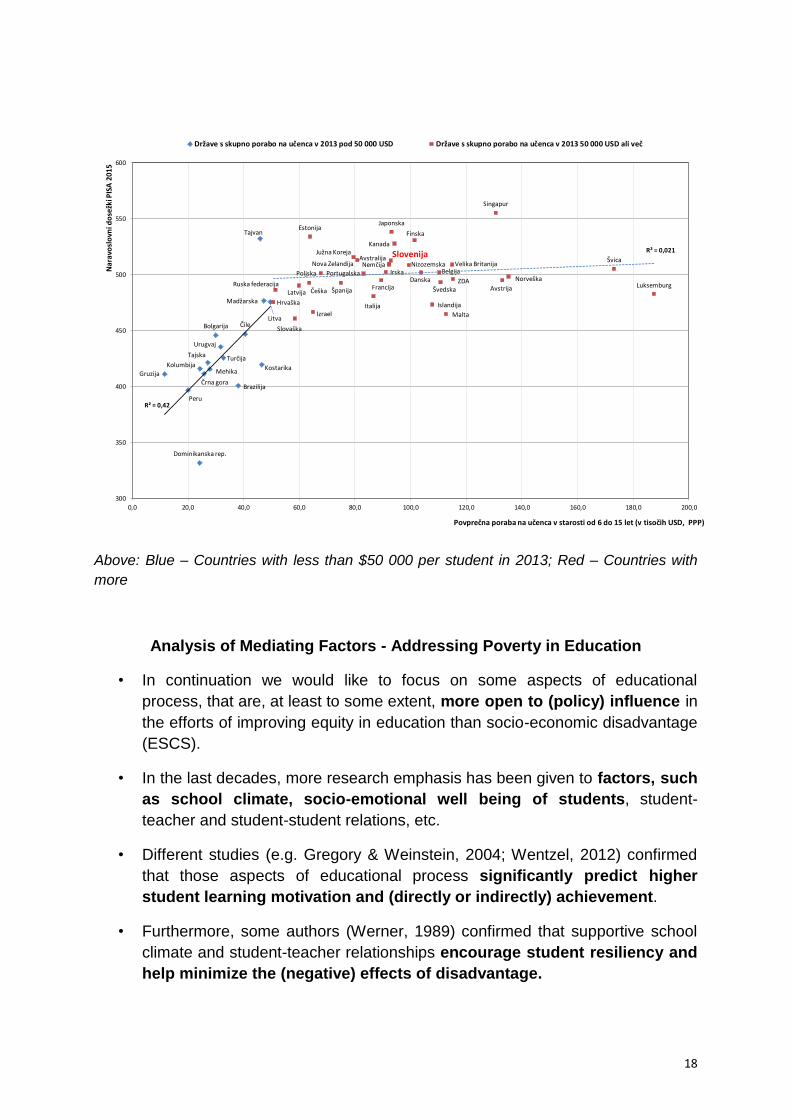
Above: Blue – Countries with less than $50 000 per student in 2013; Red – Countries with
more
Analysis of Mediating Factors - Addressing Poverty in Education
• In continuation we would like to focus on some aspects of educational
process, that are, at least to some extent, more open to (policy) influence in
the efforts of improving equity in education than socio-economic disadvantage
(ESCS).
• In the last decades, more research emphasis has been given to factors, such
as school climate, socio-emotional well being of students, student-
teacher and student-student relations, etc.
• Different studies (e.g. Gregory & Weinstein, 2004; Wentzel, 2012) confirmed
that those aspects of educational process significantly predict higher
student learning motivation and (directly or indirectly) achievement.
• Furthermore, some authors (Werner, 1989) confirmed that supportive school
climate and student-teacher relationships encourage student resiliency and
help minimize the (negative) effects of disadvantage.
Litva
Madžarska
Kostarika
Tajvan
Čile
Brazilija
Turčija
Urugvaj
Bolgarija
Mehika
Tajska
Črna gora
Kolumbija
Dominikanska rep.
Peru
Gruzija
Luksemburg
Švica
Norveška
Avstrija
Singapur
ZDA
Velika Britanija
Malta
Švedska
Belgija
Islandija
Danska
Finska
Nizozemska
Kanada
Japonska
SlovenijaAvstralijaNemčija
Irska
Francija
Italija
Portugalska
Nova Zelandija
Južna Koreja
Španija
Poljska
Izrael
Estonija
ČeškaLatvija
Slovaška
Ruska federacija
Hrvaška
R² = 0,42
R² = 0,021
300
350
400
450
500
550
600
0,0 20,0 40,0 60,0 80,0 100,0 120,0 140,0 160,0 180,0 200,0
Nar
avo
slo
vni d
ose
žki P
ISA
201
5
Povprečna poraba na učenca v starosti od 6 do 15 let (v tisočih USD, PPP)
Države s skupno porabo na učenca v 2013 pod 50 000 USD Države s skupno porabo na učenca v 2013 50 000 USD ali več

19
• Werner and colleagues (1982 and 1989) propose 3 groups of factors that
can help students thrive in an educational context despite their poorer socio-
economical background (disadvantage).
Aspects of resiliency (Werner, 1989)
What PISA measures
• In this context of importance of relational, socio-emotional and motivational
factors of student achievement, PISA measures so-called STUDENT WELL-
BEING.
• Concept of student‘s well being is complex and multi-dimensional. It is a
product of student personal characteristics, self-perceptions, social
surroundings, social interactions, cultural values and norms and social change
over time (OECD, 2017; Ryff & Singer, 1998).
EMOTIONAL ASPECTS OF
RELATIONSHIPS IN THE FAMILY
(emotional support, warm relationships)
SUPPORTIVE SOCIAL SYSTEM AND
RELATIONSHIPS OUTSIDE FAMILY
(school and relationship with supportive teacher in
the first place)
STUDENT‘S PERSONAL
TRAITS (easy temperament, adaptability,
internal locus of control, intellectual capabilities, sense
of humour)
Relationships and
socio-emotional
support in schools
are important!
20
Well-Being in PISA
• In PISA, student‘s well-being is investigated through some psychological,
cognitive and social characteristics of students that are important for happy and
fulfilling life.
• It is based on student self-reports (therefore vulnerable to effects of social
desirability, response-style bias, reference-group bias).
• PISA does not cover all the dimensions of concept of well-being, but gives us
a good insight into what is going on in this area.
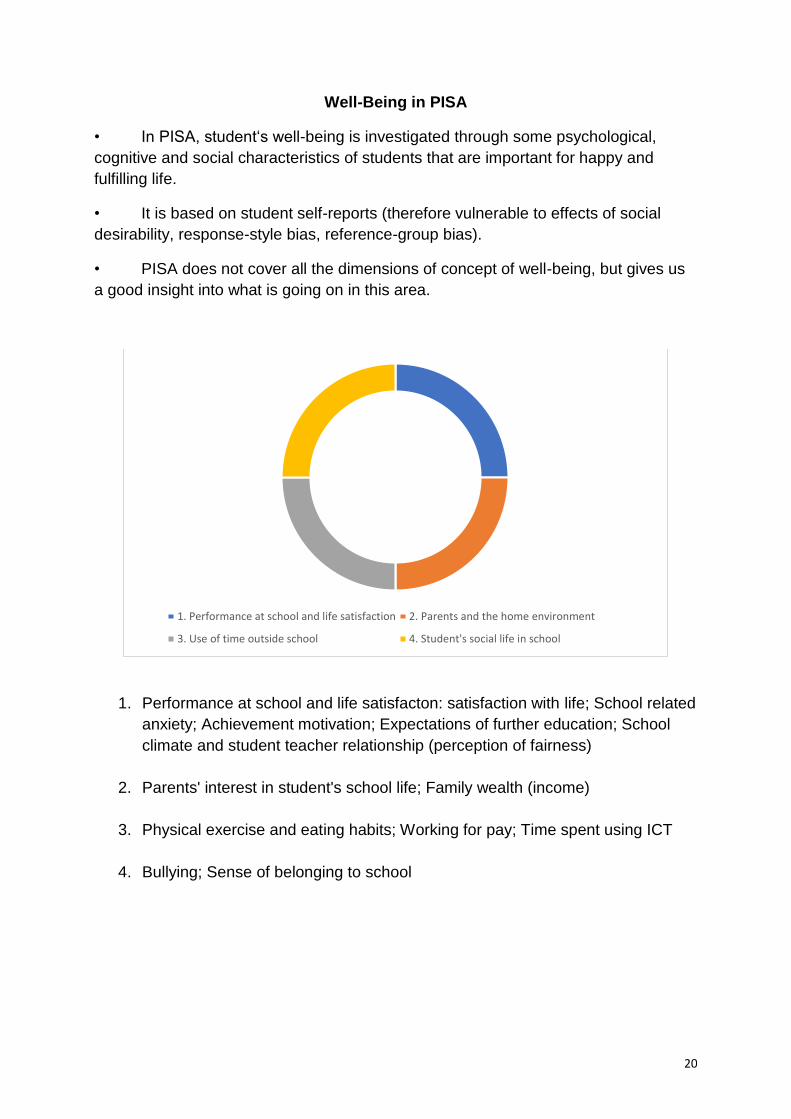
1. Performance at school and life satisfacton: satisfaction with life; School related
anxiety; Achievement motivation; Expectations of further education; School
climate and student teacher relationship (perception of fairness)
2. Parents' interest in student's school life; Family wealth (income)
3. Physical exercise and eating habits; Working for pay; Time spent using ICT
4. Bullying; Sense of belonging to school
1. Performance at school and life satisfaction 2. Parents and the home environment
3. Use of time outside school 4. Student's social life in school

21
PISA Indicators of Well-Being
• How each dimension of well-being was measured
• Results by country (indices)
• How well does sense of belonging predict student achievement (% of
explained variance by country)?
• How well does sense of belonging predict student achievement when ESCS is
held constant (% of explained variance by country)?
• How well does sense of belonging predict student achievement amongst
students in top (advantage) and bottom third (disadvantage) of ESCS index?
Prejudices and stereotypes, discrimination and oppression
To be able to talk about sollutions to problems connected to poverty in schools, part
of the Summer School programme covered the basic definitions connected to
poverty.
Classism is an attitude, action, or institutional practice backed by institutional power
that subordinates people because of characteristics that are not valued by the
dominant society and is often related to socio-economic standing.
Discrimination is the manifestation of prejudice in action. Discrimination can be
against an individual or group because of characteristics, including but not limited to,
heritage, race, class, gender, age, physical ability, religious beliefs, or sexual
orientation.
Oppression is the systematic exploitation of one social group by another for its own
benefit. For an action to be considered oppression, it must have the following three
components: 1) be in the national consciousness; 2) represent an imbalance of
power; 3) be institutionalized. The phenomenon involves institutional control,
ideological domination, and the dissemination of the dominant group’s culture on the
oppressed
Prejudice is an attitude, opinion, or feeling formed without adequate prior
knowledge, thought, or reason. Prejudice is a prejudgment for or against any person
or group. Prejudice is often based on lack of information or information that is partly
true but which misconstrues the facts.
Stereotype is an oversimplified generalization about a particular group which almost
always carries with it derogatory implications.
22
Seven forms of bias in curriculum materials1
Invisibility: What You Don’t See Makes a Lasting Impression.
Textbooks published prior to the 1960s largely omitted African Americans, Latinos,
and Asian Americans, and many of today’s textbooks continue to give minimal
treatment to women, those with disabilities, gays and lesbians, and others.
Stereotyping: Glib Shortcuts. Perhaps the most familiar form of bias is the
stereotype, which assigns a rigid set of characteristics to all members of a group,
denying individual attributes and differences. Stereotypes cast males as active,
assertive, and curious, while portraying females as dependable, conforming and
obedient.
Imbalance and Selectivity: A Tale Half Told. Curriculum sometimes presents only
one interpretation of an issue, situation, or group of people, simplifying and distorting
complex issues by omitting different perspectives. A description of women being
given the vote omits the work, sacrifices, and physical abuse suffered by women who
won the vote.
Unreality: Rose Colored Glasses. Textbooks have gained a sort of notoriety for
glossing over unpleasant facts and controversial events. When discussions of racial
discrimination or sexual harassment are dismissed as remnants of a bygone day,
students are being treated to unreality.
Fragmentation and Isolation: An Interesting Sideshow. Many of today’s texts
include special inserts or even chapters highlighting certain topics. “What If He Has
Two Mommies?” or "Ten Women Achievers in Science" are examples of such
fragmentation. Such isolation presents these groups and topics as peripheral, less
important than the main narrative.
Linguistic Bias: Words Count. Language can be a powerful conveyor of bias, in
both blatant and subtle forms. The exclusive use of masculine terms and pronouns,
ranging from our forefathers, mankind, and businessman to the generic he, denies
the full participation and recognition of women. Cosmetic Bias: Shiny Covers.
Cosmetic bias offers an “illusion of equity” to teachers and students who may
casually flip the pages of a textbook. Beyond the attractive covers, photos, or posters
that prominently feature all members of diverse groups, bias persists. Examples
include a science textbook that features a glossy pullout of female scientists, but
precious little narrative of the scientific contributions of women.
1 Zittleman, K. & Sadker, D. (2003). Teacher Education Textbooks: The Unfinished Gender Revolution. Retrieved from:
http://sadker.org/textbooks.html

23
Blame the victim theory
(Ryan, 1976)
Theory that places causes of social problems in the one suffering its consequences,
and not in characteristics of living conditions. This way the problems are
explained/solved without changing the conditions that create them. It is widespread
and often used unconsciously.
STEPS:
1. DEFINING THE PROBLEM AND THE POPULATION AFFECTED BY IT (e.g.
Roma children are unsuccessful in school and often drop out)
2. COMPARING THE VALUE SYSTEM, CULTURE AND SPECIFIC BEHAVIOR OF
THE POPULATION THAT HAS A PROBLEM WITH THE ONE THAT DOES NOT
/often based on stereotypes/ (e.g. Roma value freedom, they are not used to
working, they do not care for education, they are "educationally neglected")
3. PLACING THE CAUSE OF THE PROBLEM IN THE DIFFERENCES THAT EXIST
BETWEEN THESE TWO POPULATION (e.g. Roma children have problems because
their parents do not care about them getting education - it is not taken into account
that they are illiterate, that they do not see any sense in educating their children since
they will not be able to find a job, that they do not have money for books and clothes)
4. STARTING ACTIONS THAT CHANGE THE AFFECTED POPULATION, e.g.
family relations, their language, culture, customs are barred and they are taught the
behavior characteristic for those who "do not have this problem” (they are enrolled in
special schools, parents are pressured to send children to school - but it is not taken
into account that children do not speak the language in which they are being taught
24
Inter-Cultural Learning Session
The excercise „Leila and Mohammed“ was practised with the group to show an example of a inter-cultural learning session, whose objectives are understanding the concept of value and of cultural identity, the link between values and culture, the influence of our culture on our behaviors and our points of view
The textbook example we bring here goes under a different name (Abigail and Tom) -
- however the scenario and the aim of the game are the same.
• Introduce the exercise to the participants as being one about finding out about different values.
• Give a copy of the following story to each pupil and read it once for the group.
1. “Abigail loves Tom who lives on the other side of the river. A flood has destroyed all bridges across the river, and has left only one boat afloat. Abigail asks Sinbad, the owner of the boat, to bring her to the other side. Sinbad agrees, but insists that Abigail must sleep with him in return.
2. Abigail does not know what to do and runs to her mother and asks her what she should do. Her mother tells Abigail that she does not want to interfere with Abigail’s own business.
3. In her desperation Abigail sleeps with Sinbad who, afterwards, brings her across the river. Abigail runs to Tom to happily embrace him and tell him everything that has happened. Tom pushes her away bluntly and Abigail runs away.
4. Not far from Tom’s house, Abigail meets John, Tom’s best friend. She tells everything that has happened to him as well. John hits Tom for what he has done to Abigail and walks away with her.”
• Ask everybody to read the story by him/herself and to rank the character (Abigail, Tom, Sinbad, Abigail’s mother, John) according to his or her behavior: who acted worst? Who was second-worst, etc?
• After most of the pupils have done their ranking, ask them to get together in small groups (3 to 6), to discuss about how they perceive the behavior of the characters. The task of the small groups is to come up with a common list – a list that everybody in the small group can agree on. Ask them to avoid using mathematical methods in order to establish the list, but rather to build that list on the basis of a shared understanding of what is good and what is bad.
• After the small groups have come up with their lists, you can optionally repeat this phase by bringing two small groups together to form medium-size groups.
• Evaluate the exercise in plenary by first bringing together the results and by discussing the similarities and differences between them.
• Move on to ask on which grounds people made their ranking. How could they decide what was good and what was bad behavior? How difficult or easy it is to negotiate about values when having to establish a common list.

25
• You can ask people how they managed to come up with a common list – which arguments worked to convince them, and why, and where there was a border of being able to understand and/or follow the other.
• A possible follow up is to then look at where we learned what is good and what is bad – and what that tells us about what we have in common and what makes us different.
Tips
This story is very useful when introducing the otherwise abstract concept of values to pupils, since it very clearly puts them in a situation where they have to apply values in order to make a ranking.
A variation to the exercise is to play it as done here, and then to repeat it with a changed story, in which all the women become men, and vice-versa. Does the same ranking still apply? Why do things change?
More variations are possible: include the age of the characters in the story and play around with it, make them all have the same gender, include ethnic or national background. And then look at how the changes in the story make a difference to your ranking and why that is.
In order to get the best results from the exercise, it is essential that you establish an open atmosphere in which every ranking of the story is okay and where you do not start “blaming” people for arguments you might consider strange or bad yourself.
References: Intercultural Learning T-Kit 4, Council of Europe and European commission, 2001, intercultural-learning.eu

26
Group work: Research study plans and School based projects
Participants were divided into several groups to come up with research study plans/
research proposals aimed at improvement of wellbeing and academic achievement of
children in poverty to better understand current situation, discover relationship
between causes and effects, analyze policies, cultures and/or practices.
Results of research were used for advocacy projects, and aimed at helping the
participants plan for possible future project planning, design of strategies and so on.
Participants started with brainstorming on the following questions: What do you think
would be worth/ important to be researched? List the issues and/or questions?
1) RESEARCH STUDY PLANS
1.1) Research for Inclusion
Research topic: (thesis/assumption) Causal relationship between child labour of
school-attending children in Macedonia and academic achievement.
Problem description: child labour, as defined by ILO (includes begging), remains a
prevalent issue in Macedonia with institutions turning a blind eye to respond to this;
lack of policies and political will because of lack of functioning mechanism. Based on
relevant assessments there is a clear connection, i.e. detrimental consequences on
child’s development (academic, behavioural), and future chances in life.
Purpose statement: the intent is to conduct a study to map out the situation (the
problem) of child-labour to understand better the casual link between remaining in
poverty, low achievement in school and child labour.
Research questions: who are the child workers, household situation already existing,
support mechanism, if they are – why they are not implemented, the impact of labour
(housework is NOT defined as child-labour!) on their lives, health, mental health, self-
perception, reasons of families to pursue this, (possible ways out).
Methodology and methods
Mixed method of qualitative and quantitative methods:
QUALITATIVE: FOCUS GROUPS [FG with teachers, social services, law
enforcement, in-depth interviews with only a number of total number of
parents/children]
QUANTITATIVE: survey on 2000 children/2000 parents
27
Statistical methods will be used to analyse surveys (to see correlations between
income, ethnicity, age of parents, children, life conditions-household survey) + school
grades
• Ethics of working with children: trained field-workers for interviews
• Possible limitations occuring during implementation were not taken into
consideration
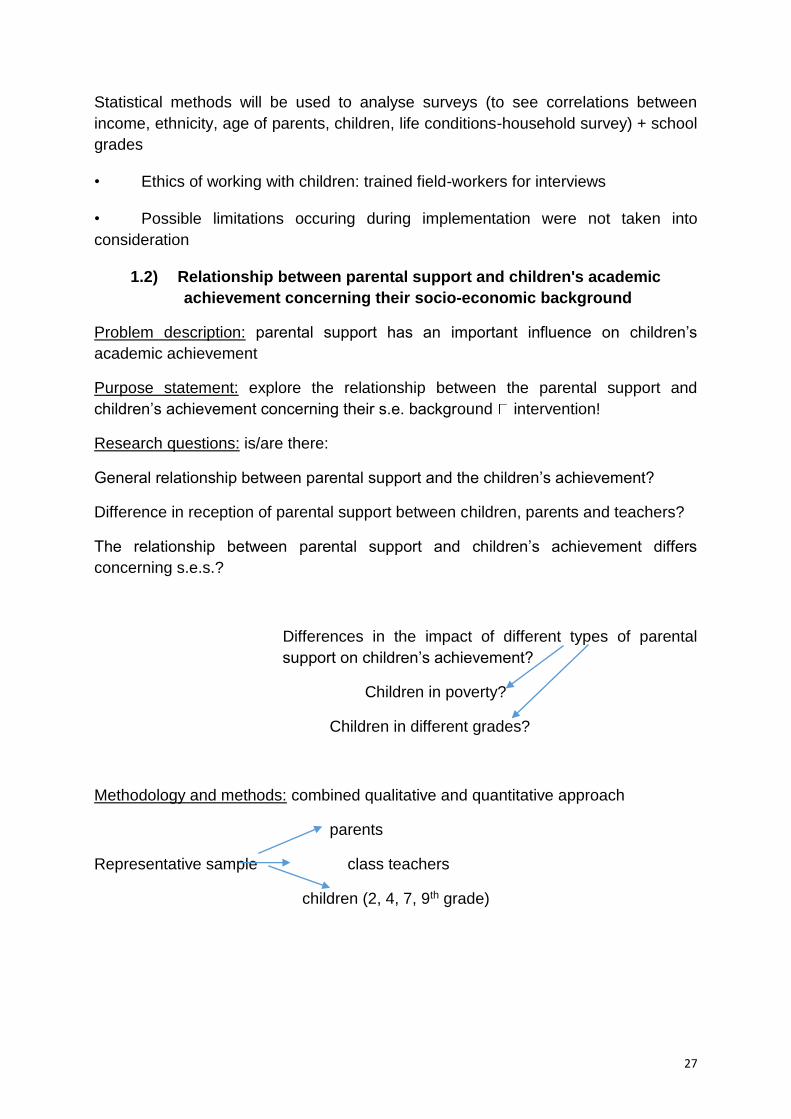
1.2) Relationship between parental support and children's academic
achievement concerning their socio-economic background
Problem description: parental support has an important influence on children’s
academic achievement
Purpose statement: explore the relationship between the parental support and
children’s achievement concerning their s.e. background intervention!
Research questions: is/are there:
General relationship between parental support and the children’s achievement?
Difference in reception of parental support between children, parents and teachers?
The relationship between parental support and children’s achievement differs
concerning s.e.s.?
Differences in the impact of different types of parental
support on children’s achievement?
Children in poverty?
Children in different grades?
Methodology and methods: combined qualitative and quantitative approach
parents
Representative sample class teachers
children (2, 4, 7, 9th grade)

28
MARCH APRIL MAY JUNE
INTERVIEWS
QUESTIONAIRES
SES PS
GRADES
2) SCHOOL BASED PROJECTS
Assignment:
Imagine that you are school management and development team. What would you
do?
Brainstorm first: What issue/s you want to address? Why? What lasting effect you
want to see?
Get inspired in Best Practice Catalogue and ideas from countries.
Background/rationale: (what is key issue, what is the situation now, available data)
Goal: (what is your vision)
Objectives: (what do you want to achieve)
Target groups:
Activities: (what are you going to do to achieve the goal)
Results (what will happen when you achieve it and how you will know it)
29
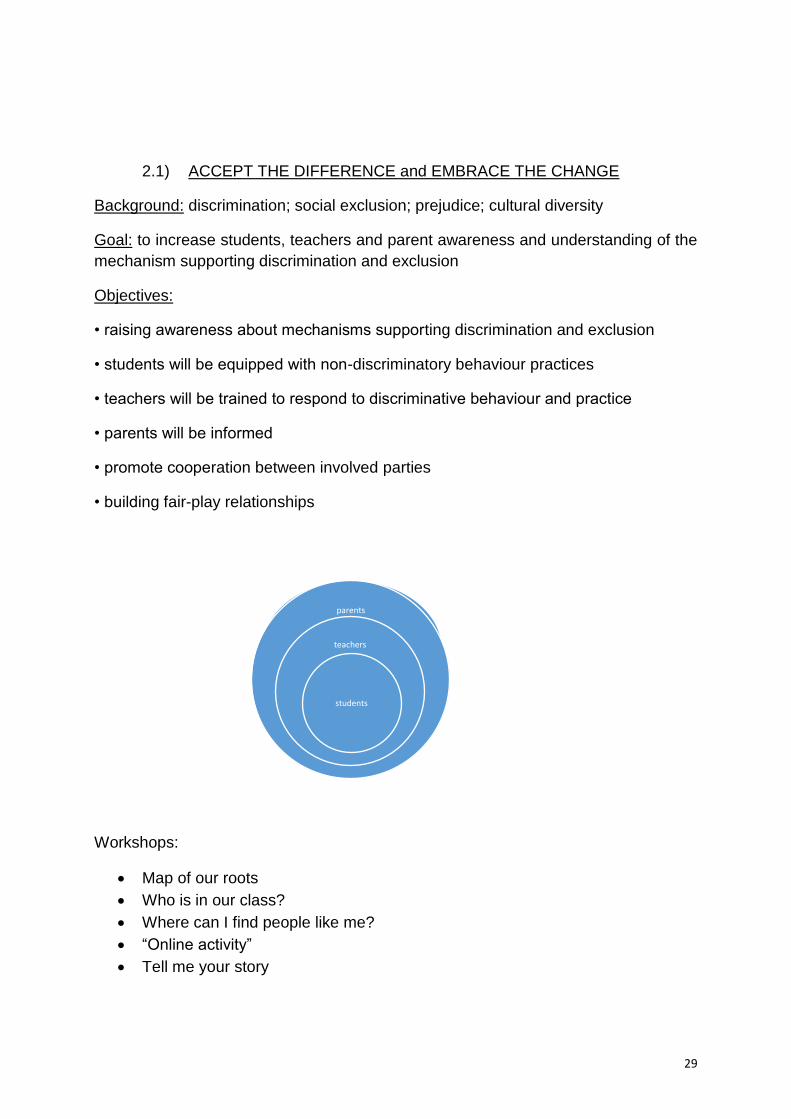
2.1) ACCEPT THE DIFFERENCE and EMBRACE THE CHANGE
Background: discrimination; social exclusion; prejudice; cultural diversity
Goal: to increase students, teachers and parent awareness and understanding of the
mechanism supporting discrimination and exclusion
Objectives:
• raising awareness about mechanisms supporting discrimination and exclusion
• students will be equipped with non-discriminatory behaviour practices
• teachers will be trained to respond to discriminative behaviour and practice
• parents will be informed
• promote cooperation between involved parties
• building fair-play relationships
Workshops:
• Map of our roots
• Who is in our class?
• Where can I find people like me?
• “Online activity”
• Tell me your story
parents
teachers
students

30
Activities:
• Announce the project (web page, tc, sc, pc)
• Initial research (survey)
• Facebook page
• Workshops for students (5+10)
• Training for teachers (social injustice, Step By Step, FSO)
• Movie night with reflections
• Diversity calendar
• Exhibition
• Excursion and fieldtrip (path of diversity)
• Final research
Results:
• awareness raised (95%)
• workshops 5+10 95% students
• teachers trained 80%
• parents involved in school activities 60%
• 20% bullying
• higher belonging to the school
• lower sense of exclusion
• Happy students, happy school

31
2.2) SCHOOL PROJECT 2
Background/rationale: high level of social exclusion, discrimination and bias in
schools
Goal: raising awareness about social exclusion and discrimination through extra
curriculum activities (for teachers/students)
Objectives: lowering social exclusion; increasing participation of all children in extra
curriculum activities; preventing social exclusion based on discrimination, bias in
schoolclasses
Target groups
Teacher – school board students parents – parent council
Local community
Activities: questionnaires for: teachers, students, parents
School Plan:
• Education for teachers/trainings
• Workshops for teachers, students, parents
• A long term activities based on needs (personal stories, workshops, theatre
performance!)
• Questionnaires after activities
Results:
• Level of exclusion is low
• Children are satisfied, happy
• Inviting research after six months

32
Advocacy
• About advocacy • Developing campaign framework – small groups • Campaign
presentations • Closing remarks • Training Evaluation
SAMPLE DEFINITIONS OF ADVOCACY
“Advocacy is set of organized activities designed to influence policies and actions of
other to achieve positive changes for children’s lives based on the experience and
knowledge of working directly with children their families and communities” – Save
the Children
Advocacy is a continuous and adaptive process of gathering, organizing and
formulating information into argument, to be communicated to decision-makers
through various interpersonal and media channels, with a view to influencing their
decision towards raising resources or political and social leadership acceptance and
commitment for a development program, thereby preparing a society for its
acceptance.
“Advocacy is the act or process of supporting a cause or issue. An advocacy
campaign is a set of targeted actions in support of a cause or issue. We advocate a
cause or issue because we want to: • build support for that cause or issue; •
influence others to support it; or • try to influence or change legislation that affects it.”
—International Planned Parenthood Federation: IPPF Advocacy Guide 1995
“Process of social transformation aimed at shaping the direction of public
participation, policies, and programs to benefit the marginalized, uphold human
rights, and safeguard the environment.” —Institute for Development Research:
Advocacy sourcebook
ONE MINUTE MESSSAGE assignment
STATEMENT This is the central idea of the message. In several strong sentences,
the advocate should present the “essence” of his/her message.
EVIDENCE Support the statement or central idea with some facts. The speaker
should use data that the audience can relate to.
EXAMPLE After providing facts, the speaker should add a human face to the story.
Using an anecdote based on one’s own experience personalizes the facts and
figures.
ACTION/ SOLUTION What can be done – what are you proposing
33
Advocacy campaign ideas
During SS17 participants divided in groups came up with several advocacy
campaigns which were presented last day of the programme.
• Idea for ad: See the potential. Raise your expectations, change one's
future.
In the first scene, the teacher shows high expectations for all children except the poor
one. The teacher praises their work, smiles to all of them, but ignores the poor child.
The screen gets black and the next inscription appears: 10 years later
In the second scene, the child appears as a grown up begging for money and the
same teacher gives him/her some coins.
The screen gets black and the next inscription appears: but the story could be
different
In the third scene, the classroom is the same as in the first one, except the teacher
shows high expectations for all children, including the poor one. When the teacher
gets to the poor child he praises his/her work, helps him/her, asks if he/she needs
additional instructions...
The screen gets black and the next inscription appears: 10 years later
In the fourth scene, the child appears as a grown up graduating.
The video ends with the following words:
Teachers tend to think that poor children have lower capabilities and potential.
See the potential. Raise your expectations, change one's future.

34
• Say Yes for School Buses
(*Creators of the campaign did not want to undermine the importance and well
intentions of all those Albanian drivers picking up pupils and students on their way to
school, and back home, or say what they were doing is wrong. It aimed at making
clear students should not rely on this, kindness of strnagers, and the dangers
connected to it, as the only way to commute to school and back home.)

35
• “Healthy lunch for everyone” project:
Not everyone can afford one large, healthy, well-balanced, organic meal a day
– a minimal pre-requirement for healthy growth and mental health of our kids –
future members of our adult community. Thus the campaign aims at
headmasters, local municipality leaders, parents, local nutritionists willing to
volunteer on the project, local GPs to organize through teacher parent
meetings so that schools set up a system of including children (one or more
class per week, every day different class) in preparing a healthy lunch for all.
One healthy meal a day should be the bare minimum we as a local community
should be able to cover and lobby for.
All children will learn how to work together, how to organize, learn about local
foods and how it gets to our tables from all over the world, about digestion and
nutrition, about the importance of communal work and how it makes us feel
better. Underprivileged children will have the expenses of the meal covered for
the period of their education it is needed. Others will, depending on family’s
income, pay as they usually pay. Local business will be required to contribute
and they will be able to advertise through the project. This will not end poverty
but A few more kids in OUR community will be able to focus more, perform
better in school, have a better chance later in life and perhaps one day help
others in similar need!
36
In Conclusion
The 2017 summer school
demonstrated the lack of strategies in
participant countries to address the
issue of the effects of poverty on
education and academic success --
both in primary and secondary
education.
Poverty being such an overwhelming
problem, both school practioners and
policy makers often do not know how
to approach resolving it, and where to
start. Excercises in advocacy
campaigns, research plans and school
projects were helpful to begin thinking
about concrete measures participants
can practice in their own areas, but
also think about ways to connect two
major areas of research and
implementation in schools in their
respective countries.
Through discussions, readings, and
group work the program aimed to
inspire participants, all researchers,
NGO practitioners or school staff to
think about the questions raised by the
overarching topics:
• whether social policies in their
countries address the issue of
poverty, and how other
countries deal with the same or
similar issues;
• are schools perpetuating
classism in society;
• which school policies and
practices contribute to
alleviating the issue of poverty
in education;
• how to involve students,
parents and local communities
in design and implementation of
school policies and practices;
• can good practices for poverty
alleviation contribute to
segregation and labelling;
• what relevant data is available
through international
assessment systems such as
PISA and how to exploit it
through secondary analysis;
• how can secondary analysis of
international assessment
system of student’s
achievement, such as PISA,
assist in addressing the issue of
poverty and its impact in
education.

37
Further readings
1. European Commission Recommendation (20.2.2013) Investing in children:
breaking the cycle of disadvantage.
2. Paul Gorski (2008) The Myth of the Culture of Poverty April 2008 | Volume 65 |
Number 7 Poverty and Learning Pages 32-36
3. PISA in Focus http://www.oecd-ilibrary.org/education/pisa-in-focus_22260919, No.
5 How do some students overcome their socio-economic background? No. 25 Are
countries moving towards more equitable education systems? No. 36 Do Parents'
Occupations Have an Impact on Student Performance? No. 43 Are disadvantaged
students more likely to repeat grades? No. 63 Are disadvantaged students given
equal opportunities to learn mathematics? No. 68 Where did equity in education
improve over the past decade?
4. Discrimination Free Schools - BEST PRACTICE CATALOGUE, Institut for
Menneskerettigheder
5. Equity Literacy for All, Paul C. Gorski and Katy Swalwell
6. How Poverty Affects Classroom Engagement, Eric Jensen
http://www.ascd.org/publications/educational-leadership/may13/vol70/num08/How-
Poverty-Affects-Classroom-Engagement.aspx
Videos used in training
Video before the debate – Rich vs. poor
https://www.youtube.com/watch?v=nllZrOoxpzc
TED
https://www.youtube.com/watch?v=p4JPFr8g3yQ
Advocacy videos
https://www.youtube.com/watch?v=t2o1oJ1zk_w
https://www.facebook.com/inspiremoreofficial/videos/1295783820513700/
https://www.youtube.com/watch?v=zYH-F1Yqz_s
https://www.youtube.com/watch?v=51-hepLP8J4
http://shareably.co/cayden-taipalus-pays-off-lunch-
debt/?utm_source=simp&utm_medium=facebook&utm_campaign=inspiring

38
List of participants
1 BIH Adna Bašić proMENTE social research, Sarajevo
2 BIH Radmila
Rangelov Jusović
Center for Educational Initiatives Step by Step
3 BIH Nedim Krajišnik
Center for Educational Initiatives Step by Step
4 SI Luka Gabršček
CPZ - International Centre for Knowledge Promotion
5 SI Mojca Štraus Education reform institute, Ljubljana
6 SI Klaudija
Šterman Ivančič Education reform institute, Ljubljana
7 HR Iva Perković Institute for Social Research in Zagreb
8 HR Lana Jurko Network of Education Policy Centers
9 HR Petra Jurlina Network of Education Policy Centers
10 HR Snježana Duić Elementary school dr. Vinko Žganec
11 HR Marija Roth
Ivan Supek High School Zagreb (X. gimnazija)
12 HR Nives Milinović Open Academy Step by Step
13 TR Ertugrul Polat Education Reform Initiative
14 MK Ana Dimovska Step by Step MK
15 MK Gordana Nestorovska
Primary school “Joakim Krcovski”, Volkovo
16 MG Batjargal Batkuhuyag Mongolian Education Alliance
17 SR Aleksandar Avramović Centre for Education Policy
18 AL Bardha Ndoj Children are the future School
19 KS Sofija Toska Kosovo Education Center
20 KS Maliqe Mulolli Dardania Primary School, Prishtine
39

40
