10th annual utah's health services research conference - clinical and economic impact of a...
TRANSCRIPT

Clinical and Economic Impact of a
Pharmacist-Led Diabetes Collaborative
Drug Therapy Management Program in
a Medicaid ACO Setting
E. Biltaji1, C. McAdam Marx1, M. Yoo1,
B. Jennings1,2, K. Gunning1,3, J. Leiser3
1. Department of Pharmacotherapy, University of Utah College of Pharmacy;
2. Department of Pharmacy Services, University of Utah Hospitals and Clinics;
3. Department of Family and Preventive Medicine, University of Utah School of Medicine

Introduction
• In 2013, the University of Utah Heath Care
(UUHC) and Health Plan established a Medicaid
Accountable Care Organization (ACO).
• Effective management of chronic diseases
including type 2 diabetes mellitus (T2DM) is a
priority of this ACO.
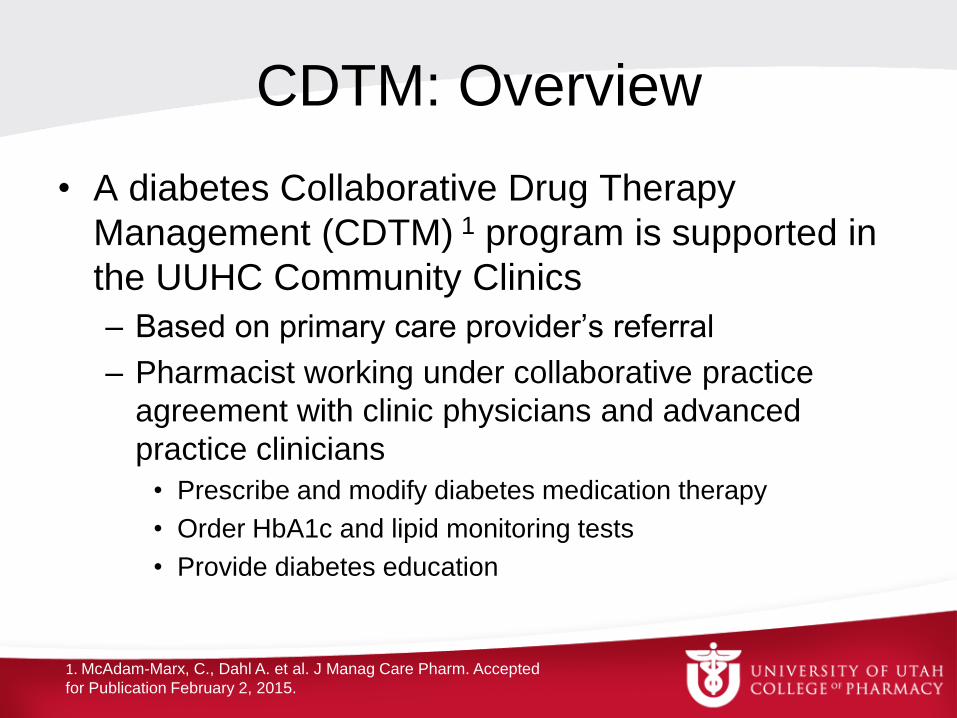
CDTM: Overview
• A diabetes Collaborative Drug Therapy
Management (CDTM) 1 program is supported in
the UUHC Community Clinics
– Based on primary care provider’s referral
– Pharmacist working under collaborative practice
agreement with clinic physicians and advanced
practice clinicians
• Prescribe and modify diabetes medication therapy
• Order HbA1c and lipid monitoring tests
• Provide diabetes education
1. McAdam-Marx, C., Dahl A. et al. J Manag Care Pharm. Accepted
for Publication February 2, 2015.
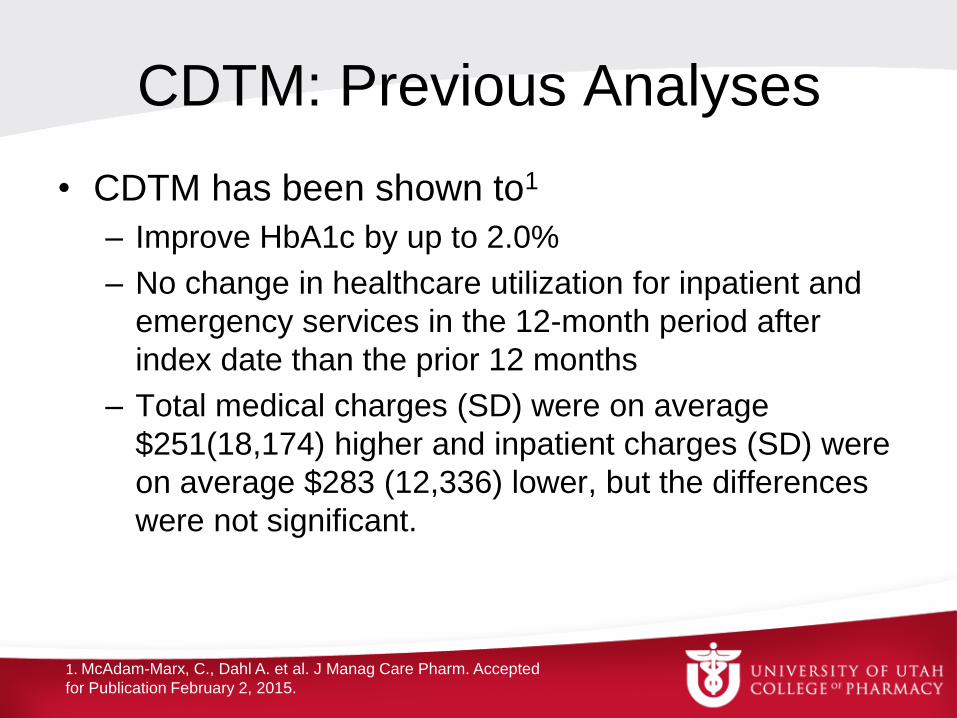
CDTM: Previous Analyses
• CDTM has been shown to1
– Improve HbA1c by up to 2.0%
– No change in healthcare utilization for inpatient and
emergency services in the 12-month period after
index date than the prior 12 months
– Total medical charges (SD) were on average
$251(18,174) higher and inpatient charges (SD) were
on average $283 (12,336) lower, but the differences
were not significant.
1. McAdam-Marx, C., Dahl A. et al. J Manag Care Pharm. Accepted
for Publication February 2, 2015.

CDTM: Analysis Limitations
• Previous analysis used health system billing
data to estimate economic outcomes
– Does not reflect amount paid
– Does not include economic data for care delivered
outside UUHC
• It is also unknown if Medicaid patients achieve
the same CDTM outcomes, given barriers to
care and self-management.1
1.Call KT, McAlpine DD, et al. Medical care. 2014;52(8):720-7.
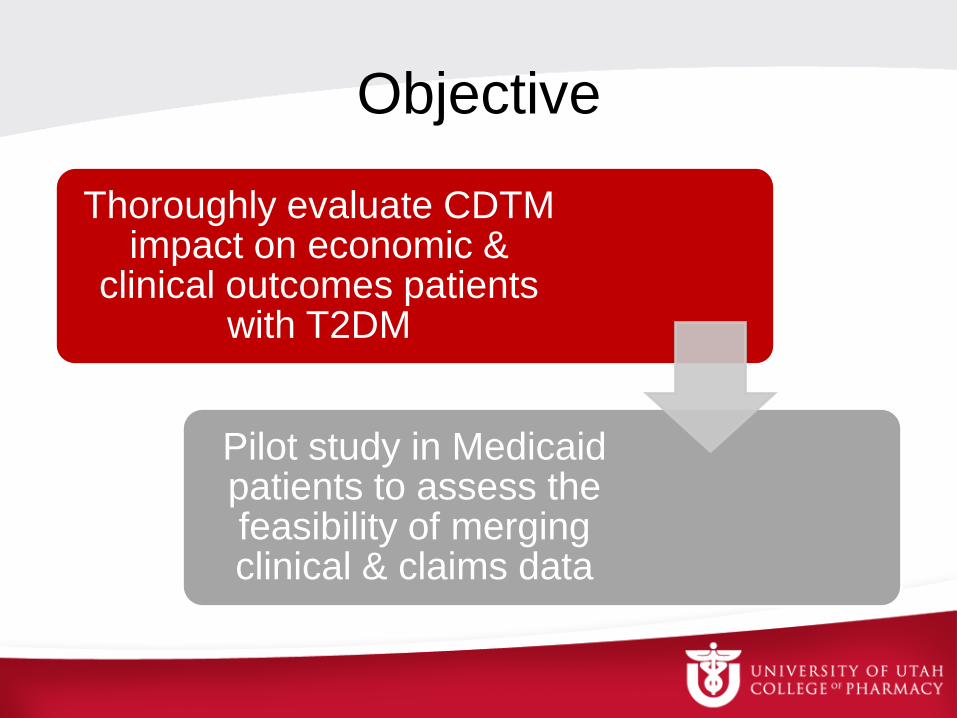
Objective
Thoroughly evaluate CDTM impact on economic &
clinical outcomes patients with T2DM
Pilot study in Medicaid patients to assess the feasibility of merging clinical & claims data
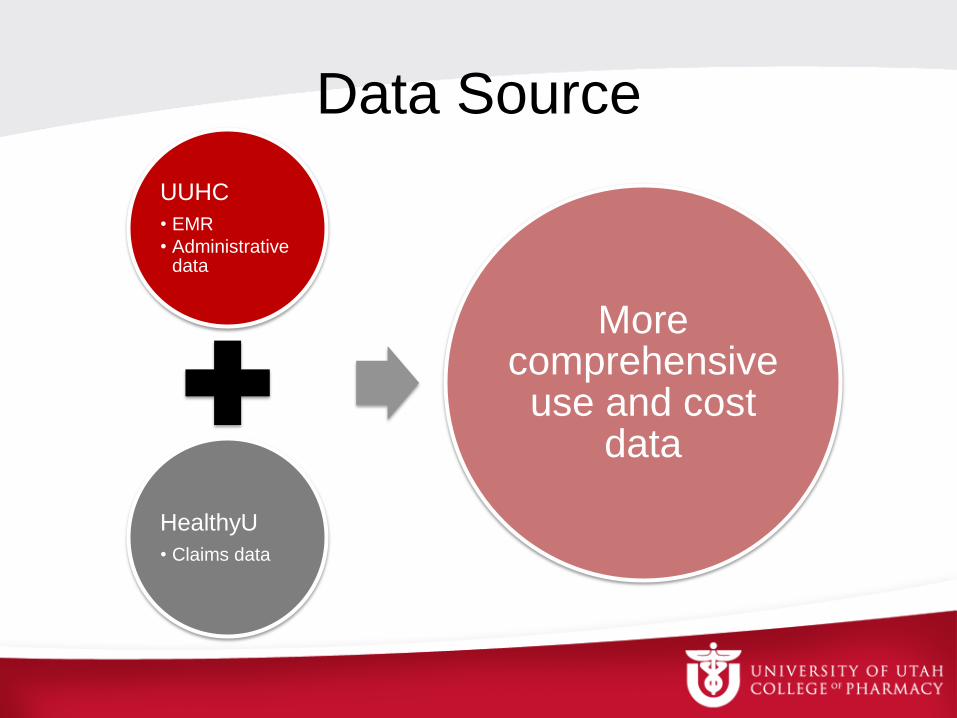
Data Source
UUHC
• EMR
• Administrative data
HealthyU
• Claims data
More comprehensive
use and cost data

Study Design
• Retrospective cohort study
– 1/1/2008 to 12/31/2012
CDTM vs. Comparison
HbA1c Charges Amt Paid

Eligibility Criteria
• Inclusion
– Age ≥18 years with
T2DM and HbA1c
≥7.0%
– Medicaid coverage
any time during the
observation period
– ≥1 HbA1c reading
90+ days after index
date
• Exclusion
– Diagnosis for type 1
diabetes or polycystic
ovary syndrome
(PCOS) without
diabetes diagnosis
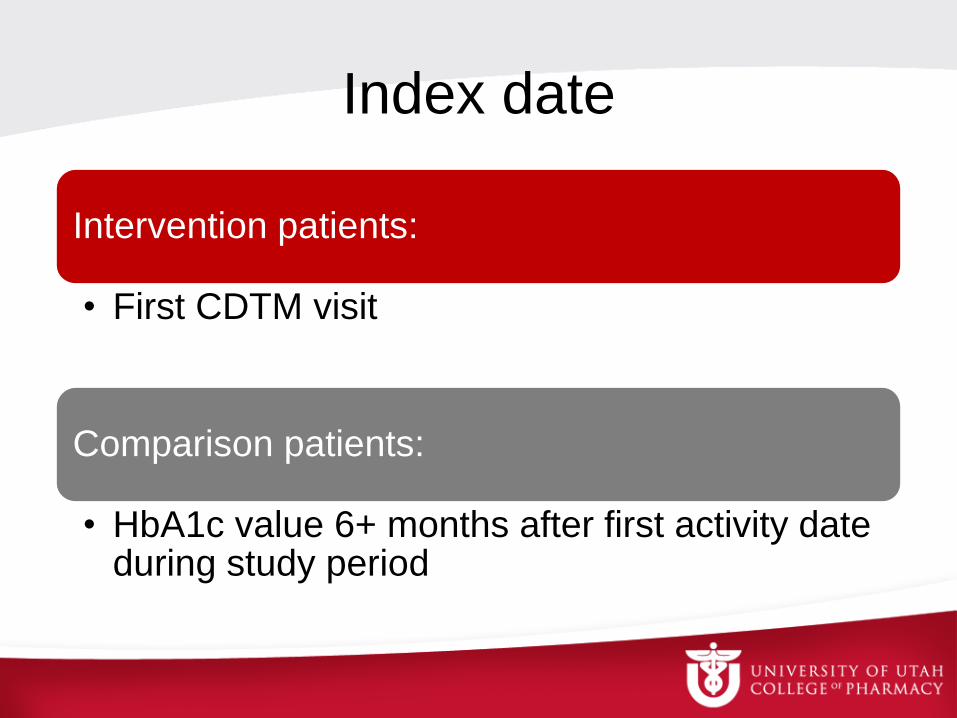
Index date
Intervention patients:
• First CDTM visit
Comparison patients:
• HbA1c value 6+ months after first activity date during study period

Study Outcomes
• Mean change in HbA1c
– At baseline vs at 6-months follow-up
• Change in UUHC charges
– 6-months pre-index vs. 6 months post-index date
• Change in amount paid by Medicaid
– 6-months pre-index vs. 6 months post-index date

Patient Identification Flowchart: CDTM Group
Adults with T2DM in CDTM program 2008-2012 (N= 305)
Primary Study Cohort
(N=79)
HealthyU Subset (N=46)
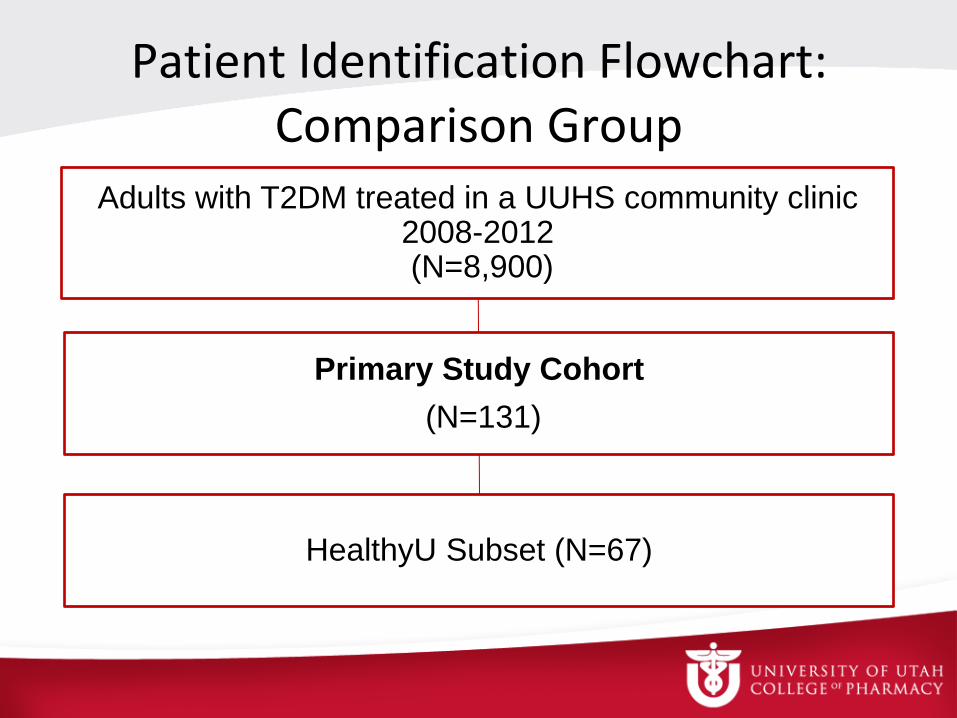
Patient Identification Flowchart: Comparison Group
Adults with T2DM treated in a UUHS community clinic 2008-2012 (N=8,900)
Primary Study Cohort
(N=131)
HealthyU Subset (N=67)

Baseline Characteristics
Variable CDTM
N=79
Comparison
N=131 p-value
Age (mean, SD) 53.2 (12.9) 53.9 (13.0) 0.698
Male (n, %) 24 (30.4) 49 (37.4) 0.756
Diabetes Medications (n, %)
Metformin
Insulin
44 (55.7)
60 (76.0)
53 (40.5)
22 (16.8)
0.032
<0.001 HbA1C (mean, SD)
≥8.0% (n, %)
10.31 (1.70)
72 (91.1)
8.63 (1.76)
65(49.6)
<0.001
<0.001
HealthyU Subset (n, %) 46 (58.2) 67 (51.1) 0.319
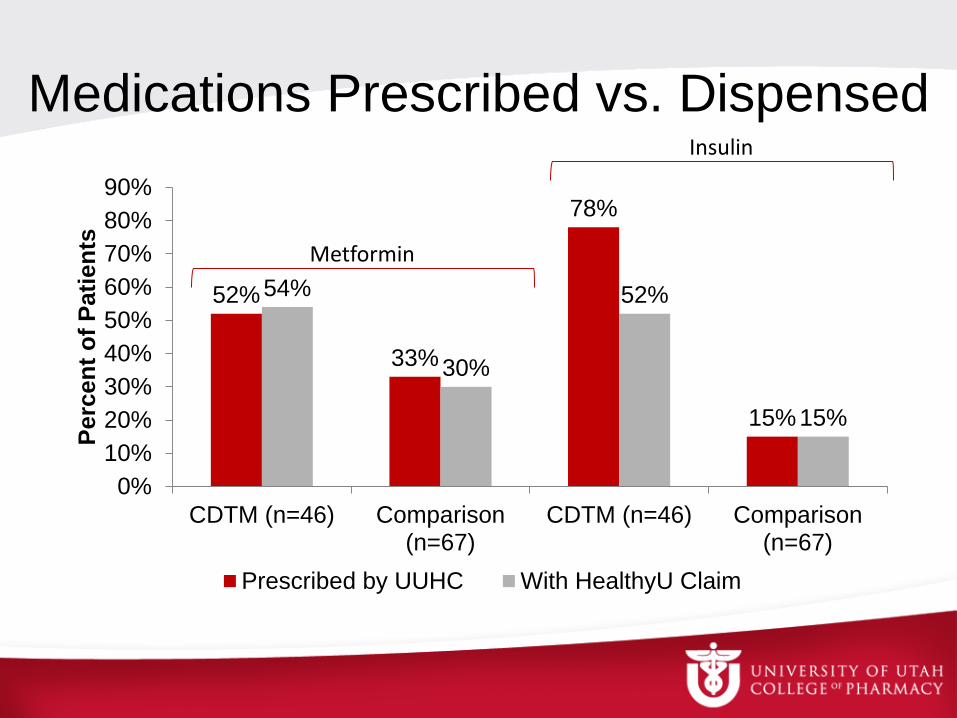
Medications Prescribed vs. Dispensed
52%
33%
78%
15%
54%
30%
52%
15%
0%
10%
20%
30%
40%
50%
60%
70%
80%
90%
CDTM (n=46) Comparison(n=67)
CDTM (n=46) Comparison(n=67)
Perc
en
t o
f P
ati
en
ts
Prescribed by UUHC With HealthyU Claim
Metformin
Insulin

Change in HbA1c
-2.04** (n=79) -2.19**
(n=72)
-0.9** (n=131)
-1.81** (n=65)
-3
-2.5
-2
-1.5
-1
-0.5
0
All Baseline HbA1c ≥8.0%
Ch
an
ge i
s H
bA
1C
CDTM Comparison
Paired t-test *p<0.05, **p≤0.001
p≤0.001
p=0.32

Mean Inpatient Admissions
0.16 (n=79)
0.15 (n=131)
0.09 (n=79)
0.09 (n=131)
0.43 (n=46)
0.76 (n=67)
1.76 (n=46)
1.73 (n=67)
0
0.2
0.4
0.6
0.8
1
1.2
1.4
1.6
1.8
2
CDTM Comparison CDTM Comparison
EDW HealthyU
6 months pre-index
6 months post-index

Mean Emergency Department Visits
0.04 (n=79)
0.08 (n=131)
0.05 (n=79)
0.1 (n=131)
3.24 (n= 46)
1.31 (n=67)
3.3 (n= 46)
1.73 (n=67)
0
0.5
1
1.5
2
2.5
3
3.5
4
CDTM Comparison CDTM Comparison
EDW HealthyU
6 months pre-index 6 months post-index

Change in Mean Charges for Care Provided by UUHS
$4,494
$9,528
CDTM $4,392
$8,887
$6,661
Comparison -$2,867
-$4,000
-$2,000
$0
$2,000
$4,000
$6,000
$8,000
$10,000
CDTM (n=79) Comparison (n=131) Difference
6-months pre-index 6-months post-index
p=0.396 p=0.212
Paired t-tests
p=0.157

Change in Mean Paid Amount by Medicaid to all Providers
$2,509
$3,346
CDTM $822
$3,331
$5,227
Comparison $1,881
$0
$1,000
$2,000
$3,000
$4,000
$5,000
$6,000
CDTM (n=46) Comparison (n=67) Difference
6-months pre-index 6-months post-index
p=0.112
p=0.304
Paired t-tests
p=0.636

Study Conclusion
• Incorporating claims data provided much larger estimates of inpatient and ED use
• Comparing prescription orders to claims highlighted potential primary non-adherence to insulin
• CDTM program was not associated with greater improvement in clinical outcomes & cost trends vs usual care

Linking Database Conclusion
Benefits • Expanded cost &
utilization data
• Charges vs. amount paid
• Prescription orders vs claims
Limitations • Reduced “linkable”
cohort size
• Inability to control for all factors that could influence outcomes

Acknowledgment
• The authors thank Brian Oberg, MBA, for data management assistance
• At the time of the study, Dr. McAdam-Marx received funding from the National Cancer Institute (award no. KM1CA156723). The content is solely the responsibility of the authors and does not necessarily represent the official views of the National Cancer Institute or the National Institutes of Health.