10f thomson
TRANSCRIPT

7/27/2019 10f Thomson
http://slidepdf.com/reader/full/10f-thomson 1/35
The Distribution of Power among the Commission, European Parliament and
Council in the European Union
Robert Thomson
Trinity College Dublin
Email: [email protected]
Abstract
This paper examines the distribution of power among the Commission, European
Parliament and Council in the European Union’s legislative arena before and after the
enlargements from fifteen to twenty-seven member states. The analyses compare
alternative variants of a simple bargaining model of the process through which actors’
policy positions are transformed into decision outcomes. These alternative variants of
the model contain different assumptions about the distribution of power among the
supranational and national actors involved in EU decision-making. The alternativevariants are tested by assessing the accuracy of their predictions of decision outcomes
on specific controversial issues. The analyses are performed on a new dataset withinformation on the policy positions of each of the member states in the Council, as
well as the Commission and European Parliament, on 331 controversial issues raised by 125 of the most important legislative proposals from the period 1999-2009. One of
the main findings is that the Commission and European Parliament have considerablyless power than the Council. To the extent that there are differences before and after
enlargement the EP appears to be weaker.
Note. This paper is based on a chapter of the book, Resolving Controversy in the
European Union: Legislative Decision-Making before and after Enlargement that will
be published by Cambridge University Press (expected in 2011). A pre-publication
version of the book is available at http://www.robertthomson.info/. The twelve-
chapter book examines the inputs, processes and outputs of the EU’s legislative
system. This paper is based on Chapter 8 of the book, one of three chapters that
examine the processes through which actors’ policy positions are transformed into
decision outcomes. The information regarding decision-making in the EU-15 was
collected in a project that led to the book The European Union Decides (Thomson et
al . eds. 2006). The information on decision-making in the EU-25 and EU-27
examined here was collected in collaboration with Javier Arregui, Rory Costello,James Cross, Robin Hertz, Thomas Jensen and Dirk Leuffen.
Paper prepared for the European Union Studies Association Twelfth Biennial
International Conference, Boston, Massachusetts, 3-5 March 2011. Session 10F,
Inter-institutional Relations and Politics.

7/27/2019 10f Thomson
http://slidepdf.com/reader/full/10f-thomson 2/35
2
1. Supranationalism versus intergovernmentalism
This paper answers the question ‘who has power in the European Union?’ by
assessing the power of the Commission, EP and Council relative to each other. During
the process that transforms policy demands into decision outcomes, actors attempt to
influence each other so that their policy demands are incorporated into outcomes as
much as possible. Actors may differ from each other in their potential to exert such
influence; in other words, they may differ in power. Researchers and practitioners
express a wide range of views on the distribution of power among the Commission,
EP and Council. The impact of EU enlargement on the distribution of power among
these three institutions is also uncertain.
A classic definition of power that gives an appropriate point of departure for
this analysis is that it is the potential a person or group has ‘to realize their own will in
a social action even against the resistance of others’ (Weber 1914/2007: 247). This
simple definition holds a number of insights that are highlighted by later definitions
and discussions of power. First, Weber’s definition implies that the focus of power is
on influencing ‘social’ or collective actions. In the context of the legislative process,
this implies that power focuses on influencing the contents of legislative acts.
Influencing other actors may be an important means to the end of influencing the
contents of legislative acts, but this is not always necessary. By contrast, Dahl’s often-
cited definition of power focuses on interactions between actors, rather than
outcomes: actor ‘A has power over [actor] B to the extent that he can get B to do
something that B would not otherwise do’ (Dahl 1957: 203). Depending on the
decision rule, it is not always necessary for actor A to convince B to change its
behaviour for A to influence decision outcomes. For instance, under the co-decision
procedure, the Council and EP could in principle change the legislative proposal and
adopt an act that the Commission does not support. Therefore, it is not necessary for
the Council and EP to change the Commission’s behaviour to influence the decision
outcome.
The important distinction between power and luck is also implicit in Weber’s
classic definition. The clause ‘even against the resistance of others’ implies that
sometimes actors may realize their preferences without having power. The
relationship between an actor’s power and the extent to which decision outcomes
incorporate its demands is far from straightforward. A decision outcome might be the

7/27/2019 10f Thomson
http://slidepdf.com/reader/full/10f-thomson 3/35
3
same as the policy position of an actor with little or no power, simply because other
powerful actors also took that position, or because that position was an obvious
compromise among the positions of other powerful actors. Likewise, the decision
outcome might differ from a powerful actor’s policy position; perhaps the powerful
actor did not care much about the issue; perhaps the decision outcome would have
been even further from the powerful actor’s position if that actor had not exercised its
power. Barry’s famous discussion of power distinguishes between power and luck
when examining the agreement between actors’ preferences and outcomes:
If an individual’s power is defined as his ability to change outcomes from
what they would otherwise have been in the direction he desires, the
likelihood of outcomes corresponding to his desires does not depend
solely on his power. In addition to his power, it depends on what the
outcomes would have been in the absence of his intervention. This is what
I shall call luck. (Barry 1980: 184)
To assess what the decision outcome would have been without the intervention of the
political actors we are interested in, we require information on the policy demands of
other relevant actors. Since the present study includes information on all of the main
decision makers in the EU’s legislative process, we are in a good position to do so.
A Weberian definition of power is arguably an appropriate point of departure
given the present study’s focus on resolving controversy. Other foci would require
different conceptions of power. For instance, if we wished to explain which
controversies emerged and which ones did not, then a definition of power in the
agenda-setting stage would be necessary (e.g. Princen 2009). Bachrach and Baratz
(1970) point to the exercise of power in shaping the issues that get on to the agenda in
the first place. Lukes’ (1974) definition of power is also broader than the Weberian
definition. Lukes’ definition includes the use of power in shaping other actors’
preferences, or their perceptions of their own interests. Lukes writes that power may
be exercised non-intentionally, by the system, rather than political actors within the
system: ‘The bias of the system’ consists of the ‘socially structured and culturally
patterned behaviour of groups, and practices of institutions’ (Lukes 1974: 21-2).
However, even for Lukes, who clearly subscribes to a broad definition of power, the
present study’s focus on overt controversy and resistance is relevant to gauging
actors’ relative power: Overt controversy is ‘relevant in the sense that, if it is

7/27/2019 10f Thomson
http://slidepdf.com/reader/full/10f-thomson 4/35
4
actualized, it provides the test by which one can measure relative power, where
parties conflict over an issue’ (Lukes 1986: 2).
Practitioners express a range of views on the distribution of power among the
Commission, EP and Council. A small survey was held among twenty-one EU
practitioners to obtain their views on the power of the Commission and EP relative to
the Council in the legislative decision-making process examined here (see Thomson
and Hosli 2006 for a more detailed report). These individuals included policymakers
from the Commission, EP, Council Secretariat and permanent representations of
several member states. The selection consisted of people who had considerable
experience and positions of responsibility, including two former heads of the
Commission’s civil service. During the face-to-face semi-structured interviews,
respondents were asked for numerical estimates of the power distribution as well as
the reasons for the estimates they gave. Their views varied enormously from each
other. A majority held a supranational view, in which the Commission and EP held at
least as much power as the Council. A substantial minority held an intergovernmental
view, in which the Council held most power. There was no clear association between
the institutional affiliation of the interviewees and their views; several of those
working in the Council held a supranational view. Practitioners working in the same
policy area also held different views.
Although the practitioners disagreed on the relative power of the Commission,
EP and Council, they often mentioned similar power resources in relation to each of
the institutions (ibid.). Therefore, they appear to disagree on how these resources
should be weighted. Regarding the Commission, the Commission’s right to initiate a
proposal was often mentioned, as well as its expertise in facilitating agreements
between other actors. Regarding the Council’s power, respondents referred to the
expertise and authority provided by national bureaucracies. Respondents referred to
the formal rules in the co-decision procedure as a reason for the EP’s power when this
decision rule applied. Although small in size, this survey of practitioners’ views
shows that there is substantial variation, and that this variation is partly due to
uncertainty regarding how different sources of power should be weighted.
Academics also hold different views on the relative power of the three
institutions. Detailed analyses of the EU’s legislative procedures generally emphasize
the power of the supranational institutions (e.g. Tsebelis 1994; Steunenberg 1994;
Tsebelis and Garrett 2000). According to these analyses, the Commission’s right to

7/27/2019 10f Thomson
http://slidepdf.com/reader/full/10f-thomson 5/35
5
formulate the initial proposal gives it a resource with which it can influence decision
outcomes to its advantage. Similarly, models of the EU’s legislative procedures often
attribute equal power to the EP and Council. On the basis of a close reading of the EU
Treaty, it would appear that the Council and EP are on an equal footing (Tsebelis and
Garrett 2000: 24-5). A strong argument can also be made that the EP is in a stronger
position relative to the Council and Commission than most national parliaments are in
relation to their executives (Hix et al . 2007). Such analyses support the views of those
practitioners who attributed at least as much power to the Commission and EP as the
Council.
Some researchers argue that the Council dominates the supranational
institutions. Naurin and Wallace begin an edited volume on Council decision-making
by noting that it is ‘arguably the most powerful of the institutions’ (2008: 1).
Similarly, Moravcsik (2008: 335) asserts that the Council is the most powerful of the
three institutions. The Commission, which in Moravcsik’s view is the least powerful
of the three institutions, has seen its power usurped by changes to the procedural rules
that have eroded its power in legislative decision-making. The extension of the co-
decision procedure gives the EP more possibilities to change the Commission’s initial
proposal. More generally, liberal intergovernmentalism posits that the main actors in
international relations are states, rather than supranational actors like the Commission
and EP (Moravcsik 1997).
The impact of enlargement on the balance of power among the institutions is
uncertain. Enlargement could have increased the power of the Commission relative to
the Council. With a more diverse set of interests present in the Council, decision-
making may have become more challenging. Consequently, the Commission’s
involvement in brokering agreements between other actors may have become even
more relevant than before. Some practitioners believe that this brokering role gives
the Commission a resource with which it could influence decision outcomes to its
advantage. Enlargement may also be associated with, although not necessarily cause,
an increase in the EP’s power. Over time, the EP has undoubtedly matured as a
political actor, for example by displaying increasingly coherent transnational party
discipline (Hix et al . 2007). These developments may have strengthened the EP’s
relative power.
Tsebelis and Yataganas’ (2002) analysis of the impact of the Nice Treaty rules
in preparation for enlargement also suggests that that enlargement may have shifted
7/27/2019 10f Thomson
http://slidepdf.com/reader/full/10f-thomson 6/35
6
power toward the Commission in certain respects, but not necessarily in the
legislative arena examined here. They show that the new rules make it more difficult
for the Council to take decisions that change the status quo. In other words, the
Commission may find it more difficult to initiate proposals that will receive adequate
support in the Council for adoption. According to this analysis, the Council’s inability
to decide increases the discretion enjoyed by the Commission (and the Court) when
interpreting legislation, because the Council’s inability to decide is also reflected in its
inability to censor the Commission for pushing the boundaries of the discretion it is
given.
2. Research design
A total of 125 legislative proposals were selected for study in the present research, 69
from the EU-15 time period and 56 from the post-2004 time period. The (online)
Appendix contains a complete list of these legislative proposals. This selection
includes a broad range of policy areas in legislative decision-making before and after
the 2004 and 2007 enlargements. The selection criteria were formulated for a study of
decision-making in the EU-15 carried out between 2000 and 2003 (Thomson et al .
eds. 2006). Subsequently, my colleagues and I extended these criteria to the enlarged
EU.
Three main criteria were used to select the legislative proposals: procedure,
time period and political importance involving controversy. The first of these criteria,
procedure, was that the proposals had to be subject to either the co-decision or the
consultation procedure. These are the two most important procedures in legislative
decision-making. According to the co-decision procedure, the EP and Council have
equal weight in the decision-making process. In the consultation procedure, by
contrast, the EP simply gives an opinion that the Council may set aside after
considering. Table 1 summarizes the selected legislative proposals by the procedure
to which they were subject. Both procedures can be combined with either unanimity
or qualified majority voting (QMV) in the Council, but it is most common for the co-
decision procedure to be combined with QMV. The selection does not include
proposals that were introduced under one procedure and changed to another procedure
after the Treaty of Amsterdam came into effect on 1 May 1999.

7/27/2019 10f Thomson
http://slidepdf.com/reader/full/10f-thomson 7/35
7
<Table 1 Distribution of proposals and issues by procedures>
The second main selection criterion concerns the time period. For the EU-15
study, proposals that were introduced or pending between January 1999 and
December 2000 were selected for study. For the post-2004 study, we selected
proposals that were first discussed in the Council and EP after the accession of the ten
new member states in 2004. The post-2004 study includes proposals that were
introduced up to July 2008. One reason for selecting these time periods concerns the
practicalities of the data collection procedures. Given that decision-making in the
Council of Ministers takes place behind closed doors, and there are no useful public
records of these meetings, interviews with key informants are the only viable way of
obtaining the information required. Key informants are only able to provide the
detailed information required for legislative proposals that are either ongoing or
relatively recent and fresh in their memories at the time of the interview. Another
reason for selecting these time periods is substantive. The present study is interested
in how the contemporary system of the EU works and the impact of the recent
enlargements on decision-making.
The third main selection criterion is political importance involving
controversy. The main research questions posed in this study centre on the ways in
which the legislative system of the EU incorporates inputs in the form of diverse
policy demands, and processes these into outputs in the form of laws. From this
perspective, there is little to be gained by including legislative proposals that were
uncontroversial. A few subtle variations in the implementation of this criterion were
implemented during the course of this research. For the EU-15 period, each proposal,
which could be a proposed directive, regulation or decision, was mentioned in a report
of Agence Europe, a daily news service devoted to EU affairs read mostly by EU
practitioners. In addition, the experts we interviewed had to identify at least one
substantive disagreement between at least some of the actors for the proposal in
question to be included in the selection. We also asked the experts to name other
proposals they were working on that met our selection criteria of relevant procedures
and political importance and included these if they were not already in the selection.
These procedures led to a relatively large number of proposals that were initially
selected, but then found to be uncontroversial when the researchers consulted the
experts. Consequently, for the post-2004 cases, two changes were made. First,
7/27/2019 10f Thomson
http://slidepdf.com/reader/full/10f-thomson 8/35
8
decisions were excluded because most of the decisions included in the initial selection
proved to be uncontroversial. Decisions are legislative acts directed toward specific
member states or legal entities. As such they are narrower in scope than regulations
and directives and typically less controversial. Second, we tightened the news report
coverage to require that a proposal be mentioned in both Agence Europe and
European Voice. European Voice is a weekly newspaper with a somewhat broader
and less specialized readership than Agence Europe. The consequence of these
changes is that the post-2004 cases are confined to a set of proposals with a somewhat
higher profile than the EU-15 selection. In addition, during the semi-structured
interviews, the interviewers regularly asked whether there were other cases that the
experts were working on that would be suitable for us to include. The experts referred
to proposals that were already included in the selection.
The selection was not restricted to particular policy areas. Legislative
proposals from all policy areas covered by the EU that met the above criteria were
considered. We aim to examine patterns that may be present in different policy areas
and therefore should not restrict the selection to certain areas. Given the policy areas
in which legislative activity is most intense in the EU, certain areas feature
prominently. Unsurprisingly, the selection contains a high proportion of legislative
proposals from the areas of agriculture (twenty-six), internal market (eighteen),
Justice and Home Affairs (eleven) and fisheries (fourteen). However, many other
policy areas are present too, which allows us to examine the extent to which patterns
in inputs, processes and outputs can be generalized across different policy areas.
There are fewer internal market proposals in the post-2004 selection. However, there
are several proposals in the post-2004 selection concerning the internal market in
services that were discussed in other Council configurations. For example, the
payment services directive (COD/2005/245) was discussed in ECOFIN and voted on
in the General Affairs Council; while the broadcasting directive (COD/2005/260) was
discussed in the Education, Youth and Culture Council; both have implications for the
internal market. The fact that there are no environmental proposals in the EU-15
selection reflects the fact that these changed legislative procedure when the Treaty of
Amsterdam came into effect and were not selected for that reason.
The selection approximates as closely as possible an exhaustive selection of
all proposals that meet the abovementioned criteria. The selection is very clearly not a
random sample of all legislative proposals. A random sample would be inappropriate

7/27/2019 10f Thomson
http://slidepdf.com/reader/full/10f-thomson 9/35
9
given the research questions addressed by the present study. A random selection
would include a large proportion of proposals that were uncontroversial, and that
would tell us little about how the EU processes competing policy demands. On
uncontroversial matters, by definition all actors take the same policy positions. Some
of the analyses in this project include models of the ways in which actors’ policy
positions are transformed into decision outcomes. There are fundamentally different
theories of how this transformation process takes place. However, these different
theories make the same predictions of decision outcomes on uncontroversial issues.
According to all models, if all of the relevant actors have the same policy position,
that position will also be the decision outcome. Therefore, including uncontroversial
issues would not bring information that would be useful in testing alternative
explanations.
The researchers involved in the data collection for this study conducted 349
semi-structured interviews with experts to gather information on the controversies
raised by the legislative proposals selected. The experts were usually participants in
the decision-making processes about which they were asked. The interviews lasted on
average an hour and eighteen minutes. During these interviews, experts gave
information on the actors’ policy positions on the controversial issues and the levels
of importance the actors attached to the issues. This information was given in a way
that could be expressed as numerical estimates, as in the example in Figure 1. In
addition, the experts gave qualitative information to substantiate their estimates. This
interviewing method has been applied in many previous studies (e.g. Bueno de
Mesquita and Stokman eds. 1994).
The first part of each interview focussed on specifying the issues as policy
scales, such as the one depicted in Figure 1, or checking the issues specified in
previous interviews. The aim was to arrive at a stylized representation of the main
disagreements raised by the proposal in question. To achieve this aim, the
interviewers had to engage actively with the expert; more was required of
interviewers than simply reading out a standardized questionnaire. The experts were
first asked to identify the main disagreements or controversies raised by the
legislative proposal in question. After making an initial inventory of the issues, the
interviewer then took one issue, typically the one that appeared to be the main
controversy, and attempted to specify this in more detail.

7/27/2019 10f Thomson
http://slidepdf.com/reader/full/10f-thomson 10/35
10
The specification of the issues is closely connected with the collection of
information on actors’ policy positions, since the policy positions are represented on
the issues. For the issue in question, the expert was then asked to identify the actors
that favoured the most extreme policy alternatives. These policy alternatives then
defined the endpoints of the policy scale used to represent this controversy, which for
convenience we gave a range of 0-100. Depending on the flow of the discussion, the
interviewer either then continued with the collection of information on actors’ policy
positions, or moved to the next issue, returning to the policy positions on the first
issue later in the meeting. For each issue, the experts were asked to ‘indicate the
policy alternative initially favoured by each stakeholder after the introduction of the
proposal before the Council formulated its common position’ (Thomson and Stokman
2006: 36). The experts placed intermediate positions on the policy scale to represent
their judgement of the relative political distances between the positions. Two previous
publications tested the reliability and validity of the expert judgements used in the
present study with satisfactory results (Thomson 2006; König et al . 2007).
Experts estimated the level of importance that each actor attached to each of
the controversial issues. We refer to this as actors’ issue salience. Issue salience
reflects the intensity of actors’ policy positions, a concept with a long pedigree in
empirical political analysis (Achen 2006a: 92). A high level of salience is what turns a
potential to influence into actual influence, because an actor with a high level of
salience will put a high proportion of its potential to influence other actors and the
decision outcome into effect. Actors may differ from each other in the level of the
salience they attach to a given issue. In addition, any given actor may attach different
levels of salience to two or more controversial issues. Issue salience is a key concept
in models of political exchange and logrolling, in which actors make concessions on
some issues in return for concessions from others on other issues (e.g. Coleman 1972;
1990; Stokman and Van Oosten 1994).
Experts estimated the level of salience that each actor attached to each issue
on a scale of 0 to 100. The scale was introduced as follows:
Stakeholders differ from each other in the salience or importance they attach
to issues. For example, a particular issue may be of great importance to one
stakeholder but only marginal to another. Please estimate the salience each
stakeholder attaches to each issue on a scale from 0 to 100. A score of 100
7/27/2019 10f Thomson
http://slidepdf.com/reader/full/10f-thomson 11/35
11
indicates that an issue is of the highest importance to a stakeholder, while a
score of zero indicates that the issue is of no importance whatsoever to a
stakeholder. A score of 50 indicates that the issue has an average level of
priority for the stakeholder concerned, and that it is willing to use arguments
but not power politics to convince opponents. Note that it is possible for a
stakeholder to attach a high level of salience to an issue on which it takes a
moderate position, and a low level of salience to an issue on which it takes an
extreme position.
When obtaining experts’ estimates of the salience of each issue to different actors,
extensive comparisons were made both between the scores of different actors on the
same issues and between the scores of the same actors on different issues.
Interviewers often found it useful to ask the expert to first identify the actor with the
highest salience score on any of the issues raised by the proposal, and then to make
the other estimates relative to this benchmark. Interviewers asked experts to give
reasons for their estimates throughout the interview. The 0-100 salience scale has
proven to be a useful heuristic for obtaining expert judgements on issue salience. In
practice, experts use units of ten (50, 60, 70 etc.) and occasionally five (50, 55, 65
etc.).
3. Modelling supranationalism and intergovernmentalism
Previous analyses of this dataset showed that a variant of the Nash Bargaining
Solution (NBS) gives more accurate predictions of decision outcomes than other
models (see also Achen 2006b). The distinguishing feature of this variant of the NBS,
demonstrated by Achen (2006a), is that the disagreement outcome, or ‘reference
point’ as it is operationalized in the present study, is extremely undesirable from the
perspective of all of the actors. This formulation of the NBS is referred to as the NBS-
no RP in the present study, which stands for NBS “no Reference Point”. This solution
has a very simple specification: the salience-weighted mean average of all actors’
policy positions. This specification is equivalent to assuming that each of the actors
has equal power, whereby both the Commission and EP have the same power as one
member state. So even with this apparently unrealistic assumption, the NBS-no RP
7/27/2019 10f Thomson
http://slidepdf.com/reader/full/10f-thomson 12/35
12
outperformed other model, particularly those based on the formalities of the
legislative procedures.
In the following analyses I relax this unrealistic assumption of equal power by
formulating and applying models with different assumptions regarding the
distribution of power among the institutions. Specifically, the analyses apply the
following specification of the NBS.
outcome=
powerisaliencei preferenceii=1
n
∑
powerisalienceii=1
n
∑(1)
Where:
outcome is the predicted outcome.
power i is the power of actor i from the set of n actors.
saliencei is the level of salience that actor i attaches to the issue.
preferencei is the policy preference of actor i.
Formula 1 weights the actors’ positions by both power and salience.
This paper applies two complementary analytical approaches. The first
approach formulates and applies a small number of models encapsulating the main
supranational and intergovernmental views. The analyses then identify which model
makes the most accurate forecasts of decision outcomes. The second approach varies
the power of the Commission and EP relative to each other and the Council, covering
a large number of alternative specifications, to identify the distribution of power that
enables the NBS to generate the most accurate predictions.
Supranational versus intergovernmental models
The supranational view attributes a large amount of power to the Commission and EP
relative to the Council. In the following analyses, the member states in the Council
have a total power score of 100. This is an arbitrary number, but it makes it easy to
compare the power of the other institutions with the Council. For legislative proposals
subject to the consultation procedure, a less common procedure nowadays, the
supranational view gives a power score of 100 to both the Commission and Council.

7/27/2019 10f Thomson
http://slidepdf.com/reader/full/10f-thomson 13/35
13
The EP is excluded from the analysis of the consultation issues. Although the EP may
have some power in the consultation procedure, the consensus among practitioners is
that the EP’s influence is exerted mainly through the Commission in this procedure.
The supranational view of the co-decision procedure, which is of primary
interest because it is now the commonly used ordinary procedure, is somewhat more
complex. There are different views among researchers on whether the Commission is
a relevant player in co-decision. Therefore, we will investigate two variants of the
supranational view. The first variant includes both the Commission and EP and gives
each a power score of 100: i.e. equal to the Council. This specification accords with
the view that the Commission is a relevant actor in the co-decision procedure (e.g.
Crombez 2003). The second variant of the supranational view excludes the
Commission, but gives equal power to the EP and Council. This specification accords
with the view that the co-decision procedure is a bargaining game between the
Council and EP and that neither has an advantage (e.g. Tsebelis and Garrett 2000: 24-
5).
An extreme variant of the intergovernmental view is that all power is held
entirely by the member states. This specification sets both the Commission and EP’s
power scores to 0 relative to the Council’s 100, under both the consultation and co-
decision procedures. This specification accords with the view that while supranational
institutions may appear to play an important role in international negotiations, their
input is not more than the sum of the member states of which they are composed.
Achen (2006a) also specified this model as the realist view of EU decision-making.
Few EU practitioners or analysts subscribe to such a view, but it is nonetheless a
useful point of comparison for the supranational specifications.
When applying these model variants, we must make at least an implicit
assumption regarding the distribution of power among the member states in the
Council. A separate analysis, not discussed here, is devoted entirely to this question.
Here, we consider two alternatives. The first alternative is that power is distributed
equally among member states. This means that a large member state’s policy position
is given equal weight to a small member state’s position. The second alternative is
that power is distributed unevenly among the member states in a regressive form,
whereby large member states are weighted more heavily than small member states,
but not as heavily as one would expect on the basis of their population sizes. This
regressive distribution is roughly equal to the share of qualified majority votes held by

7/27/2019 10f Thomson
http://slidepdf.com/reader/full/10f-thomson 14/35
14
each member state. In fact, this second alternative uses weights from a voting power
index, the Banzhaf index (1965). I applied this regressive power distribution in the
Council to issues subject to both QMV and unanimity in the Council, because it may
be that large states are more powerful than small states even when the unanimity rule
applies. It turns out that the results regarding the distribution of power among the
Commission, EP and Council are very similar, regardless of whether the analysis
assumes an equal or an unequal distribution of power among the member states.
For comparison, the following analysis will also include the variant of the
Nash Bargaining Solution (without the reference point: NBS-no RP) that was
identified as the overall best-predicting model in previous analyses that compared
several models, including a procedural model. This NBS-no RP specification is
equivalent to weighting all actors’ positions only with the level of salience they attach
to the issue at stake; it therefore implicitly assumes that all actors’ positions are
weighted equally apart from issue salience. The NBS-no RP therefore attributes some
power to each of the supranational institutions, the same amount of power it attributes
to each of the member states.
Finding the best-fitting power distributions
The second research approach varies the power of the Commission and EP to identify
the variant of the model that generates the most accurate predications of decision
outcomes. For the controversies raised by legislative proposals subject to the
consultation procedure, I vary the power of the Commission relative to the Council, to
find the relative power score for the Commission, power COM , that minimizes the
model’s error. The analysis examines the consultation issues subject to QMV and
unanimity separately. It may be the case that the distribution of power among the
institutions differs by the decision rule that applies. As a formula, the analysis finds
the value of power COM that:
min {a=1
m
∑ | actual outcomea –
powerisalienceia preferenceiai=1
n
∑
powerisalienceiai=1
n
∑|} / m (2)
7/27/2019 10f Thomson
http://slidepdf.com/reader/full/10f-thomson 15/35
15
Where the terms are defined similarly to above. Here, since we are interested in the
power score of the Commission, power COM , that minimizes the model’s error over a
set of issues, we need to include notation that identifies the set of issues. Subscript a
stands for issue a from the set of issues m. The set of issues is defined as issues
subject to consultation and QMV in the Council, consultation and unanimity in the
Council, or as discussed below co-decision.
actual outcomea is the actual decision outcome on the controversial issue a.
power i is the power of actor i from the set of actors n, which includes the
Commission. In the analysis of the consultation issues, the set of actors excludes the
EP.
salienceia is the level of salience actor i attaches to issue a.
preferenceia is the policy preference of actor i on issue a.
In other words, find the value of power COM that minimizes the average
absolute distance between the actual decision outcome and the model’s forecast of the
decision outcome. The following analysis varies the power of the Commission from 0
to 200 relative to the Council’s total power score of 100 in steps of 1. Therefore, for
each of the 148 controversial issues subject to the consultation procedure on which we
have a final decision outcome, the analysis applies 201 variants of the NBS-no RP, to
identify the variant with the smallest prediction error. The maximum value of 200, or
two times the power of the Council, is arbitrary, but it is far higher than any of the
practitioners estimated the Commission’s power (Thomson and Hosli 2006).
The analysis of controversies raised by proposals subject to the co-decision
procedure includes both the Commission and the EP in the relevant set of actors. Like
the analysis of the consultation cases, we wish to find the values of power COM and
power EP that minimize the model’s prediction errors across all of the co-decision
cases. Since co-decision is usually combined with QMV in the Council, we will not
run a separate analysis on the small number of co-decision cases combined with
unanimity in the Council. For the co-decision controversies, the analysis varies the
power of both the Commission and the EP independently from 0 to 200 relative to the
Council’s power score of 100 in steps of 1. Therefore, for each issue a total of 40,401
(201 * 201) variants of the model were applied. Since we have 176 co-decision
controversies with decision outcomes, this amounts to 7,110,576 applications of the
model. I performed the analyses twice: once assuming an equal distribution of power
7/27/2019 10f Thomson
http://slidepdf.com/reader/full/10f-thomson 16/35
16
among the member states in the Council and once assuming a regressive distribution
of power in the Council, based on member states’ Banzhaf index scores as defined by
the QMV rule. It turns out that the results are very similar, regardless of the
assumptions made regarding the power distribution within the Council.
For the co-decision controversies, the analyses also consider the best-fitting
power distribution between the Council and EP excluding the Commission from the
decision-making process. As mentioned above, the co-decision procedure is
considered by some analysts to be a bargaining game between the Council and EP
alone. It might be the case that we underestimate the power of the EP because we
include the Commission in the analysis. This concern turns out to be unfounded. The
EP’s best-fitting power score for the co-decision controversies remains much the
same whether or not the Commission is included.
Over a large set of controversies, this method of searching for the distribution
of power associated with the most accurate predictions of decision outcomes allows
us to make inferences regarding the distribution of power. The results show that over
each set of controversies, there is a unique combination of power scores associated
with the most accurate predictions. However, depending on the distribution of actors’
policy positions, some controversial issues offer more insight into the distribution of
power than other issues. For example, suppose actual decision outcomes are generally
compromises among powerful actors. Suppose that most actors’ positions are located
at one of the two extreme positions on a policy scale, and that their positions are quite
evenly distributed between the two end points of the policy scale. If the outcome is
approximately half way between these two extremes, then an actor with a position
close to the middle of the scale, and therefore close to the outcome, may either be
powerful or lucky. The moderate actor may be lucky in the sense that the decision
outcome would have been close to its favoured outcome even if it had expressed no
policy position at all. In such cases, assigning different power scores to these
moderate actors will have little effect on the model’s predictions. In other words, such
a scenario is consistent with the moderate actor being either powerful or weak, and
such issues do not allow us to differentiate between these alternatives. Crucially, this
analytical procedure does not lead to the inference that moderate actors are more
powerful in such cases, but rather that different assumptions about moderate actors’
power lead to similar predictions. Fortunately, there is a large amount of variation in

7/27/2019 10f Thomson
http://slidepdf.com/reader/full/10f-thomson 17/35
17
actors’ policy positions. No actors are extreme or moderate all of the time (e.g.
Thomson 2009).
4. An illustration with the data retention directive
The decision-making process prior to the adoption of the data retention directive
suggests that the Commission and EP may exert only a modest amount of influence in
some cases. The proposal, which was introduced in 2005, aimed to align member
states’ policies regarding the retention of telecommunications data (i.e. phone calls
and internet communications) for the purposes of fighting terrorism and crime. One of
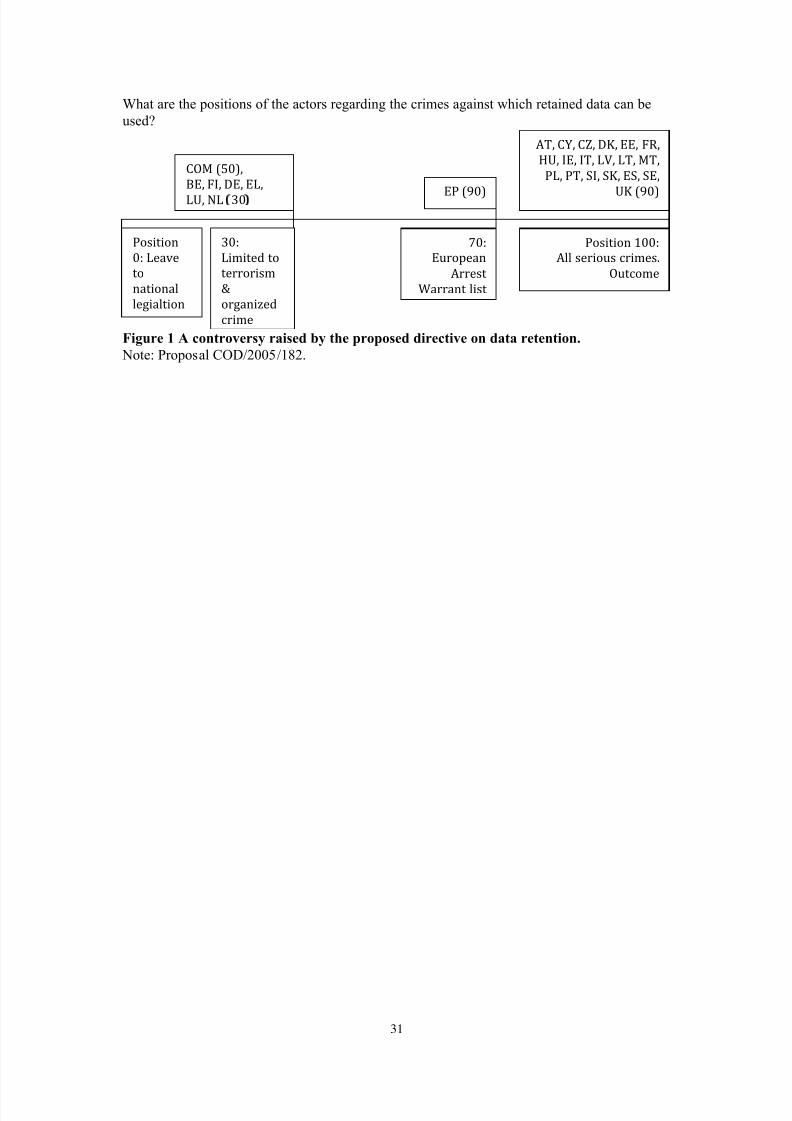
the controversies raised is depicted in Figure 1. It concerned the types of crimes
against which retained data could be used. Some actors favoured a text stating that the
data could be used against a narrow list of very serious crimes, namely terrorism and
organized crime. Member states would be free to allow their law enforcement
agencies to use the data against a wider range of crimes if they decided to do so. This
policy position, favoured by the Commission, Germany and several other states, is
located at position 30 on the first issue. Most of the other member states, including the
UK and France, favoured the use of the data against all serious crimes in all member
states. This policy position is position 100 on the issue. Note that member states such
as the UK and France wanted to ensure that other European countries allowed their
law enforcement agencies to use the retained data to fight a broad range of crimes.
They were not content to leave this to the discretion of those other states. This was
particularly relevant to neighbouring countries that had cross-border crime problems.
For instance, the Danish government favoured a system that would allow German law
enforcement to use the data retained by German telecommunications operators.
<Figure 1>
This legislative proposal was adopted after a single reading in the EP. This has
implications for identifying the EP’s policy position or policy demand that was its
input into the decision-making process. Negotiations took place between MEPs and
the Council prior to the full EP plenary vote that formally approved the agreement
reached between the EP and the Council members. In this context, the outcome most
favoured by the EP is not the decision outcome that it adopted, but rather the position

7/27/2019 10f Thomson
http://slidepdf.com/reader/full/10f-thomson 18/35
18
with which it entered negotiations with the Council. The interviews with MEPs
revealed that this position was located between the Commission’s position and the
UK’s position. The EP committee favoured the use of the data against crimes that fall
under the European Arrest Warrant, a policy demand that our key informants placed
at position 70 on the scale. The EP committee’s position was a compromise among a
diverse range of views in the parliament, which are not depicted in the figure. The
Greens and GUE party groups favoured leaving this entirely up to national discretion
(position 0). Most of the EPP group favoured the same position as the UK (position
100), while most of the Swedish, Belgian and Dutch EPP MEPs favoured a more
limited list of crimes. Most of the liberal ALDE group also favoured a more limited
list of crimes than the European Arrest Warrant, while the French and Italian ALDE
MEPs favoured the same position as the UK. Most of the MEPs in the PSE group
favoured using the retained data for the crimes that fell under the European Arrest
Warrant. The decision outcome was that retained data can be used against all serious
crimes, in line with the position of the UK, France and most other member states
(position 100).
This is one of a number of issues raised by this legislative proposal. In
addition, there were differences of opinion on the length of time for which data should
be retained, on whether telecommunications providers themselves or governments
should pay for storage, on exactly what types of data should be stored, and what data
protection requirements should be put in place. As is often the case for proposals that
raise several controversies, the actors had different patterns of agreement on these
different aspects of the proposal. For example, regarding the length of time that data
should be retained, Ireland and Italy in particular favoured a longer period of time
than stipulated in the legislative proposal. Their policy demand was met partly by the
amendment of the relevant article. The final act states that telecommunications
operators must store the data for at least six months; however, national governments
have the discretion to require them to store the data for up to two years.
The data retention directive is a clear example of a case in which the EP
appears to have had a relatively modest amount of influence over the decision
outcomes, despite the fact that this was a co-decision procedure. The decision
outcomes appear to be compromises among the diverse positions taken by member
states. In the controversy regarding the types of crimes, taking into account the
positions of the EP and Commission in fact leads to less accurate predictions of
7/27/2019 10f Thomson
http://slidepdf.com/reader/full/10f-thomson 19/35
19
decision outcomes. In the example featured in Figure 1, the intergovernmental model
makes a prediction of 93 on the policy scale (rounded off to the nearest whole
number), which is a distance of seven scale points from the actual outcome (position
100). The first variant of the supranational model, which attributes equal power to the
Commission, the EP and the Council, makes a prediction of 69 on the policy scale,
considerably less accurate than the intergovernmental model. Similarly, the second
variant of the supranational model, which attributes equal power to the EP and
Council while excluding the Commission, makes a less accurate prediction than the
intergovernmental model. The second variant of the supranational model predicts an
outcome of 81 on the policy scale.1
In this case, of all possible combinations of power scores, the combination that
attributes all power to the Council and none to either the Commission or EP, is
associated with the most accurate forecasts of decision outcomes. As described above,
the power scores of the Commission and EP were varied independently of each other
from 0 to 200, relative to the Council’s total power score of 100. Of the 40,401
combinations of scores examined, the combination ‘Commission 0, EP 0, Council
100’ gives the most accurate prediction of the outcome.
There are a number of reasons why the EP was particularly weak in this case.
First, law and order is a policy area that member states’ governments generally
consider should be dealt with at the national level. There was some dispute regarding
the appropriate legal basis for this legislative proposal. The Commission introduced
the proposal on the basis of Article 95, which usually applies to internal market
directives. However, the content of the directive clearly raises issues that are central
to law and order. Second, the Council had done a considerable amount of policy work
on the issue of data retention prior to the introduction of the legislative proposal. Prior
to the introduction of the proposal there was another similar proposal on the agenda in
the Council. This similar proposal was based on a different treaty article, one that
would have allowed the Council to take a decision without involving the EP in a co-
decision procedure. The Council had almost reached an agreement on this similar
1Thesepredictionsareofthemodelvariantthatassumesanequaldistributionofpower
amongthememberstatesintheCouncil.Ifweassumeinsteadanunequaldistribution
ofpowerintheCouncilthatreflectsstates’votingpower(asmeasuredbytheBanzahf
index),theresultsaresimilar.Onthisparticularissue,withunequalmemberstates,themodels predict the same outcomes when rounded off to the nearest whole numbers.
Therearemarginaldifferencesbehindthedeimalplace.

7/27/2019 10f Thomson
http://slidepdf.com/reader/full/10f-thomson 20/35
20
proposal when it was replaced by the Commission’s new legislative proposal. This
may also have increased the Council’s bargaining power. MEP’s could have reasoned
that the Council may have reverted back to the earlier proposal, which would not have
required co-decision, if they attempted to alter the outcome of the Council’s
negotiations significantly. Third, terrorist attacks were carried out in London during
this period. In this context, MEPs would not wish to be seen preventing measures that
assist anti-terrorism operations. Fortunately for the EP, this is an unusual combination
of factors. As the results in the following section show, although the EP may not have
the power of the Council as a whole, it is generally a powerful actor in the EU’s
legislative process when the co-decision procedure applies.
5. Analysis of alternative power distributions
The predictive accuracy of supranational and intergovernmental models
Table 2 compares the different predictions with each other and with actual decision
outcomes. The predictions of the supranational and intergovernmental models differ
considerably from each other. For example, the average distance between the
predictions of the intergovernmental model and the first variant of the supranational
model is 27.12 scale points. The intergovernmental model’s errors are lower than
either of the supranational variants. The intergovernmental model’s predictions have
an average error of 24.67, compared to the best-predicting supranational model’s error
of 27.93. However, the most accurate forecasts are generated by the baseline NBS-no
RP, with an average error of 23.72. Since the NBS weights all actors’ positions
equally, this is equivalent to assuming that each of the supranational institutions has
the power of a member state, again each of which is weighted equally.
<Table 2>
Table 3 examines the errors of the models before and after enlargement and by
legislative procedure. There is a similar pattern of model performance before and after
enlargement. Both before and after enlargement, the NBS-no RP that weighs all
positions (not institutions!) equally has the lowest prediction errors. The
7/27/2019 10f Thomson
http://slidepdf.com/reader/full/10f-thomson 21/35
21
intergovernmental model generates more accurate predictions of decision outcomes
than either of the supranational models, both before and after enlargement.
<Table 3>
In general, the NBS-no RP makes the most accurate predictions of decision
outcomes within each sub-set of controversies that were subject to a different
legislative procedure. There are two exceptions. This first is that on the controversies
in the EU-15 that were subject to the consultation procedure and unanimity in the
Council, the intergovernmental model gives the most accurate predictions. This
means that including information regarding the Commission’s policy demands
actually decreases predictive accuracy. The second exception is perhaps less
important, since it concerns the small group of cases that combine co-decision with
unanimity voting in the Council. In these cases, the supranational models perform
relatively well, but there are few of these cases.
Table 4 refers to the models’ predictive power by comparing each pair of
models. The only significant difference is that the NBS-no RP is significantly more
accurate than the intergovernmental model. This means that across all of the
controversies examined, taking at least some account of the information regarding the
Commission and EP’s policy demands increases predictive accuracy. There is,
however, no significant difference between the accuracy of the intergovernmental and
supranational models’ predictions. Nor is there a significant difference between the
accuracy of the NBS-no RP and the supranational models’ predictions. Therefore,
although the models make considerably different predictions, the accuracy of those
predictions do not differ significantly. This suggests that both the intergovernmental
and NBS-no RP underestimate the power of the Commission and EP while the
supranational models overestimate their power. This is a possibility that will be
further investigated in the next section.2
2 The results reported in this section are based on models with the assumption that
power is distributed evenly among the members states in the Council. The relative
performanceoftheNBS,theintergovernmentalandsupranationalmodelsarethesame
ifweassumeanunequaldistributionofpowerintheCouncil.Weightingmemberstates’
positionswiththeirvotingweights(Banzahfindicies)theintergovernmentalmodelhas
anerrorof24.67(s.d.21.43),thefirstvariantofthesupranationalmodel(withequalweightsfor theCommissionand EPunder co-decision)an error of 27.69 (s.d. 23.11),
and the second variant of the suprantional model (which excludes the Commission
7/27/2019 10f Thomson
http://slidepdf.com/reader/full/10f-thomson 22/35
22
<Table 4>
The best-fitting power distributions
This part of the analysis begins by finding the best-fitting power scores for the
controversies that fell under the consultation procedure. For these controversies, I
vary the power of the Commission relative to the Council and exclude the EP. I first
divide the controversial issues into those before and after the 2004 enlargement and
those subject to QMV and unanimity. For each group of issues, Figure 2 depicts the
model’s error with different assumptions about the power of the Commission relative
to the Council. These analyses assume an equal distribution of power among the
member states in the Council. The unbroken line in the EU-15 graph depicts the error
of the model’s predictions for the issues subject to unanimity voting in the Council.
As the power of the Commission relative to the Council increases from 0 to 200 in the
model, the model’s errors increase from just under 20 points to just over 30 points. In
other words, giving any power at all to the Commission in the model only decreases
the model’s predictive accuracy. This result is exactly the same if we assume an
unequal distribution of power among the Council members (Figure 3).
For the controversies subject to consultation and QMV in the EU-15 the
results differ. For these issues, up to a point increasing the power of the Commission
relative to the Council decreases the model’s errors. As depicted in Figure 2,
assuming that power is equally distributed in the Council, that point is a power score
for the Commission of 27 relative to the Council’s 100. Giving the Commission either
higher or lower power scores reduces the predictive accuracy of the model. If we
assume an unequal distribution of power in the Council, the results are very similar.
The lowest error is associated with a model that gives a power score of 30 to the
Commission relative to the Council’s total score of 100 (Figure 3).
In the post-2004 period, the best-fitting power score for the Commission is
also close to 0 for those controversies decided under the consultation procedure with
unanimity in the Council. The lower half of Figure 2 illustrates that modestly
underco-decision)alsohasanerrorof27.59(s.d.23.11).Againthesuperiorpredictiveperformance of the NBS over the intergovernmental model is significant(p=.03, two-
tailedsigntest).

7/27/2019 10f Thomson
http://slidepdf.com/reader/full/10f-thomson 23/35
23
increasing the power of the Commission decreases the model’s error. For the
consultation issues subject to unanimity, the best-fitting power score for the
Commission is 3 per cent of the Council’s total, assuming an equal distribution of
power in the Council and 4 per cent assuming an unequal distribution in the Council
(Figure 3).
The Commission’s best-fitting power score for controversies decided by
consultation and QMV is considerably lower than its power score in the EU-15. For
these post-2004 controversies, the best-fitting power score for the Commission is 17
per cent of the Council’s total, assuming equal distribution in the Council, and 18 per
cent assuming an unequal distribution.
<Figure 2>
<Figure 3>
The power-fitting analyses of the co-decision cases examine different
combinations of power scores for the Commission and EP relative to the Council.
Figure 4 depicts variation in the model’s performance with different assumptions
regarding the distribution of power among the Commission, EP and Council. The
vertical axis in Figure 4 shows the size of the model’s average prediction errors. If we
attribute relatively high power scores to either or both the Commission and EP
relative to the Council, then the model’s errors are relatively high. The most accurate
predictions are given by model variants that attribute modest power scores to both the
Commission and EP. This is the case for controversies before and after the 2004
enlargement.
The best-fitting power scores are summarized in Figure 5. Consider first the
best-fitting power scores for the co-decision controversies prior to the 2004
enlargement. The Commission’s power is 9 per cent of the Council’s total power,
while the EP has 12 per cent, if we assume an equal distribution of power in the
Council. Assuming an unequal distribution of power in the Council, the
Commission’s power amounts to 15 per cent and the EP’s to 20 per cent of the
Council’s total.
The power of both the Commission and EP relative to the Council appears to
have decreased somewhat since enlargement. If we assume an equal distribution of
7/27/2019 10f Thomson
http://slidepdf.com/reader/full/10f-thomson 24/35
24
power in the Council, the Commission’s power in the co-decision procedure
decreased from 9 to 5 per cent after the 2004 enlargement. Assuming an unequal
distribution of power in the Council, the Commission’s score decreased from 15 to 3
per cent of the Council’s power. Assuming equal weights for the Council members,
the EP’s power decreased from 12 to 9 per cent of the Council’s power. Assuming an
unequal distribution of power, the EP’s power decreased from 20 to 11 per cent.
<Figure 4>
<Figure 5>
The results are similar if the analysis excludes the Commission and instead
varies only the power of the EP relative to the Council in the co-decision
controversies. The only noteworthy difference is that the power of the EP is estimated
to be somewhat higher for the EU-15 cases assuming an equal distribution of power
in the Council. In other words, the fact that the best-fitting power scores for the EP
under co-decision attribute a modest amount of power to the EP is generally not due
to the inclusion of the Commission in the analyses. First, assuming an equal
distribution of power in the Council, excluding the Commission, the best-fitting
power score for the EP is 28 and 8 per cent of the Council’s total before and after
enlargement. This compares to 12 and 9 per cent before and after enlargement when
including the Commission in the analysis. Second, assuming an unequal distribution
of power in the Council, excluding the Commission from the analysis, the best-fitting
power scores for the EP are 23 and 12 per cent of the Council’s total before and after
enlargement. This is quite similar to the power scores obtained from the analyses that
included the Commission; there, the EP had 20 and 11 per cent of the Council’s total
before and after enlargement, assuming an unequal distribution of power in the
Council.
6. Conclusions
The headline finding from this paper is that the Commission and EP have substantial
power to shape the way in which controversy is resolved in the co-decision procedure,
now the ordinary legislative procedure. Attributing some power to these supranational

7/27/2019 10f Thomson
http://slidepdf.com/reader/full/10f-thomson 25/35
25
institutions allows the model to predict decision outcomes more accurately. The
analysis also searched inductively among a large number of different assumptions
regarding the power of the institutions to find the assumption that allow the model to
generate the most accurate predictions of decision outcomes. These best-fitting power
scores give the Commission and EP up to about 30 per cent of the Council’s power,
depending on the legislative procedure and the assumptions made regarding the
distribution of power among the member states. Depending on the legislative
procedure, each of the supranational institutions has a similar level of power to two or
three large member states. It is not, however, realistic to place either the EP or the
Commission on a par with the Council as a whole in terms of its power.
In the now less frequently used consultation procedure, in which the main
actors are the Commission and the Council, the Commission retains substantial power
relative to the Council when QMV applies in the Council. The Commission’s power
in the consultation-QMV controversies appears to have declined considerably since
enlargement, from around 30 to around 15-20 per cent of the Council’s total. This
supports the view that the Commission’s power is in decline (Moravcsik 2008).
Regarding controversies subject to consultation-unanimity, the Commission had and
still has little to no power relative to the member states.
Although the Commission and EP have substantial power relative to the
Council, their power is less than that estimated by practitioners who hold a clearly
supranational view of the decision-making process. Their power is also lower than
might be supposed by scrutinizing the formal procedural rules. The co-decision
procedure, for instance, can reasonably be read as giving equal power to the Council
and the EP (e.g. Tsebelis and Garrett 2000). The findings therefore raise the question
of how the informal practices undermine the effectiveness of the EP’s formal
procedural power. One cause for concern is that secretive Council meetings
institutionalize information asymmetries between the Council and EP (Benedetto
2005). While Council members know what goes on in the EP, MEPs depend on
Council members for information on discussions in the Council. Another problem
concerns the personnel support available to MEPs. At present, most MEPs’ have two
or three assistants, often at quite junior levels. MEPs also draw on support from staff
in their party groups and relevant parliamentary committees, but these staff must also
support other MEPs. This level of support compares unfavourably to the support
available to representatives of members states in the Council of Ministers, who draw

7/27/2019 10f Thomson
http://slidepdf.com/reader/full/10f-thomson 26/35
26
on the resources of large national ministries. By comparison, Members of Congress in
the United States have large teams of advisors at their disposal.
Part of the difference between this paper’s research findings and the
supranational view is due to this study’s specific focus on power as the ability to
affect decision outcomes in the face of opposition from other actors. The
supranational view, particularly of practitioners, may be informed by an awareness of
the importance of the Commission and EP in other respects. For instance, the
Commission’s preparatory policy work, often including extensive consultations with
interest groups and member states, undoubtedly affects the contents of adopted
legislation. The Commission, in addition to the Council presidency, is also adept at
forging political compromises among other actors. Although these are important
tasks, they are distinct from power as defined here. Similarly, the EP perhaps has
more prominence than power relative to the Council. Not only is the EP highly visible
in the process, parliamentarians often raise issues that did not occur in the oftentimes
technical discussions that take place among member states’ representatives in Council
working groups. Such EP actions undoubtedly also affect the contents of adopted
legislation. However, the findings indicate that when the Council members and EP
take different positions on a controversy, the EP has less power than the Council.
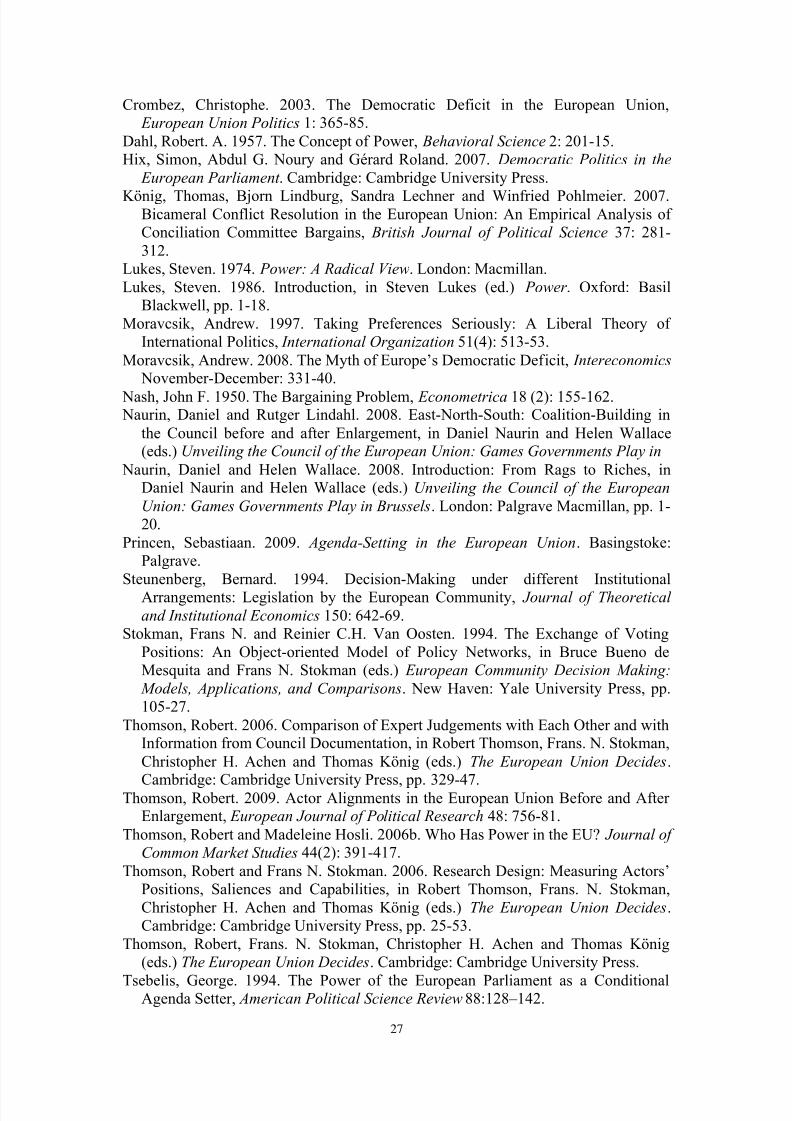
References
Achen, Chritopher H. 2006a. Institutional Realism and Bargaining Models, in Robert
Thomson, Frans. N. Stokman, Christopher H. Achen and Thomas König (eds.) The
European Union Decides. Cambridge: Cambridge University Press, pp. 86-123.
Achen, Chritopher H. 2006b. Evaluating Political Decision-Making Models, in Robert
Thomson, Frans. N. Stokman, Christopher H. Achen and Thomas König (eds.) The European Union Decides. Cambridge: Cambridge University Press, pp. 264-98.
Bachrach, Peter and Morton S. Baratz. 1970. Power and Poverty: Theory and
Practice. New York: Oxford University Press.Banzhaf, John. F. 1965. Weighted Voting Does not Work: A Mathematical Analysis, Rutgers Law Review 35: 317-43.
Barry, Brian. 1980. Is it Better to be Powerful or Lucky? Part 1, Political Studies 28:183-194.
Benedetto, Giacomo. 2005. Rapporteurs as Legislative Entrepreneurs: the Dynamics
of the Codecision Procedure in Europe’s Parliament, Journal of European Public
Policy 12(1): 67-88.
Bueno de Mesquita, Bruce and Frans N. Stokman. (eds.) 1994. European Community
Decision Making: Models, Applications and Comparisons. New Haven: Yale
University Press.
Coleman, James S. 1972. Systems of Social Exchange, Journal of Mathematical Sociology 2: 145-63.
7/27/2019 10f Thomson
http://slidepdf.com/reader/full/10f-thomson 27/35
27
Crombez, Christophe. 2003. The Democratic Deficit in the European Union,
European Union Politics 1: 365-85.
Dahl, Robert. A. 1957. The Concept of Power, Behavioral Science 2: 201-15.
Hix, Simon, Abdul G. Noury and Gérard Roland. 2007. Democratic Politics in the
European Parliament . Cambridge: Cambridge University Press.
König, Thomas, Bjorn Lindburg, Sandra Lechner and Winfried Pohlmeier. 2007.Bicameral Conflict Resolution in the European Union: An Empirical Analysis of
Conciliation Committee Bargains, British Journal of Political Science 37: 281-
312.
Lukes, Steven. 1974. Power: A Radical View. London: Macmillan.
Lukes, Steven. 1986. Introduction, in Steven Lukes (ed.) Power . Oxford: Basil
Blackwell, pp. 1-18.
Moravcsik, Andrew. 1997. Taking Preferences Seriously: A Liberal Theory of
International Politics, International Organization 51(4): 513-53.
Moravcsik, Andrew. 2008. The Myth of Europe’s Democratic Deficit, Intereconomics November-December: 331-40.
Nash, John F. 1950. The Bargaining Problem, Econometrica 18 (2): 155-162. Naurin, Daniel and Rutger Lindahl. 2008. East-North-South: Coalition-Building in
the Council before and after Enlargement, in Daniel Naurin and Helen Wallace(eds.) Unveiling the Council of the European Union: Games Governments Play in
Naurin, Daniel and Helen Wallace. 2008. Introduction: From Rags to Riches, inDaniel Naurin and Helen Wallace (eds.) Unveiling the Council of the European
Union: Games Governments Play in Brussels. London: Palgrave Macmillan, pp. 1-
20.
Princen, Sebastiaan. 2009. Agenda-Setting in the European Union. Basingstoke:
Palgrave.
Steunenberg, Bernard. 1994. Decision-Making under different Institutional
Arrangements: Legislation by the European Community, Journal of Theoretical
and Institutional Economics 150: 642-69.
Stokman, Frans N. and Reinier C.H. Van Oosten. 1994. The Exchange of Voting
Positions: An Object-oriented Model of Policy Networks, in Bruce Bueno de
Mesquita and Frans N. Stokman (eds.) European Community Decision Making:
Models, Applications, and Comparisons. New Haven: Yale University Press, pp.
105-27.
Thomson, Robert. 2006. Comparison of Expert Judgements with Each Other and withInformation from Council Documentation, in Robert Thomson, Frans. N. Stokman,
Christopher H. Achen and Thomas König (eds.) The European Union Decides.
Cambridge: Cambridge University Press, pp. 329-47.Thomson, Robert. 2009. Actor Alignments in the European Union Before and After Enlargement, European Journal of Political Research 48: 756-81.
Thomson, Robert and Madeleine Hosli. 2006b. Who Has Power in the EU? Journal of
Common Market Studies 44(2): 391-417.
Thomson, Robert and Frans N. Stokman. 2006. Research Design: Measuring Actors’
Positions, Saliences and Capabilities, in Robert Thomson, Frans. N. Stokman,
Christopher H. Achen and Thomas König (eds.) The European Union Decides.
Cambridge: Cambridge University Press, pp. 25-53.
Thomson, Robert, Frans. N. Stokman, Christopher H. Achen and Thomas König
(eds.) The European Union Decides. Cambridge: Cambridge University Press.
Tsebelis, George. 1994. The Power of the European Parliament as a ConditionalAgenda Setter, American Political Science Review 88:128–142.

7/27/2019 10f Thomson
http://slidepdf.com/reader/full/10f-thomson 28/35
28
Tsebelis, George and Geoffrey Garrett. 2000. Legislative Politics in the EU,European Union Politics 1: 9–36.
Tsebelis, George and Xenophon Yataganas. 2002. Veto Players and Decision-Making
in the EU after Nice: Policy Stability and Bureaucratic/Judicial Discretion, Journal
of Common Market Studies 40: 283-307.
Weber, Max. 2007[1914]. The Distribution of Power within the Political Community:Class, Status, Party, in Craig Calhoun, Joseph Gerteis, James Moody, Steven Pfaff
and Indermohan Virk (eds.) Classical Sociological Theory, 2nd edition. Malden
MA: Blackwell, pp. 247-54.

7/27/2019 10f Thomson
http://slidepdf.com/reader/full/10f-thomson 29/35
29
Figures and tables
Table 1 Distribution of selected proposals and issues by decision-making procedures
Time period EP involvement Council voting
rule
Proposals
selected by
researchers
Issues identified
with experts
Consultation QMV 22 (22) 55 (55)EU-15 (1999-
2000) Unanimity 19 (19) 43 (43)
Co-decision QMV 22 (22) 59 (58)
Unanimity 6 (6) 16 (16)
Post-2004 Consultation QMV 16 (16) 41 (41)
Unanimity 3 (3) 9 (9)
Co-decision QMV 36 (35) 104 (102)
Unanimity 1 (0) 4 (0)
Total 125 (123) 331 (324)
Note: In parentheses are the numbers of proposals and issues with final decision outcomes.
Table 2 The intergovernmental and supranational models compared
Outcome Intergovern-
mental
Supranational
(COD with
COM and EP)
Supranational
(COD with EP
only)
Intergovernmental 24.67
(21.22, 324)
Supranational
(COD with COM
and EP)
28.13
(23.47, 324)
27.12
(20.51, 331)
Supranational
(COD with EP only)
27.93
(23.58, 324)
26.28
(20.66, 331)
8.48
(11.25, 331)
NBS-no RP 23.72
(19.23, 324)
5.12
(5.99, 331)
22.21
(15.88, 331)
22.18
(16.03, 331)
NB: Cells contain the mean absolute difference between the policy positions referred to in the
relevant columns and rows. Standard deviation and numbers of cases in parentheses.

7/27/2019 10f Thomson
http://slidepdf.com/reader/full/10f-thomson 30/35
7/27/2019 10f Thomson
http://slidepdf.com/reader/full/10f-thomson 31/35
31
What are the positions of the actors regarding the crimes against which retained data can be
used?
Figure 1 A controversy raised by the proposed directive on data retention.
Note: Proposal COD/2005/182.
Position
0:Leave
to
national
legialtion
Position100:
Allseriouscrimes.
Outcome
AT,CY,CZ,DK,EE,FR,
HU,IE,IT,LV,LT,MT,
PL,PT,SI,SK,ES,SE,
UK(90)
30:
Limitedto
terrorism
&
organized
crime
COM(50),
BE,FI,DE,EL,
LU,NL 30
70:
European
Arrest
Warrantlist
EP(90)

7/27/2019 10f Thomson
http://slidepdf.com/reader/full/10f-thomson 32/35

7/27/2019 10f Thomson
http://slidepdf.com/reader/full/10f-thomson 33/35

7/27/2019 10f Thomson
http://slidepdf.com/reader/full/10f-thomson 34/35
34
EU-15
EU-25/27
Figure 4 Errors from varying the three institutions’ relative power under co-decision
Note: Mean absolute errors of predictions assuming different levels of EP and Commission
capabilities relative to the Council set at 100, assuming equal weights in the Council.

7/27/2019 10f Thomson
http://slidepdf.com/reader/full/10f-thomson 35/35