10b11pd311 economics. b, burgers 302515 z, pizzas per semester 25 20 15 10 0 d a b e c f
TRANSCRIPT

10B11PD311 Economics

10B11PD311 Economics
B , Burgers
302515Z , Pizzas per semester
25
20
15
10
0
da
b
e
c
f

10B11PD311 Economics
Individuals can rank their preferences
Non-satiation - people prefer more to less
Transitivity - rankings are consistent
Individuals are willing to give up successfully smaller amounts of one good in order to get additional units of other goods

10B11PD311 Economics
Bundles of Pizzas and Burgers a consumer might consume
B, Burgersper semester Indifference Curve
302515
Z, Pizzas per semester
25
20
15
10
0
da
bI
e
c
f
Individuals can rank their preferences
Non-satiation - people prefer more to less
Transitivity - rankings are consistent
Individuals are willing to give up successfully smaller amounts of one good in order to get additional units of other goods

10B11PD311 Economics
Preference MapB , Burgers
per semester
302515Z , Pizzas per semester
25
20
15
10
0
d
I0
I 1
I 2e
c
fIndifference curve on the right means greater satisfaction
Bundles of Pizzas and Burgers a consumer might consume

10B11PD311 Economics
Impossible Indifference Curves
B, Burgersper semester
Crossing
Z, Pizzas per semester
I1
I0a
be
Violation of Transitivity

10B11PD311 Economics
Impossible Indifference Curves
B, Burgersper semester
Upward Sloping
Z, Pizzas per semester
I
a
b

10B11PD311 Economics
Impossible Indifference Curves
B, Burgersper semester
a
b
Thick
Z, Pizzas per semester
I
No two points can have same satisfaction level

10B11PD311 Economics
Indifference curves (IC) are downward sloping Convex to the origin do not intersect
Higher IC reflect greater level of satisfaction
Properties of Indifference Curves
10B11PD311 Economics
Pizzas
Burg
ers
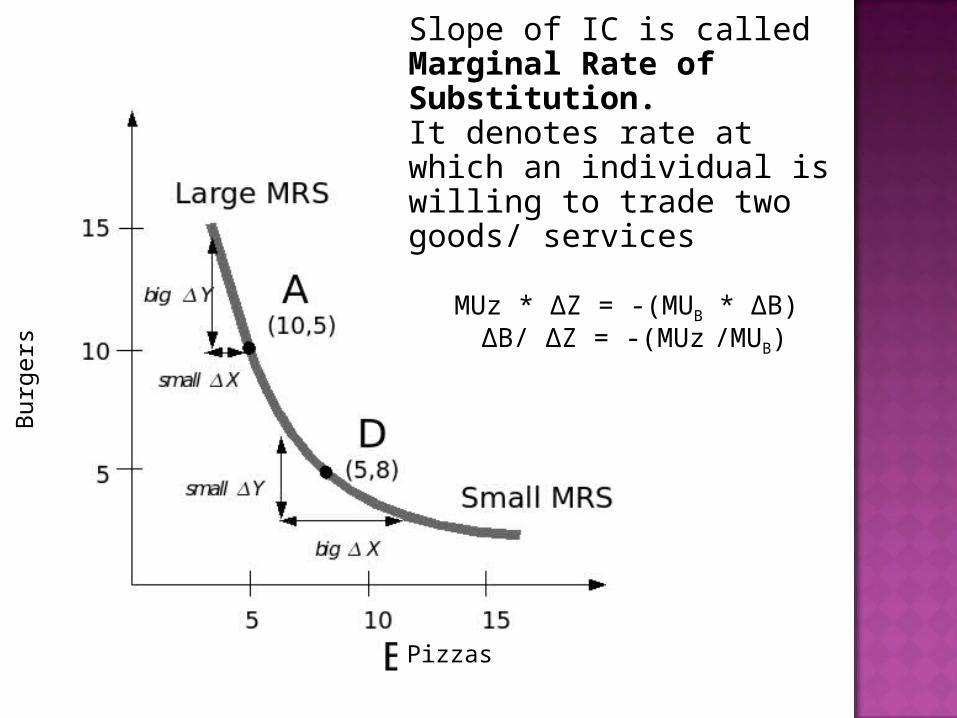
Slope of IC is called Marginal Rate of Substitution. It denotes rate at which an individual is willing to trade two goods/ services
MUz * ΔZ = -(MUB * ΔB) ΔB/ ΔZ = -(MUz /MUB)

10B11PD311 Economics
Budget ConstraintB, Burgers
per semester
Opportunity set
50 = M /pZ
L1 (pZ = $1, PB = $2, M = $50)
25 = M /pB
20
10
100 30
Z, Pizzas per semester
a
b
c
d

10B11PD311 Economics
M PZQZ + PBQB
QZ = M/PZ - PB/PZ*QB
QB = M/PB - PZ/PB*QZ
Slope = - PZ/PB

10B11PD311 Economics
Changes in the Budget Constraint
B, Burgersper semester
Price of Pizza Doubles
50
L1 (pZ = $1)
25
0
Z, Pizzas per semester

10B11PD311 Economics
Changes in the Budget Constraint
B, Burgersper semester Price of Pizza Doubles
Loss
50
L1 (pZ = $1)
L2 (pZ = $2)
25
250
Z, Pizzas per semester

10B11PD311 Economics
Changes in the Budget Constraint
B, Burgersper semester Income Doubles
L1 (M = $50)
25
500
Z, Pizzas per semester

10B11PD311 Economics
Changes in the Budget Constraint
B, Burgersper semester Income Doubles
Gain
100
L3 (M = $100)
L1 (M = $50)
50
25
500
Z, Pizzas per semester

10B11PD311 Economics
Consumer Equilibrium is attained when maximum satisfaction is obtained from given choices-
Utility Maximization

10B11PD311 Economics
Utility Maximization
B, Burgersper semester
Budget line
10
20
25
5030100
Z, Pizzas per semester
I1d
c
a
g
A
B

10B11PD311 Economics
Utility Maximization
B, Burgersper semester
Budget line
10
20
25
5030100Z, Pizzas per semester
I1I2I3
d
fc
e
a
g
A
B

10B11PD311 Economics
Deriving an Individual’s Demand Curve
5.2
12.0
0
L3 (pb = $4)
e3
I 3
B
Price-consumption curve
A
58.9

10B11PD311 Economics
Deriving an Individual’s Demand Curve
4.3
5.2
12.0
0
L 2 ( pb
= $6) L 3 ( pb = $4)
e3
e2
I 2
I 3
B
Price-consumption curve
A
44.5 58.9
As Price of B increases from $4 to $6, consumer shifts to lower IC

10B11PD311 Economics
Deriving an Individual’s Demand Curve
4.3
5.2
12.0
2.8
0
L 1 ( pb
= $12) L 2 ( pb
= $6) L 3 ( pb = $4)
e3
e2
e1
I 1
I 2
I 3
B
Price-consumption curve
A
26.7 44.5 58.9

10B11PD311 Economics
4.3
5.2
12.0
2.8
12.0
6.0
4.0
26.70 44.5 58.9
L1 (pb = $12)
pb, $ per unit
L2 (pb = $6) L3 (pb = $4)
26.70 44.5 58.9
e3
e2
e1
E3
E2
E1
I 1
I2
I 3
Price-consumption curve
(a) Indifference Curves and Budget Constraints
(b) Demand Curve
Deriving an Individual’s Demand Curve
B
A
B

10B11PD311 Economics
4.3
5.2
12.0
2.8
12.0
6.0
4.0
26.70 44.5 58.9
L1 (pb = $12)
pb, $ per unit
L2 (pb = $6) L3 (pb = $4)
26.70 44.5 58.9
e3e2
e1
E3
E2
E1
I1
I2I3
D1, Demand for B
Price-consumption curve
(a) Indifference Curves and Budget Constraints
(b) Demand Curve
Deriving an Individual’s Demand Curve
B
A
B

10B11PD311 Economics
X
Y
CONSUMER CHOICE AND CHANGE IN DEMAND
O
SUBSTITUTION EFFECT
E

10B11PD311 Economics
X
Y Y
X
CONSUMER CHOICE AND CHANGE IN DEMAND
O
SUBSTITUTION EFFECT
E

10B11PD311 Economics
X
Y Y
X
CONSUMER CHOICE AND CHANGE IN DEMAND
O
O`
SUBSTITUTION EFFECT
E
F
On the same IC, consumer shifts up & down by substituting one in place of another

10B11PD311 Economics
INCOME EFFECT
X
Y
G
F
N

10B11PD311 Economics
INCOME EFFECT
X
Y
G’
G
F F’
M
N
Consumer shifts to higher IC

10B11PD311 Economics
12.0
0 20 30
L1
e1
Price Effect with Normal Goods Y

10B11PD311 Economics
12.0
0 7520 30
Price effect
I 2I1
L2
L1
e2
e1
Price Effect with Normal Goods Y
X
e3