10.8 warm up warm up lesson presentation lesson presentation compare linear, exponential, and...
TRANSCRIPT

10.8
Warm UpWarm Up
Lesson PresentationLesson Presentation
Compare Linear, Exponential, and Quadratic Models

10.8 Warm-Up
1. Graph y = 3x.
ANSWER yes
ANSWER
Tell whether the ordered pairs (0, 0), (1, 2), (2, 4), and (3, 6) represent a linear function.
2.
ANSWER 5, –7, –5
For y = x2 – 3x – 5, find corresponding y-values for the x-values –2, 1, and 3.
3.

10.8 Example 1
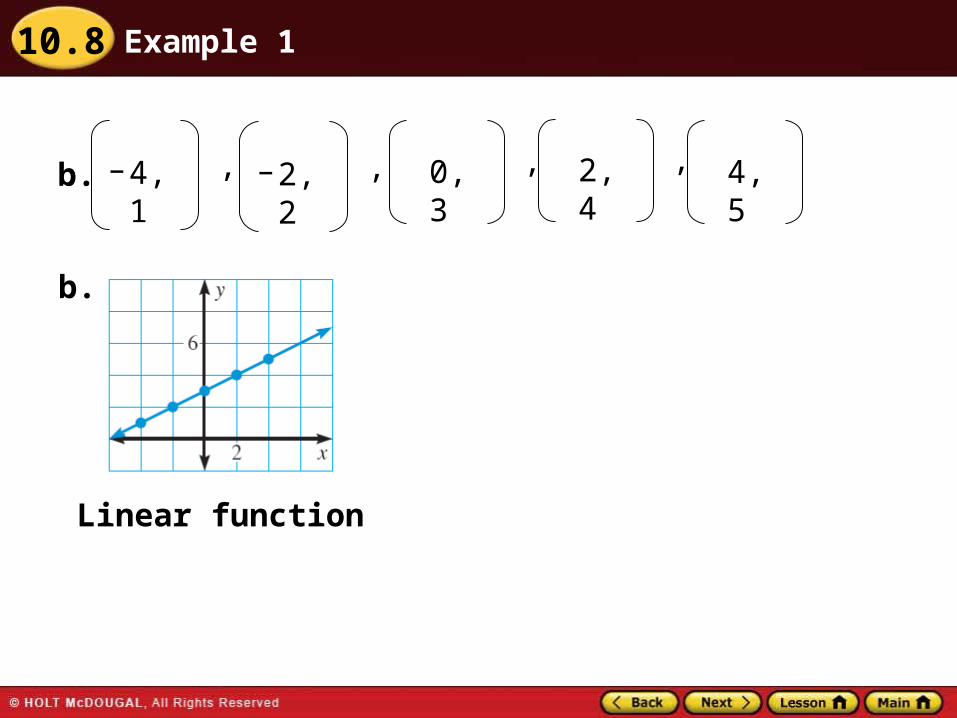
Use a graph to tell whether the ordered pairs represent a linear function, an exponential function, or a quadratic function.
a. – 4,1
32 0,
1 2
– 2,18
2, 2 4, 8,, , ,
a.
Exponential function
SOLUTION
10.8 Example 1
b.
Linear function
b. – 4, 1 , –2, 2 , 0, 3 , 4, 52, 4 ,

10.8 Example 1
c. –4, 5 , –2, 2 , 0, 1 , 4, 52, 2 ,
c.
Quadratic function

10.8 Guided Practice
1. Tell whether the ordered pairs represent a linear function, an exponential function, or a quadratic function: (0, – 1.5), (1, – 0.5), (2, 2.5), (3, 7.5).
ANSWER
quadratic function

10.8 Example 2
Use differences or ratios to tell whether the table of values represents a linear function, an exponential function, or a quadratic function.
ANSWER
The table of values represents a quadratic function.
x –2 –1 0 1 2
y –6 –6 –4 0 6
First differences:
Second differences:
a.
0 2 4 6
2 2 2

10.8 Example 2
ANSWER
The table of values represents a linear function.
x – 2 – 1 0 1 2
y – 2 1 4 7 10
Differences:
b.
3 3 3 3
10.8 Guided Practice
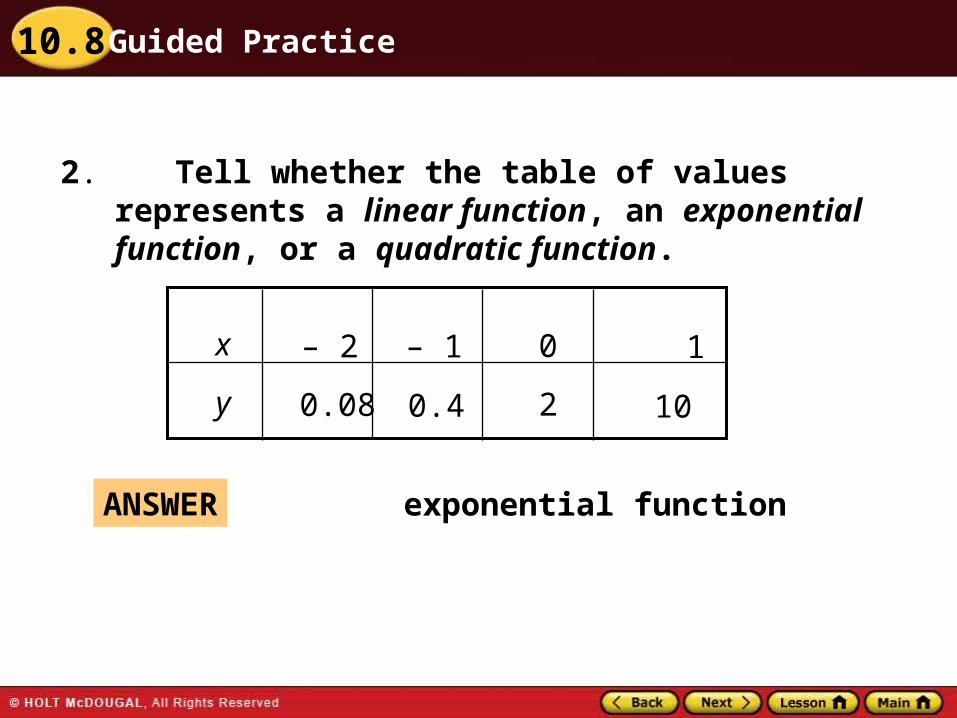
2. Tell whether the table of values represents a linear function, an exponential function, or a quadratic function.
ANSWER exponential function
0
y 2
x – 2 – 1 1
0.08 0.4 10
10.8 Bell Ringer 4/21/15
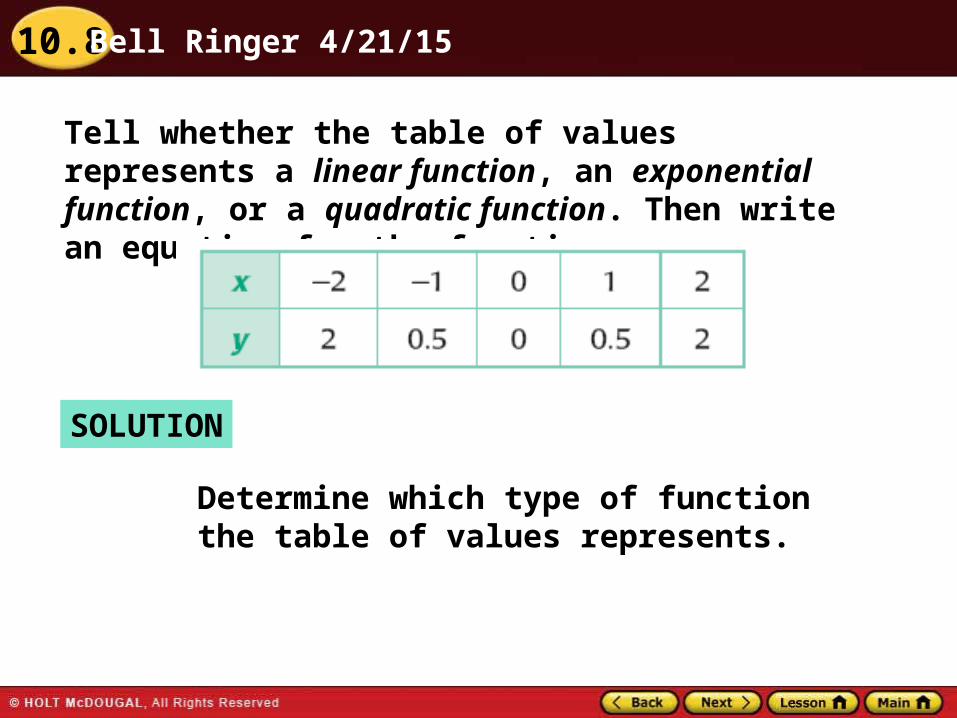
Tell whether the table of values represents a linear function, an exponential function, or a quadratic function. Then write an equation for the function.
SOLUTION
Determine which type of function the table of values represents.

10.8 Example 3
The table of values represents a quadratic function because the second differences are equal.
10.8 Example 3
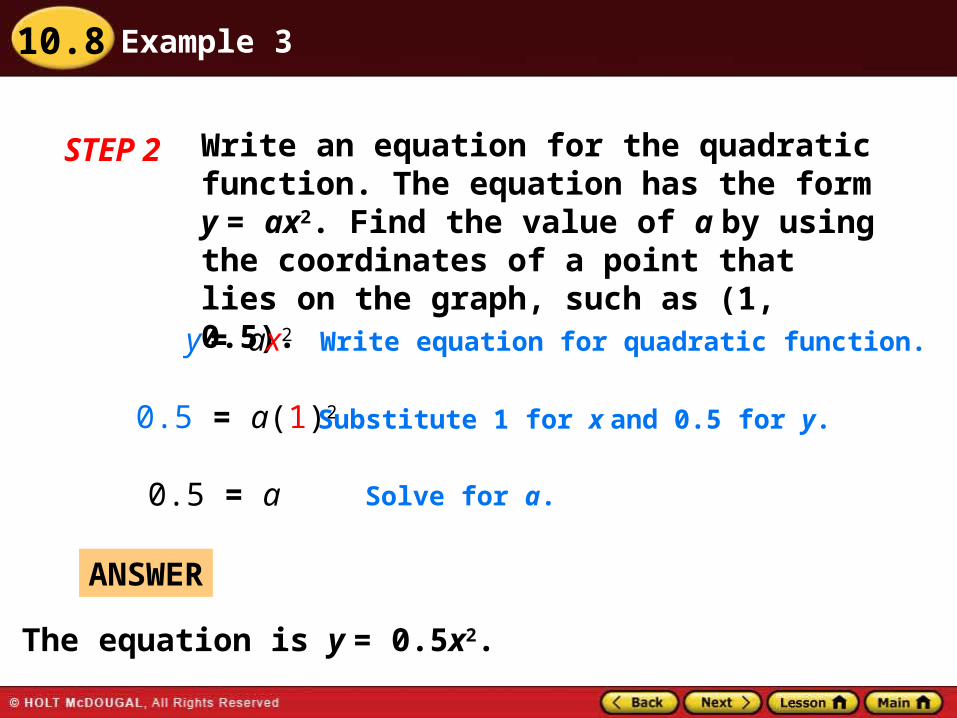
STEP 2 Write an equation for the quadratic function. The equation has the form y = ax2. Find the value of a by using the coordinates of a point that lies on the graph, such as (1, 0.5).
y = ax2 Write equation for quadratic function.
0.5 = a(1)2 Substitute 1 for x and 0.5 for y.
0.5 = a Solve for a.
ANSWER
The equation is y = 0.5x2.

10.8 Example 3
CHECK
Plot the ordered pairs from the table. Then graph y = 0.5x2 to see that the graph passes through the plotted points.

10.8 Guided Practice
Tell whether the table of values represents a linear function, an exponential function, or a quadratic function. Then write an equation for the function.
ANSWER
quadratic function, y = 2x2
3.
4.
ANSWER
linear function, y = 2x 1

10.8 Bell Ringer 4/22/15
The table shows the breathing rates y (in liters of air per minute) of a cyclist traveling at different speeds x (in miles per hour). Tell whether the data can be modeled by a linear function, an exponential function, or a quadratic function. Calculate the difference or ratio.
CYCLING

10.8 Example 5
SOLUTION
STEP 1 Graph the data. The graph has a slight curve. So, a linear function does not appear to model the data.

10.8 Example 5
STEP 2 Decide which function models the data. In the
table below, notice that 1.11, 1.11,
1.11, 1.11, and 1.11.
So, the ratios are all approximately equal. An exponential function models the data.
57.151.4
63.357.1
70.363.3
78.070.3
86.678.0

10.8 Example 5
STEP 3 Write an equation for the exponential function. The breathing rate increases by a factor of 1.11 liters per minute, so b = 1.11. Find the value of a by using one of the data pairs, such as (20, 51.4).
Write equation for exponential function.
Substitute 1.11 for b, 20 for x, and 51.4 for y.
y = abx
51.4 = a(1.11)20
Solve for a.51.4
(1.11)20 = a
Use a calculator.6.38 a
ANSWER The equation is y = 6.38(1.11)x.

10.8 Guided Practice
5. In Example 4, suppose the cyclist is traveling at 15 miles per hour. Find the breathing rate of the cyclist at this speed.
about 30.5 liters of air per minute
ANSWER
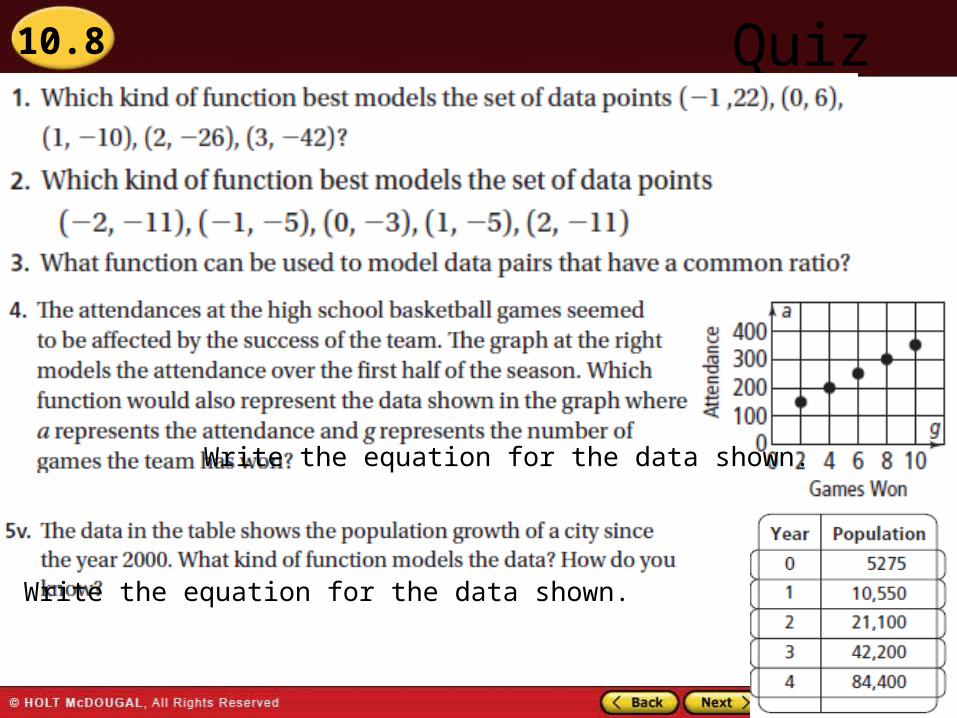
10.8 Quiz
Write the equation for the data shown.
Write the equation for the data shown.

10.8 Lesson Quiz
1.
Tell whether the data can be modeled by a linear function, an exponential function, or a quadratic function.
ANSWER quadratic

10.8 Lesson Quiz
ANSWER exponential; y = 0.025(2)x
2.
Tell whether the data can be modeled by a linear function, an exponential function, or a quadratic function. Then write an equation for the function.