104. two-way frequency tables
TRANSCRIPT
Name:_________________________________________________
ProbabilityUsingTwo-wayFrequencyTables
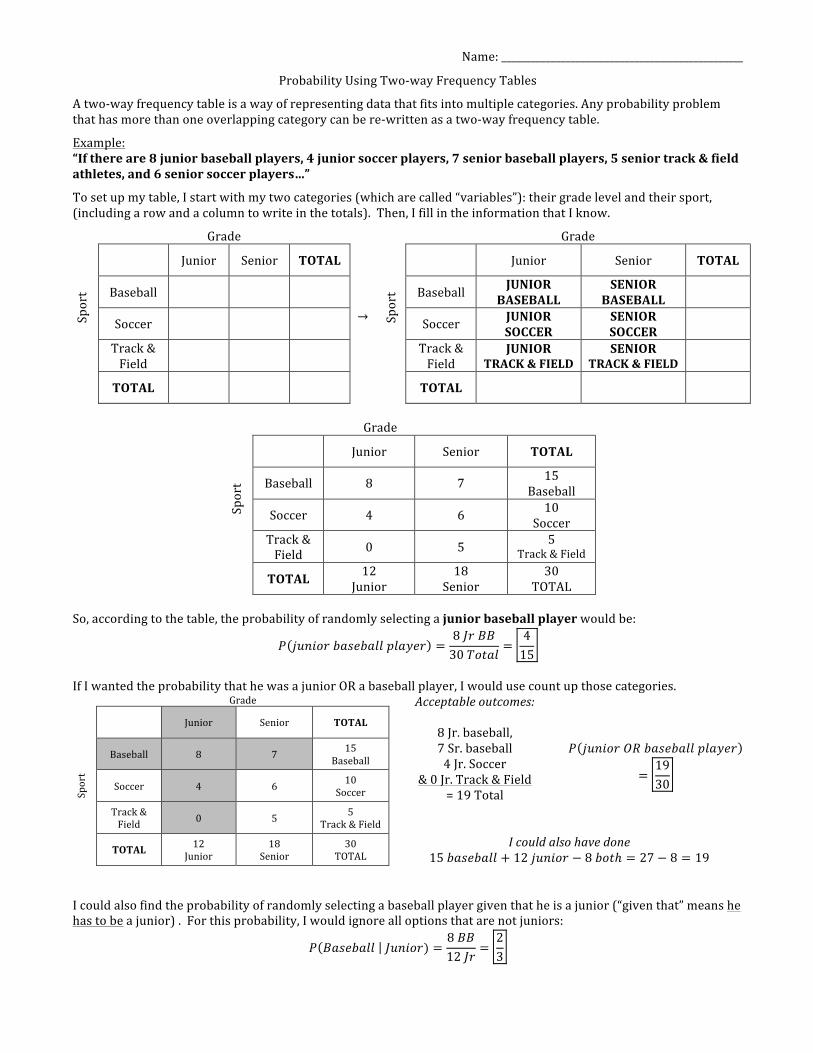
Atwo-wayfrequencytableisawayofrepresentingdatathatfitsintomultiplecategories.Anyprobabilityproblemthathasmorethanoneoverlappingcategorycanbere-writtenasatwo-wayfrequencytable.
Example:“Ifthereare8juniorbaseballplayers,4juniorsoccerplayers,7seniorbaseballplayers,5seniortrack&fieldathletes,and6seniorsoccerplayers…”
Tosetupmytable,Istartwithmytwocategories(whicharecalled“variables”):theirgradelevelandtheirsport,(includingarowandacolumntowriteinthetotals).Then,IfillintheinformationthatIknow.
Grade Grade
Sport
Junior Senior TOTAL
Sport
Junior Senior TOTAL
Baseball Baseball JUNIORBASEBALL
SENIORBASEBALL
Soccer → Soccer JUNIORSOCCER
SENIORSOCCER
Track&Field Track&
FieldJUNIOR
TRACK&FIELDSENIOR
TRACK&FIELD
TOTAL TOTAL
Grade
Sport
Junior Senior TOTAL
Baseball 8 7 15Baseball
Soccer 4 6 10Soccer
Track&Field 0 5 5
Track&Field
TOTAL 12Junior
18Senior
30TOTAL
So,accordingtothetable,theprobabilityofrandomlyselectingajuniorbaseballplayerwouldbe:
𝑃 𝑗𝑢𝑛𝑖𝑜𝑟 𝑏𝑎𝑠𝑒𝑏𝑎𝑙𝑙 𝑝𝑙𝑎𝑦𝑒𝑟 =8 𝐽𝑟 𝐵𝐵30 𝑇𝑜𝑡𝑎𝑙
=415
IfIwantedtheprobabilitythathewasajuniorORabaseballplayer,Iwouldusecountupthosecategories. Grade Acceptableoutcomes:
8Jr.baseball,7Sr.baseball4Jr.Soccer
&0Jr.Track&Field=19Total
𝑃 𝑗𝑢𝑛𝑖𝑜𝑟 𝑂𝑅 𝑏𝑎𝑠𝑒𝑏𝑎𝑙𝑙 𝑝𝑙𝑎𝑦𝑒𝑟
=1930
Sport
Junior Senior TOTAL
Baseball 8 7 15Baseball
Soccer 4 6 10Soccer
Track&Field 0 5 5
Track&Field
TOTAL 12Junior
18Senior
30TOTAL
Icouldalsohavedone15 𝑏𝑎𝑠𝑒𝑏𝑎𝑙𝑙 + 12 𝑗𝑢𝑛𝑖𝑜𝑟 − 8 𝑏𝑜𝑡ℎ = 27 − 8 = 19
Icouldalsofindtheprobabilityofrandomlyselectingabaseballplayergiventhatheisajunior(“giventhat”meanshehastobeajunior).Forthisprobability,Iwouldignorealloptionsthatarenotjuniors:
𝑃 𝐵𝑎𝑠𝑒𝑏𝑎𝑙𝑙 𝐽𝑢𝑛𝑖𝑜𝑟) =8 𝐵𝐵12 𝐽𝑟
=23
ProbabilityUsingTwo-wayFrequencyTables 2
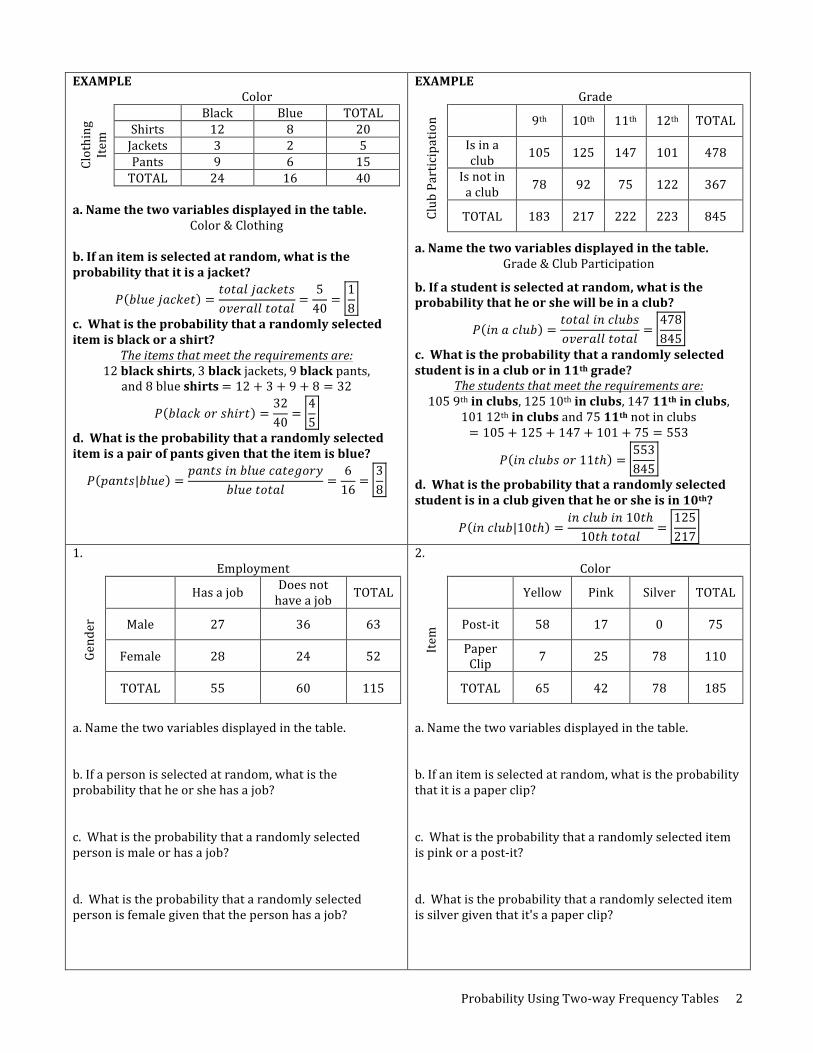
EXAMPLE Color
Clothing
Item
Black Blue TOTAL
Shirts 12 8 20Jackets 3 2 5Pants 9 6 15TOTAL 24 16 40
a.Namethetwovariablesdisplayedinthetable.
Color&Clothingb.Ifanitemisselectedatrandom,whatistheprobabilitythatitisajacket?
𝑃 𝑏𝑙𝑢𝑒 𝑗𝑎𝑐𝑘𝑒𝑡 =𝑡𝑜𝑡𝑎𝑙 𝑗𝑎𝑐𝑘𝑒𝑡𝑠𝑜𝑣𝑒𝑟𝑎𝑙𝑙 𝑡𝑜𝑡𝑎𝑙
=540
=18
c.Whatistheprobabilitythatarandomlyselecteditemisblackorashirt?
Theitemsthatmeettherequirementsare:12blackshirts,3blackjackets,9blackpants,
and8blueshirts= 12 + 3 + 9 + 8 = 32
𝑃 𝑏𝑙𝑎𝑐𝑘 𝑜𝑟 𝑠ℎ𝑖𝑟𝑡 =3240
=45
d.Whatistheprobabilitythatarandomlyselecteditemisapairofpantsgiventhattheitemisblue?
𝑃 𝑝𝑎𝑛𝑡𝑠|𝑏𝑙𝑢𝑒 =𝑝𝑎𝑛𝑡𝑠 𝑖𝑛 𝑏𝑙𝑢𝑒 𝑐𝑎𝑡𝑒𝑔𝑜𝑟𝑦
𝑏𝑙𝑢𝑒 𝑡𝑜𝑡𝑎𝑙=
616
=38
EXAMPLE Grade
ClubParticipation 9th 10th 11th 12th TOTAL
Isinaclub 105 125 147 101 478
Isnotinaclub 78 92 75 122 367
TOTAL 183 217 222 223 845
a.Namethetwovariablesdisplayedinthetable.Grade&ClubParticipation
b.Ifastudentisselectedatrandom,whatistheprobabilitythatheorshewillbeinaclub?
𝑃 𝑖𝑛 𝑎 𝑐𝑙𝑢𝑏 =𝑡𝑜𝑡𝑎𝑙 𝑖𝑛 𝑐𝑙𝑢𝑏𝑠𝑜𝑣𝑒𝑟𝑎𝑙𝑙 𝑡𝑜𝑡𝑎𝑙
=478845
c.Whatistheprobabilitythatarandomlyselectedstudentisinacluborin11thgrade?
Thestudentsthatmeettherequirementsare:1059thinclubs,12510thinclubs,14711thinclubs,
10112thinclubsand7511thnotinclubs= 105 + 125 + 147 + 101 + 75 = 553
𝑃 𝑖𝑛 𝑐𝑙𝑢𝑏𝑠 𝑜𝑟 11𝑡ℎ =553845
d.Whatistheprobabilitythatarandomlyselectedstudentisinaclubgiventhatheorsheisin10th?
𝑃 𝑖𝑛 𝑐𝑙𝑢𝑏|10𝑡ℎ =𝑖𝑛 𝑐𝑙𝑢𝑏 𝑖𝑛 10𝑡ℎ10𝑡ℎ 𝑡𝑜𝑡𝑎𝑙
=125217
1. Employment
Gender
Hasajob Doesnothaveajob TOTAL
Male 27 36 63
Female 28 24 52
TOTAL 55 60 115
a.Namethetwovariablesdisplayedinthetable.b.Ifapersonisselectedatrandom,whatistheprobabilitythatheorshehasajob?c.Whatistheprobabilitythatarandomlyselectedpersonismaleorhasajob?d.Whatistheprobabilitythatarandomlyselectedpersonisfemalegiventhatthepersonhasajob?
2. Color
Item
Yellow Pink Silver TOTAL
Post-it 58 17 0 75
PaperClip 7 25 78 110
TOTAL 65 42 78 185
a.Namethetwovariablesdisplayedinthetable.b.Ifanitemisselectedatrandom,whatistheprobabilitythatitisapaperclip?c.Whatistheprobabilitythatarandomlyselecteditemispinkorapost-it?d.Whatistheprobabilitythatarandomlyselecteditemissilvergiventhatit'sapaperclip?
ProbabilityUsingTwo-wayFrequencyTables 3
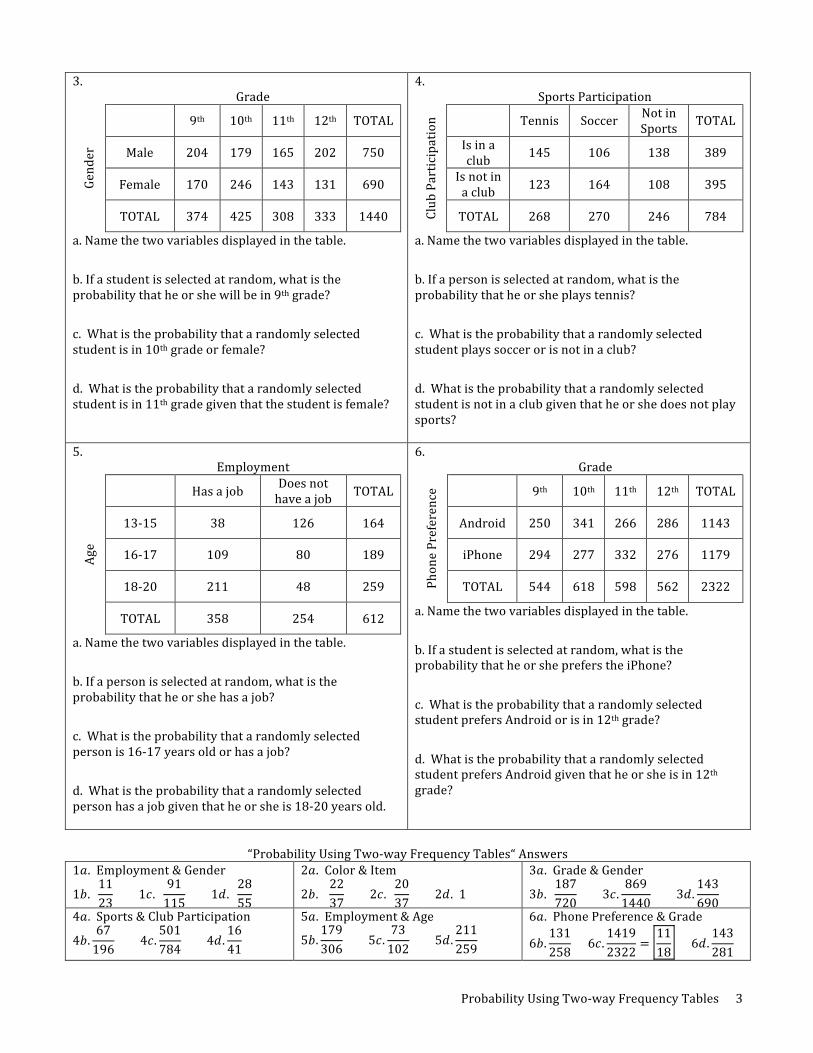
3. Grade
Gender
9th 10th 11th 12th TOTAL
Male 204 179 165 202 750
Female 170 246 143 131 690
TOTAL 374 425 308 333 1440
a.Namethetwovariablesdisplayedinthetable.
b.Ifastudentisselectedatrandom,whatistheprobabilitythatheorshewillbein9thgrade?
c.Whatistheprobabilitythatarandomlyselectedstudentisin10thgradeorfemale?
d.Whatistheprobabilitythatarandomlyselectedstudentisin11thgradegiventhatthestudentisfemale?
4. SportsParticipation
ClubParticipation Tennis Soccer Notin
Sports TOTAL
Isinaclub 145 106 138 389
Isnotinaclub 123 164 108 395
TOTAL 268 270 246 784
a.Namethetwovariablesdisplayedinthetable.
b.Ifapersonisselectedatrandom,whatistheprobabilitythatheorsheplaystennis?
c.Whatistheprobabilitythatarandomlyselectedstudentplayssoccerorisnotinaclub?
d.Whatistheprobabilitythatarandomlyselectedstudentisnotinaclubgiventhatheorshedoesnotplaysports?
5. Employment
Age
Hasajob Doesnothaveajob TOTAL
13-15 38 126 164
16-17 109 80 189
18-20 211 48 259
TOTAL 358 254 612
a.Namethetwovariablesdisplayedinthetable.
b.Ifapersonisselectedatrandom,whatistheprobabilitythatheorshehasajob?
c.Whatistheprobabilitythatarandomlyselectedpersonis16-17yearsoldorhasajob?
d.Whatistheprobabilitythatarandomlyselectedpersonhasajobgiventhatheorsheis18-20yearsold.
6. Grade
PhonePreference 9th 10th 11th 12th TOTAL
Android 250 341 266 286 1143
iPhone 294 277 332 276 1179
TOTAL 544 618 598 562 2322
a.Namethetwovariablesdisplayedinthetable.
b.Ifastudentisselectedatrandom,whatistheprobabilitythatheorshepreferstheiPhone?
c.WhatistheprobabilitythatarandomlyselectedstudentprefersAndroidorisin12thgrade?
d.WhatistheprobabilitythatarandomlyselectedstudentprefersAndroidgiventhatheorsheisin12thgrade?
“ProbabilityUsingTwo-wayFrequencyTables“Answers
1𝑎. Employment&Gender
1𝑏. 1123
1𝑐. 91115
1𝑑. 2855
2𝑎. Color&Item
2𝑏. 2237
2𝑐. 2037
2𝑑. 1
3𝑎. Grade&Gender
3𝑏. 187720
3𝑐.8691440
3𝑑.143690
4𝑎. Sports&ClubParticipation
4𝑏.67196
4𝑐.501784
4𝑑.1641
5𝑎. Employment&Age
5𝑏.179306
5𝑐.73102
5𝑑.211259
6𝑎. PhonePreference&Grade
6𝑏.131258
6𝑐.14192322
=1118
6𝑑.143281