10.1.1.381.6976
DESCRIPTION
Multi-effect evaporatorTRANSCRIPT

Proc S Afr Sug Technol Ass (2000) 74
Abstract
Multiple effect evaporator control is a problem that has been
widely reported in the pulp and sugar industries. Evaporators
are the largest heat users and major contributors to losses in
sugar cane factories. These factors make effective evaporator
control crucial to overall factory efficiency. The complexity and
large number of interactions make single loop PID control (the
conventional proportional, integral and derivative control) dif-
ficult and often sub-optimal. A Model Predictive Control (MPC)
algorithm is presented as a different approach to solving the
multiple input, multiple output problem. This technique has
been applied successfully in other multiple station industries
and is being applied to a dynamic model of the evaporator sta-
tion at Triangle Limited.
The first step in the MPC formulation was to develop a dynamic
computer model of the quintuple effect evaporator station at
Triangle. The model was then used to obtain a convolution
model (the internal reference model for the controller), which
captures the step response behaviour of the process to key
inputs. The two inputs available for control were the juice
flowrate and the steam pressure in the calandria of vessel three.
Valve dynamics for these two inputs were first identified using
real plant data, and the model was suitably modified so that the
control system could assume linearity of these control actions.
An objective function was then formulated, combining tight
Brix control with a smooth overall operation. The proposed
controller will use the convolution model to determine the opti-
mal sequence of input moves.
Introduction
Multiple effect evaporators concentrate juice from the extrac-
tion plant to syrup of about 67o Brix, which is fed to the pan
station (evaporative crystallisers). This involves removing the
majority of the water from the juice, and thus is the unit opera-
tion that consumes the most energy in the factory. Long resi-
dence times and high temperatures create a potential loss of
between 1% and 2% of incoming sugar by inversion. Therefore
evaporation is a very important unit operation and must be con-
trolled smoothly. However, the complexity of the system, and
the large number of interactions, make single loop PID control
difficult.
The two most commonly cited objectives for an evaporator con-
trol system are tight control of Brix, and a smooth operation.
These can be made clearer by using an economic analysis. The
economic objective is the delivery of the maximum amount of
high quality product to the downstream factory. In the sugar
factory, this quality is determined by the syrup concentration.
The amount of syrup that can be delivered is constrained by the
CONTROL AND OPTIMIZATION OF A
MULTIPLE EFFECT EVAPORATOR
PD SMITH1, CLE SWARTZ2AND STL HARRISON2
1Triangle Limited, P.Bag 801, Triangle, Zimbabwe
2Department of Chemical Engineering, University of Cape Town, Rondebosch
rate at which juice arrives at the station, and there is also an
upper limit on the syrup concentration in order to avoid sponta-
neous nucleation or excessive deposition and scaling.
Smooth operation means the even handling of extreme operat-
ing conditions, such as fluctuations in juice flowrate. Smooth-
ing out process fluctuations, most notably the clear juice
flowrate, greatly increases the potential for good evaporator
control. At Triangle, two evaporator trains exist in parallel, and
these are cleaned on a rotational basis. Thus the performance
of the different trains is seldom identical and a higher quality
product may be achieved by carefully choosing the proportion
of juice that is fed to each train.
Evaporator control
Montocchio and Scott (1985) reported good results using a
variation on a PID based throughput control scheme, which
was installed at Amatikulu Sugar Mill. By changing the con-
figuration of the evaporator effects, and using good variable
pairings, the evaporator system was made less sensitive to dis-
turbances. This robustness was dependent on tight juice flow
control, and a well designed station, which was nearly always
run at full throughput. This scenario cannot be assured in plants
where flow delays due to lack of cane are common.
Hsiao and Chen (1995) also reported promising results using an
improved PID model. Their algorithm includes a form of gap
action control whereby the simple PID output is modified in the
face of excessive variations or unusual operating conditions.
The control of syrup Brix was improved by allowing a variable
recycle back to the last effect. As with the throughput control
used at Amatikulu, this system would limit the capacity of the
station, and would not be able to anticipate and handle input
constraints.
The scheme proposed by Rousset et al. (1989a, b) was based
on a series of Feedforward/Feedback controllers. The results
from this system were very promising, although a high degree
of instrumentation was required on the plant. Lee and Newell
(1989) proposed Generic Model Control as a means of control-
ling a single effect recirculation evaporator. The study was
confined to simulation studies, and although the control sys-
tem gave impressive results, constraints could not be handled
directly, nor anticipated (Harris and McLellan, 1990).
Elhaq et al. (1999) have applied a multivariable Generalised Pre-
dictive Control system based on Mohtadi et al. (1987), to an
evaporator station in Morocco. The objective function was
based on the total operating cost. The two outputs chosen
were syrup Brix and V2 steam pressure, which was maintained
at a set value despite variations in vapour draw. Once again,
this system was not able to handle input constraints directly.
Page 274

Proc S Afr Sug Technol Ass (2000) 74
In this paper, Model Predictive Control (MPC) will be intro-
duced as a novel control algorithm, which is suitable for evapo-
rator control, as well as other factory areas, in that it can
anticipate and handle constraints, and handle Multiple Input,
Multiple Output (MIMO) systems in an optimal manner. The
problem under consideration can be split into three main areas
– juice flow control, Brix control and juice distribution to the
three first effects.
Juice Flow Control
Juice flow control is a useful introduction to the concepts of
Model Predictive Control, because of the familiarity of this sys-
tem. At Triangle, manipulating the mixed juice flowrate con-
trols the clear juice tank level, while the clear juice flowrates are
controlled according to operator supplied set points only. These
clear juice flowrates then indirectly affect the mixed juice tank
level. The algorithm presented below could be applied to both
the mixed juice and clear juice tanks.
MPC controller
Campo and Morari (1989) have used a standard flow control
objective, that is to minimise the Maximum Rate of Change of
Outlet flow (MRCO) of the tank under consideration, with con-
straints that the level should not violate upper or lower bounds
over some prediction horizon. These authors successfully
applied a MPC algorithm to this problem. In this, a simple
internal model predicts the future behaviour of the tank based
on the past two level measurements, and the previous outlet
flow, as outlined in the level equation (1), below:
( ) ( )( ) ( )
−
∆+−−+=+ 11)()( tQ
A
tththkthkth opredict
( )∑ =+⋅
∆−
k
i o ktQA
t0
][ (1)
Where hpredict
= predicted tank level
Dt = time-step used
Qo
= outlet flowrates
A = cross sectional area of tank
t = time of last measurement
k = time steps until prediction
Future inlet flowrates are assumed constant and are inferred by
using measurements of the outlet flowrate and the change in
tank levels since the previous time-step. The future outlet
flowrates are chosen so as to minimise the MRCO objective,
f(Qo(t+k)), while obeying constraints on the permissible tank
levels and flowrates. In addition, a final constraint is added,
that the level must return to set point by the end of the predic-
tion horizon (P). The control algorithm was formulated as shown
below in equations (2) – (6), for any present time, t.
)1()(maxmin)(
−+−+=+
ktQktQf ooktQo
(2)
For P ³ k > 0, subject to:
( ) max,oo QktQ ≤+ (3)
( ) min,oo QktQ ≥+ (4)
maxmin )( hkthh ≤+≤ (5)
( ) sphpth =+ (6)
Only the first computed flowrate is implemented, and the
optimisation is repeated at the beginning of the next time-step.
Results
This MPC controller has been programmed in the Matlab simu-
lation language, and applied to the problem of controlling the
mixed juice tank level, and the mixed juice flowrate. The follow-
ing graph, Figure 2, shows the results of this system under a
real life situation on the Triangle plant; i.e. a step increase in
draught juice (DJ) flowrate.
The MPC controller of Campo and Morari, (1989), was formu-
lated so that there is no offset after the prediction horizon.
This is the tuning parameter in this case, and it can be shown
that for any given disturbance, there is a critical prediction
horizon, i.e. the time at which the tank would overflow, with no
controller action. As the prediction horizon is increased, the
MRCO objective is continually improved until this critical hori-
zon is reached. Thereafter, the settling time is only increased,
with no further benefit to flow filtering.
In this example, the prediction horizon was chosen as 10 min-
utes, which resulted in a settling time of 51 minutes, with an
MRCO of 35.7, and a maximum flowrate of 866.3 tph. With a
smaller prediction horizon, of 5 minutes, the settling time could
be reduced to 26 minutes, at the expense of a higher MRCO, of
78.4 and a slightly higher maximum flowrate, 867.9 tph.
Draught Juice (Diff. & Mill)
Mixed Juice
Tank
Clear Juice
Tank
Heaters, Clarifiers
Evap. 1A
Evap. 1B
Evap. 1C
FIGURE 1. Juice Handling at Triangle Limited. FIGURE 2. MPC response to a step in flowrate.
400
500
600
700
800
900
0 20 40 60 80 100 120
time (mins)
Flo
wra
te (
tph)
48
50
52
54
56
58
60
Tank L
evel (%
)
DJ Flow In
MJ Flow Out
MJ Tank Level
Page 275

Proc S Afr Sug Technol Ass (2000) 74
Model Predictive Control
Model Predictive Control refers to a group of algorithms in
which an internal model is used by the controller to predict
how past and present measurements will affect the real plant.
From this model the optimal sequence of control moves is then
computed. The first of these is then implemented, and a new
set of measurements is taken at the beginning of the next time
step, providing a feedback mechanism for the controller.
The future sequence of control moves is calculated by
optimising an objective function, commonly a weighted sum of
squares of the setpoint tracking error and the manipulated vari-
able moves. A common formulation of this type is Dynamic
Matrix Control, or DMC, which was first developed by Cutler
and Ramaker (1979) at Shell Oil for tackling the multivariable
control problems such as that shown in Figure 3 below.
In Dynamic Matrix Control, the model of the plant is a convolu-
tion model, i.e., the response of each output to a step change in
each input is found. The values of the response at discrete
sampling times then make up a series of step response coeffi-
cients (ai) which may be used to predict the change in any
output (y) associated with a change in any input (u), as shown
in the general output prediction equations (7) and (8), below:
( ) ( )∑−
=+−+−∆=
1
1)()(
n
i pnipredict kdnkuaikuaky (7)
Where n = the settling time of the system
(number of intervals)
ai
= the step response coefficients
dp(k) = predicted disturbance, which is assumed con-
stant and is calculated by equation (8), which calculates the
difference between the current measured output, and the out-
put as predicted by the past control moves:
( ) ( )kdjkd pp =+
( ) ( )∑−
=−−−∆−=
1
1)(
n
i nimeasured nkuaikuaky (8)
The optimisation problem at each time-step is then to minimise
the objective function, f(Du), shown in equation (9), below:
( ) ( ) uRuyyQyyf T
set
T
setu
∆∆+−−=∆
....min (9)
Where y = the vector of predicted outputs, ypredict
(k)
Du = the vector of input moves Du(k)
Q and R are diagonal weighting matrices, and T is the vector
transpose operator.
Equation (9) is a weighted sum of the predicted setpoint track-
ing errors for both outputs and the input variable moves for the
inputs, over the prediction horizon. The optimisation must be
solved subject to constraints on the inputs, outputs and input
moves. This approach has been used in the Brix control sec-
tion discussed below. In summary, the Model Predictive Con-
trol structure can be considered as an observer, and an optimiser,
as shown in Figure 4 below. The observer receives measure-
ments of inputs to the plant (u) and outputs from the plant (y),
and by using an internal model, estimates the present and fu-
ture state of the plant (x). Based on this prediction, the optimiser
then determines the sequence of manipulated inputs that would
best achieve the desired reference objective.
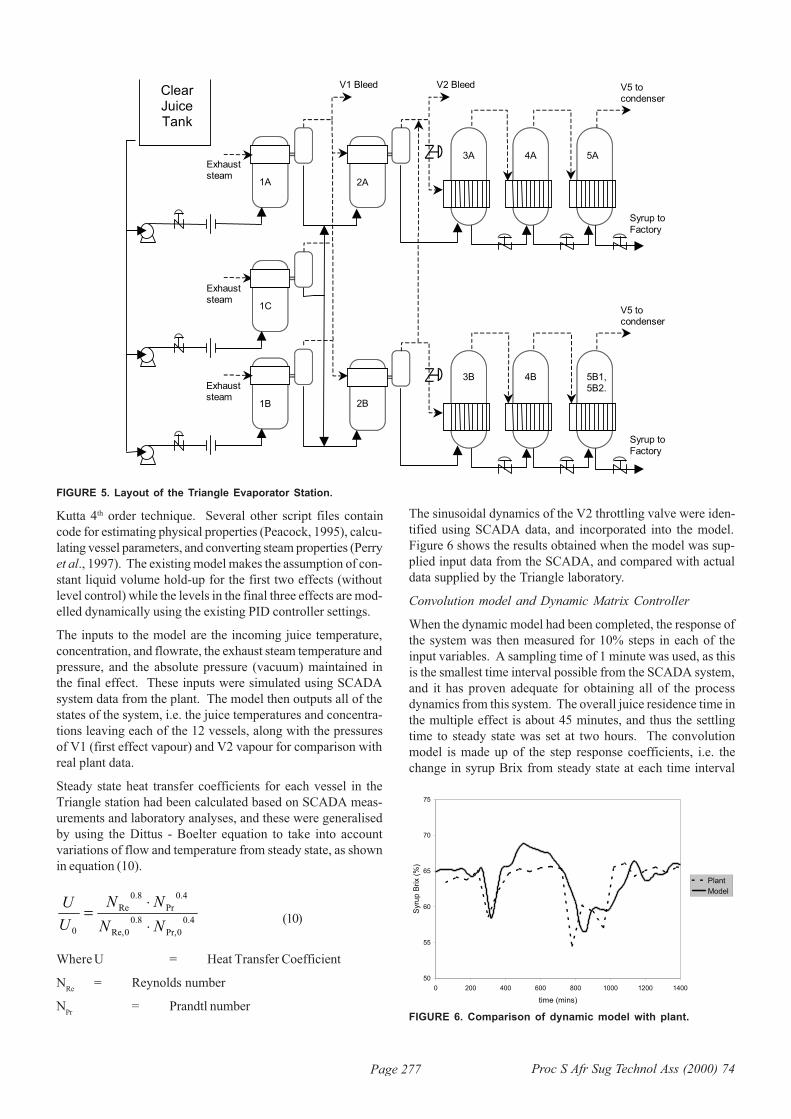
Model Predictive Brix Control
The concept of Model Predictive Control is extended here to
Brix control, where the advantages of this form of control are
clearer. Currently, the syrup Brix leaving the Triangle evapora-
tor station is controlled by manipulating the flowrate of heat-
ing vapour to the third effect of each train. In Triangle this
vapour is vapour two; the vapour evolved from the second
effect evaporators (V2). The layout of the Triangle evaporator
station is shown in Figure 5 below.
Although this control system involves only two outputs, syrup
Brix and clear juice flowrate, it is still essential that this control
layer should be able to anticipate and handle constraints. At
Triangle Ltd. the InTouch Scanning, Control And Data Acqui-
sition (SCADA) system has recently been installed, which pro-
vides online readings of the most significant three disturbances,
i.e. juice flowrate, exhaust steam pressure and final effect pres-
sure. The effects of these inputs are more easily included in
the DMC formulation, rather than as a series of trims and feed
forward gains, which would be necessary for PI control. It is
for these reasons that a DMC controller has been selected.
Dynamic model
A dynamic model first had to be developed which would form
the basis for the internal model of the controller. The model
was based on the familiar mass and energy balances about
each effect. These were solved numerically using the Runge
FIGURE 3. Input-Output process description used in
industrial MPC technology (Qin and Badgewell, 1997).
Output (y2)
Output (y3)
Output (y1)Input (u1)
Input (u3)
Input (u2)
Disturbance (u4)
Disturbance (u5)
Disturbance (u6)
Multivariable
Process
Output (y2)
Output (y3)
Output (y1)Input (u1)
Input (u3)
Input (u2)
Disturbance (u4)
Disturbance (u5)
Disturbance (u6)
Multivariable
Process
FIGURE 4. Model Predictive Controller.
y
Observer
Plant
Reference
Optimiser
x
u
Disturbance
Page 276
Proc S Afr Sug Technol Ass (2000) 74
Kutta 4th order technique. Several other script files contain
code for estimating physical properties (Peacock, 1995), calcu-
lating vessel parameters, and converting steam properties (Perry
et al., 1997). The existing model makes the assumption of con-
stant liquid volume hold-up for the first two effects (without
level control) while the levels in the final three effects are mod-
elled dynamically using the existing PID controller settings.
The inputs to the model are the incoming juice temperature,
concentration, and flowrate, the exhaust steam temperature and
pressure, and the absolute pressure (vacuum) maintained in
the final effect. These inputs were simulated using SCADA
system data from the plant. The model then outputs all of the
states of the system, i.e. the juice temperatures and concentra-
tions leaving each of the 12 vessels, along with the pressures
of V1 (first effect vapour) and V2 vapour for comparison with
real plant data.
Steady state heat transfer coefficients for each vessel in the
Triangle station had been calculated based on SCADA meas-
urements and laboratory analyses, and these were generalised
by using the Dittus - Boelter equation to take into account
variations of flow and temperature from steady state, as shown
in equation (10).
4.0
0Pr,
8.0
0Re,
4.0
Pr
8.0
Re
0 NN
NN
U
U
⋅
⋅= (10)
Where U = Heat Transfer Coefficient
NRe
= Reynolds number
NPr
= Prandtl number
The sinusoidal dynamics of the V2 throttling valve were iden-
tified using SCADA data, and incorporated into the model.
Figure 6 shows the results obtained when the model was sup-
plied input data from the SCADA, and compared with actual
data supplied by the Triangle laboratory.
Convolution model and Dynamic Matrix Controller
When the dynamic model had been completed, the response of
the system was then measured for 10% steps in each of the
input variables. A sampling time of 1 minute was used, as this
is the smallest time interval possible from the SCADA system,
and it has proven adequate for obtaining all of the process
dynamics from this system. The overall juice residence time in
the multiple effect is about 45 minutes, and thus the settling
time to steady state was set at two hours. The convolution
model is made up of the step response coefficients, i.e. the
change in syrup Brix from steady state at each time interval
FIGURE 5. Layout of the Triangle Evaporator Station.
Clear Juice Tank
Syrup to
Factory
Exhaust steam
Exhaust steam
V1 Bleed
Exhaust steam
V2 Bleed V5 to condenser
V5 to condenser
Syrup to
Factory
1A
1C
1B
2A
2B
3A 4A 5A
3B 5B1, 5B2.
4B
FIGURE 6. Comparison of dynamic model with plant.
50
55
60
65
70
75
0 200 400 600 800 1000 1200 1400
time (mins)
Syru
p B
rix (
%)
Plant
Model
Page 277

Proc S Afr Sug Technol Ass (2000) 74
following the step change. By combining the responses to
steps in each of these inputs, and assuming linearity and time
invariance, a Dynamic Matrix is formed, which predicts the fu-
ture output of the system based on present and past inputs.
In the Triangle case there are a total of 5 inputs to the system,
which give rise to two outputs, syrup Brix and actual clear juice
flowrate. A clear distinction has been made between genuine
adjustable input variables (A, B), and disturbance variables (c,
d, e), which cannot be freely manipulated by the control sys-
tem:
A Clear juice flowrate – this can be directly manipulated via
the SCADA system. In a sense, this variable is both an
input and an output in the MPC formulation, in that it is
available for manipulation, and a bias value is also specified
as the clear juice flow setpoint.
B V2 Valve throttling position – this can be directly manipu-
lated via the SCADA system.
c Clear juice temperature – any variation in this parameter
must be due to random process disturbances.
d Exhaust steam pressure – this is difficult to vary due to the
arrangement with the turbo-generators, and was treated as
a disturbance.
e Final effect pressure – this is also controlled about a con-
stant setpoint, and so any fluctuations could be counted as
a disturbance.
Results
The controller was then coded into the Matlab simulation lan-
guage, Simulink, and used to control the existing dynamic model
of the station. Figure 7 shows the response to an increase in
steam pressure at time (t = 20 mins) and again at time (t = 60
mins).
Figure 7 shows several important features of dynamic matrix
control. Firstly, when the steam pressure was increased by
10% at time 20, the V2 throttling valve started to close, to coun-
teract the effect of this increased pressure (and thus tempera-
ture) on the syrup Brix. The syrup Brix gradually returned
towards a setpoint of 68oBx from time 40 to time 60. Then, at
time 60, the exhaust steam pressure was again increased by
10%. This had a similar effect, in that the syrup Brix began to
rise. The V2 throttling valve was already almost fully closed,
and now encountered an input constraint.
In the overall plant constraints, it is intended to keep syrup Brix
between 50o and 72oBx. Thus when this Brix constraint was
approached, the controller increased the clear juice flowrate,
the only remaining input variable move, in order to bring the
syrup Brix back under control. A similar effect was observed
for the case where the disturbance caused a decrease in syrup
Brix, e.g. a decrease in juice temperature. In this case, the V2
throttling valve was opened until it encountered a constraint
(100% open) and then the clear juice flowrate was reduced, to
prevent the syrup Brix from falling below its constraint of 50oBx.
Optimal Juice Distribution
Steady state optimisation
The final layer of the evaporator control strategy is a distribu-
tion controller. At Triangle there are three first effect evapora-
tors, and the total clear juice flowrate must be distributed
amongst these so as to achieve the highest possible syrup
Brix. Because the evaporators are cleaned on a rotation basis,
they may be operating at different efficiencies at any one time,
and the aim of a particular flow distribution should be to
optimise their current operational condition.
Determination of evaporator condition from condensate
flowmeters
The distribution controller needs to receive some measure of
the condition of the evaporators before optimisation can be
done. This can be achieved by measuring the flowrate of con-
densate leaving each evaporator.
However, condensate flow measurement provides particular
difficulties because the fluid being measured is at its saturation
temperature. Love (personal communication), proposed that a
particular design of linear weir, (Heller, 1980), would effectively
address the limitations of conventional flow measurement tech-
niques. The condensate flowmeter, as shown in Figure 8, was
designed, built and tested on the Triangle station.
The flowmeter was designed so that there is a linear relation-
ship between flowrate and head maintained in the outer cylin-
FIGURE 7. Response to steps in steam pressure.
200
250
300
350
400
450
500
550
600
650
700
0 20 40 60 80 100 120
time (mins)
Exh
. P
ress(k
Pa
)
C
lea
r Ju
ice
Flo
w(t
ph
)
-20
0
20
40
60
80
100
120
V2
Va
lve
Po
sitio
n
S
yru
p B
rix
V2 Valve Position
Syrup Brix
CJ Flow
Exhaust Steam Pressure
FIGURE 8. Condensate flowmeter (after Heller, 1980).
dP
Page 278

Proc S Afr Sug Technol Ass (2000) 74
der. The vent was connected back to the incondensible gas
release, to avoid flashing. A Kalman filter was then used in
simulations to identify heat transfer coefficients from flowmeters
fitted to each of the first and second effects, a total of five
vessels (1A, 1B, 1C, 2A and 2B). The heat transfer coefficients
were then used in the optimisation program, where the objec-
tive was to maximise the amount of water evaporated from the
juice. This is done by calculating the weighted Brix of the juice
that would leave the second effects, using part of the dynamic
evaporator model described above.
Results
Figure 9 shows the optimal juice flowrate through the first ves-
sel of the A set, as the observed heat transfer coefficient for
either vessel 1A or 2A was varied. In each case, all other heat
transfer coefficients were kept constant.
Figure 9 shows that the heat transfer coefficient of the first
effect is more important that that of the second effect, due to
the layout of the Triangle evaporator station, where there is an
additional first effect vessel, which feeds the two evaporator
trains equally. The responses of each of the first effect vessels
were not identical.
The extra first effect, 1C, was found to have a slightly different
relationship between its observed heat transfer coefficient and
the optimal flow distribution.
Conclusion
The subject of evaporator control has been investigated and
some recent developments have been presented. Three levels
of control are proposed: juice flow control, syrup Brix control,
and the optimal distribution of juice to the three first effects.
Good juice flow control is crucial not only to improved evapo-
rator control, but also to good clarification and pH control. A
novel algorithm has been presented, and its advantages have
been discussed briefly. Syrup Brix is significantly affected by
a number of factors, and these are efficiently incorporated into
an MPC framework. This type of control also allows input and
output constraints to be accommodated. Finally, there is an
optimal distribution of clear juice to the first effect vessels,
which may be determined by their observed heat transfer coef-
ficients.
Acknowledgements
The authors wish to acknowledge and thank Triangle Limited
for their financial support of this project. Thanks are also ex-
tended to Triangle staff for technical assistance and advice, in
particular, Steve Paver, Ash Rana, Clive Wenman and Elisha
Mutasa.
REFERENCES
Campo, PJ and Morari, M (1989). Model predictive optimal averaging
level control. AIChE J, April, Vol 35, No. 4: 579 - 591.
Cutler, CR and Ramaker, BL (1979). Dynamic matrix control - a com-
puter control algorithm. AIChE National Mtg, Houston, Texas; also
Proc. Joint Aut. Control Conf., San Fransisco, California (1980).
Elhaq, SL, Giri, F and Unbehauen, H, (1999). Modelling, identification
and control of sugar evaporation – theoretical design and experimen-
tal evaluation. Control Engineering Practice, 7: 931-942.
Harris, TJ and McLellan, PJ (1990). Generic model control - a case
study revisited. Can J Chem Eng, Vol. 68, December: 1066-1071.
Heller, H (1980). Use weir to measure fluid flow. Chem Eng, November
17.
Hsiao, YC and Chen, CH (1995). Evaluation of control models for
multiple-effect evaporator set in a cane sugar mill. Taiwan Sug, Jul-
Aug: 24-27.
Lee, PL and Newell, RB (1989). Generic model control - a case study.
Can J Chem Eng, June, Vol. 67: 478-484.
Mohtadi, C, Shah, SL and Clarke, DW (1987). Generalized predictive
control of multivariable systems. System and Control Letters, 9:
285.
Montocchio, RG and Scott, RP (1985). Experiences in evaporator
control at Amatikulu. Proc S Afr Sug Technol Ass, Vol. 59: 99-101.
Peacock, S (1995). Predicting physical properties of factory juices and
syrups. Int Sug J, Vol 97, No 1162: 571-577.
Perry, RH, Green, DW and Maloney, JO (1997). Perry’s Chemical
Engineer’s Handbook. 7th edition, McGraw Hill Book Company,
New York, 1997.
Qin, SJ and Badgewell, TA (1997). An overview of industrial model
predictive control technology. AIChE Symposium Series, Vol 93,
No. 316: 232–256.
Rousset, F, Saincir, Y and Daclin, M (1989a). Automatic process control
of multiple effect evaporation. Part I: Conditions for static and
dynamic equilibrium. Zuckerindustrie, Vol. 114, No. 4: 323-328.
Rousset, F, Saincir, Y and Daclin, M (1989b). Automatic process control
of multiple effect evaporation. Part II: Practical realisation and re-
sults. Zuckerindustrie, Vol. 114, No. 6: 470-476.
FIGURE 9. Optimal juice flowrate into vessel 1A.
0
50
100
150
200
250
300
350
2.0 2.2 2.4 2.6 2.8 3.0
Heat Transfer Coefficient (kW/m2.K)
Optim
al C
lear
Juic
e F
low
rate
, E
vap 1
A (t
ph)
HTC 1A
HTC 2A
Page 279