101129 gentry capital gains taxation and entrepreneurship
TRANSCRIPT
Capital Gains Taxation and Entrepreneurship
William M. Gentry, Ph.D. Professor of Economics
Williams College
November 2010
I thank Viral Ghandi, Quoc Anh Nguyen, and Meghan Shea for excellent research assistance and the American Council for Capital Formation Center for Policy Research for financial support. I am especially grateful to Jon Bakija for providing data on marginal tax rates. Seminar participants at the Northwestern School of Law and Williams College provided useful feedback. Any errors, however, remain my responsibility.

Capital Gains Taxation and Entrepreneurship
Abstract
The taxation of capital gains is a perennial issue in tax policy. One critical aspect for understanding the overall effects of capital gains taxation is how these taxes affect entrepreneurs. While many analyses focus on the disincentive effects created by capital gains taxes for investors in large corporations, these disincentives may be even more important for entrepreneurs. This paper discusses several mechanisms through which capital gains taxes can affect entrepreneurs’ decisions. First, capital gains taxes may create an additional level of taxation on successful entrepreneurs. Second, asymmetric taxation of capital gains and losses (in which gains are taxed more heavily than losses) may be an especially important issue for entrepreneurs; the asymmetries in the tax system may discourage entrepreneurs from taking risk. Third, much like the commonly-referenced lock-in effect of capital gains taxes on investments in stock, entrepreneurs may become locked into closely-held businesses; this lock-in effect may distort whether firms are owned by the most efficient manager for the firm. Fourth, capital gains taxes can affect the cost of capital for entrepreneurs. To document the potential importance of capital gains taxation on entrepreneurs, I analyze household portfolios, the composition of unrealized capital gains held by households, and whether capital gains taxes are related to disbursements by venture capital partnerships. I present three main findings. First, active business assets – the types of assets that are likely to be associated with capital gains for entrepreneurs – play an important role in the aggregate portfolio of household assets. According to the 2007 Survey of Consumer Finances (SCF) from the Federal Reserve Board, 11.1 percent of households hold active business assets, and these assets account for 19 percent of household portfolios; by comparison, stocks held directly or in mutual funds (but outside of retirement accounts) are 11.7 percent of household wealth. Second, the stock of unrealized capital gains associated with privately held businesses is large. The SCF data suggest that aggregate unrealized capital gains on active business assets are almost six times larger than aggregate unrealized capital gains on corporate stock. The magnitude of unrealized capital gains on active business assets suggests that capital gains tax rate could play an important role in whether and when these assets are sold. Third, I examine whether capital gains tax rates affect the disbursements of venture capital funds using state-aggregate data from 1969-2007. Regression analysis suggests that higher capital gains tax rates are associated with a reduction in state-level disbursements from venture capital funds. Since many of the sources of venture capital funding are not subject to capital gains taxation, I interpret this finding as suggestive of a demand side effect: in states with higher capital gains tax rates, fewer entrepreneurs are starting businesses that seek venture capital funding. Given the theoretical and empirical importance of capital gains taxes for entrepreneurial decisions, entrepreneurship should play a prominent role in the tax policy debate about designing and reforming the taxation of capital gains.

Capital Gains Taxation and Entrepreneurship
I. Introduction The taxation of capital gains is a perennial issue in United States tax policy. The 2008
presidential campaign was no exception. Senator McCain proposed retaining the 15 percent tax
rate on individuals’ long-term capital gains introduced by the Jobs and Growth Tax Relief
Reconciliation Act of 2003. Senator Obama argued for an increase in the long-term capital gains
tax rate to at least the 20 percent tax rate that was in effect before 2003; however, he also
pledged to eliminate capital gains taxes for small businesses and start-up firms.1 President
Obama’s budget proposal for 2011 includes both an increase in the overall capital gains tax rate
for individuals with incomes above $200,000 and married couples with incomes above $250,000
and an exemption for gains on qualified small businesses.2 While much analysis has been
undertaken on the general issue of capital gains tax rates, less attention has been paid to the
concern that the capital gains tax has especially negative consequences for entrepreneurial
activity.
Entrepreneurship plays an important role in economic growth. Baumol, Litan, and
Schramm (2007) coin the term “entrepreneurial capitalism” to emphasize that not all forms of
capitalism are equally conducive to growth. They argue that a mix between “big-firm” and
“entrepreneurial” capitalism fosters economic growth.3 In discussing what features in an
economy give rise to entrepreneurial capitalism, they include “avoiding onerous taxation” of
productive entrepreneurship. Their discussion of onerous taxation is quite general; while they do
not specifically mention the taxation of capital gains, it is one form of taxation that may be
1 Source: Bob Drogin, “McCain and Obama have Contrasting Economic Plans,” Los Angeles Times, June 11, 2008. 2 Source: “Budget of the United States Government, Fiscal Year 2011” U.S. Office of Management and Budget, February 2010. 3 In contrast, “state-guided” and “oligarchic” capitalism tend to yield less economic growth as they tend to allocate resources less effectively to new innovation.

2
particularly onerous for entrepreneurs. Exploring whether capital gains taxes have particularly
negative effects on entrepreneurs relative to larger firms is a goal of this paper.
In the context of large firms, research has focused on three aspects of the effects of capital
gains taxation. First, capital gains taxes can affect investors’ portfolio decisions, especially
regarding the timing of when they sell assets with capital gains; notably, capital gains taxes can
cause a lock-in effect by which investors delay the sale of assets with gains. Second, capital
gains taxes can affect the amount of risk-taking undertaken by investors; the asymmetric
treatment of losses plays an especially important role in whether capital gains taxation
encourages or discourages risk-taking. Third, capital gains taxation can affect firms’ investment
decisions by affecting the cost of equity capital.
These same effects apply to entrepreneurial firms. However, the economic impact of these
effects may be larger for small firms than for publicly-traded firms. In terms of the lock-in
effect, when shareholders delay the sale of shares in publicly-traded firms due to the tax, the tax
affects government revenue but probably has little effect on the economic decisions made by the
firm. Presumably, the trading patterns of shareholders (at least those with small stakes in the
firm) do not affect managerial decisions. Thus, the distortions caused by the tax lie in the
portfolio imbalances of households; however, if households can invest in many different firms,
then these portfolio imbalances probably have relatively modest effects on economic well-being.
In contrast, the lock-in effect associated with taxing capital gains of generated by owning
privately-held businesses may very well affect the firms’ managerial decisions since the owners
often have some say in these decisions. The social cost of this lock-in effect may include
businesses not being sold to the owners who could manage the assets with maximal efficiency.

3
In terms of the effects of capital gains taxes on risk-taking, entrepreneurial businesses may
be more likely to be hampered by rules that limit the tax refunds paid on losses than are the
shareholders of large, publicly-traded firms. The lack of diversification of many entrepreneurs
means that the capital gains tax may create a form of asymmetric ‘success tax’ in which the
government taxes the upside returns to investment but does not share symmetrically in projects
that fail. In contrast, shareholders in publicly-traded firms can hold a diversified portfolio of
stocks, and this diversification may mitigate the importance of loss limitations on capital losses.
Thus, for shareholders in publicly-traded firms, the capital gains tax may actually encourage
risk-taking but, for entrepreneurs, the capital gains tax may discourage risk-taking due to the
asymmetric treatment of gains and losses. This possible reduction in risk-taking may reduce the
amount of innovation generated by entrepreneurs.
The capital gains tax can affect the cost of capital of publicly-traded firms by changing the
rate of return required by a firm’s shareholders. Faced with higher capital gains taxes,
shareholders may require a higher hurdle rate of return for investments. This same affect applies
to private firms. However, if entrepreneurs rely more heavily on financing sources that face the
capital gains tax (i.e., equity provided by taxable investors as opposed to debt or equity provided
by tax-exempt or foreign investors), then these effects can be relatively more important for
entrepreneurial firms than for established firms.
In addition to discussing the potential effects of capital gains taxes on entrepreneurs, I
present some basic facts on the potential importance of capital gains taxation to entrepreneurs.
Despite the claim that the taxable capital gains associated with entrepreneurial ventures are a
modest portion of total capital gains,4 the unrealized gains associated with households’ holdings
4 For example, Auerbach (2007) claims that “only a miniscule fraction of the economy's capital gains are associated with new ventures.”
4
of entrepreneurial ventures are quantitatively important both in absolute terms and relative to
capital gains from holding equity in public companies. As described in more detail below, data
from the Federal Reserve’s Survey of Consumer of Finances from 2007 indicates that
entrepreneurial assets (e.g., assets associated with actively-managed businesses) are a larger
portion of aggregate household portfolios than taxable holdings of corporate equities. Moreover,
the mean unrealized capital gain on active business assets among households with such assets is
over $731,000 compared to a mean unrealized capital gain on directly-held publicly-traded
equity of roughly $58,000. Several factors contribute to the importance of these capital gains in
households’ portfolios. First, successful active businesses can create large capital gains; in part,
the large gains associated with success reflect the returns to taking risk since many small
businesses are not successful. Second, active business assets are not typically held in tax-
advantaged accounts so that the capital gains tax is relevant if an entrepreneur wants to sell his or
her business; in contrast, many non-entrepreneurial households hold a substantial amount of their
wealth in forms for which the capital gains tax is either irrelevant (e.g., tax-advantaged
retirement accounts) or only relevant for a relatively few households (e.g., owner-occupied
housing). Third, the incubation period for creating a new business may be quite long and the
magnitude of the unrealized capital gain increases with how long someone holds an asset. The
relatively large stock of unrealized capital gains on active business assets in household portfolios
suggests that the capital gains tax may play an important role in determining when small
businesses are sold.
I also present evidence on the relationship between capital gains tax rates and venture
capital disbursements using a state-level aggregate data for 1969-2007. The regression results
suggest that higher capital gains tax rates are associated with less venture capital funding flowing
5
into a state. Following Gompers and Lerner (1998), I interpret these results as being consistent
with capital gains taxes reducing the volume of entrepreneurs who start businesses that seek
external funding.
This paper is organized as follows. Section II provides evidence on the potential
importance of entrepreneurial capital gains in the portfolios of U.S. households. This section
also places such capital gains in the context of overall taxable capital gains in the United States.
Section III provides a simple illustration of the mechanics of taxing entrepreneurial capital gains.
While some analysts argue that preferential capital gains tax rates (by which they mean capital
gains tax rates below the tax rate on wage income) provide special treatment to the labor income
of entrepreneurs, such arguments are overly simplistic. Section IV describes the different
channels through which the capital gains tax can affect the decisions of entrepreneurs. The
section pays special attention to the differences between capital gains in the context of
entrepreneurial ventures and investing in established firms. This section also discusses the
analysis of state-level venture capital disbursements. I offer brief concluding remarks in section
V.
II. Entrepreneurial Capital Gains and Households’ Investments
A natural question to ask is the empirical importance of entrepreneurial investments, and
the associated capital gains, in the investment decisions of households. The Federal Reserve’s
Survey of Consumer Finances (SCF) is a particularly useful source of data on household wealth
in the United States.5 The SCF is a triennial household survey with an oversample of relatively
wealthy households since these households account for a disproportionate share of household
wealth. The data include weights that allow for inference about the general population and all 5 For more information on the SCF, see Bucks, Kennickell, and Moore (2006).
6
statistics reported below reflect these weights so that they are representative of the overall
population. I report tabulations from the 4,422 families surveyed in the 2007 SCF.
A common problem for studying entrepreneurship is measuring entrepreneurial activity.
In part, this problem arises because “entrepreneurship” is a vague term, encompassing both ideas
of business organizational form (e.g., small businesses allow someone to be the boss even if the
enterprise is quite small) and innovativeness (e.g., entrepreneurs as the engine of growth for new
products and job creation). As discussed by Baumol, et al., some small businesses are more
innovative than others. Given the structure of the SCF data, I will focus primarily on active
business assets even though some entrepreneurial investment may lead to other forms of wealth
and the fact that not all closely-held businesses are equally innovative.
The SCF asks detailed questions about various categories of wealth, including both
financial and non-financial assets. The most important category for entrepreneurial assets is the
market value of active businesses in which the household owns and participates. The SCF asks
detailed questions on up to three businesses in which the responding household actively
participates as well as a summary question on the value of any other businesses in which the
family plays an active management role. By focusing on active management – a relatively easy
concept to measure – this definition of entrepreneurship does not categorize businesses based on
the extent to which the business is innovative. While these questions capture much of what one
might think of as entrepreneurial assets, entrepreneurship may also lead to other types of assets,
such as commercial real estate, agricultural businesses, passive investments in privately-held
businesses, and, in some cases, holdings of publicly-traded equity. For example, passive
investors in a new firm will report wealth as passively-held business investments; also, if a firm
sells shares to the public, the founding entrepreneur should include his or her shares in the
7
category of publicly-traded shares. Hence, using active business assets as a measure of
entrepreneurial assets may understate total entrepreneurship in the economy.
II.A. Active Business Assets in Household Portfolios
As a starting point for exploring the importance of entrepreneurial investment to household
wealth, Table 1 provides some basic summary statistics about household portfolios from the
2007 SCF. The table summarizes both financial assets and non-financial assets. The financial
asset categories are liquid assets, assets yielding fixed returns, publicly-traded stock, retirement
accounts, and other financial assets.6 The non-financial assets categories are equity in a primary
residence, equity in other residential real estate, equity in commercial real estate, the value of
active business assets (net of business debts and adjusted for loans between the household and
the business), agricultural businesses (farms), passive business investments, and other non-
financial assets.7 Before turning to the data, several clarifications are necessary. First, while the
data include retirement accounts controlled by the household (e.g., 401(k) plan balances), the
account balances in such plans do not adjust for the tax liability that would be incurred upon
withdrawing the assets; moreover, the data exclude the value of traditional defined benefit
pension plans. Second, I have excluded vehicles from non-financial assets. Third, when specific
assets (e.g., a house) have debt associated with the asset, I have netted the outstanding debt 6 More specifically, “liquid assets” includes checking accounts, savings accounts (including education saving accounts), and money market accounts; “fixed income” includes certificates of deposit, bond holdings, and mutual funds that invest in bonds; “stocks” are broken into a directly-held category and a mutual fund category of funds invested in either stocks or a combination of stocks and bonds; “retirement accounts” include the account balances for both individual-based and employer-based tax-advantaged retirement accounts; and “other financial assets” include cash value life insurance policies, annuity contracts, trusts, and other miscellaneous financial assets. 7 “Other residential real estate” includes both vacation properties and small-scale rental property. “Commercial real estate” includes both non-residential property and large-scale residential properties (i.e., properties with more than four housing units). “Passive business investments” are businesses in which the household does not play an active management role and can be partnerships, subchapter S corporations, or other forms of corporations. Farms are measured separately in the survey in part since they often include housing as well as business investment; the survey attempts to allocate the residential portion of a farm as part of equity in a primary residence. “Other non-financial assets” include a wide variety of collectables and precious metals.

8
against the value of the asset so that asset holdings reflect equity in the asset. By netting out
such debt, the values of non-business assets are more comparable to the SCF question about
active businesses which specifically asks about the net worth of the business rather than the
value of the business gross of business loans.
For each asset category, Table 1 provides the percent of households who hold the asset, the
median value of these holdings conditional on owning the asset, the overall mean value of the
asset, and the asset’s share in the aggregate household portfolio of assets. The median asset
holding conditional on owning the asset is more informative than the unconditional median since
less than fifty percent of households hold most asset categories. Furthermore, since the
distribution of asset values is highly-skewed even among households that hold an asset, the
median provides better information on the typical asset holdings than the mean asset holdings.
The aggregate portfolio share is the total value of the asset held by all households divided by
total household assets.8
Actively managing a business is often a career choice as well as a portfolio choice. Since
at a point in time relatively few people manage their own business, it is not surprising that only a
modest fraction of households invest in active business assets: according to the first column of
Table 1, roughly 11 percent of all households invest in active business assets. Other types of
assets that might be related to entrepreneurial ventures are also held by a modest number of
households. Only 1.4 percent of households have passive business investments and 8.2 percent
of households hold commercial real estate. By comparison, 68.1 percent of households have
housing equity, 53.6 percent of households have retirement accounts, and 23.7 percent of
households own stock (either directly or through mutual funds). Thus, active business
8 Unlike the average of household portfolio shares, the aggregate portfolio share has the property that the sum of all shares is one. It is the equivalent of the weighted average of household portfolio shares where the weights are overall household wealth.

9
investments (and other entrepreneurial assets) are concentrated within a segment of the
population.
Although active business assets are concentrated among roughly 11 percent of households,
they play an important role in aggregate household portfolios. Figure 1 provides a pie chart of
the composition of aggregate household portfolios from the SCF data (the data are also in the last
column of Table 1). Active business assets constitute 19.0 percent of overall household
portfolios for a mean asset value of $102,972. This portfolio share is larger than the portfolio
share of stocks held outside of retirement accounts (which have a 11.7 percent portfolio share
after combining direct and mutual fund holdings) and retirement accounts controlled by
households (which have a 14.7 percent portfolio share). Housing equity, with a portfolio share
of 24.8 percent and average value of $134,684, is the only asset category that is more important
than active business assets in overall household portfolios.
To explain why active business assets represent a substantial share of aggregate household
assets despite only 11 percent of households holding such assets, it is useful to consider the
portfolios of entrepreneurial households, defined as households that report holding active
business assets. Table 2 provides the same information as Table 1 but separates households that
own active business assets (Panel A) from households that do not own active business assets
(Panel B). One striking fact that emerges from comparing households with and without active
business assets is the substantial difference in average wealth across the two groups. Households
with active business assets have an average wealth of $2.10 million compared to an average net
worth of just over $350,000 for households without such assets. Thus, the 11 percent of
households that are entrepreneurial tend to have relatively high wealth.

10
Figure 2 compares the average value of different types of assets for all households,
households with active business assets (my definition of entrepreneurs), and households without
active business assets. By definition, the entrepreneurs are the households with active business
assets. The average holdings of active businesses, however, are large compared to the averages
of other categories of assets. For entrepreneurs, the average active business asset position is
worth about $942,000 (the median is $100,000). Thus, while a modest number of households
own businesses, these businesses are often quite large. A less expected pattern is that the
entrepreneurs also hold relatively large average amounts of other types of assets. Entrepreneurial
households, on average, tend to be wealthier than other households, but this wealth is not solely
tied up in the active business assets.
The concentration of active business assets in a minority of households highlights an
important fact about entrepreneurs: entrepreneurs tend to hold less diversified portfolios than
other households.9 Figures 3A and 3B compare the portfolio composition of entrepreneurs and
non-entrepreneurs. From Panel A of Table 2, among the households that have active business
assets, active businesses account for 45.0 percent of their aggregate assets. Furthermore, these
assets are typically in only one or two businesses so that entrepreneurs face the idiosyncratic risk
that other households can diversify across investments. As will be discussed below, this lack of
diversification of entrepreneurs accentuates the effects of the capital gains tax since the tax has
asymmetric effects on successful and unsuccessful investments.
The capital gains tax is more relevant for some types of assets than others. Among the
assets for which the capital gains tax is either irrelevant or not very relevant are: (1) liquid assets
and fixed income investments since most of the income from fixed income investments are taxed
9 Gentry and Hubbard (2004) document the concentration of entrepreneurial assets in household portfolios and discuss the importance of both the concentration of these assets and the associated lack of diversification on household saving decisions.

11
as ordinary income rather than capital gains;10 (2) assets in retirement accounts since
withdrawals are taxed at ordinary income tax rates rather than capital gains tax rates; (3) primary
residences since current law allows a substantial exemption from capital gains on the sale of a
household’s primary residence; and (4) many of the assets in the other financial assets category
(e.g., annuity contracts and the cash value life insurance policies) since they generate income that
is subject to ordinary tax rates instead of capital gains tax rates. From Table 1, these asset
categories account for over 53 percent of households’ aggregate assets for 2007.
The extent to which the remaining assets – stocks, real estate (both other residential and
commercial), active businesses, farms, passive businesses, and miscellaneous non-financial
assets – generate capital gains varies by asset type. Each asset generates some combination of
dividends, rents, ordinary income, and capital gains. Of these remaining asset categories, capital
gains taxes are more likely to apply to ownership of stocks, active business assets, commercial
real estate, farms and passive businesses.11 Within this set of assets that are potentially sensitive
to the capital gains tax, active and passive business assets account for over half of the total
aggregate value of households’ assets.12
10 Fixed income holdings can create capital gains if bonds are sold with a gain or loss before maturity. Liquid assets tend to generate relatively low taxable income since households accept lower rates of return in exchange for liquidity services (a form of income that escapes income taxation). 11 This list omits other residential real estate (with an aggregate portfolio share of 7.05 percent) since much of the income comes in the form of rents or imputed rents from consumption use and the possibility that second homeowners can avoid capital gains taxation by converting the second home into their primary residence before selling the house. The list also omits other non-financial assets (with an aggregate portfolio share of 1.79 percent) due to the heterogeneous nature of these assets. 12 That is, the combined aggregate portfolio share of active and passive businesses (i.e., 21.54 percent) is greater than than the combined aggregate portfolio share of households’ holdings of stock, commercial real estate, and farm assets (i.e., 16.44 percent).

12
II.B. Magnitude of Capital Gains from Active Business Investments
The comparison of portfolio shares suggests that active business assets are an important
part of household portfolios but this comparison does not necessarily provide information on the
relative capital gains across types of assets. For some asset categories, the SCF asks questions
about the household’s tax basis in the asset.13 This information allows for a direct comparison of
the unrealized capital gains across asset categories. At the outset, it is important to note that the
SCF allows a comparison of unrealized capital gains rather than a comparison of realized capital
gains. By comparing unrealized capital gains instead of realized capital gains, this analysis
addresses the gains that could be potentially affected by the capital gains tax. In contrast,
studying realized capital gains excludes from the analysis capital gains that are not realized,
possibly in response to the tax system.
Table 3 compares reported unrealized capital gains on directly-held equities, active
business assets, and passive business assets. In each column, the statistics refer to the sample of
households that hold a particular type of asset. Both in terms of the prevalence of having gains
instead of losses and the size of these gains, active and passive business assets appear to have a
much larger stock of unrealized capital gains. In terms of the percentage of households with
gains on their assets, 79.1 percent of active business owners report an unrealized capital gain
compared to only 68.1 percent of direct owners of corporate stock. Almost one-fifth (19.3
percent) of households that hold equities directly have an unrealized capital losses compared to
only 13.4 and 9.9 percent of owners of active and passive business assets, respectively. The
substantial proportion of households with unrealized capital losses on corporate stock runs
13 For active and passive businesses, the SCF specifically asks about the “cost basis for tax purposes.” For stocks, the survey asks about the gain or loss on the portfolio. While the survey also asks for the gain or loss on mutual funds, it is unlikely that many households answer this question correctly since the tax rules for reinvestment of dividends and capital gains distributions are quite complicated. Thus, I focus on stocks held directly by households.

13
counter to the standard tax-planning advice that investors can minimize their capital gains tax
liability by selling their losers and holding their winners.14
In terms of the magnitudes of typical capital gains across asset categories, the unrealized
gains on business assets are considerably larger than on equities. The median unrealized capital
gain on active business assets is $45,000 compared to only $950 for equities. The median
unrealized capital gain on directly-held equities is surprisingly small. The difference in the mean
values is even more dramatic: the average unrealized capital gain on an active business is
$731,528 compared to only $57,980 for equities.15 The passive business assets are similar to the
active business assets with a median gain of $40,000 and an average gain of $655,248.
To put these gains in the context of the size of the investor’s stake in the investment,
consider the gains as a percentage of the investor’s tax basis. For stocks, the median gain is only
10.4 percent and the average portfolio gain is 61.9 percent. In contrast, for active businesses, the
median gain is 233 percent and the average percentage gain is 12,358 percent. The magnitude of
the average gain reflects that many entrepreneurs have a quite modest tax basis in their venture.
For example, if one conditions on the tax basis in the active business asset being larger than
$5,000 (which is true for roughly 71 percent of households with active businesses), the average
percentage gain falls to 658 percent, which is still considerably larger than the average gains on
stock portfolios.
The data in Table 3 compare the median and average unrealized gains across asset types
conditional on households owning each type of asset. Recall, however, from Table 1, that
households vary in their propensities to hold different types of assets. While 23.7 percent of
14 Auerbach, Burman and Siegal (2000) present data on the frequency that households manage their portfolios to offset capital gains with capital losses. They conclude that while some households behave in ways that are consistent with tax-minimizing strategies, many households could reduce their tax liabilities through such strategies. 15 It is important to note that these means, unlike the means reported in Table 1, are conditional on the household holding a particular type of asset.

14
households directly invest in shares of stock, only 11 percent of households have active business
assets. Even adjusting for the greater number of households with direct holdings of stock, these
averages imply that the total unrealized gains on active and passive business assets are larger
than the unrealized gains on directly-held stock. Total unrealized capital gains on active
business assets are almost six times larger than the total unrealized capital gains on directly-held
stock; total unrealized gains on passive business assets are about two-thirds the size of the total
unrealized capital gains on directly-held stock.16
The message from these data is quite clear: the stock of unrealized capital gains on
privately-held businesses could be many times larger than the stock of unrealized capital gains
on corporate equities. This difference is important since the distortion of realization-based
taxation depends on whether individuals change their decisions about realizations. A large stock
of unrealized gains on active businesses suggests that there is considerable scope for tax factors
to influence decisions about selling firms. In contrast, if households with active business
investments tended to have small capital gains (or mainly capital losses), then selling their
businesses would trigger only modest capital gains taxes.
The SCF data suggest that capital gains on privately-held (both actively-managed and
passive investments) are important for considering the economic impact of capital gains taxation.
This conclusion is at odds with the common perception that entrepreneurial assets are a small
part of the capital gains tax base (see, e.g., Auerbach, 2007). The common perception is that
capital gains taxation is primarily about taxing corporate stock. Support for this claim comes
16 These ratios are calculated from the data in Table 3. The ratios are the average unrealized capital gains for an asset category weighted by the percentage of households with the asset relative to the average unrealized capital gains for another asset category weighted by the percentage of households that hold the asset. For example, the average unrealized gain on active business assets is $731,528 and 11.1 percent of households hold such assets and the average unrealized gain on directly-held stock is $57,980 and 23.7 percent of households directly-invest in stock; thus, [(731,528)*(.111)]/[(57,980)*(.237)] is a ratio of 5.90, implying that the unrealized capital gains on active business assets are almost twenty times larger than the unrealized capital gains on directly-held stock.

15
from examining realized capital gains using tax return data rather than the potential capital gains
that are captured by the SCF measure of unrealized capital gains. The most recent detailed data
on individuals’ realized capital gains by type of assets is for the 2007 tax year (Wilson and
Liddell, 2010). Wilson and Liddell report that total capital gains were mainly comprised of sales
of corporate stock (24.9 percent of total capital gains), pass-through gains from assets sold by
partnerships and other pass-through entities (40.1 percent; these often reflect investment
companies selling stocks), and distributions from mutual funds (9.4 percent). In contrast, assets
that naturally seem to represent smaller businesses are a modest portion of total capital gains:
sales of partnership, S-corporation and estate or trust interests account for 5.4 percent of gains
and sales of depreciable business real and personal property accounted for 2.9 percent of total
capital gains. This comparison may understate the importance of entrepreneurial businesses for
several reasons. First, sales of corporate stock do not distinguish publicly-held companies from
privately-held businesses; entrepreneurs may eventually realize capital gains either by selling
privately-held shares or by taking their company public. Second, the gains generated by pass-
through entities include gains generated by venture capital partnerships and other entities that
invest in entrepreneurial businesses.
While the SCF and IRS data are not perfectly comparable, the substantial difference in the
importance of entrepreneurial businesses in capital gains suggests that the composition of
unrealized capital gains may differ substantially from the composition of realized capital gains.
A natural explanation for this difference between unrealized and realized capital gains across
types of assets is that business investments tend to be held longer than investments in traded
equity. Using detailed tax return data for 1993 (similar to that used by Wilson and Liddell),
Burman and Ricoy (1997) examine the holding periods associated with realized capital gains

16
from different assets. They report that the average holding period (weighted by the size of the
transaction) for corporate stock is 2.9 years. By comparison, the average holding period for
business property is 6.4 years and the average holding period for partnerships, S-corporations,
and fiduciaries is 6.9 years. Thus, even among the gains that are realized, the investment
behavior of entrepreneurs differs from investors in public firms. These longer holding periods
magnify the importance of capital gains taxation since the distortion from the tax increases with
the size of the gain, which should increase with the holding period of the asset.
III. What is Taxed by Taxing Entrepreneurial Capital Gains?
III.A. Wage Income vs. Business Income
A common assertion is that by taxing capital gains at lower tax rates than ordinary income,
entrepreneurs can lower their tax burden by trading wage taxation in exchange for capital gains
taxation if the business is successful (see, e.g., Burman, 1999, p. 76). The claim is that
entrepreneurs pay capital gains tax rates on what is arguably labor income. The argument is that
entrepreneurs take low salaries during the incubation phase of their business relative to what they
could earn elsewhere which reduces their tax liabilities when the firm is young.17 The foregone
wages are reinvested in the business. If the entrepreneur sells the business, part of the capital
gain represents the return on accepting lower wages, but this gain faces only the capital gains tax
rate. This argument suggests two tax advantages to entrepreneurship. First, if the capital gains
tax rate is lower than the tax rate on ordinary income, the entrepreneur benefits from this tax rate
17 While the choice of compensation through salary or future (uncertain) appreciation in business value has tax consequences, the mix of compensation is not necessarily tax motivated. As discussed by Hall and Woodward (2008), entrepreneurs may take equity as compensation for incentive reasons, especially when outside funding becomes important.
17
difference. Second, since capital gains taxes are only taxed upon realization, the entrepreneur
defers paying taxes.
This analysis is incomplete because it fails to account for tax treatment of the firm. The
analysis above suggests that an entrepreneur chooses between having income taxed as wages or
as capital gains; a more accurate depiction of the entrepreneur’s choice is of having income taxed
as either wages or business income. A stylized two-period example of an entrepreneur with a
business illustrates the basic tax issues. To abstract from uncertainty, start with a business that is
certain to succeed. For simplicity, assume that the entrepreneur incorporates the business when
it is created; I will consider alternative organizational form choices after outlining the basic
example.18 I analyze how an incremental change in wage payments affects a business owner’s
tax liability through the taxation of wage income, business income, and capital gains upon the
sale of the business.
In the benchmark scenario, the entrepreneur draws a wage of W in the first period, reports
business income of Y in the first period, has a tax basis of B in the business, and sells the firm of
a price of P in the second period. Wage and business income in the second period are not
instrumental for the example. In the alternative scenario, the entrepreneur receives an additional
$100 in wage income; however, to maintain the same level of investment in the business as in the
benchmark case, the entrepreneur must also invest additional capital in the business. With a tax
rate on wage income of tw, the entrepreneur pays $100*tw in additional taxes on ordinary income.
However, the business gets to deduct the additional wages from business income. The decrease
in the business tax liability is $100*tb where tb is the tax rate on the business. The first period tax
consequences of paying additional wage income are clear: the entrepreneur’s wage income
18 Incorporation at an early stage is quite common at least among start-ups that seek external financing (see Bankman, 1994) despite that such incorporation may not minimize taxes.
18
increases so that his or her taxes increase, but the business benefits from the deductibility of
wages paid so that business taxes decrease.
The additional wage payment has cash flow consequences for the firm that could affect the
level of the firm’s investment. The increase in wages reduces available cash. However, the
effect on cash available for investment is mitigated by the reduction in business taxes caused by
the deductibility of wage payments. By paying the additional wages, the firm has $100*(1 - tb)
less in cash available to fund investment (relative to the benchmark scenario). The entrepreneur
must contribute an additional $100*(1 - tb) in order to maintain the same level of business
investment. This additional investment increases the entrepreneur’s tax basis in the firm by
$100*(1 - tb).
In the second period, the entrepreneur sells the business and pays tax on the capital gain.
Under the benchmark scenario, the size of the capital gain is P – B and the tax on the capital gain
is (P – B)*tcg, where tcg is the tax rate on capital gains. Assuming that the buyer pays the same
price for the firm in either scenario, the entrepreneur pays capital gains taxes of [P – B - $100*(1
- tb)]*tcg under the alternative scenario. The additional capital explicitly paid into the firm by the
entrepreneur under the alternative scenario reduces the capital gains tax liability by $100*(1 -
tb)*tcg relative to the benchmark scenario. The overall tax consequence of paying wages (instead
of the benchmark of the entrepreneur working for ‘sweat equity’) is that first period taxes would
change by $100*(tw - tb) and second period taxes would decrease by $100*(1 - tb)*tcg.
To illustrate the potential tax consequences for an entrepreneur between earning wages at
the early stage of a project and being compensated by capital gains when the project is sold, it is
useful to consider several alternative configurations of tax rates. Table 4 summarizes the
numerical calculations for various illustrative tax rates. As a starting point (see the calculations

19
in the first row), it is useful to consider the case that implicitly underlies the common claim that
entrepreneurs transform labor income into capital gains income by not paying wage income in
the first period. This argument ignores the business tax consequence for the decision, which can
be represented by assuming that the tb is zero. Assume further that tw is 35 percent and tcg is 15
percent. If the firm increased wages by $100 in the first period, the net effect would be an
increase in tax payments of $35 since wage income would increase but there would be no value
from reducing business taxable income. The entrepreneur would need to invest $100 in the firm
to maintain the same level of investment that would be achieved without the wage payment.
This investment would increase the entrepreneur’s basis in the firm by $100 and would reduce
future capital gains taxes by $15. Thus, the tax benefit of accepting sweat equity is avoiding
taxes on wages in the first period, deferring tax until the business is sold, and paying tax at
preferential capital gains tax rates.
In contrast, the second row of Table 4 considers the case in which the entrepreneur’s tax
rate on wage income is equal to the tax rate on business income. The business saves taxes in the
first period that exactly offset the entrepreneur’s tax on the additional wage income. To keep
investment constant, the entrepreneur must invest $65 in the firm. The firm can invest $100
since it saves $35 on taxes and receives an equity infusion of $65. This equity infusion increases
the entrepreneur’s basis and reduces the subsequent capital gain by $9.75. In this scenario,
paying wages to the entrepreneur, instead of sweat equity, reduces the overall tax burden. This
example illustrates that compensating entrepreneurs via sweat equity does not necessarily
minimize the tax burden on the entrepreneur.
Another alternative to consider is when tax rates on wage income and capital gains are
equal. The third row of Table 4 considers the case of the business tax rate being zero, and the
20
fourth row of the table illustrates the case of the business tax rate being higher than this common
tax rate. When the business tax rate is equal to zero, sweat equity has a tax advantage based
solely on the time value of money. Sweat equity can save the entrepreneur $15 in taxes in the
first period, at the expense of increasing taxes by $15 in the second period. When the business
tax rate is 35 percent but the wage and capital gains tax rates are 15 percent, the entrepreneur can
benefit by receiving wages since these wages are deductible at the higher business tax rate. This
configuration of tax rates illustrates the tax strategy of paying wages instead of dividends in a
closely-held business that faces double taxation on the business income (at rates that combine to
exceed the wage tax rate).
The calculations in Table 4 do not account for the time value of money in that taxes are
paid at different times. The overall tax consequence of the alternative scenario (i.e., paying
wages instead of sweat equity) is to change the tax liability by $100*(tw – PV(tcg) - tb), where
“PV” represents the discounted present value of the future tax consequences. The practice of
entrepreneurs “saving” on taxes by paying themselves low wages only reduces taxes if tw >
PV(tcg) + tb, the tax rate on wage income exceeds the sum of the present value of capital gains
tax rate and the business income tax rate. Under current law, the top marginal income tax rates
on wage income are similar to the top marginal tax rates on corporate income so it is unlikely
that entrepreneurs are reaping large tax benefits from not paying themselves wages if their
business is successful.
I have assumed that the business is successful. Many start-up businesses do not have
positive taxable income, even if they eventually become successful. The tax code does not allow
for tax refunds when a firm earns negative income; instead, firms with losses can carry these

21
losses forward against future income.19 In tax jargon, the tax code allows only imperfect loss
offsets. Since the firm does not benefit from the tax deduction until the future, these rules reduce
the present value of deducting wage payments to the entrepreneur. In the extreme situation, the
carryforwards may expire unused so that the firm never gets a tax benefit from deducting the
wages. For example, if a firm fails, it may not benefit from the deduction.
The imperfect loss offset rules may reduce the value of the business tax savings created by
paying wages to the entrepreneur. However, relying on these imperfections to argue that the tax
code favors entrepreneurs because they can avoid wage taxation by increasing their business
income (by not paying themselves wages) is misguided. As discussed in more detail below,
imperfections in loss offset rules create disincentives for investment because they create
asymmetries in the treatment of investment: the government taxes successful projects but does
not refund losses of unsuccessful projects.
The assumption that the business incorporates at the outset imposes that the firm faces a
separate entity-level tax. This assumption is not critical for the analysis. If the firm is taxed as a
pass-through entity, then the business income would be taxed on the entrepreneur’s tax return.20
Thus, the entrepreneur has more wage income but less business income. Unless the marginal tax
rate on these two sources of income differs for an individual, the entrepreneur does not save
taxes by accepting a lower wage. As a pass-through entity, the entrepreneur’s tax basis in the
investment changes each year with his or her allocated share of the income of the business.
19 One possibility is that the entrepreneur sells the business while it has net operating loss carryforwards. These tax characteristics may affect the price the buyer pays for the firm. (See Henning, Shaw and Stock (2000) for evidence on how tax characteristics can affect acquisition prices of firms.) By increasing the size of the net operating loss carryforward, the additional wage paid to the entrepreneur may increase the price paid in an acquisition since the firm will pay less in taxes in the future. Thus, the price at which the firm is sold may depend on whether the entrepreneur receives wage payments, which would violate my assumption that the price does not depend on the two scenarios considered above. This price difference would typically increase the capital gains tax liability under the alternative scenario which reduces the apparent tax advantage of deferring compensation. 20 The exact rules for passing losses through to owners vary by organizational form. If losses cannot be passed through to the owner, then the analysis would be the same as if the firm is incorporated as a C-corporation.
22
These basis adjustments affect the size of future capital gains such that the gain is the same as if
the owner received the income and reinvested in the firm. Thus, under the assumption that the
entrepreneur would also reinvest the marginal increase in wages in the firm, the size of the
entrepreneur’s capital gain should be the same under the two scenarios.
III.B. Capital Gains Tax as a ‘Success’ Tax
This analysis rejects the idea that the capital gains tax on entrepreneurs is a tax on their
labor services. Instead, the decision to pay wages creates a choice between whether income will
be taxed as wage income or business income. Taxing capital gains creates a tax in addition to
the taxes on wage or business income. This additional tax can be particularly burdensome
because it tends to fall asymmetrically on successful projects.
Before illustrating the mechanics of asymmetric taxation, it is useful to consider the effects
of a symmetric tax on risky investment. A tax on returns reduces the after-tax rate of return on
investment but it also reduces the variance of returns. The reduction in the variability of returns
provides the entrepreneur with a form of insurance. This form of insurance could be particularly
valuable to entrepreneurs since they hold undiversified positions in their firms and cannot
typically use financial markets to share this risk. If the tax system is symmetric with respect to
risk taking (i.e., the tax rate is flat and the government provides tax refunds on losses), then a tax
on risky investment may actually increase investors’ willingness to hold risk. The reason for this
counterintuitive prediction is that the tax system reduces the variance of returns in addition to
reducing the mean return. Unlike a symmetric tax on returns, an asymmetric tax does not
necessarily provide insurance. In the extreme, the government takes part of the upside of the
venture but does not share in its losses.
23
To understand why the capital gains tax disproportionately falls on successful ventures,
consider an entrepreneur who starts a business by contributing financial capital and time to the
enterprise. By their nature, start-ups have a lumpy distribution of outcomes (see, e.g., Hall and
Woodward, 2008). For simplicity, assume that the project has two possible outcomes. It will
either be worthless or be very successful. As with the previous example, begin by assuming that
the entrepreneur incorporates the business at its inception. In understanding the effects of
taxation, it is useful to consider the taxation of different outcomes.
If a start-up business does well, the entrepreneur often exits by offering shares to the public
through an initial public offering (IPO). For a successful start-up, the IPO may trigger a
substantial capital gain for the entrepreneur. In addition to the capital gains tax, the income of
the firm is subject to corporate income taxation and shareholders are subject to taxation on
dividends received. However, since these taxes would be due irrespective to whether the
entrepreneur sells the firm, the capital gains tax operates as an additional layer of taxation on the
firm’s success.
The size of the entrepreneur’s gain depends on the value of the business and the
entrepreneur’s tax basis in the business. The value of the business will depend on the present
value of the future after-tax income that the business can generate. Thus, the future taxes that the
business will pay can affect what the entrepreneur receives for the business. The entrepreneur’s
tax basis typically depends on his or her financial contribution to the firm.
In contrast, if the firm fails, then the tax treatment of the losses depends on the specifics of
how the firm is organized. If the firm is incorporated so that it is subject to the corporate income
tax, the losses may be trapped inside the firm, but the entrepreneur will have a capital loss on the
shares that he or she owns in the firm. The entrepreneur may be allowed to use his or her capital
24
losses to offset other income (possibly with some limitations). One implicit limitation is that the
capital loss is limited to the entrepreneur’s financial stake in the company. As discussed above,
many entrepreneurs invest time in their business while earning below market wages. While they
do not pay income taxes on the wages that they do not earn (as described above), this type of
investment may not create a capital loss if investments of foregone wages do not establish basis
in the firm for these investments. If the firm is not incorporated, the business losses may pass
through to the entrepreneur’s personal tax return; however, since the entrepreneur does not sell
the firm, the additional layer of tax created by the capital gains tax is not relevant.
For firms that fail, the key point is that the losses may be deductible from one tax base
(either the corporate tax base or the individual tax base) but typically do not create two
deductions. In contrast, for successful firms, the capital gains tax applies in addition to taxes on
business income.
In addition to these extreme outcomes, some start-up businesses yield intermediate
outcomes. One possibility is that the firm does not fail but is not so successful that the
entrepreneur sells the firm to a larger firm. Instead, the entrepreneur operates the firm and pays
taxes on any income generated by the firm. Since capital gains taxes are triggered when a firm is
sold, the capital gains tax does not apply to such outcomes. If the entrepreneur bequeaths the
business to his or her heirs, then current U.S. tax law allows the heirs to step-up the basis of the
business which reduces capital gains tax liabilities.
Overall, the capital gains tax creates an asymmetric tax on successful entrepreneurial
ventures. In contrast, for portfolio investment, the realization nature of capital gains taxation
provides the possibility that the asymmetric nature of capital gains taxation goes in the opposite
direction: by strategically timing the sale of losses, investors can share more of their losses than
25
their gains with the government. Auerbach, Burman, and Siegel (2000) find that relatively few
households are successful at sheltering capital gains from income, consistent with losses facing a
higher marginal tax rate than gains. Overall, they conclude that most gains and losses face tax
rates that are close to the statutory tax rate, suggesting that capital gains and losses from portfolio
investment faces roughly symmetric taxation.
IV. Capital Gains Taxation and Entrepreneurs’ Decisions
The capital gains tax can affect a number of decisions made by entrepreneurs. First, it
can affect whether entrepreneurs start new businesses. Second, capital gains taxation can affect
how and when entrepreneurs exit their business. Third, capital gains taxes can affect
entrepreneurs’ ability to raise funds from outside investors. This section examines each of these
decisions in turn and the magnitude of the potential distortion.
IV.A. Entrepreneurial Entry and Asymmetric Taxation
Relatively little empirical research has been done on the behavioral effects of asymmetric
capital gains taxation on entrepreneurial entry. Focusing on asymmetric taxation created by
progressivity in ordinary income tax rates, Gentry and Hubbard (2003) examine how
asymmetries in taxation affect the propensity of individuals to enter self employment or acquire
active business assets. Using data from the Panel Study on Income Dynamics, they find
substantial effects of this success tax on individuals’ decisions along both these margins. While
these results suggest that asymmetric taxation of business entry decreases the rate of business
formation, their methodology does not specifically include capital gains taxes.21
21 Unfortunately, their methodology cannot be easily modified to include capital gains taxes.

26
Cullen and Gordon (2007) formulate a broader model of tax incentives for entrepreneurial
risk-taking, including the incentive effects of capital gains taxation. Their model incorporates
both personal and corporate tax incentives for starting a business. They predict modest increases
in entrepreneurial risk-taking from cutting the capital gains tax rate in half. From their baseline
of the 1993 tax code, they estimate that cutting the capital gains tax rate would increase
entrepreneurial entry by roughly 10 percent.
IV.B. Entrepreneurial Investments and the Lock-in Effect from Capital Gains Taxes
The difference between unrealized capital gains, as measured in the SCF, and realized
capital gains, reported on tax returns, suggests that realization behavior may differ dramatically
between different types of assets. Entrepreneurs may be less likely to sell their businesses than
investors in public stock are to sell stock. The nature of the investments may play an important
role in this difference. Issues in corporate governance and asymmetric information make it
difficult for an entrepreneur to sell a small portion of his or her business to outsiders. Being
privately-held concentrates ownership and control in a small number of investors. Information
and incentive problems make it difficult for an entrepreneur to avoid taking a substantial stake in
his or her business. For example, providers of outside finance may condition financing on the
entrepreneur being actively involved in running the business.
While these incentive and information concerns are almost certainly important for
entrepreneurs’ decisions about selling their businesses and their lack of diversification,22 taxes
can also play a role. A common complaint about capital gains taxation is that the realization-
based tax regime creates a “lock-in” effect which inhibits asset sales. The lock-in effect is one
22 Bitler, Moskowitz and Vissing-Jorgensen (2005) provide evidence of how agency costs contribute to entrepreneurs’ lack of diversification.
27
commonly-cited explanation of why capital gains realizations respond quickly to changes in the
capital gains tax rate (see, e.g., Eichner and Sinai, 2000). In the context of portfolio investment,
this lock-in effect leads investors to holding onto stocks with gains instead of rebalancing their
portfolios; this lock-in effect creates an economic distortion because investors do not hold their
preferred portfolio of stocks. Investors may also forego what they expect are profitable
opportunities to switch from one set of stocks to another. As discussed by Burman (1999), the
magnitude of this distortion might be quite small for the portfolio investments of a typical
investor. First, a diversified portfolio is likely to have some stocks with losses and other stocks
with gains. Investors can realize some of their losses to offset realized gains so that the lock-in
effect does not distort their portfolio decisions. Second, to the extent that stock markets are
efficient and stocks are close substitutes for each other, investors can make other adjustments in
the portfolios that offset the distortions created by the lock-in effect.
For entrepreneurs, however, the lock-in effect may create a quite costly distortion.
Entrepreneurs often have undiversified portfolios so that offsetting portfolio adjustments are less
likely to mitigate the tax consequences of selling their appreciated assets. Moreover, unlike
portfolio investment in which who owns the stock has little effect on the operations of the firm,
the operating decisions of a privately-held business may depend on who owns the stock since the
owners control the firm. Likewise, if the lock-in effect induces firms to stay privately held, part
of the economic distortion is that these firms miss out on growth opportunities that could be
financed by being publicly traded.
Empirical analysis on the magnitude of this distortion is complicated by the need for
measures of the difference in value that a business will have across owners. However, two
recent papers (Cavalcanti and Erosa, 2007; and Chari, Golosov, and Tsyvinski, 2005) have

28
applied quantitative general equilibrium models to measure the lock-in effect of capital gains
taxes on entrepreneurs. Cavalcanti and Erosa develop a model in which closely-held firms
derive value from two sources: a common value that can be transferred to other owners; and an
idiosyncratic (non-market) component that depends on the owner. In this model, trade in
businesses benefits society by allowing new owners with potentially higher idiosyncratic value to
acquire the firm. The capital gains tax deters these transactions by creating a cost to business
turnover. The parameters in their benchmark calibration lead to a low steady-state business
turnover rate with less than two percent of all entrepreneurs selling their businesses in a given
year; this matches actual data on business turnover and is consistent with the large stock of
unrealized capital gains held be entrepreneurs documented in the SCF data. Given this starting
point, taxing capital gains of entrepreneurs raises very little revenue.
Cavalcanti and Ersoa consider two possible policy experiments: (1) a fifty percent
reduction in the capital gains tax rate (from 28 to 14 percent); and (2) indexing basis for inflation
(the major source of capital gains in their framework). Both of these policy changes
substantially increases the rate of business turnover – to 11 percent per year with the lower tax
rate and 7 percent per year with indexing of basis. Given the substantial increase in turnover, it
is not surprising that Cavalcanti and Erosa estimate that these policy changes for the taxation of
closely-held businesses would be self financing.23 In terms of welfare effects, they estimate that
eliminating the capital gains tax on entrepreneurs and replacing the revenues with a lump sum
tax would increase total output by 0.48%; for comparison, the revenue from taxing these capital
gains in their model is only 0.03%. These calculations suggest a substantial welfare loss from
taxing the capital gains of entrepreneurs.
23 Since Cavalcanti and Erosa compare steady state outcomes, these results do not reflect activity related to transitory changes in business turnover in response to a tax change. Instead, these results compare business turnover across steady state situations with different tax policies.

29
Chari, Golosov, and Tsyvinski (CGT) emphasize that some individuals have a comparative
advantage in creating new businesses; however, creating a new business requires focused
attention so these entrepreneurs are best suited to attend to one business at a time. CGT refer to
these individuals as “serial entrepreneurs.” Once the business has been established, economic
efficiency is enhanced by the entrepreneur selling the firm to professional managers and
potentially starting another new business. By creating a transaction cost for selling the firm, the
capital gains tax creates a lock-in effect by which entrepreneurs hold their businesses
inefficiently long.
CGT build a general equilibrium model to quantify the magnitude of this inefficiency; they
choose parameters for the model that match the percentage of households who are entrepreneurs
and the fraction of total income earned by entrepreneurs. In their model, eliminating a capital
gains tax rate of 20 percent would increase the percentage of entrepreneurs who sell a business in
a period from 10 percent to 29 percent – roughly a tripling of the rate at which entrepreneurs sell
successful businesses instead of manage the business themselves. Given that business sales are
quite sensitive to the capital gains tax rate, it is not surprising that CGT conclude that the revenue
maximizing capital gains tax rate on entrepreneurs is roughly 15 percent.24
IV.C. Capital Gains Taxes and the Supply of Entrepreneurial Financing
In addition to affecting the taxes paid by entrepreneurs, the capital gains tax also affects the
incentives for outsiders to fund entrepreneurs. While one can think of the effects on the
entrepreneurs as being effects on the demand for entrepreneurial finance, the effects on outside
investors are supply-side effects. These outsiders can take several forms. At early stages of
24 CGT focus on the revenue-maximizing tax rate. However, the revenue-maximizing tax rate might create a substantial marginal deadweight loss since a reduction in the tax rate will not reduce revenue by much, but it might provide substantial benefits in terms of the reallocation of businesses.

30
investment, entrepreneurs often rely on friends and family members for financing. Moving
beyond this rather closed network, entrepreneurs may seek financing from angel financing and
eventually from venture capital funds. Angel financing often comes from wealthy individuals
(many of whom are successful entrepreneurs). These investors often invest in a limited number
of firms, though angel financing is evolving toward some pooling of resources across investors.
As individuals, they face capital gains taxation. Venture capital funds and hedge funds provide
capital to entrepreneurs. These funds are typically organized as partnerships. The investors
(usually limited partners in the funds) face capital gains taxes on their returns from investing
through these vehicles.
To the extent that the capital gains tax rate affects savings and portfolio decisions of
potential investors in these firms, it can affect the supply of capital for entrepreneurs. The
importance of capital gains taxation depends on the mix of different types of investors (e.g.,
taxable vs. tax-exempt investors) in providing funds to entrepreneurs through different channels.
Poterba (1989) documented that individual investors provided a relatively modest portion of
venture capital money. Gompers and Lerner (2004) report that individuals provided 12 percent
of the funds invested in venture capital funds during 2002. The bulk of venture capital funding
comes from pension funds (45 percent of the 2002 total) and endowments (11 percent of the
2002 total) that should not be sensitive to the capital gains tax rate.25 Given that individuals play
only a modest role in investing in venture capital funds, it is unlikely that the individual capital
gains tax rate plays an important role in the supply of venture capital backing to entrepreneurs.26
25 Other sources of investment for venture capital funds in 2002 included corporations (10 percent) and insurance companies and banks (16 percent). These investors may have been subject to capital gains taxes as corporations. 26 Gompers and Lerner (1998) use state-level variation in capital gains tax rates to explore whether venture-capital-backed investment varies with capital gains tax rates. Their results suggest that higher capital gains tax rates are associated with less investment financed by venture capital in the state. However, this relationship is strongest for investment by venture capital funds that rely heavily on pension funds as a source of capital. Gompers and Lerner hypothesize that this relationship indicates that the relationship between venture capital finance and capital gains tax

31
Recent data on both informal investors and angel investors indicate that these investors are
critical for small businesses. Reynolds (2005) reports that informal investors contributed an
average of $162 billion per year over the period 2000-2004; by comparison, he reports an
average of $45 billion per year of venture capital funding of start-ups for 2000-2003. According
to the Center for Venture Research (2008), angel investors provided $26 billion in financing for
start-ups in 2007. Van Osnabrugge and Robinson (2000) estimate that angels provide three to
five times as much financing as venture capitalists and fund roughly thirty times more firms than
venture capitalists. These data suggest that the average stake provided by an angel investor is
much smaller than that provided by a venture capitalist. Van Osnabrugge and Robinson’s data
indicate that the typical angel investment is roughly $75,000 so these investors are crucial for the
earliest stage of external financing.
In contrast to the lack of individuals holding interests in venture capital partnerships, the
friends, family, and angel investors who finance entrepreneurial ventures typically face the
individual income tax. Thus, the capital gains tax rate is relevant for their after-tax rates of
return. The extent to which the capital gains tax rate affects these investors’ decisions depends,
in part, on the tax treatment of alternative investments. A natural alternative to investing in a
start-up business is investing in more established businesses. Such investments typically face the
capital gains tax, which suggests that the capital gains tax does not necessarily disadvantage
investments in start-ups. However, as discussed in the context of the entrepreneurs who invest in
their own businesses, these investors may take relatively large and undiversified positions in the
start-up firm. Morrissette (2007) reports that angel investors tend to have a small number of
investments at a time. Thus, these investors may also be disproportionately affected by possible
rate is driven by a demand-side relationship (rather than a supply-side effect). States with low capital gains tax rates have more entrepreneurs who seek funding from venture capitalists. These needs are met by a mix of sources, most of which do not face the capital gains tax rate.

32
asymmetries in capital gains tax rules. That is, they may face a higher effective tax rate on gains
than they face on losses.
While one function of venture capital and angel financing is to match entrepreneurs who
need funds with investors who are willing to fund such investments, the private equity process
also affects the operations and viability of entrepreneurial enterprises. Venture capitalists and
angels provide more than just financial capital: they also provide advice to entrepreneurs.
Structuring the contracts between venture capitalists and the firms they finance so as to align the
incentives between the various parties is an important part of the process. As emphasized by
Keuschnigg and Nielsen (2004), capital gains taxation can affect this contracting environment.
Their model implies that capital gains taxation reduces effort by both the entrepreneur and the
outside investor (i.e., the venture capitalist). They posit that the capital gains tax has an
especially deleterious effect on effort because firms only face the tax if they are successful.
VI.D. Capital Gains Taxes and Venture Capital Disbursements
The effects of capital gain taxes on venture capital funding can reflect both supply side
considerations (i.e., the taxation of the investors in the venture capital fund) and demand side
considerations (i.e., the taxation of the entrepreneurs who seek funding). As mentioned above,
since many of the investors in venture capital funds are not tax sensitive, Gompers and Lerner
(2004) argue that venture capital disbursements may respond more to demand side
considerations than supply side considerations. Gompers and Lerner (1998) use state-level
variation in capital gains tax rates to explore whether venture-capital-backed investment varies
with capital gains tax rates. Their results suggest that higher capital gains tax rates are associated
with less investment financed by venture capital in the state. However, this relationship is
33
strongest for investment by venture capital funds that rely heavily on pension funds as a source
of capital. States with low capital gains tax rates have more entrepreneurs who seek funding
from venture capitalists.
More specifically, Gompers and Lerner use state-level data from 1976 – 1994 on venture
capital disbursements to entrepreneurs in each state to estimate the effects of capital gains taxes
on entrepreneurial activity. Their dependent variables are the logarithm of real venture capital
investment (i.e., disbursements) in the state per million residents and the number of companies
receiving venture capital in the state per thousand residents. The marginal tax rate on capital
gains (combining Federal and state tax codes) captures the effect of capital gains taxes. They
include a number of state-specific time-varying and state-invariant (but time-varying) control
variables. The variables that vary by state and year include: (1) the logarithm of the previous
year’s real gross state product per capita; (2) the previous year’s real gross state product growth
in the state; (3) the logarithm of previous year’s real expenditure on academic research and
development per capita in the state; and (4) the logarithm of previous year’s real expenditure on
industrial research and development per capita in the state.27 The year-specific (but state-
invariant) variables include: (1) the logarithm of the value of all venture capital-backed initial
public offerings in the previous year; (2) the previous year’s T-bill return; (3) the previous year’s
return on a value-weighted stock index; and (4) a dummy variable for whether ERISA’s prudent
investor rule had been clarified.
27 Their dependent variable comes from tabulations by Venture Economics. Gross state product is from the U.S. Department of Commerce’s Bureau of Economic Analysis. The industrial R&D data are from the National Science Foundation’s Survey of Research and Development in Industry. Before 1978, these data were collected biannually so they imputed data for missing years. For some states, the R&D data are missing in some year so regional data are allocated to various states based on gross state product. The academic R&D data are from the NSF’s Survey of Research and Development Expenditures at Universities and Colleges. They use the National Bureau of Economic Research’s TAXSIM model for calculating tax rates.

34
Following Gompers and Lerner, I estimate a similar regression for a considerably larger
panel of state data. In addition to adding more recent years through 2007, I add data back to
1969.28 By moving to a longer time dimension, I am not able to separate R&D spending into
industry and academic components. My regression differs from Gompers and Lerner’s model
along several other dimensions. First, since the data include some zeroes, I estimate the model in
levels rather than logs. Second, rather than use state-invariant but time-varying information, I
focus on models that include year fixed effects; the year fixed effects model should provide a
more flexible specification for absorbing any time-specific effects. Third, when the R&D
variable is imputed (either due to missing years or states that are imputing using regional data), I
include an interaction term between the R&D variable and a dummy variable that is equal to one
when the variable is imputed and zero when the variable is from reported data; the logic behind
the interaction term is that the imputed values suffer from classical measurement error so they
might cause attenuation bias.
Table 5 presents estimates of the effect of capital gains tax rates on venture capital
disbursements to entrepreneurs within a state. The first column of results is for a regression that
includes state fixed effects but not year fixed effects. The second column of results includes
both state and year fixed effects. The capital gains tax rate in the recipient state has a negative,
and statistically significant, effect on venture capital disbursements. A one percentage point
increase in the marginal tax rate implies a decrease in venture capital disbursements of $1.28 per
capita (in the first specification) and $3.48 per capita (in the second specification). The mean tax
rate in the sample is 24%, and the mean venture capital disbursement is $23.8 per capita. Thus,
evaluated at the mean venture capital disbursement, a one percentage point increase in the capital
28 Gompers and Lerner were limited by the NBER’s TAXSIM model only having state tax information back to 1976. Jon Bakija graciously provided me with tax rate data that extends from 1969 through 2007.
35
gains tax rate decreases venture capital investment into the state on the order of 5.4 to 14.6
percent. Since the money raised by venture capital funds comes from many states and often
comes from tax insensitive investors, Gompers and Lerner suggest interpreting the results of this
type of regression as capturing the demand side of venture capital. States with higher tax rates
on capital gains appear to have fewer entrepreneurs starting businesses that seek venture capital
backing.29
V. Concluding Remarks
Entrepreneurial assets are an important part of the aggregate net worth of U.S. households.
These investments play a vital role in the creation of jobs and new products. Data from the
Federal Reserve Board’s Survey of Consumer Finances indicates that investment in
entrepreneurial ventures has generated a large stock of unrealized capital gains, considerably
larger than the stock of unrealized capital gains on corporate equities. In contrast, tax return data
suggests that the realized capital gains on entrepreneurial assets may be smaller than the realized
capital gains on corporate equities. The magnitude of these unrealized capital gains suggests a
shift in focus in considering the effects of capital gains taxation. While typical analyses of
capital gains consider households’ portfolio investments in stock, the distortions created by the
capital gains tax for entrepreneurial assets may prove to be considerably more important than
those created by taxing capital gains associated with investing in public companies.
The magnitude of unrealized capital gains on entrepreneurial investments suggests that the
capital gains tax could distort a number of important decisions of entrepreneurs. These decisions
29 Similar results hold in models with personal income instead of gross state product as a measure of income. Using lagged tax rates instead of the contemporaneous tax rate also yields similar results.

36
include starting a new business, expanding the business, and obtaining outside financing; the
capital gains tax can also affect whether and when an entrepreneur sells his or her business. The
possibility that the capital gains tax is asymmetric with respect to gains and losses, with gains
being taxed more heavily than losses, magnifies the importance of these distortions.
The tax policy response to these potential distortions could take several different forms.
One approach is to reduce the capital gains tax rate that applies to most types of assets. A benefit
of such an approach is that it does not discriminate against types of investments. An alternative
approach is targeted tax relief for capital gains on entrepreneurial assets. One example of
targeted capital gains tax relief is the exclusion of 50% of the gains for qualified small business
stock that is obtained when a qualified firm has an initial public offering (Section 1202 of the
Internal Revenue Code). Guenther and Willenborg (1999) conclude that this tax treatment has
increased the prices at which entrepreneurs have sold their firms, consistent with the objectives
of the policy. While targeted approaches focus attention on a class of assets for which the
distortions of the capital gains tax may be the largest, targeted approaches often carry
administrative challenges. Defining which assets qualify for special treatment is an exercise in
line drawing that inevitably creates some distortions between types of investment that are quite
similar but fall on different sides of where the qualifying line is drawn.
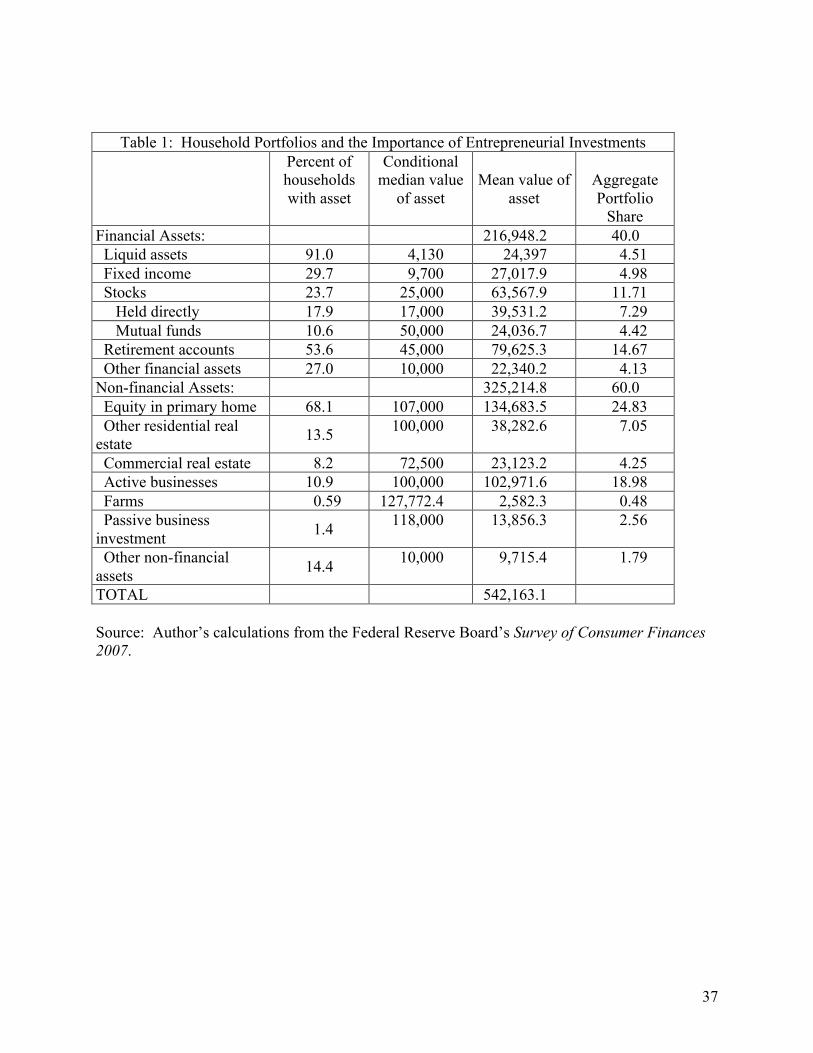
37
Table 1: Household Portfolios and the Importance of Entrepreneurial Investments Percent of
households with asset
Conditional median value
of asset
Mean value of
asset
Aggregate Portfolio
Share Financial Assets: 216,948.2 40.0 Liquid assets 91.0 4,130 24,397 4.51 Fixed income 29.7 9,700 27,017.9 4.98 Stocks 23.7 25,000 63,567.9 11.71 Held directly 17.9 17,000 39,531.2 7.29 Mutual funds 10.6 50,000 24,036.7 4.42 Retirement accounts 53.6 45,000 79,625.3 14.67 Other financial assets 27.0 10,000 22,340.2 4.13 Non-financial Assets: 325,214.8 60.0 Equity in primary home 68.1 107,000 134,683.5 24.83 Other residential real estate 13.5 100,000 38,282.6 7.05
Commercial real estate 8.2 72,500 23,123.2 4.25 Active businesses 10.9 100,000 102,971.6 18.98 Farms 0.59 127,772.4 2,582.3 0.48 Passive business investment 1.4 118,000 13,856.3 2.56
Other non-financial assets 14.4 10,000 9,715.4 1.79
TOTAL 542,163.1 Source: Author’s calculations from the Federal Reserve Board’s Survey of Consumer Finances 2007.
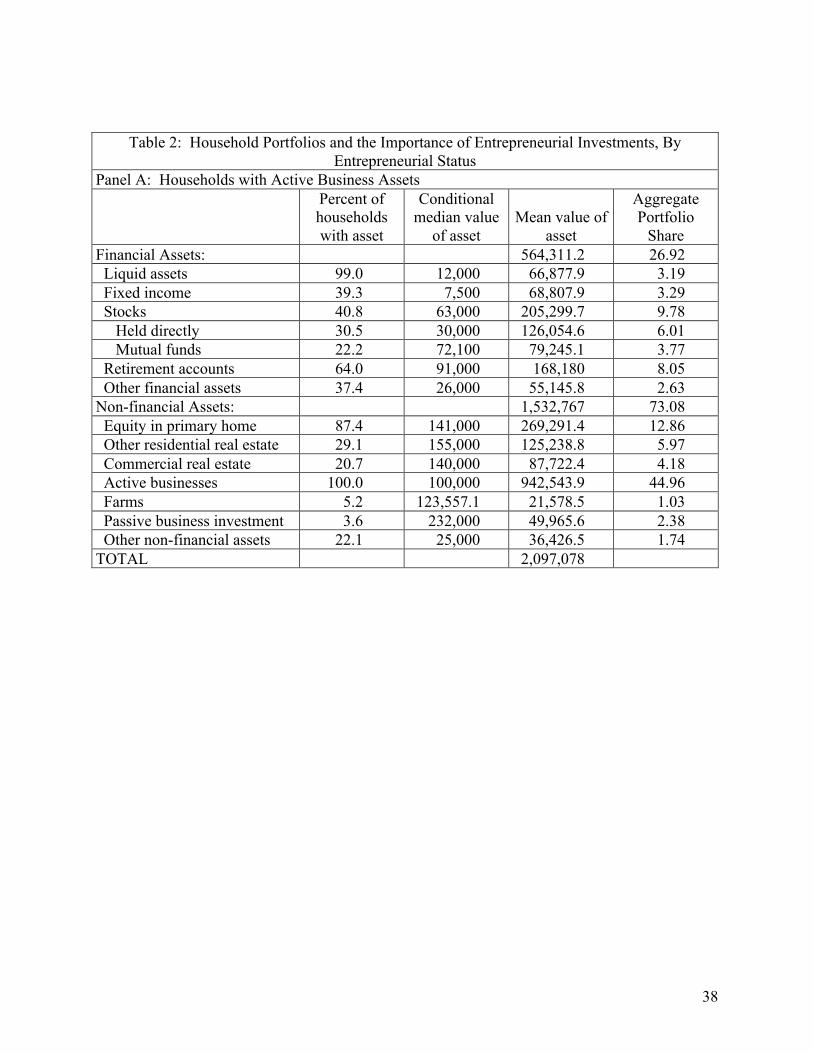
38
Table 2: Household Portfolios and the Importance of Entrepreneurial Investments, By Entrepreneurial Status
Panel A: Households with Active Business Assets Percent of
households with asset
Conditional median value
of asset
Mean value of
asset
Aggregate Portfolio
Share Financial Assets: 564,311.2 26.92 Liquid assets 99.0 12,000 66,877.9 3.19 Fixed income 39.3 7,500 68,807.9 3.29 Stocks 40.8 63,000 205,299.7 9.78 Held directly 30.5 30,000 126,054.6 6.01 Mutual funds 22.2 72,100 79,245.1 3.77 Retirement accounts 64.0 91,000 168,180 8.05 Other financial assets 37.4 26,000 55,145.8 2.63 Non-financial Assets: 1,532,767 73.08 Equity in primary home 87.4 141,000 269,291.4 12.86 Other residential real estate 29.1 155,000 125,238.8 5.97 Commercial real estate 20.7 140,000 87,722.4 4.18 Active businesses 100.0 100,000 942,543.9 44.96 Farms 5.2 123,557.1 21,578.5 1.03 Passive business investment 3.6 232,000 49,965.6 2.38 Other non-financial assets 22.1 25,000 36,426.5 1.74 TOTAL 2,097,078

39
Table 2: Household Portfolios and the Importance of Entrepreneurial Investments, By Entrepreneurial Status
Panel B: Households without Active Business Assets Percent of
households with asset
Conditional median value
of asset
Mean value
of asset
Aggregate Portfolio Share
Financial Assets: 174,345 49.56 Liquid assets 90.1 3,600 19,186.8 5.45 Fixed income 28.5 10,000 21,892.4 6.21 Stocks 21.6 24,000 46,184.8 13.14 Held directly 16.4 15,000 28,919.3 8.24 Mutual funds 9.2 50,000 17,265.6 4.90 Retirement accounts 52.3 41,000 68,764.3 19.56 Other financial assets 25.7 10,000 18,316.6 5.20 Non-financial Assets: 177,111.3 50.33 Equity in primary home 65.7 102,000 118,174.2 33.57 Other residential real estate 11.6 79,000 27,617.6 7.86 Commercial real estate 6.7 58,000 15,200.2 4.32 Active businesses N/A N/A N/A N/A Farms 0.03 873,042 252.4 0.072 Passive business investment
1.1 100,000 9,427.6 2.68
Other non-financial assets 13.5 8,000 6,439.3 1.83 TOTAL 351,456.3 Source: Author’s calculations from the Federal Reserve Board’s Survey of Consumer Finances 2007.

40
Table 3: Unrealized Capital Gains and Losses on Different Types of Assets Directly-Held
Equities Active Business
Assets Passive Business
Assets Percent of Households 17.9 10.9 1.4 Percent of Households with the asset who have:
A loss 19.3 13.9 9.9 Neither a loss or gain 12.6 7.0 15.3 A gain 68.1 79.1 74.8 Mean unrealized capital gain of households with the asset $57,980.0 $ 731,528.3 $655,247.9
Median unrealized capital gain of households with the asset $950.0 $45,000 $40,000.0
Mean unrealized gain or loss as a percentage of basis for households with the asset
61.9 12,358.3 9,583.7
Median unrealized gain or loss as a percentage of basis for households with the asset
10.4 233.3 100.0
Source: Author’s calculations from the Federal Reserve Board’s Survey of Consumer Finances 2007.

41
Table 4: Illustration of Taxation of Entrepreneurial Wages
Tax Rates Change in taxes created by paying an additional $100 in wages to the entrepreneur, but holding investment constant
Wages Capital Gains
Business Income
Period 1
Period 2
35 15 0 35 -15 35 15 35 0 -65*.15 = -9.75 15 15 0 15 -15 15 15 35 -20 -65*.15 = -9.75
Notes: The tax calculations assume that the business pays an additional $100 in wages to the entrepreneur in the first period, but the entrepreneur invests sufficient money to keep the investment constant (which is equal to $100*(1 - tb)). This additional paid-in capital increases the entrepreneur’s basis in the firm, which subsequent reduces the future capital gains tax liability. The calculations assume that the eventual sales price of the business does not depend on the wage payment.

42
Table 5: State-level Venture-Capital Backed Investment, 1969-2007 Dependent variable: Real Venture Capital Disbursements per Capita
Independent variable: (1) (2) State + Federal Capital Gains Tax Rate
-128.33* (31.33)
-347.87* (115.49)
State personal income per capita
0.000813* (0.000187)
0.000186* (0.0000158)
R&D Funding per capita 0.0865* (0.00785)
0.0719* (0.00614)
R&D Funding * imputed value dummy
-0.0709* (0.0126)
-0.0377* (0.0126)
State fixed effects? Yes Yes Year fixed effects? No Yes Number of observations 1938 1938
Notes: State-level panel data from 1969-2006. * denotes estimated coefficients that are statistically significant at the 99% confidence level. Tax rates are expressed as fractions; the mean total tax rate in the sample is 0.24. The mean venture-capital disbursement per capita is $23.8.

43
References
Auerbach, Alan J. 2007. “How to Tax Capital Gains,” Wall Street Journal, August 16, 2007. Auerbach, Alan J., Leonard E. Burman, and Jonathan M. Siegel. 2000. “Capital Gains Taxation
and Tax Avoidance: New Evidence from Panel Data,” in Does Atlas Shrug? The Economic Consequences of Taxing the Rich, edited by Joel Slemrod, Cambridge, MA: Harvard University Press, pp. 355-388.
Bankman, Joseph. 2004. “The Structure of Silicon Valley Start-Ups,” UCLA Law Review, vol.
41, iss. 7, pp. 1737-1768. Baumol, William J., Robert E. Litan, and Carl J. Schramm. 2007. Good Capitalism, Bad
Capitalism, and the Economics of Growth and Prosperity. New Haven, CT: Yale University Press.
Bitler, Marianne, Tobias J. Moskowitz, and Annette Vissing-Jorgensen. 2005. “Testing Agency
Theory with Entrepreneur Effort and Wealth,” Journal of Finance, vol. 60, no. 2, pp. 539-576.
Bucks, Brian K., Arthur B. Kennickell, and Kevin B. Moore. 2006. “Recent Changes in U.S.
Family Finances: Evidence from the 2001 and 2004 Survey of Consumer Finances.” Federal Reserve Bulletin.
Burman, Leonard E. 1999. The Labyrinth of Capital Gains Tax Policy: A Guide for the
Perplexed. Washington, D.C.: Brookings Institution Press. Burman, Leonard E. and Peter D. Ricoy. 1997. “Capital Gains and the People Who Realize
Them,” National Tax Journal, vol. 50, no. 3, pp. 427-451. Cavalcanti, Ricardo de O. and Andres Erosa. 2007. “A Theory of Capital Gains Taxation and
Business Turnover.” Economic Theory, vol. 32, pp. 477-496. Center for Venture Research. 2008. “The Angel Investor Market in 2007: Mixed Signs of
Growth.” www.unh.edu/cvr. Chari, V.V., Mikhail Golosov, and Aleh Tsyvinski. 2005. “Business Start-ups, the Lock-in
Effect, and Capital Gains Taxation.” Unpublished manuscript, Harvard University. Cullen, Julie Berry and Roger H. Gordon. 2007. “Taxes and entrepreneurial risk-taking: Theory
and evidence for the U.S.,” Journal of Public Economics, Volume 91, Issues 7-8, August 2007, Pages 1479-1505.

44
Desai, Mihir A. and William M. Gentry. 2004. “The Character and Determinants of Corporate Capital Gains,” in James M. Poterba, ed., Tax Policy and the Economy, volume 18, MIT Press, pp. 1-36.
Eichner, Matthew and Todd Sinai. 2000. “Capital Gains Realizations and Tax Rates: New
Evidence from Time Series,” National Tax Journal, vol. 53, no. 3, pt. 2, pp. 663-682. Gentry, William M. and R. Glenn Hubbard. 2003. “Tax Policy and Entry into
Entrepreneurship.” Unpublished manuscript, Williams College and Columbia University.
Gentry, William M. and R. Glenn Hubbard. 2004. “Entrepreneurship and Household Saving.”
Advances in Economic Analysis and Policy, vol. 4, issue 1, article 8. Available at: http://www.bepress.com/bejeap/advances/vol4/iss1/art8
Gompers, Paul A. and Josh Lerner. 1998. “What Drives Venture Capital Fundraising?,”
Brookings Papers on Economic Activity: Microeconomics, pp. 149-204. Guenter, David and Michael Willenborg. 1999. “Capital gains tax rates and the cost of capital
for small business: Evidence from the IPO market,” Journal of Financial Economics, September, pp. 385–408.
Henning, Steven L., Shaw, Wayne H. and Stock, Toby. 2000. “The Effect of Taxes on
Acquisition Price and Transaction Structure,” Journal of American Taxation Association, Vol. 22, Supplement.
Keuschnigg, Christian and Soren Bo Nielsen. 2004. “Taxation and Venture Capital Backed
Entrepreneurship,” International Tax and Public Finance, vol. 11, pp. 369-390. Morrissette, Stephen G. 2007. “A Profile of Angel Investors,” Journal of Private Equity, vol.
10, iss. 3, pp. 52-66. Poterba, James M. 1989. “Venture Capital and Capital Gains Taxation.” in Lawrence Summers,
ed., Tax Policy and the Economy, volume 3, MIT Press, pp. 47-67. Reynolds, Paul D. 2005. Entrepreneurship in the U.S.: 2004 Assessment. Eugenio Pino Family
Global Entrepreneurship Center, Florida International University. Van Osnabrugge, Mark and Robert J. Robinson. 2000. Angel Investing: Matching Start-Up
Funds with Start-Up Companies. San Francisco: Jossey-Bass. Wilson, Janette and Pearson Liddell. 2010. “Sales of Capital Assets Reported on Individual
Income Tax Returns, 2007.” Statistics of Income Bulletin, Internal Revenue Service, U.S. Government, Winter.

45
!"#$%&'()''*##%&#+,&'-.%,/.0".'12+%&3
!"
#$"
#%"
&"
$&"
#$"
#!"
'" $"
()*+),-.//01/-2-3)40,-567890 :187;/ <01)=09061-.778+61/ >1?0=-@)6.67).A-.//01/ B8+/)6C-D*+)1E
>1?0=-=0.A-0/1.10 F71)G0-H+/)60//0/ I.//)G0-H+/)60//-)6G0/19061 >1?0=-686J@)6.67).A-.//01/

46
!"!!
#!!$!!!"!!
%!!$!!!"!!
&!!$!!!"!!
'!!$!!!"!!
(!!$!!!"!!
)!!$!!!"!!
*!!$!!!"!!
+!!$!!!"!!
,!!$!!!"!!
#$!!!$!!!"!!
-./0.123445642728.9512:;<=>5
?6=<@4
A56.B5>5;623<<=0;64
C6D5B2E.;3;<.3F2344564
G=04.;H2I/0.6J
C6D5B2B53F2546365
K<6.L52M04.;54454
N344.L52M04.;5442.;L546>5;6
C6D5B2;=;OE.;3;<.3F2344564
!"#$%&'()''*&+,'-+.$&'/0'122&3
P53;2Q3F052=E2K44562KFF 2G=045D=F14 P53;2Q3F052=E2K44562I;6B5RB5;50B4
P53;2Q3F052=E2K44562S=;OI;6B5RB5;50B4
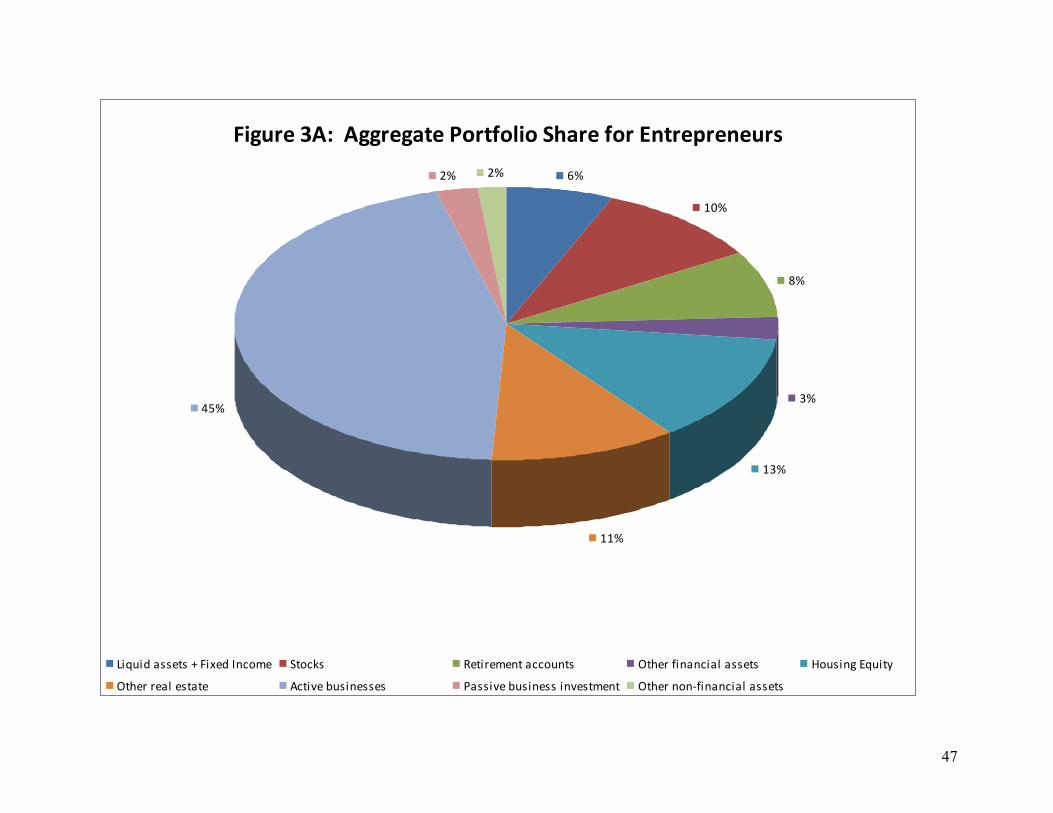
47
!"#$%&'()*'')##%&#+,&'-.%,/.0".'12+%&'/.%'34,%&5%&4&$%6!"
#$"
%"
&"
#&"
##"
'("
)" )"
*+,-+./011231/4/5+62./789:;2 <3:9=1 >23+?2;283/099:-831 @3A2?/B+8089+0C/011231 D:-1+8E/F,-+3G
@3A2?/?20C/213032 H93+I2/J-1+821121 K011+I2/J-1+8211/+8I213;283 @3A2?/8:8LB+8089+0C/011231
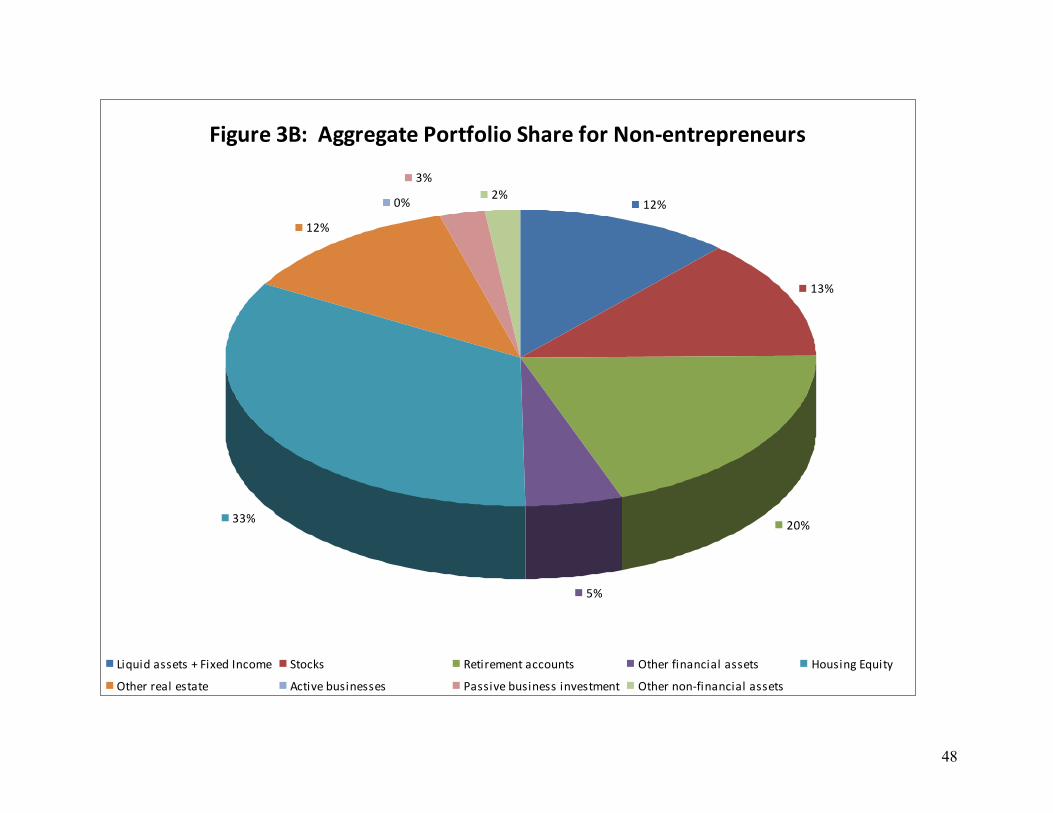
48
!"#$%&'()*''+##%&#,-&'./%-0/1"/'23,%&'0/%'4/56&5-%&7%&5&$%8
!"#
!$#
"%#
&#
$$#
!"#
%#
$#"#
'()*(+,-../0.,1,2(3/+,45678/ 9076:. ;/0(</8/50,-667*50. =0>/<,?(5-56(-@,-../0. A7*.(5B,C)*(0D
=0>/<,</-@,/.0-0/ E60(F/,G*.(5/../. H-..(F/,G*.(5/..,(5F/.08/50 =0>/<,575I?(5-56(-@,-../0.