101 ways that q is better than spss
TRANSCRIPT
101 ways that Q is BETTER than SPSS
EASY DATA MANIPULATION
STATISTICAL TESTING
WEIGHTING
FILTERS
BETTER UNDERSTANDING OF DATA
VARIABLE CREATION AND DATA MANIPULATION
TEXT DATA
CROSSTABS
REPORTING
TIME SERIES
DATA UPDATING
MULTIVARIATE ANALYSIS
LEARNING Q

101 ways that Q is BETTER than SPSS
EASY DATA MANIPULATION
101 ways that Q is BETTER than SPSS
All tables automatically update when input variables are modified5
Easy recoding of numeric variables6
Automated midpoint coding and quantification of all data in a project
7
Easily find data using Quick Search1
Drag and drop to merge data2
Easily compute Top 2 Box Scores and other NETs without any scripting3
Automated computation of top 2 box scores for all data in a project4
101 ways that Q is BETTER than SPSS
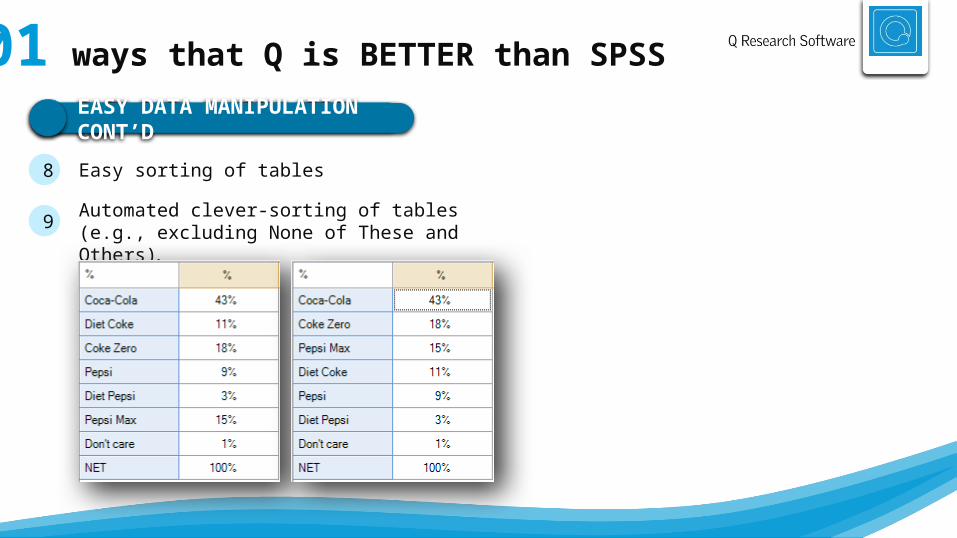
EASY DATA MANIPULATION CONT’D
101 ways that Q is BETTER than SPSS
Automated clever-sorting of tables (e.g., excluding None of These and Others).9
Easy sorting of tables8
101 ways that Q is BETTER than SPSS
STATISTICAL TESTING
101 ways that Q is BETTER than SPSS
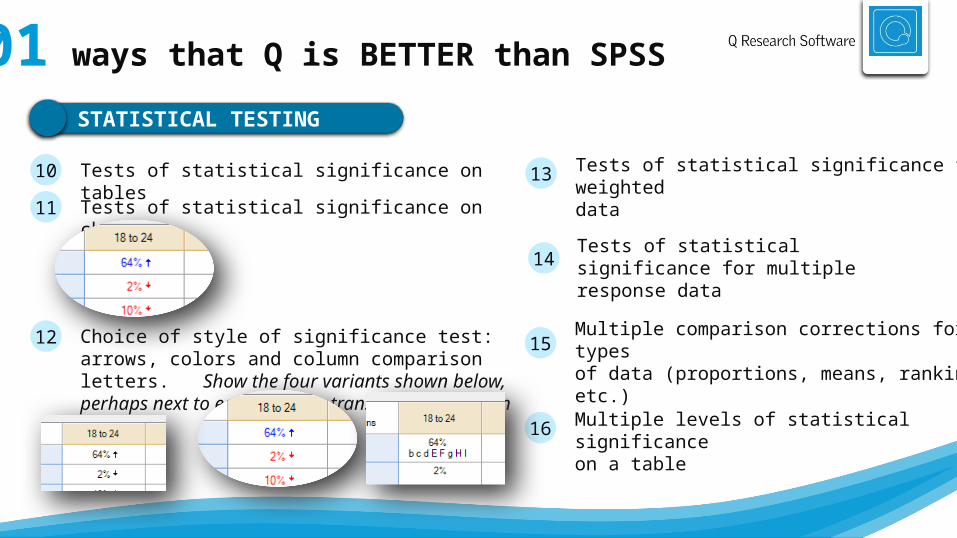
Tests of statistical significance on tables10
Tests of statistical significance on charts11
Tests of statistical significance for weighted data
13
Tests of statistical significance for multiple response data14
Multiple comparison corrections for all types of data (proportions, means, rankings, etc.)15
Multiple levels of statistical significance on a table
16
Choice of style of significance test: arrows, colors and column comparison letters. Show the four variants shown below, perhaps next to each other or transitioning between them.
12
101 ways that Q is BETTER than SPSS
STATISTICAL TESTING CONT’D
101 ways that Q is BETTER than SPSS
Advanced customization of automated statistical tests18
Tests of statistical significance for grids19
Automatic selection of statistical testing, from amongst dozens of different tests17
101 ways that Q is BETTER than SPSS
Target weighting20
Rim weighting21
Automatically compute weights within time periods22
WEIGHTING
101 ways that Q is BETTER than SPSS
Weights that gross up to the population, without invalidating the statistical tests
27
Weighted and unweighted counts on the same table
28Automatically compute weights for each wave of a study
24
Different weights for different tables25
Computation of effective sample size26
Automatically update weights when new data is imported23
101 ways that Q is BETTER than SPSS
FILTERS
101 ways that Q is BETTER than SPSS
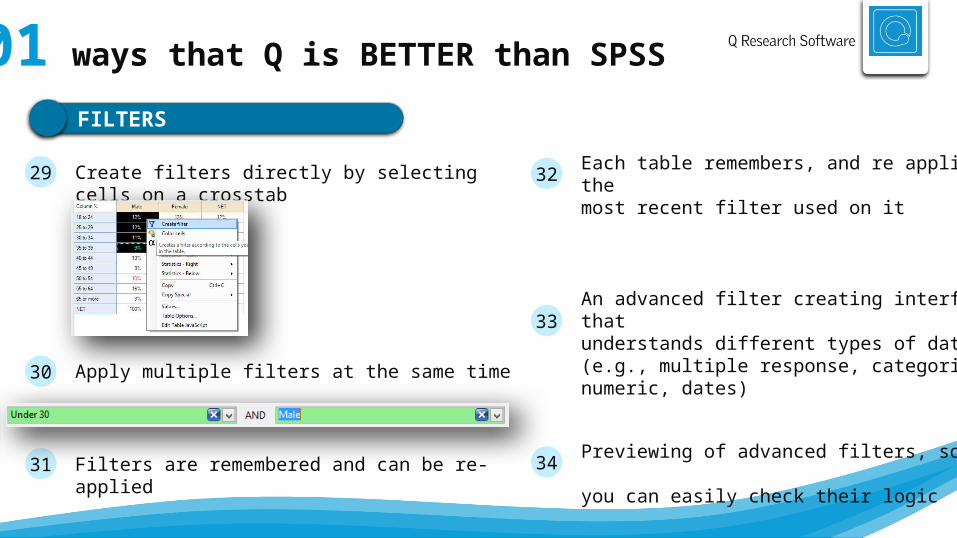
Create filters directly by selecting cells on a crosstab29
Apply multiple filters at the same time30
Filters are remembered and can be re-applied31
Each table remembers, and re applies, the most recent filter used on it32
An advanced filter creating interface that understands different types of data (e.g., multiple response, categorical, numeric, dates)
33
Previewing of advanced filters, so that you can easily check their logic34
101 ways that Q is BETTER than SPSS
BETTER UNDERSTANDING OF DATA
101 ways that Q is BETTER than SPSS
Automatically identifies multiple response sets when importing data
35
Automatic recognition of rating scales36
Automatic recognition of brand association grids37
Automatic recognition and tidying of the major data file sources (SurveyMonkey, SurveyGizmo, etc.)
38
Drag and drop data stacking39
Overlay multiple data files (e.g., household, transaction and occasion data)
40
101 ways that Q is BETTER than SPSS
VARIABLE CREATION & DATA MANIPULATION
101 ways that Q is BETTER than SPSS
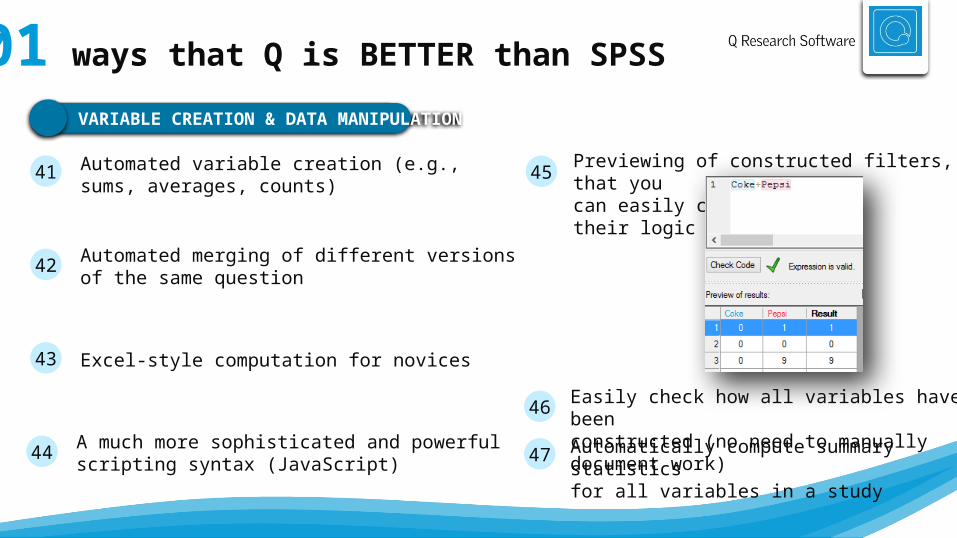
Automatically compute summary statistics for all variables in a study
47
Automated variable creation (e.g., sums, averages, counts)
41
Automated merging of different versions of the same question
42
Excel-style computation for novices43
A much more sophisticated and powerful scripting syntax (JavaScript)
44
Previewing of constructed filters, so that you can easily check their logic
45
Easily check how all variables have been constructed (no need to manually document work)
46
101 ways that Q is BETTER than SPSS
VARIABLE CREATION & DATA MANIPULATION CONT’D
101 ways that Q is BETTER than SPSS
Tools for checking data file quality50
Search and replace tools with wild cards for tidying labels and expressions
51
Online script library of useful automations52
Undoing of all data manipulations48
Tools for auditing projects49

101 ways that Q is BETTER than SPSS
TEXT DATA
101 ways that Q is BETTER than SPSS
Easy-to-use coding53
Sharing of code frames within and between projects54
Fast coding of spontaneous awareness data55
Back-coding56
101 ways that Q is BETTER than SPSS
CROSS TABS
101 ways that Q is BETTER than SPSS
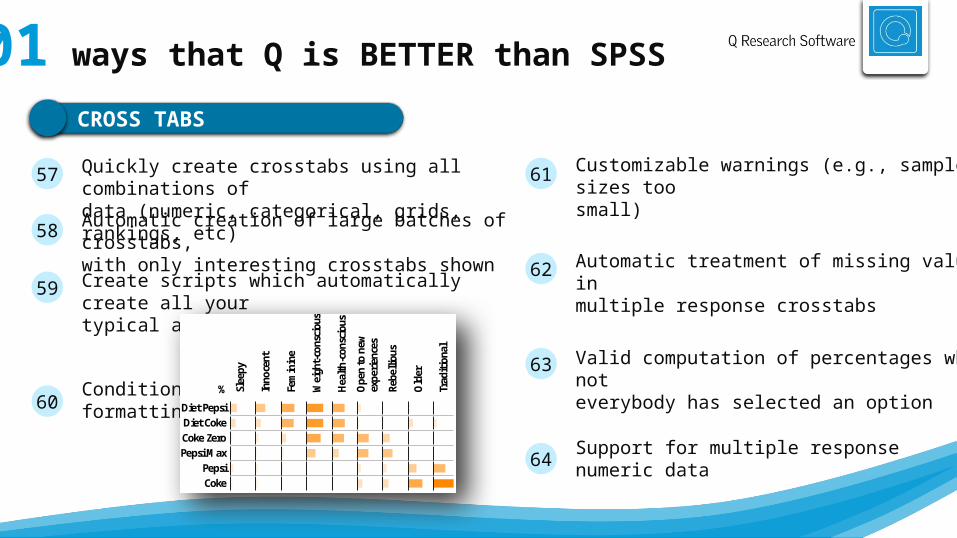
Quickly create crosstabs using all combinations of data (numeric, categorical, grids, rankings, etc)
57
Automatic creation of large batches of crosstabs, with only interesting crosstabs shown
58
Create scripts which automatically create all your typical analyses
59
Conditional formatting60
Customizable warnings (e.g., sample sizes too small)
61
Automatic treatment of missing values in multiple response crosstabs
62
Valid computation of percentages when not everybody has selected an option
63
Support for multiple response numeric data64
Slee
py
Inno
cent
Fem
inin
e
Wei
ght-
cons
ciou
s
Hea
lth-c
onsc
ious
Ope
n to
new
expe
rien
ces
Rebe
lliou
s
Old
er
Trad
ition
al
Diet PepsiDiet CokeCoke ZeroPepsi Max
PepsiCoke
%
101 ways that Q is BETTER than SPSS
REPORTING
101 ways that Q is BETTER than SPSS
Automated creation of a summary report69
Automated creating of banner tables with various types of data (e.g., numeric, categorical, grids)
70
Online dashboards that can be created in minutes without any involvement from IT71
Export batches of tables to PowerPoint72
Export charts and tables to Excel73
Export charts and tables to Word74
Turn any table into a plot and back again65
Use templates to ensure consistent and quick formatting66
Construct a report including tables, charts and commentary67
Customize the names of statistics68

101 ways that Q is BETTER than SPSS
TIME SERIES
101 ways that Q is BETTER than SPSS
Simple and advanced moving averages (e.g., polynomial smoothing)
75
Special-purpose charts for tracking research76
Special-purpose data types (e.g., allowing easy aggregation, moving windows)
77
101 ways that Q is BETTER than SPSS
DATA UPDATING
101 ways that Q is BETTER than SPSS
When you get a revised data file Q automatically checks to see that all the data definitions are consistent (e.g., variable names, value labels)
78
Automatically reapply manual edits to new data files (e.g., deleted respondents, changes of values)
79
Automatic updating of all tables and charts with new data80
Automatically update PowerPoint Presentations with new data
81
Easy-to-understand alerts for broken data82
101 ways that Q is BETTER than SPSS
MULTIVARIATE ANALYSIS
101 ways that Q is BETTER than SPSS
Advanced choice analysis (e.g., best-worst conjoint, hybrid designs)90
TURF91
Trees with multiple dependent variables92
Latent class analysis for segmentation: automatically deals different data types
84
Automatic removal of ‘yeah-saying’ biases from ratings when segmenting85
Max-Diff Analysis86
Anchored Max-Diff Analysis87
Random parameters logit89Latent class analysis for segmentation: automatically deals with missing values
83
101 ways that Q is BETTER than SPSS
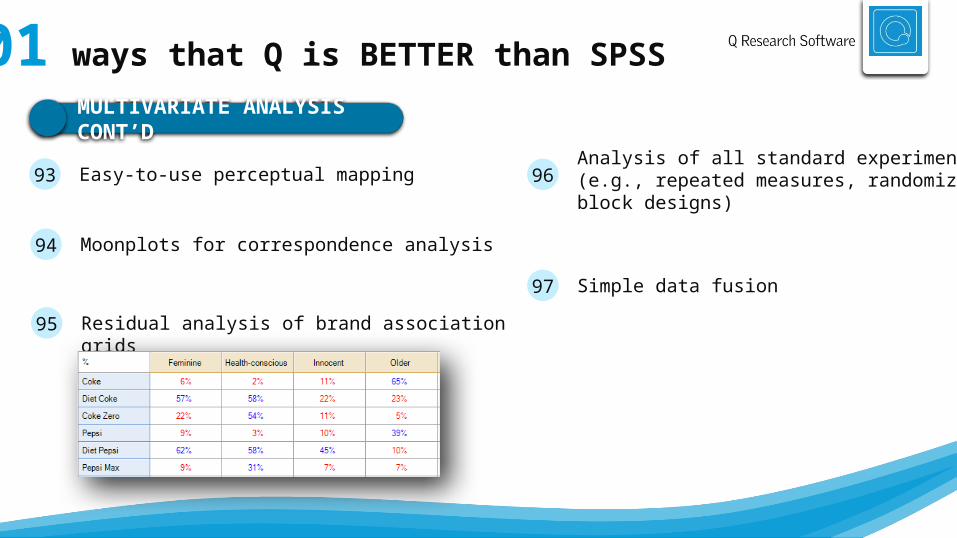
MULTIVARIATE ANALYSIS CONT’D
101 ways that Q is BETTER than SPSS
Moonplots for correspondence analysis94
Residual analysis of brand association grids95
Analysis of all standard experiments (e.g., repeated measures, randomized, block designs)
96
Simple data fusion97
Easy-to-use perceptual mapping93
101 ways that Q is BETTER than SPSS
LEARNING Q
101 ways that Q is BETTER than SPSS
Easy license management: a web page showing all your licenses, users and records
98
More than 100 Online training modules which check your work
99
Complimentary training sessions using your own data100
No obligation and no hassle one month trials101