100-rg-pnc-00000-900007 needs report · pdf file100-rg-pnc-00000-900008 printed 07/09/2010...
TRANSCRIPT

Hard copy available in
Needs ReportDoc Ref: 8.3
Appendix A - Regulatory Impact ReportAPFP Regulations 2009: Regulation 5(2)(q)
Box 60 Folder A January 2013
Appe
ndix
A -
Regu
lato
ry Im
pact
Rep
ort
Thames Tideway Tunnel Thames Water Utilities Limited
Application for Development ConsentApplication Reference Number: WWO10001

This page is intentionally blank
100-RG-PNC-00000-900008 Printed 07/09/2010
THAMES TUNNEL
NEEDS REPORT
APPENDIX A
LIST OF CONTENTS
A1 Ministerial Correspondence
A1.1 Defra Letter to Thames Water, CEO; Dated 17th April 2007
A1.2 Written Ministerial Statement– Sewer Overflows (River Thames) dated 7th September 2010
A2 Defra Regulatory Impact Assessment – March 2007

Appendix A
A1 – Ministerial Correspondence
A1.1 Defra Letter to Thames Water dated 17th March 2007
A1.2 Written Ministerial Statement – Sewer Overflows (River Thames) dated 7th September 2010
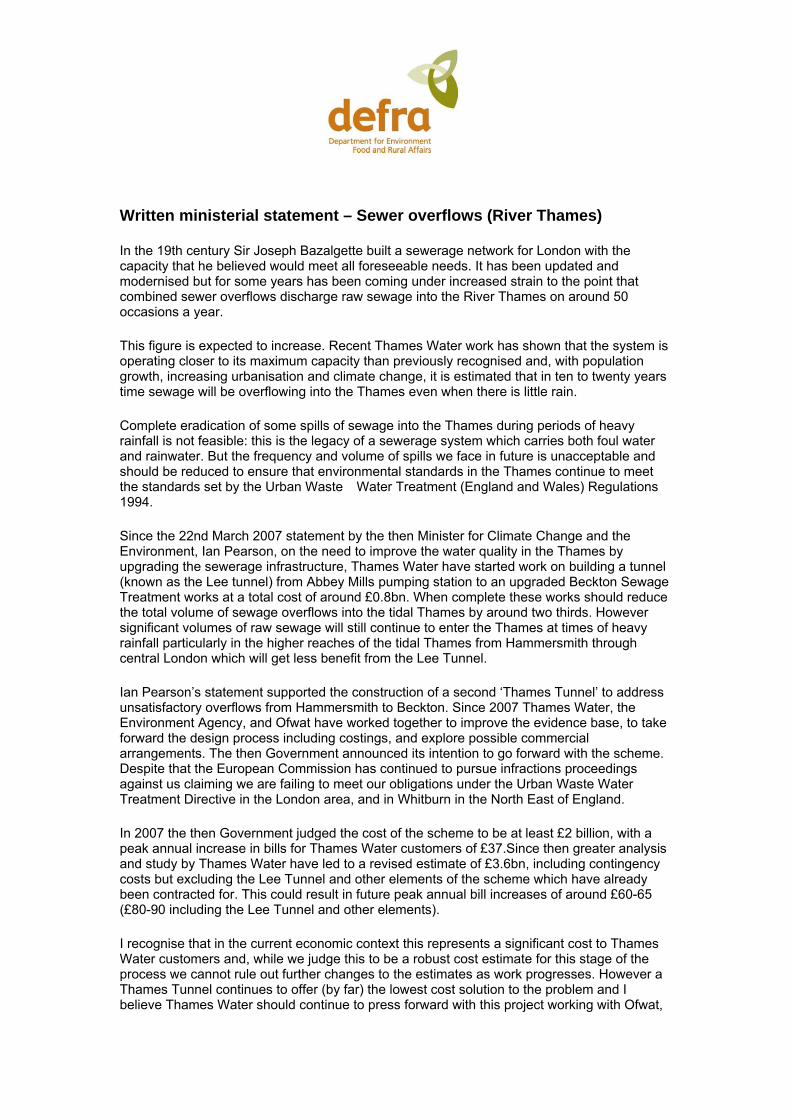
Written ministerial statement – Sewer overflows (River Thames)
In the 19th century Sir Joseph Bazalgette built a sewerage network for London with the capacity that he believed would meet all foreseeable needs. It has been updated and modernised but for some years has been coming under increased strain to the point that combined sewer overflows discharge raw sewage into the River Thames on around 50 occasions a year.
This figure is expected to increase. Recent Thames Water work has shown that the system is operating closer to its maximum capacity than previously recognised and, with population growth, increasing urbanisation and climate change, it is estimated that in ten to twenty years time sewage will be overflowing into the Thames even when there is little rain.
Complete eradication of some spills of sewage into the Thames during periods of heavy rainfall is not feasible: this is the legacy of a sewerage system which carries both foul water and rainwater. But the frequency and volume of spills we face in future is unacceptable and should be reduced to ensure that environmental standards in the Thames continue to meet the standards set by the Urban Waste �Water Treatment (England and Wales) Regulations 1994.
Since the 22nd March 2007 statement by the then Minister for Climate Change and the Environment, Ian Pearson, on the need to improve the water quality in the Thames by upgrading the sewerage infrastructure, Thames Water have started work on building a tunnel (known as the Lee tunnel) from Abbey Mills pumping station to an upgraded Beckton Sewage Treatment works at a total cost of around £0.8bn. When complete these works should reduce the total volume of sewage overflows into the tidal Thames by around two thirds. However significant volumes of raw sewage will still continue to enter the Thames at times of heavy rainfall particularly in the higher reaches of the tidal Thames from Hammersmith through central London which will get less benefit from the Lee Tunnel.
Ian Pearson’s statement supported the construction of a second ‘Thames Tunnel’ to address unsatisfactory overflows from Hammersmith to Beckton. Since 2007 Thames Water, the Environment Agency, and Ofwat have worked together to improve the evidence base, to take forward the design process including costings, and explore possible commercial arrangements. The then Government announced its intention to go forward with the scheme. Despite that the European Commission has continued to pursue infractions proceedings against us claiming we are failing to meet our obligations under the Urban Waste Water Treatment Directive in the London area, and in Whitburn in the North East of England.
In 2007 the then Government judged the cost of the scheme to be at least £2 billion, with a peak annual increase in bills for Thames Water customers of £37.Since then greater analysis and study by Thames Water have led to a revised estimate of £3.6bn, including contingency costs but excluding the Lee Tunnel and other elements of the scheme which have already been contracted for. This could result in future peak annual bill increases of around £60-65 (£80-90 including the Lee Tunnel and other elements).
I recognise that in the current economic context this represents a significant cost to Thames Water customers and, while we judge this to be a robust cost estimate for this stage of the process we cannot rule out further changes to the estimates as work progresses. However a Thames Tunnel continues to offer (by far) the lowest cost solution to the problem and I believe Thames Water should continue to press forward with this project working with Ofwat,
the Environment Agency and Defra on the regulatory, commercial and planning processes. Thames Water intend to consult on options for the route of the Tunnel shortly. We with Ofwat will continue to ensure that the costs are scrutinised and reviewed so that I can be assured before Thames Water sign a construction contract that the final proposal represents proper value for money. As we go through this process I intend to update the 2007 Impact Assessment for the Tunnel and place it on the Defra website.
I am also minded that development consent for the project should be dealt with under the regime for nationally significant infrastructure projects established by the Planning Act 2008. I consider that this project, with its unique scale and complexity, is of national significance, and therefore appropriate for this regime.
I will be considering the appropriate mechanism under the 2008 Act to ensure the Thames Tunnel project is considered under this national level regime and intend to include consideration of the Thames Tunnel in the draft National Policy Statement for waste water. I plan to lay this before both Houses of Parliament later this autumn.
Page published: Tuesday 7 September 2010.

Appendix A
A2 – Defra Regulatory Impact Assessment – March 2007

www.defra.gov.uk
www.defra.gov.uk
Regulatory impact assessment - sewage collection and treatment for London March 2007

Department for Environment, Food and Rural Affairs Nobel House 17 Smith Square London SW1P 3JR Tel: 020 7238 6000 Website: www.defra.gov.uk © Crown copyright 2007 Copyright in the typographical arrangement and design rests with the Crown. This publication (excluding the royal arms and departmental logos) may be re-used free of charge in any format or medium provided that it is re-used accurately and not used in a misleading context. The material must be acknowledged as crown copyright and the title of the publication specified. Information about this publication and further copies are available from: Water Quality Division Room 205 Defra 55 Whitehall London SW1A 2EY Email: [email protected]: 020 7082 8286 This document is also available on the Defra website. http://www.defra.gov.uk/environment/water/quality/sewage/overflows.htm Published by the Department for Environment, Food and Rural Affairs
1
1. TITLE Regulatory Impact Assessment - sewage collection and treatment for London: overflow discharges from the Beckton and Crossness sewerage system to the tidal River Thames and River Lee 2. PURPOSE AND INTENDED EFFECT OF MEASURES (i) Objective
2.1. To reduce the number of overflows and their environmental impact from the sewers and treatment systems serving London, and in particular to limit pollution from the sewers and treatment systems connected to Beckton and Crossness sewage treatment works (STWs). The measures are to improve the environmental quality of the tidal reaches of the River Thames and River Lee by limiting the volume, frequency and adverse environmental pollution of discharges from the sewerage system (sewers and treatment works) of untreated sewage (domestic and industrial waste water mixed with rainwater run-off) following wet weather by overflows.
2.2. To ensure that the London agglomeration and the Beckton and
Crossness sewerage systems comply with Directive 91/271/EEC on Urban Waste Water Treatment (UWWTD). This Directive was transposed in the Urban Waste Water Treatment (England and Wales) Regulations in 1994 (Statutory Instrument 2841). Government guidance on implementation of the requirements of the Regulations was published in July 1997.
2.3. The objective of the UWWTD is to protect the environment from the
adverse effects of waste water discharges. More information regarding the UWWTD can be found at:
http://www.defra.gov.uk/environment/water/quality/uwwtd/default.htm (ii) Background
2.4. Responsibility for sewerage infrastructure lies with Thames Water PLC who provide sewerage services for thirteen million customers (of which five million are bill payers), including those in London, and who own and operate the London collecting systems and STWs. The Environment Agency (EA) is responsible for regulating discharges into controlled waters1 through the issuing of discharge consents. The Water Services Regulation Authority (Ofwat), the economic regulator is responsible for making any changes to price limits (reflected in
1 tidal and coastal waters which extend up to 3 nautical miles seaward; river or watercourse; lakes or pond; and ground waters
2
customers’ bills) necessary to ensure that water companies can finance their functions.
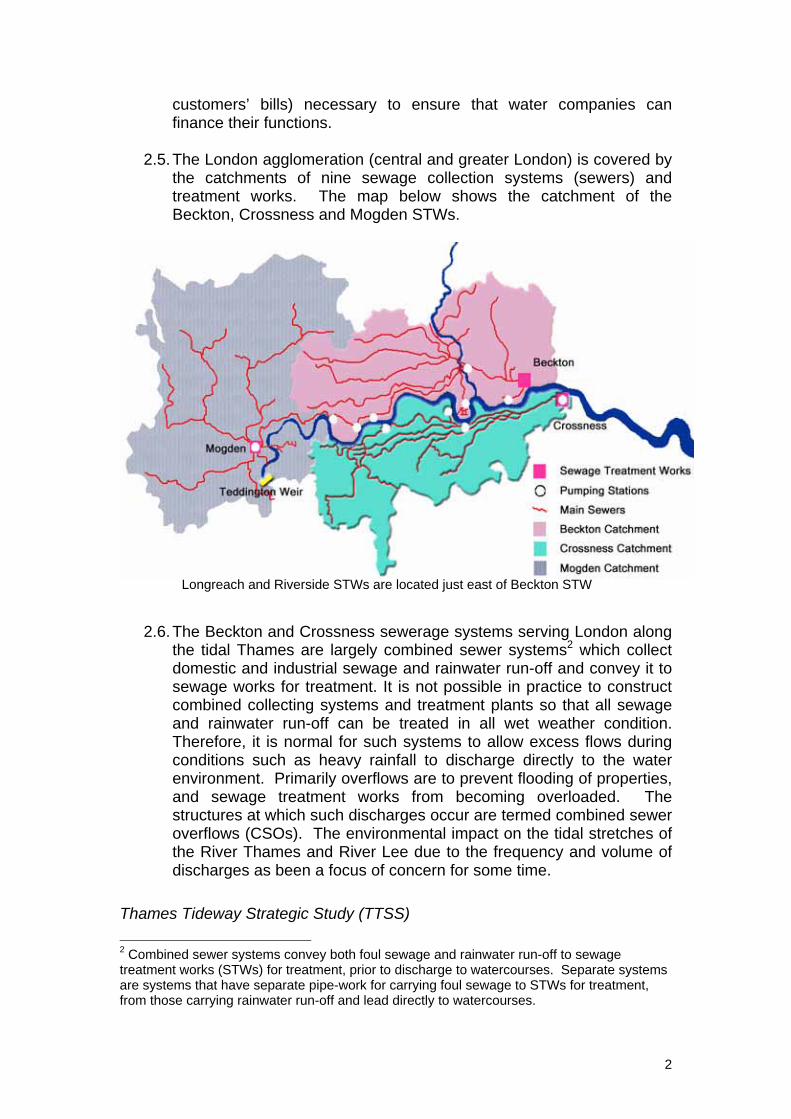
2.5. The London agglomeration (central and greater London) is covered by
the catchments of nine sewage collection systems (sewers) and treatment works. The map below shows the catchment of the Beckton, Crossness and Mogden STWs.
2.6. The Beckton and Crossness sewerage systems serving London along the tidal Thames are largely combined sewer systems2 which collect domestic and industrial sewage and rainwater run-off and convey it to sewage works for treatment. It is not possible in practice to construct combined collecting systems and treatment plants so that all sewage and rainwater run-off can be treated in all wet weather condition. Therefore, it is normal for such systems to allow excess flows during conditions such as heavy rainfall to discharge directly to the water environment. Primarily overflows are to prevent flooding of properties, and sewage treatment works from becoming overloaded. The structures at which such discharges occur are termed combined sewer overflows (CSOs). The environmental impact on the tidal stretches of the River Thames and River Lee due to the frequency and volume of discharges as been a focus of concern for some time.
Thames Tideway Strategic Study (TTSS)
2 Combined sewer systems convey both foul sewage and rainwater run-off to sewage treatment works (STWs) for treatment, prior to discharge to watercourses. Separate systems are systems that have separate pipe-work for carrying foul sewage to STWs for treatment, from those carrying rainwater run-off and lead directly to watercourses.
Longreach and Riverside STWs are located just east of Beckton STW
3
2.7. In 2000, the TTSS (members: Thames Water (TW), the EA, the
Department for the Environment, Transport and the Regions (now Defra), and the Greater London Authority (GLA), plus the (then) Office of Water Services (Ofwat) as an observer, meeting under independent chairmanship) was set up to clarify the situation on sewer overflow discharges to the tidal Thames, and make recommendations to Government. The main report of this study was published in February 2005 with a supplementary report published in November 20053.
2.8. The TTSS estimated that some of the overflows from the sewerage
systems to the Thames and Lee discharge up to 50-60 times per year, and that on average 32 million cubic metres of untreated sewage are discharged each year from CSOs of the Beckton and Crossness collecting systems, and 20 million cubic metres from STW storm tanks (Crossness and Mogden). The adverse impacts associated with these discharges included harm to the ecology of the Tideway (eg fish kills), aesthetic pollution (sewage-derived litter) and increased health risks for recreational water users (eg rowers, canoeists). Environmental objectives were developed for each of these impacts so that the performance of the options for improvement could be assessed against them.
2.9. The TTSS identified and assessed a number of possible options for
delivering improvements (see below), and expressed a preference for a solution entailing the construction of a 34 km tunnel following the course of the Thames between Hammersmith in west London and Crossness STW. It was considered that overflow discharges from 36 CSOs (spread along the length of the tidal Thames, and including two (Abbey Mills Pumping Station and Wick Lane) which spill to the tidal River Lee) that the EA assessed as being “unsatisfactory”4 should be intercepted and flows transferred for secondary treatment5 (up to the capacity of the proposed upgrade) or enhanced primary treatment at Crossness STW. Such a scheme would achieve the environmental objectives developed by the EA, and was considered feasible by the TTSS. At that time the estimated cost of the solution was £1.7 billion, and it was considered that the scheme could be completed by 2020.
2.10. During 2004, based on information provided by the TTSS
regarding the capacity and performance of Beckton, Crossness, Mogden, and Riverside STWs, Defra, on advice from the Environment Agency, concluded that these STWs needed improvement. The
3 The Government requested further work on the interceptor tunnel proposal contained in the TTSS February 2005 report. This additional work was to include consideration of other measures that may be additional or alternatives. Also to be considered were smaller scale measures and those that could bring earlier improvements on CSO discharges. This work was reported by TTSS in its Supplementary Report to Government in December 2005. 4 unsatisfactory means overflows which are operating frequently (over 12 times per year), or infrequently, but causing adverse environmental impacts. 5 Secondary (biological) treatment is the normal standard. It follows preliminary eg screening, settlement in storm tanks, and primary which involves further settlement of suspended solids.
4
primary objectives for performance improvements are to reduce overflows and the associated polluting load from the storm sewage storage (which provide a lower standard of treatment than secondary treatment6) at Crossness and Mogden, and to protect fish life in the Thames. Due account of these conclusions was taken in the guidance from the Secretary of State to Ofwat on the 2004 periodic review of price limits. As a result investment was included in TW programme for 2005-2010 for significant improvements at these works. As the improvements are not expected to be completed until 2012 or 2014, TW will apply for further funding in their 2010-2015 programme. These upgrades are to reduce the frequency and volume of sewage discharged from storm tanks at Crossness and Mogden, and to improve the quality of the treated effluent at Beckton and Riverside. This view was reached on the basis of the findings of the TTSS, and related to the performance of these treatment works at that time. 7
2.11. These measures are expected to achieve a significant reduction
in storm tank discharges from these works, and greater protection of the environment of the Thames. Modelling showed that when these upgrades are in place, compliance with the target dissolved oxygen levels to protect fish species in the Thames is expected to be greatly improved. Other in-river measures (oxygenation vessels and fixed plants, litter skimmer boats, and operating agreements) will continue for now.
Jacobs Babtie Report
2.12. Ofwat commissioned a report by Jacobs Babtie to review the work and reports of the TTSS. This was published in February 20068. It proposed another option for dealing with the Tideway CSO discharges involving a 9km tunnel to intercept overflow discharges in west London (Hammersmith to Heathwall) and screening plant to reduce sewage-derived litter and faecal matter discharged to the Thames, and an enhanced primary treatment plant at Abbey Mills Pumping Station in east London. These measures were in addition to the aforementioned STW upgrades, litter skimmer boats, and reoxygenation measures (bubblers and peroxide dosing plants). It was also suggested that sustainable urban drainage systems (SUDS) to retain surface run-off, either in open tanks and ponds or in covered storage which allows slow drainage, should be implemented over the medium to long term where appropriate in London’s suburban fringes.
7 As part of the work undertaken by TW from August- December 2006, a review of the STW upgrades was undertaken. Following the review, a revised set of proposals for STW has been proposed. These revised proposals await formal approval by EA and Ofwat. Under the proposals the STW upgrades will be completed by 2014. 8 More information regarding the Jacobs Babtie review can be found at http://www.ofwat.gov.uk/aptrix/ofwat/publish.nsf/Content/thamestideway_report_jacobs_babti
5
At that time the estimated costs were £895 million for the tunnel, screening plant and treatment plant at Abbey Mills. It was estimated that SUDS to control flows for 10% of the suburbs could cost £375 million. The key conclusion of the study was a modification of the TTSS objectives. The modifications suggested a primary and secondary application of the target dissolved oxygen levels. This alternative objective was to establish target dissolved oxygen levels to firstly manage fish kill issues, and secondly to reflect ecological sustainability issues. Jacobs Babtie recommendation was to apply the dissolved oxygen standard that addressed ecological sustainability only upstream of London Bridge. In summary, as Jacobs Babtie didn’t fully agree with the TTSS objectives, and considered their proposal would provide lesser but still adequate benefits at lower cost.
Working Group on Thames Tideway and 2012 Olympic Games
2.13. The reports and options were considered by a working group set up by Defra in December 2005. The work of this group was initially to consider whether a partial solution, coherent with the approach to the wider TT problem, could be delivered in time to protect the 2012 Olympic and Paralympic Games against the risk of significant aesthetic pollution from CSOs. Members of the group included the organisations involved in the TTSS and the London Thames Gateway Development Corporation, British Waterways, the Olympic Development Authority, and several other Government departments.
2.14. This work led to the Minister of State for Climate Change and
Environment (MSCCE) writing on 27 July 2006 to ask TW to provide (by 31 December 2006) a detailed assessment of and cost information on two options to intercept overflow discharges and take them for treatment in East London. As part of this assessment, the Minister asked TW to consider whether a partial solution, to protect the Olympic Park, could be delivered by 2012.
Thames Tideway Advisory Group (TTAG)
2.15. EA, Ofwat and other stakeholders (Consumer Council for Water
(CCWater) (from July 2006), London Thames Gateway Development Corporation, and other Government departments) were involved in the development of the two options by way of the, Defra led, Thames Tideway Advisory Group (TTAG) which, together with a separate Olympic Measures Group, replaced the Working Group on Thames Tideway and the 2012 Olympic Games. The TTAG provided a focal point for progress reports, input to and comment on the work being carried out by TW. The terms of reference and membership of this group are at Annex 3.
6
2.16. Thames Water submitted the results of this detailed assessment to Ministers on 29 December 20069. This was in the form of a summary report and a number of associated detailed working group reports. In addition to the TW reports further information has been provided by various parties to inform this Regulatory Impact Assessment (RIA).
(iii) Rationale for Government Intervention (a) Impact of CSO discharges on tidal Thames and River Lee
2.17. The TTSS estimated the annual average volume of CSO discharges from the Beckton and Crossness collection systems into the tidal Thames and River Lee to be 32 million cubic metres, and that some overflows operated on average once a week. It should be noted that impact the Abbey Mills discharge comprises around 50% of the total volume of discharges and discharges into the River Lee, which is a small river particularly when compared to the Thames. It should also be noted that the area around the River Lee is likely to be more highly used in the future eg through the Thames Gateway development.
2.18. The TTSS considered that the large volume of discharges from
CSOs, which contain sewage solids and litter, create significant aesthetic impacts in the river, and increase the health risk for recreational users. The discharges also reduce the dissolved oxygen levels in the river, which can cause fish kills. It was considered that some of the aesthetic impacts were in sensitive parts of the river where there is greater public access and activity, for example the Embankment, Greenwich and the Thames Barrier. This brings in the question of the acceptability of visible sewage eg faecal matter and slicks, in the tidal Thames10. It should also be noted that the River Lee is a small watercourse. It has been estimated that the Abbey Mills storm discharge into the River Lee accounts for around 50% of the total volume of CSO discharges from the Beckton and Crossness sewerage catchments.
2.19. During the TTSS the EA’s assessment based on modelling,
observations, and a few public complaints, was that 36 of the 57 CSOs discharging to the tidal Thames or tidal River Lee from the collecting systems connected to Beckton and Crossness STWs are “unsatisfactory”. The relevant criteria for this assessment are that during wet weather conditions these overflows:
(i) cause significant visual or aesthetic impact due to solids, fungus and have a history of justified public complaints;
9 Thames Water (2006), Thames Tideway Tunnel and Treatment – Option Development, Summary Report, December 2006. 10 TTSS(2005), Steering Group Report. Refer section 0.4, Existing Situation.
7
(ii) cause a breach of water quality standards (EQS) and other EC Directives.
2.20. The EA considered that 25 overflows operate frequently and
have an adverse environmental impact, and a further 11 do not operate frequently but still have an adverse environmental impact. These overflows are spread along the length of the tidal Thames (from Chiswick to Charlton) and two (including Abbey Mills Pumping Station) discharges to the tidal River Lee.
(b) Requirements from the Urban Waste Water Treatment Directive, Regulations, and associated Guidance
2.21. The UWWTD was transposed into national law by the 1994 UWWT Regulations (see 2.2 above) for which associated Government guidance11 for England and Wales was produced in July 1997. The transposing Regulations impose a range of duties on water undertakers, the EA and Secretary of State for the purposes of ensuring that the requirements of the Urban Waste Water Treatment Directive are met.
2.22. The objective of the Directive is to protect the environment from
the adverse effects of waste water discharges. In terms of the tidal Thames and River Lee, compliance with the Directive and Regulations requires that sewage (domestic, industrial and rainwater run-off) is collected and conveyed to secondary treatment, overflows are reduced and measures taken to limit pollution of the tidal Thames and river Lee from CSOs/ storm water overflows. The relevant specific requirements for collecting systems (sewers) are set out in Article 3 and Annex 1A and Footnote 1 of the Directive, and for STWs in Articles 4 and 10, and Annex 1B.
2.23. The key general points from these requirements are that:
a) urban waste water (domestic and industrial sewage and rainwater run-off) should be collected and taken for treatment12 before it is discharged; b) the design, construction and maintenance of collecting systems is undertaken in accordance with best technical knowledge not entailing excessive costs. Part of this consideration concerns the limitation of pollution of receiving waters from storm water overflows;
11 The Government led a working group in the mid-1990s to produce general guidance in July 1997 to provide a framework on how the Regulations are to be applied. 12 The Directive requires secondary treatment as a minimum standard.
8
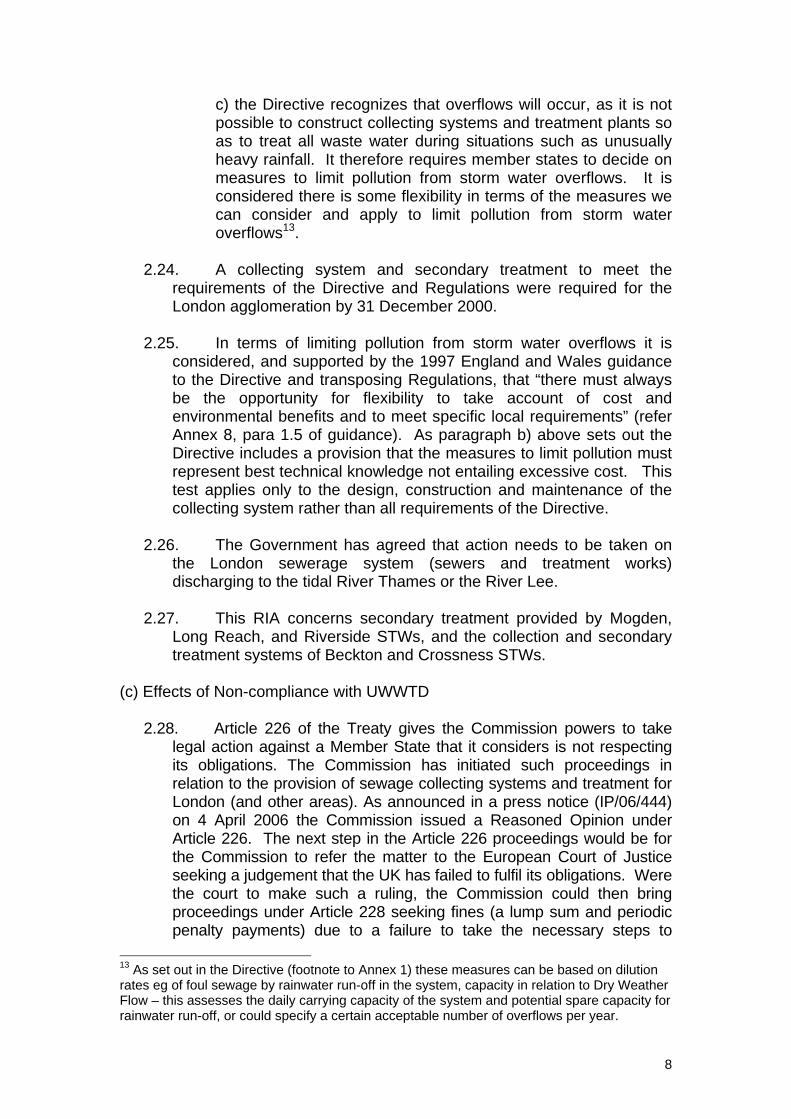
c) the Directive recognizes that overflows will occur, as it is not possible to construct collecting systems and treatment plants so as to treat all waste water during situations such as unusually heavy rainfall. It therefore requires member states to decide on measures to limit pollution from storm water overflows. It is considered there is some flexibility in terms of the measures we can consider and apply to limit pollution from storm water overflows13.
2.24. A collecting system and secondary treatment to meet the
requirements of the Directive and Regulations were required for the London agglomeration by 31 December 2000.
2.25. In terms of limiting pollution from storm water overflows it is
considered, and supported by the 1997 England and Wales guidance to the Directive and transposing Regulations, that “there must always be the opportunity for flexibility to take account of cost and environmental benefits and to meet specific local requirements” (refer Annex 8, para 1.5 of guidance). As paragraph b) above sets out the Directive includes a provision that the measures to limit pollution must represent best technical knowledge not entailing excessive cost. This test applies only to the design, construction and maintenance of the collecting system rather than all requirements of the Directive.
2.26. The Government has agreed that action needs to be taken on
the London sewerage system (sewers and treatment works) discharging to the tidal River Thames or the River Lee.
2.27. This RIA concerns secondary treatment provided by Mogden,
Long Reach, and Riverside STWs, and the collection and secondary treatment systems of Beckton and Crossness STWs.
(c) Effects of Non-compliance with UWWTD
2.28. Article 226 of the Treaty gives the Commission powers to take legal action against a Member State that it considers is not respecting its obligations. The Commission has initiated such proceedings in relation to the provision of sewage collecting systems and treatment for London (and other areas). As announced in a press notice (IP/06/444) on 4 April 2006 the Commission issued a Reasoned Opinion under Article 226. The next step in the Article 226 proceedings would be for the Commission to refer the matter to the European Court of Justice seeking a judgement that the UK has failed to fulfil its obligations. Were the court to make such a ruling, the Commission could then bring proceedings under Article 228 seeking fines (a lump sum and periodic penalty payments) due to a failure to take the necessary steps to
13 As set out in the Directive (footnote to Annex 1) these measures can be based on dilution rates eg of foul sewage by rainwater run-off in the system, capacity in relation to Dry Weather Flow – this assesses the daily carrying capacity of the system and potential spare capacity for rainwater run-off, or could specify a certain acceptable number of overflows per year.

9
comply with the judgment. Periodic penalty payments would continue to be due until the judgment had been fully complied with. In this case, that would mean completion of the works needed to make the sewage facilities compliant.
2.29. It is not possible to make a reasonable estimate of the size of
any fines that might be imposed in this case. However, previous cases do suggest that fines levied by the Commission will be significant, as the sole purpose is to ensure that member states comply. To this end, the level of the fine will be scaled upwards, based on the Member State’s ability to pay, to a point where it is no longer economically viable to anything other than implement the legislation. The UK has a good track record of avoiding infractions and fines through early resolution of issues and successful implementation.
(d) 2012 London Olympics
2.30. The Abbey Mills Pumping Station, situated on the Channelsea Creek, a tributary of the River Lee, about 1km downstream of the Olympic Park, is the source of around half of the 32 million cubic metres of untreated sewage estimated to be discharged per year from London’s CSOs in an average year. Modelling work set out in the TTSS (2005b) report indicated a 100% probability of a discharge from Abbey Mills occurring during June to October in any given year and 99.5% during July and August, with potentially significant amounts of screened sewage material from the discharges being carried by the tide into the Olympic Park during the Games if no measures are taken. These percentages are modelled and therefore only a guide. They also do not assess the volume and potential environmental impact of any such discharges. (The Olympic Games run from 27 July – 12 August and are followed by the Paralympic Games from 29 August to 9 September)
3. CONSULTATION
3.1. In December 2005, following publication of the TTSS supplementary report, Defra established a group (Working Group on Thames Tideway and 2012 Olympic Games) of key organisations including TW, EA, Ofwat and other Government departments to take forward discussion of the options. The group’s terms of reference were revised following the July 2006 announcement (which followed the MSCCE letter of 27 July 2006) and a Thames Tideway Advisory Group set up to provide a focal point for progress reports, input to and comment on the work being carried out by TW. A copy of the current terms of reference and membership of the group is at Annex 3. There have also been a number of separate discussions and exchanges of correspondence between Defra and organisations represented on this group.

10
3.2. On 6 December 2006 Defra published an update on progress in developing the two options identified by ministers and invited comments on the two options. As this information note was published prior to the completion of the Thames Water’s detailed assessment of the options, it did not include detailed information (eg specification of options, their costs, bill impacts, environmental outcomes etc) of the options that Thames assessed.
3.3. Letters were sent to over 600 stakeholders on the TTSS stakeholder
database (covering, for example, local councillors, MPs and MEPs, interest groups such as rowing and angling clubs and environmental groups, and mainstream press/television/radio/web based news media, drawing their attention to the information note published on Defra’s website and the opportunity to comment on the two options. Two of the four replies received indicated a clear preference for option 1 and another welcomed any proposal that would provide further cycle or footpaths. A further reply sought information on discharges from Mogden STW and did not express an opinion on the two options.
3.4. Section 6 of this RIA also reports on small businesses whose views on
the options were sought by referring them to the information on Defra’s website
3.5. The RIA was shared a number of times with the TTAG members while
it was being developed. 4. OPTIONS
4.1. As stated earlier, work on identifying and assessing options to deal with CSO discharges into the Thames and river Lee has been underway since 2000 when the TTSS was established. Since then more work has been undertaken to identify further options, to provide more detailed assessment of specific options and to undertake an assessment of what the options deliver.
4.2. This section set out the process of narrowing down the options based
on the assessment undertaken and sets out in detail those options under consideration in this RIA.
(i) Assessment of possible approaches and options
4.3. The TTSS and the Jacobs Babtie review identified and assessed the suitability of four key strategies.
Strategy 1 Before the run-off rain water enters the sewerage system eg
storage at source, SUDS.
11
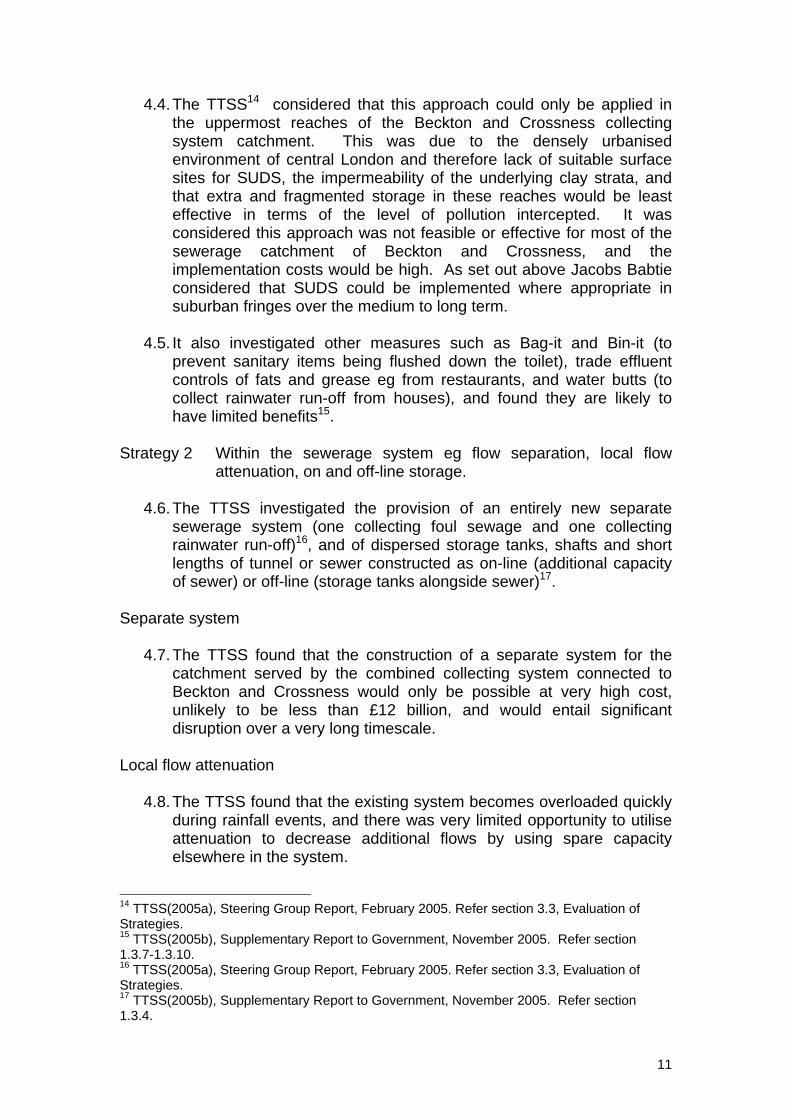
4.4. The TTSS14 considered that this approach could only be applied in the uppermost reaches of the Beckton and Crossness collecting system catchment. This was due to the densely urbanised environment of central London and therefore lack of suitable surface sites for SUDS, the impermeability of the underlying clay strata, and that extra and fragmented storage in these reaches would be least effective in terms of the level of pollution intercepted. It was considered this approach was not feasible or effective for most of the sewerage catchment of Beckton and Crossness, and the implementation costs would be high. As set out above Jacobs Babtie considered that SUDS could be implemented where appropriate in suburban fringes over the medium to long term.
4.5. It also investigated other measures such as Bag-it and Bin-it (to
prevent sanitary items being flushed down the toilet), trade effluent controls of fats and grease eg from restaurants, and water butts (to collect rainwater run-off from houses), and found they are likely to have limited benefits15.
Strategy 2 Within the sewerage system eg flow separation, local flow
attenuation, on and off-line storage.
4.6. The TTSS investigated the provision of an entirely new separate sewerage system (one collecting foul sewage and one collecting rainwater run-off)16, and of dispersed storage tanks, shafts and short lengths of tunnel or sewer constructed as on-line (additional capacity of sewer) or off-line (storage tanks alongside sewer)17.
Separate system
4.7. The TTSS found that the construction of a separate system for the catchment served by the combined collecting system connected to Beckton and Crossness would only be possible at very high cost, unlikely to be less than £12 billion, and would entail significant disruption over a very long timescale.
Local flow attenuation
4.8. The TTSS found that the existing system becomes overloaded quickly during rainfall events, and there was very limited opportunity to utilise attenuation to decrease additional flows by using spare capacity elsewhere in the system.
14 TTSS(2005a), Steering Group Report, February 2005. Refer section 3.3, Evaluation of Strategies. 15 TTSS(2005b), Supplementary Report to Government, November 2005. Refer section 1.3.7-1.3.10. 16 TTSS(2005a), Steering Group Report, February 2005. Refer section 3.3, Evaluation of Strategies. 17 TTSS(2005b), Supplementary Report to Government, November 2005. Refer section 1.3.4.
12
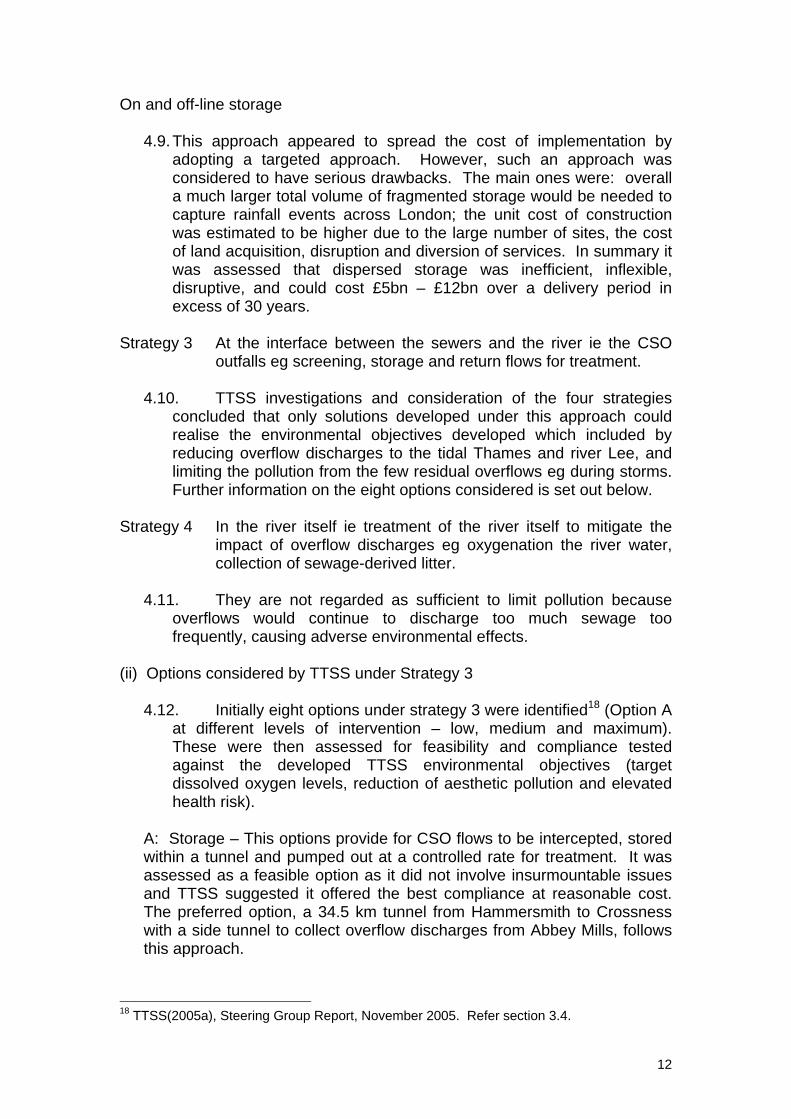
On and off-line storage
4.9. This approach appeared to spread the cost of implementation by adopting a targeted approach. However, such an approach was considered to have serious drawbacks. The main ones were: overall a much larger total volume of fragmented storage would be needed to capture rainfall events across London; the unit cost of construction was estimated to be higher due to the large number of sites, the cost of land acquisition, disruption and diversion of services. In summary it was assessed that dispersed storage was inefficient, inflexible, disruptive, and could cost £5bn – £12bn over a delivery period in excess of 30 years.
Strategy 3 At the interface between the sewers and the river ie the CSO
outfalls eg screening, storage and return flows for treatment.
4.10. TTSS investigations and consideration of the four strategies concluded that only solutions developed under this approach could realise the environmental objectives developed which included by reducing overflow discharges to the tidal Thames and river Lee, and limiting the pollution from the few residual overflows eg during storms. Further information on the eight options considered is set out below.
Strategy 4 In the river itself ie treatment of the river itself to mitigate the
impact of overflow discharges eg oxygenation the river water, collection of sewage-derived litter.
4.11. They are not regarded as sufficient to limit pollution because
overflows would continue to discharge too much sewage too frequently, causing adverse environmental effects.
(ii) Options considered by TTSS under Strategy 3
4.12. Initially eight options under strategy 3 were identified18 (Option A at different levels of intervention – low, medium and maximum). These were then assessed for feasibility and compliance tested against the developed TTSS environmental objectives (target dissolved oxygen levels, reduction of aesthetic pollution and elevated health risk).
A: Storage – This options provide for CSO flows to be intercepted, stored within a tunnel and pumped out at a controlled rate for treatment. It was assessed as a feasible option as it did not involve insurmountable issues and TTSS suggested it offered the best compliance at reasonable cost. The preferred option, a 34.5 km tunnel from Hammersmith to Crossness with a side tunnel to collect overflow discharges from Abbey Mills, follows this approach.
18 TTSS(2005a), Steering Group Report, November 2005. Refer section 3.4.

13
B: Transfer – The option would have the CSO flows intercepted to a tunnel along the length of the Tideway, and carried downstream to a high capacity pumping station and screening plant for discharge to the lower reaches of the Thames. No treatment was considered possible because of the high flow rates. It was considered that this option was infeasible because automated screening of high flows and large volumes are difficult to do effectively. This option also didn’t meet two of the objectives (marginal failure of target dissolved oxygen levels, and reduction in health risk days), and peak power pumping requirements would be too high. Estimated financial cost in February 2005 report was £1.2 billion - £2.7 billion. Not considered further.
C: Multiple screened outlets – This option would comprise multiple, purpose built underground pumping and screening stations would be connected via a collection and distribution tunnel along the length of the Tideway to intercept flows from the CSOs. The TTSS considered it would be difficult to obtain land requirements, it didn’t meet two of the objectives (target dissolved oxygen levels, and reduction in health risk days), that operation would be difficult and costly, and there would be high disruption in central London. Estimated financial cost in February 2005 report was £1.5 billion - £4.5 billion. Not considered further.
D: Multiple screened outlets with storage – This option comprised a hybrid of A and C, incorporating a second tunnel to store the first flush of storm water that would be stored and pumped out for treatment. TTSS findings that would mean high disruption in central London, high cost, complex implementation and operation, and didn’t meet one of the objectives (target dissolved oxygen levels). Estimated financial cost in February 2005 report was £1.9 billion - £5 billion. Not considered further.
E: Storage shafts – This option comprised large storage shafts constructed in the foreshore of the CSOs incorporating a static screen whereby two thirds of the overflow discharges would be screened and returned to the river. The remainder is pumped back into the sewerage system for treatment. This option was assessed as not practical to construct given environmental impact on foreshore of Thames. Also the operation of this option was considered difficult and costly. Estimated financial cost in February 2005 report was £1.5 billion - £3.5 billion. Not considered further.
F: Screening at individual CSOs – This option would require the installation of screening plant immediately adjacent to or upstream of CSO discharge points. Although screening is widely used to address overflow pollution from combined collecting systems throughout England, the large size of the CSOs in London meant that the installation of screens would be difficult and disruptive at most locations. It was also assessed that this option was not practical to construct. Estimated financial cost in February 2005 report was £12 billion. Not considered further.
14
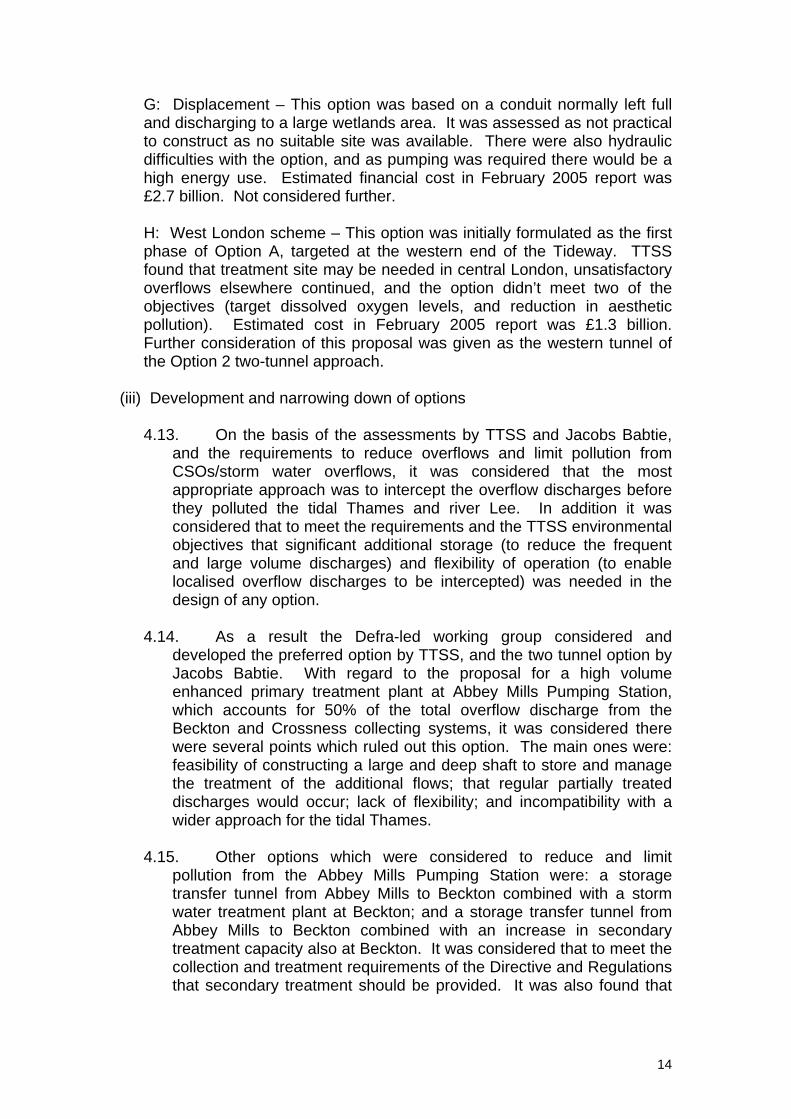
G: Displacement – This option was based on a conduit normally left full and discharging to a large wetlands area. It was assessed as not practical to construct as no suitable site was available. There were also hydraulic difficulties with the option, and as pumping was required there would be a high energy use. Estimated financial cost in February 2005 report was £2.7 billion. Not considered further.
H: West London scheme – This option was initially formulated as the first phase of Option A, targeted at the western end of the Tideway. TTSS found that treatment site may be needed in central London, unsatisfactory overflows elsewhere continued, and the option didn’t meet two of the objectives (target dissolved oxygen levels, and reduction in aesthetic pollution). Estimated cost in February 2005 report was £1.3 billion. Further consideration of this proposal was given as the western tunnel of the Option 2 two-tunnel approach.
(iii) Development and narrowing down of options
4.13. On the basis of the assessments by TTSS and Jacobs Babtie, and the requirements to reduce overflows and limit pollution from CSOs/storm water overflows, it was considered that the most appropriate approach was to intercept the overflow discharges before they polluted the tidal Thames and river Lee. In addition it was considered that to meet the requirements and the TTSS environmental objectives that significant additional storage (to reduce the frequent and large volume discharges) and flexibility of operation (to enable localised overflow discharges to be intercepted) was needed in the design of any option.
4.14. As a result the Defra-led working group considered and
developed the preferred option by TTSS, and the two tunnel option by Jacobs Babtie. With regard to the proposal for a high volume enhanced primary treatment plant at Abbey Mills Pumping Station, which accounts for 50% of the total overflow discharge from the Beckton and Crossness collecting systems, it was considered there were several points which ruled out this option. The main ones were: feasibility of constructing a large and deep shaft to store and manage the treatment of the additional flows; that regular partially treated discharges would occur; lack of flexibility; and incompatibility with a wider approach for the tidal Thames.
4.15. Other options which were considered to reduce and limit
pollution from the Abbey Mills Pumping Station were: a storage transfer tunnel from Abbey Mills to Beckton combined with a storm water treatment plant at Beckton; and a storage transfer tunnel from Abbey Mills to Beckton combined with an increase in secondary treatment capacity also at Beckton. It was considered that to meet the collection and treatment requirements of the Directive and Regulations that secondary treatment should be provided. It was also found that
15
operation of the storm water treatment plant would result in regular but partially treated overflows to the Thames at Beckton.
(iv) Options assessed By Thames Water
4.16. As a result two tunnel and secondary treatment options for further assessment were developed by the Defra-led working group. Thames Water undertook the detailed assessment of these options from August – December 2006. The key considerations were measures, taking into account the planned STW upgrades to: i) reduce overflows from the collecting system connected to Beckton and Crossness by providing significant additional storage; ii) to limit pollution of the tidal Thames and river Lee from CSOs to achieve the objectives (target dissolved oxygen levels, reduction of aesthetic pollution and health risk).
4.17. The options which TW have now assessed are:
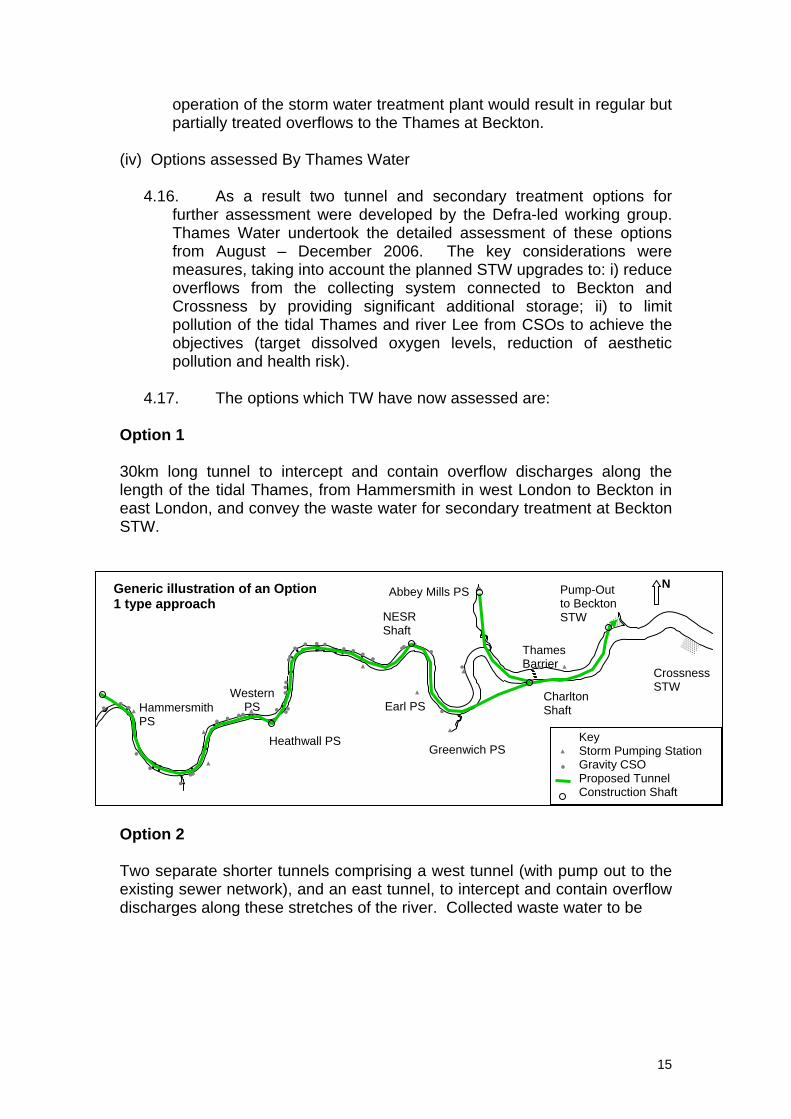
Option 1 30km long tunnel to intercept and contain overflow discharges along the length of the tidal Thames, from Hammersmith in west London to Beckton in east London, and convey the waste water for secondary treatment at Beckton STW.
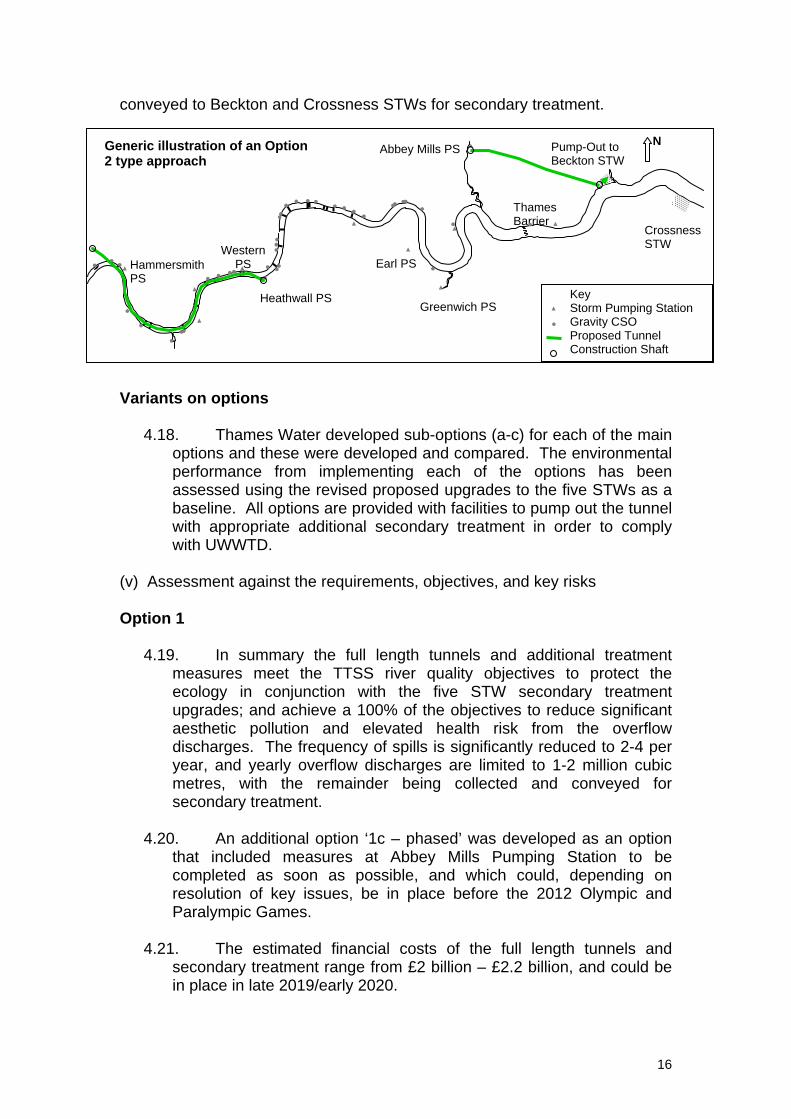
Option 2 Two separate shorter tunnels comprising a west tunnel (with pump out to the existing sewer network), and an east tunnel, to intercept and contain overflow discharges along these stretches of the river. Collected waste water to be
Pump-Out to Beckton STW
Crossness STW
Greenwich PS
Hammersmith PS
Earl PS
Heathwall PS
Thames Barrier
Abbey Mills PS
Key Storm Pumping Station Gravity CSO Proposed Tunnel Construction Shaft
Western PS
NGeneric illustration of an Option 1 type approach NESR
Shaft
Charlton Shaft
16
Pump-Out to Beckton STW
Crossness STW
Greenwich PS
Hammersmith PS
Earl PS
Heathwall PS
Thames Barrier
Abbey Mills PS
Key Storm Pumping Station Gravity CSO Proposed Tunnel Construction Shaft
Western PS
NGeneric illustration of an Option 2 type approach
conveyed to Beckton and Crossness STWs for secondary treatment.
Variants on options
4.18. Thames Water developed sub-options (a-c) for each of the main options and these were developed and compared. The environmental performance from implementing each of the options has been assessed using the revised proposed upgrades to the five STWs as a baseline. All options are provided with facilities to pump out the tunnel with appropriate additional secondary treatment in order to comply with UWWTD.
(v) Assessment against the requirements, objectives, and key risks Option 1
4.19. In summary the full length tunnels and additional treatment measures meet the TTSS river quality objectives to protect the ecology in conjunction with the five STW secondary treatment upgrades; and achieve a 100% of the objectives to reduce significant aesthetic pollution and elevated health risk from the overflow discharges. The frequency of spills is significantly reduced to 2-4 per year, and yearly overflow discharges are limited to 1-2 million cubic metres, with the remainder being collected and conveyed for secondary treatment.
4.20. An additional option ‘1c – phased’ was developed as an option
that included measures at Abbey Mills Pumping Station to be completed as soon as possible, and which could, depending on resolution of key issues, be in place before the 2012 Olympic and Paralympic Games.
4.21. The estimated financial costs of the full length tunnels and
secondary treatment range from £2 billion – £2.2 billion, and could be in place in late 2019/early 2020.
17
4.22. Option 1 is considered by Defra to meet the requirements of the Regulations as it will significantly reduce the frequency and volumes from unsatisfactory overflows. It is estimated, with the existing collecting system and Beckton and Crossness STW upgrades, to enable over 99% of collected sewage (domestic, industrial and rainwater run-off) to receive secondary treatment. Although overflow discharges will still occur these are expected to be infrequently and of small annual volumes (compared to the annual volume collected and receiving secondary treatment). Taking account the effect on the tidal River Thames and River Lee, it is considered to limit pollution from storm water overflows satisfactorily and protect the environment from the adverse effects of sewage discharges.
4.23. It is estimated that when potential and uncertain climate change
increases to river water temperature are taken into account that the target dissolved oxygen levels may not be achieved in 2080. (Ref 4, Section 1.5.2) Although it is predicted that rainfall may become stormier the distribution remains uncertain and total rainfall depth may not increase greatly. Although uncertain, it seems that a potential rise in water temperature and the potential implications for available dissolved oxygen levels in the Thames appears to be a factor to be considered concerning future proofing of these options.
4.24. In terms of future proofing it is considered that option 1 provides
the best robustness as greater volumes and flows of collected sewage are transferred to the STWs where additional treatment can be implemented if required, for example for the Water Framework Directive.
4.25. Further information on the pros and cons of each sub-option and
a possible phased approach are set out below. Option 2
4.26. In summary the two tunnels in east and west London and additional treatment measures at Beckton and Crossness are able to meet the TTSS river quality objectives to protect the ecology in conjunction with the five STW secondary treatment upgrades under current climatic conditions; and achieve a 60-65% reduction in significant aesthetic pollution and elevated health risk from the overflow discharges. The frequency of spills from the overflows connected to the two tunnels is significantly reduced to approximately 9 per year, and yearly overflow discharges are limited to 11-12 million cubic metres, with the remainder being collected and conveyed for secondary treatment.
4.27. As some overflows are expected to continue to operate
frequently (those not connected to the two tunnels) and may cause aesthetic pollution, purpose built river craft with screening plant to
18
remove sewage derived litter and other litter from the river will be provided. The first of two craft is to be operational in April 2007.
4.28. The estimated financial costs of the two tunnels and secondary
treatment range from £1.6 billion – £1.7 billion, and could be in place in early 2019.
4.29. It is considered that option 2 does not meet the requirements of
the Regulations as it does not reduce overflows 18 or 17 overflows which have been identified as unsatisfactory. In terms of limiting pollution from storm water overflows this option meets the objectives under current climatic conditions. However, it is estimated that when potential climate change increases to river water temperature are taken into account that the target dissolved oxygen levels may not be achieved in 2020 ie just after this option could be in place. Therefore the remainder of this RIA only considers an option 1 type approach.
(VI) Options being considered in RIA Do nothing
4.30. The ‘do nothing’ option would comprise the action TW are taking (awaiting agreement by the EA and Ofwat) to increase the secondary treatment capacity and performance of Beckton, Crossness, Long Reach, Mogden and Riverside STWs.
4.31. No action would be taken to reduce sewage overflows to the
tidal Thames and river Lee following rainfall events, and to limit the size, frequency, and impact of discharges of untreated sewage during heavy rainfall or unusual events from CSOs. Therefore the risk of untreated discharges would continue and the associated adverse impacts (ie environmental, aesthetic and health) of these discharges would be incurred.
4.32. The key risk associated with this option is associated with the
non-compliance with the UWWTD. This is discussed fully in section 2 of this RIA. The risk of a discharge at Abbey Mills during the 2012 Olympics would also remain.
Option 1 type approach
4.33. The option 1 type approach which was assessed by TW is a 30km long tunnel which would intercept all unsatisfactory CSOs along the length of the tidal Thames from Hammersmith to Beckton. Three sub-options were identified and assessed by Thames Water. Each of the sub-options is set out in detail below.
19
Risk Assessment for Option 1 variants
4.34. Part of the detailed assessment work TW undertook in late 2006 included working closely with stakeholders to identify issues and risks associated with any of these large scale and technically challenging construction projects, and their forecast delivery periods. Major risks are inherent in projects of this scale and complexity. These risks could impact on delivery times and/or project costs. TW undertook an initial risk assessment19 of the options assessed, however as these options are only at a very early stage of design, a detailed, comprehensive risk assessment was not possible. Therefore major issues and risks remain where significant further work is required to resolve them as far as possible to enable a scheme to be implemented. The main ones are:
• feasibility of construction (see general comments below);
• detailed design work, including possible land acquisition,
specialist ground condition and site investigations (see general comments below);
• planning and regeneration issues in east London. The
estimated delivery dates are on the basis that neither a ‘call in’ or Public Inquiry are required;
• funding and financeability. A report is expected from TW
which will need consideration by Ofwat and agreement on a way forward;
• stakeholder views; and
• climate change implication in terms of the benefits delivered
by the options. General comments on an option 1 approach
4.35. This project is a major construction project, not least because of the size of the project and limited current site specific geotechnical data along proposed tunnel alignments. The project does not deal with fundamentally new civil engineering technologies but it will push the boundaries of current experience. Logistically the project will be challenging but it is considered the construction industry has good experience in this type of work and appropriate management tools.
4.36. It is considered that one of the most significant civil engineering
risks to cost in this project is the lack of site specific geological/geotechnical information. The TW reports recognise this,
19 Full details of this assessment are available in the TW report, Thames Tideway Tunnel and Treatment, Solutions Group Report, Volume I and II.
20
whilst also accepting that geology of tunnel routes around the Thames is reasonably understood and states that risk assessment take due account of these issues. Therefore, the probability of unforeseen ground conditions remains medium/high and the consequence (ie delay and increased cost) also medium/high. This is more so the case for the tunnel route between Abbey Mills and Charlton where the geology is already known to be difficult and an area of geological risk. However, it is considered that uncertain ground conditions remain a significant risk.
4.37. It appears that TW and their contractors have considerable
experience in tunnelling projects in and around London and along with Transport for London and other utilities would probably be one of the principal client sources able to determine an appropriate level of contingency. Accordingly TW have used a process incorporating risk to estimate the “range of probable costs” of the options. Typically, in the construction industry around 20% to 15% contingency may be used for projects that have achieved final sketch plan stage and are about to start detailed design. At present TW have a 15% contingency at this proposal stage.
4.38. Constructing the project in two phases will attract extra
overheads and have a longer project duration. However, apart from the potential of providing the proposed phase 1 (Abbey Mills to Beckton direct tunnel and treatment) prior to the Olympics, the construction in two phases may have some wider merit from a project management and technical point of view. Early benefits such as dealing with overflows from Abbey Mills are added to by gaining pre-second phase contractual knowledge, improved cost certainty of subsequent phases, more flexibility to take on technological change and design, lower risk resulting due reduced pressure on construction industry, opportunity to re-programme subsequent phases, etc. Indeed, it may be that an option 1 scheme would in any case have a phased structure within the overall construction programme in order to use same tunnel boring machine throughout.
4.39. One further issue is that of the in-situ concrete lining to the
primary segmental tunnel lining, whether this has real cost savings and could translate to an in-built contingency, and also consequential programme saving. Consideration of these points is likely to come forward during the detailed design as a real opportunity to reduce increasing costs and achieve earlier completion.

21
Pump-Out to Beckton STW
Crossness STW
Greenwich PS
Hammersmith PS
Earl PS
Heathwall PS
Thames Barrier
Abbey Mills PS
Key Storm Pumping Station Gravity CSO Proposed Tunnel Construction Shaft
Western PS
NOption 1a - 7.2m diameter
NESR Shaft
Charlton Shaft
Pump-Out to Beckton STW
Crossness STW
Greenwich PS
Hammersmith PS
Earl PS
Heathwall PS
Thames Barrier
Abbey Mills PS
Key Storm Pumping Station Gravity CSO Proposed Tunnel Construction Shaft
Western PS
NOption 1b – 6m diameter
NESR Shaft
Charlton Shaft
Option 1a
4.40. This option comprises a 7.2 metre diameter tunnel which is
predicted to intercept and address 94% of the current volume of overflow discharges. Typical annual discharges volumes are estimated at around 1 million cubic metres from on average 2-4 spill day events per year, but typically one per year.
Option 1b
This options comprises a 6 metre diameter tunnel which is predicted to intercept and address 89% of the current volume of overflow discharges. 6 metres has been assessed as the smallest operational tunnel to prevent choking and for ease of connection to the overflows along the Tideway.
4.41. Typical annual discharges volumes are estimated at around 2.3 million cubic metres from on average 9 spill day events per year, but typically three per year.
22
Pump-Out to Beckton STW
Crossness STW
Greenwich PS
Hammersmith PS
Earl PS
Heathwall PS
Thames Barrier
Abbey Mills PS
Key Storm Pumping Station Gravity CSO Proposed Tunnel Construction Shaft
Western PS
NOption 1c - 7.2m diameter
NESR Shaft
Charlton Shaft
Specific risks for 1a and 1b
4.42. Risks specific to options 1a and b include: • Ground conditions in central area and along the Lee Valley. • Planning permission as many boroughs involved, for example concerning
the construction and pump out shafts and above ground facilities at these and at Beckton STW.
• Land acquisition for sites not in the ownership of TW, and that Compulsory
Purchase Orders may be required for some sites. Option 1c
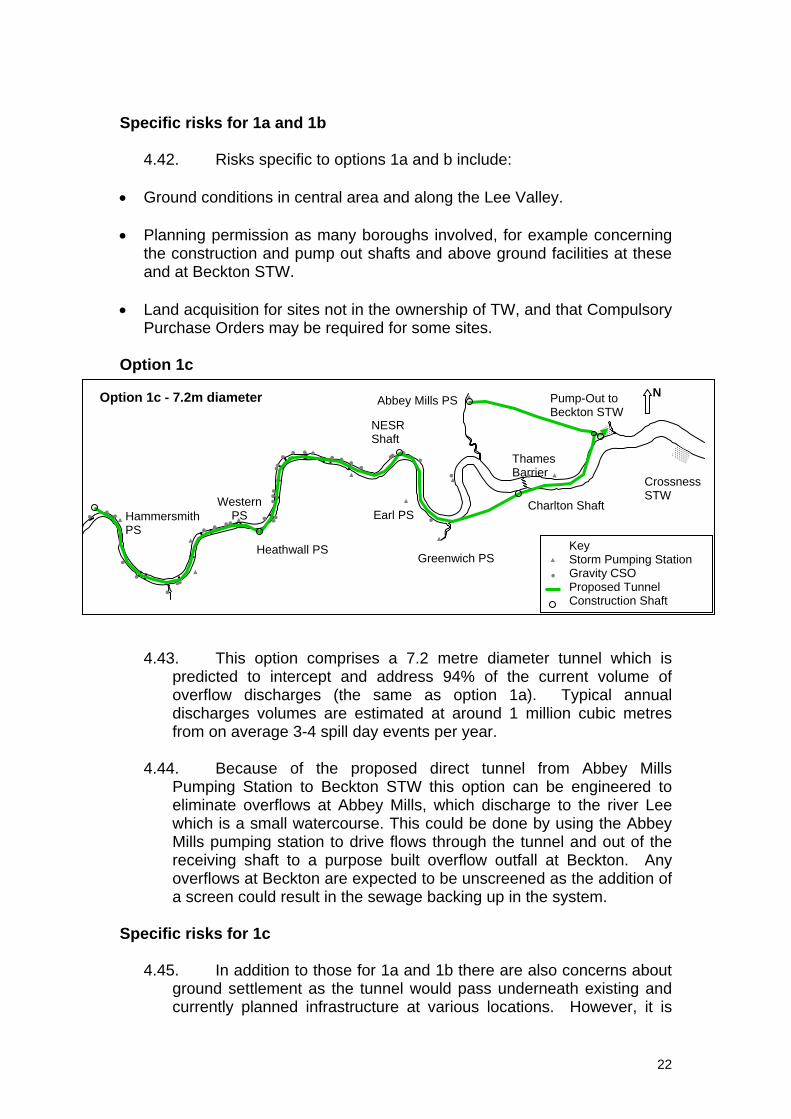
4.43. This option comprises a 7.2 metre diameter tunnel which is
predicted to intercept and address 94% of the current volume of overflow discharges (the same as option 1a). Typical annual discharges volumes are estimated at around 1 million cubic metres from on average 3-4 spill day events per year.
4.44. Because of the proposed direct tunnel from Abbey Mills
Pumping Station to Beckton STW this option can be engineered to eliminate overflows at Abbey Mills, which discharge to the river Lee which is a small watercourse. This could be done by using the Abbey Mills pumping station to drive flows through the tunnel and out of the receiving shaft to a purpose built overflow outfall at Beckton. Any overflows at Beckton are expected to be unscreened as the addition of a screen could result in the sewage backing up in the system.
Specific risks for 1c
4.45. In addition to those for 1a and 1b there are also concerns about ground settlement as the tunnel would pass underneath existing and currently planned infrastructure at various locations. However, it is
23
considered this diameter tunnel could be constructed within manageable limits along this route.
4.46. It is also considered, but further ground investigations are
needed, that the geology of the proposed route of the Abbey Mills to Beckton tunnel is more predictable (than the significantly faulted and disturbed geology along the Lee Valley) and therefore the risk reduced20.
Option 1c with an early phase of direct tunnel from Abbey Mills to Beckton STW and treatment
4.47. This options is the same as option 1c but would involve a shorter delivery time in order for the direct tunnel from Abbey Mills to Beckton (and associated treatment) to be in place as soon as possible. This would result in earlier compliance with the Directive and may be in place in time for the 2012 Olympics
Specific risks for 1c (early phasing)
4.48. To achieve a predicted completion date of early 2012 this phase of option 1c would require an in principle agreement to go ahead early in 2007, for detailed design to be completed and a planning application made around the end of 2007, a shortened planning process with local decision by LB Newham and the London Thames Gateway Development Corporation, suitable funding arrangements, and fast-track construction programme (from mid 2008) with the minimum of delay. It is considered that delivery of an Abbey Mills to Beckton scheme in early 2012 is low probability because of the planning, construction and funding issues to be resolved.
4.49. Of note is that the land at either end of the tunnel is owned by
TW so the issue of land acquisition for this proposed phase doesn’t arise.
4.50. TW has estimated that the two phase construction associated
with this option is estimated to add £32 million to the cost due to extra overhead costs in undertaking the work in two stages with construction over an extended period.
4.51. Early phase means more untreated overflows (on average
approximately 7 per year) from Beckton STW until the second phase (the rest of the tunnel) was completed. It is estimated that with the STW upgrades and the first phase of option 1c that over 96% of the collected sewage (domestic, industrial and rainwater run-off) would receive secondary treatment before discharge.
20 Thames Water (2006b), Thames Tideway Tunnel and Treatment – Option Development Summary Report. Refer to section 4.3.1.
24
4.52. Abbey Mills overflows, which are estimated to account for 50% of the total volume of overflow discharges from the Beckton and Crossness collecting system, could be addressed 7-8 years before a full scheme.
5. ASSESSMENT OF COSTS AND BENEFITS
5.1. As part of the detailed assessment that TW completed from August to December 2006, a cost benefit analysis was undertaken to assess the costs and benefits of the options they assessed. TW commissioned a number of workstreams to identify and assess the costs and benefits and established a Cost Benefit Working Group to oversee the assessment, The Group comprised of representatives from TW, Defra, Ofwat, EA and CCWater.
5.2. Full details of the assessment are available in the TW (December
2006), Thames Tideway Tunnel and Treatment – Option Development, Summary Report, TW (Dec 2006), Thames Tideway Tunnel and Treatment – Option Development, Cost Benefit Working Group Report, and the Thames Tideway Cost Benefit Analysis (NERA 2007), and the underpinning studies relating to the environmental benefits21 and environmental and social impacts22. The results of this assessment have informed the following section of the RIA
5.3. The assessment undertaken by Thames covered both the full tunnel
and two-tunnel options (ie 7 options). As set out earlier, this RIA is focussing on the full tunnel options considered by TW and referred to in their reports as Option 1a, 1b, 1c and 1c phased. Therefore this section of the RIA sets out the costs and benefits for the options being considered in this RIA. Details of the costs and benefits of the two tunnel options are set out in the relevant TW reports listed above.
5.4. The impacts of the options include both financial costs (capital and
operating expenditure) and benefits, and also wider social and environmental (i.e. non-financial or non-market) impacts. The impacts for which there is no market price are difficult to assess and therefore it is extremely difficult to place monetary values on them. Where it has not been possible to place values on the impacts, they have been described in qualitative terms.
5.5. Given the timescales available for TW to complete the cost benefit
assessment, the nature of the impacts, the available information regarding the impacts, their scale and available methodologies to value these impacts, a number of significant uncertainties remain within the cost benefit assessment. Where relevant to specific impacts, these are discussed in detail below. The uncertainty surrounding the environmental outcomes or benefits delivered by the
21 Eftec (2006), Thames Tideway Stated Preference Study, December 2006 22 Entec (2006), Environmental Costs and Market Benefits of Reducing Combined Sewer Overflows, December 2006.

25
options is discussed in the Thames Water (2006) Objectives and Compliance Working Group Reports, Volume I and II. A full description of the residual uncertainties contained with the assessment and valuation of the impacts is set out in section 5 of the Thames Water Cost Benefit Group Working Report.
Baseline for measurement of costs and benefits
5.6. The baseline assumed for the assessment of the costs and benefits of the options was the completion of the five STW upgrades set out earlier as the ‘do-nothing’ option. The assessment of the impacts of the options being considered in this RIA took account of the agreed STW improvements and therefore represents the additional costs and benefits of the options being considered to address the CSOs.
5.7. This baseline therefore represents a future baseline rather than the
current situation in the Tideway. The main impact of the STW upgrades is to improve the dissolved oxygen levels and to therefore reduce the number of potential fish kill events. The most recent water quality modelling by TW23 indicates that the current water quality conditions in the Tideway (ie in terms of failure of the 4mg/l oxygen standard) result in 8 fish kills per year. After the completion of the STW upgrades the estimated number of fish kills per year is between 3 and 4.
Benefits
5.8. The main benefits delivered by the options are those associated with achieving the environmental objectives discussed earlier ie protection of ecology and fish, a reduction in aesthetic litter and reduction in elevated health risk. The benefits delivered by each of the options were assessed by the Thames Water Objectives, Modelling and Compliance Group. The outcomes of this work are summarised above. Further details of the analysis of this Group’s work is available in the Thames Water (2006a and b) reports.
5.9. The options being considered in this RIA deliver the same types of
benefits24,. It is the size of the benefits that varies between options. The following section will describe the benefits delivered and set out the scale of benefits described by each of the options. In the case of option 1c (phased) there may be an additional benefit delivered by the option in terms of early partial compliance with UWWTD and the associated environmental benefits and protection of the 2012 Olympics. These are discussed separately below.
23 Thames Water (2006), Thames Tideway Tunnel and Treatment – Option Development, Objectives and Compliance Working Group Report, Volume I and II. 24 apart from 1c phased which would remove the risk of a discharge at Abbey Mills during the 2012 Olympics
26
Environmental objectives
5.10. The three environmental objectives and indicators developed by the EA/TTSS were reviewed in the August-December 2006 work undertaken by TW, with input from two experts concerning fisheries and microbiology/health, as part of the development and assessment of the options. The three objectives are:
i) protection of the ecology, expressed and assessed by reference to
target dissolved oxygen standards developed for the Tideway; ii) reduction of the aesthetic impact of sewage solids and litter (including possible odour issues); and iii) reduction of elevated health risks attributable to intermittent sewage discharge.
5.11. The aim of these objectives is to protect the tidal Thames and
tidal river Lee from the adverse effects of sewage discharges, and limit pollution from overflow discharges. Section 3.3-3.5 of the TW (Dec 2006) Thames Tideway Tunnel and Treatment – Option Development, Summary Report provides more information on these objectives, and an assessment of how the dissolved oxygen standards fit with the potential Water Framework Directive standards. A more detailed discussion of the objectives is available in the Thames Water (2006 Objectives and Compliance Working Group Report.
Protection of ecology and fish
5.12. Some 45 species of fish are considered resident in the Tideway as some point in their lifecycle, ranging from freshwater coarse fish species in the west, through to more estuarine species. Migratory species such as salmon need to able to traverse the whole length. The Tideway is also a spawning and nursery area for commercial species such as flounder and bass25.
5.13. In developing the target dissolved oxygen standards account
was taken of: • evidence, through a study of fish found in the Tideway, of adverse impacts
on species diversity and age distribution linked to poor water quality/low dissolved oxygen26. Also occasional visible fish kills, such as occurred
25 Thames Water (2006a), Thames Tideway Tunnel and Treatment – Option Development, Objectives and Compliance Working Group Report, Vol I. Refer section 4, protection of ecology. 26 Thames Water (2006c), Thames Tideway Tunnel and Treatment – Option Development

27
following the exceptional storm in August 200427. It was inferred from this evidence that the ecology – specifically fish, both individuals and populations – as being adversely affected by low dissolved oxygen concentrations, and it is necessary to set protective standards to avoid this adverse impact.
• The fish study that demonstrated widespread mortality at or below 1.5
mg/l, and sensitive species, such as salmon, show significant mortality below 3mg/l, and adverse behavior below 4mg/l;
• The opinion of a fishery expert which suggests: 3mg/l is the minimum to
achieve a sustainable fishery; at 3mg/l there will be mortalities and sub-lethal effects on sensitive species (such as salmon and smelt); and a target of 4mg/l would provide better protection and migration for sensitive species and will help achieve a wider species diversity.
5.14. When the highly uncertain climate change scenarios are
factored in concerning higher water temperatures (due to the predicted increases in air temperature and summer solar radiation)28, and when the Thames is more sensitive to sewage discharges29, modelling predicts that option 1 may also not achieve the 4mg/l standard in 2080.
5.15. In summary achievement of the proposed standards is
considered to assist the development of a more balanced and diverse fish ecology, and better protect more sensitive species, such as salmon, already present.
Reduction of aesthetics impacts
5.16. As it is not possible to derive a “standard” for aesthetic pollution, the following describes the issues:
5.17. Reduction of sewage derived litter and organic faecal matter,
and grey/greasy slicks following overflow discharges. It is estimated that sewage litter is about 10% of the total litter in the Thames, and that 10,000 tonnes of sewage solids are discharged each year.
5.18. the assessment of the 36 “unsatisfactory” CSOs are mainly
because they are considered to cause significant visual or aesthetic impact.
27 TTSS(2005a), Steering Group Report, February 2005. Refer section 3.3, Evaluation of Strategies. Summary Report. Refer section 1.6. 28 Thames Water (2006c), Thames Tideway Tunnel and Treatment – Option Development Summary Report. Refer section 4.4. 29 Thames Water (2006c), Thames Tideway Tunnel and Treatment – Option Development Summary Report. Refer section 1.5.2.
28
5.19. In summary reduction of significant aesthetic impacts is considered to be an area where judgements are and could be made, and where further monitoring and assessment could be undertaken.
Reduction of health risk
5.20. As the tidal Thames is not a designated Bathing Water but is used for recreation eg rowers, this could be considered a policy objective.
5.21. Background health risk (if immersion occurs) remains with any
option as the risk is primarily linked to treated effluent discharges from sewage treatment works now and when they are upgraded.
5.22. The assessment of the heath risk objective is highly uncertain
due to the very little information regarding the actual pathogen loads and fate (including how the the temporal and spatial issues in a tidal river affect these), and actual exposure. This means that it is not possible to identify the risk to recreational users and therefore to determine what the impacts are.
5.23. In summary the options may help reduce elevated health risk for
recreational users of the tidal Thames, particularly in the west where most rowing occurs, but it is predicted to remain if ingestion of river water occurs.
Areas of uncertainty regarding the environmental outcomes
5.24. The information relating to the environmental impacts of the CSO is based on modelled information. Therefore there is some uncertainty regarding the information produced by the model, which involve assumptions, and the input data. The TW Objectives and Compliance Working Group Report discusses in detail the limitations of the model in detail.
5.25. Section 4.2.1 of the Report, Volume 2 sets out that “Of the 57
CSO which discharges to the Tideway, indicative flow data only exists for around 9 of the pumped discharges and there is some historical quality data. There is no flow data and virtually no quality data for the remainder. Obviously, comprehensive flow and quality data is essential for all these discharges if individual rainfall events are to be modelled precisely. It is likely that, depending on rainfall patterns, the quality of discharges from these outfalls will vary considerably throughout the event and each CSO will display a different pattern of discharge. It is also likely that antecedent conditions will influence the amount of solid matter flushed from the system. Under these conditions it is unlikely that it will ever be possible to acquire sufficiently comprehensive data. The sewer model was therefore used to generate flow and quality data for all the discharges from the CSOs
29
and this data was fed into the estuary models. The sewer model has been refined over many years and represents the latest state of the art in hydraulic modelling. It is unlikely, however, that it can mirror the actual loads discharged to the river under all types of rainfall events …”.
5.26. This illustrates that there is uncertainty and that judgements
have been made about the overflow discharges and their impacts on the Thames from most of the overflows identified as unsatisfactory.
5.27. The uncertainty associated with the elevated health risk
objective is set out in an earlier section. Valuation of benefits Environmental and other non-market benefits
5.28. TW commissioned a study to assess and value the environmental benefits, as defined by the Objectives Group, for each of the options they considered. Given the non-market nature of these benefits, a stated preference study30 was undertaken to assess the value of the benefits delivered by the options. Stated Preference studies aim to assess the economic value of non-market benefits by eliciting people’s preferences and therefore the value (expressed as their willingness to pay (‘WTP’) they place on particular benefits. This is done using a questionnaire/survey of a representative sample of people and analysing the results.
5.29. The study sought to elicit people’s preferences to reduce the
combined impacts of the CSO discharges for the environmental objectives outlined above. The Thames Water Objectives, Modelling and Compliance Working Group provided information on the nature and scale of benefits delivered by the options. The stated preference study’s purpose was to attempt to value these benefits. In order to ensure that those surveyed as part of the stated preference study could understand and therefore express meaningful preferences and values for the benefits, it was necessary to describe the improvements in ways that would be understood by survey respondents. For example, in the case of the water quality compliance information (ie dissolved oxygen levels), this information was converted into a more tangible environmental benefits (described as a potential fish kill event).
5.30. The reduction in impacts were described in terms of the
predicted benefits afforded by three alternative engineering solutions, a large diameter tunnel (7.2m) running from Hammersmith to Beckton with a spur to Abbey Mills pumping station, a smaller diameter tunnel (6m) of the same length and two large diameter tunnels in the East
30 Eftec (2006), “Environmental costs and market benefits of reducing combined sewer overflows”.

30
(Hammersmith to Heathwall) and West (Abbey Mills to Beckton) of the Tideway. The study also sought to identify people’s preferences regarding early delivery of the scheme to avoid the risk of overflow discharges from Abbey Mills pumping station during the Olympics Games. The questionnaire was drafted in October 2006. There was a total of 875 respondents to the survey (599 Thames Water customers and 276 customers of other water companies)31.
5.31. A significant issue when assessing non-market benefits is the
appropriate population over which the non-financial benefits should be aggregated, particularly in the case where the values (expressed as ‘willingness to pay’) placed on the benefits declines the further away from the site of the benefits. In the case of the Tideway, this would mean that, all other things being equal, the value that someone located close to the Tideway would place on the benefits delivered by any of the options would be higher than that of someone at a greater distance away. This is known as ‘distance decay’. The study found this effect ie the WTP values declined substantially with distance from the Tideway. In order to take account of this effect and to understand whether non-Thames Water customers value the benefits delivered by the options the survey was administered to both TW and non-TW customers at varying distances from the Tideway. This is referred to as the ‘Benefits Jurisdiction’ in the table below32. However, in recognition that TW customers would most likely be the group that incurs the costs of the options, the results of the study are also reported for TW customers only. This is shown as the ‘Administrative Jurisdiction’ below.
Table 1: Non-Financial Benefits by Option Administrative Jurisdiction
(TW customer households) Benefits Jurisdiction
(English Households) Options
Per household
per year (£)
All households per year (£
million)
Per household
per year (£)
All households
per year (£ million)
1a 13.02 66 8.52 174 1b 7.44 38 4.00 82 1c 13.02 66 8.52 174 1c (phased) 13.02 66 8.52 174 (Source NERA 2007) All monetary values are in 2006 prices. 31 Eftec (2006) notes that the sample size was limited by the time available to complete the study. However, the statistical analysis of the results of the study showed that the relationships between the variables were as expected and the statistical power of the analysis was robust. Eftec therefore concluded that ‘the reduced sample size does not seem to have been a problem’. (Eftec, 2006,p19) 32 The aggregation was undertaken using both a derived distance decay function with explanatory variables relating to distance from the Tideway and socio-economic characteristics.

31
5.32. The key findings of the study were:
• WTP figures were found to be consistently higher for the larger diameter tunnel than the other two engineering options. In other words, the WTP values were sensitive to the scope of the environmental improvements as the larger diameter tunnel provided increased environmental improvements.
• That TW customers have a higher WTP but the total WTP is lower than the predicted costs of the options.
• use of the derived distance decay function reduces the aggregate WTP compared to the values derived from the simple mean WTP.
Areas of uncertainty and possible sources of over or under-estimation of benefits values (ie WTP estimates)
5.33. While the stated preference study commissioned by Thames Water was undertaken to a high standard, involving the relevant academics and subject to peer review, there are a number of areas of uncertainty regarding the benefits valuation that should be borne in mind.
Uncertainty relating to the (physical) environmental benefits
5.34. In order to place monetary values on the environmental benefits of the options, information is needed regarding the actual (in a physical sense) environmental benefits delivered by the options (ie numbers of fish kills, reduction in aesthetic pollution etc). As the stated preference study was undertaken in October 2006, it reflected the information about the benefits of the option that was available at the time that the survey was undertaken. The study therefore contained an early view of the benefits delivered by the options rather than being based on the final results of the water quality modelling and other assessments of what the options would deliver in terms of environmental benefits. It therefore did not reflect information that became available after this eg the final water quality modelling. The results of the final water quality modelling included some information that was not available when the WTP survey was being undertaken. There are two main areas where information emerged after the survey was undertaken and therefore is not reflected in the WTP values.
5.35. Firstly, the information included in the stated preference study
regarding potential fish kill events remaining for each option were developed from a combination of previous modelling, TW modelling up to that point and expert judgement from the TW Objective, Compliance and Modelling Working Group. The final modelling results show that the number of fish kills events predicted for the baseline (ie after STW upgrades) were higher than the figures used in the stated preference study. The final modelling results for the CSO options were unchanged from those set out in the stated preference study.
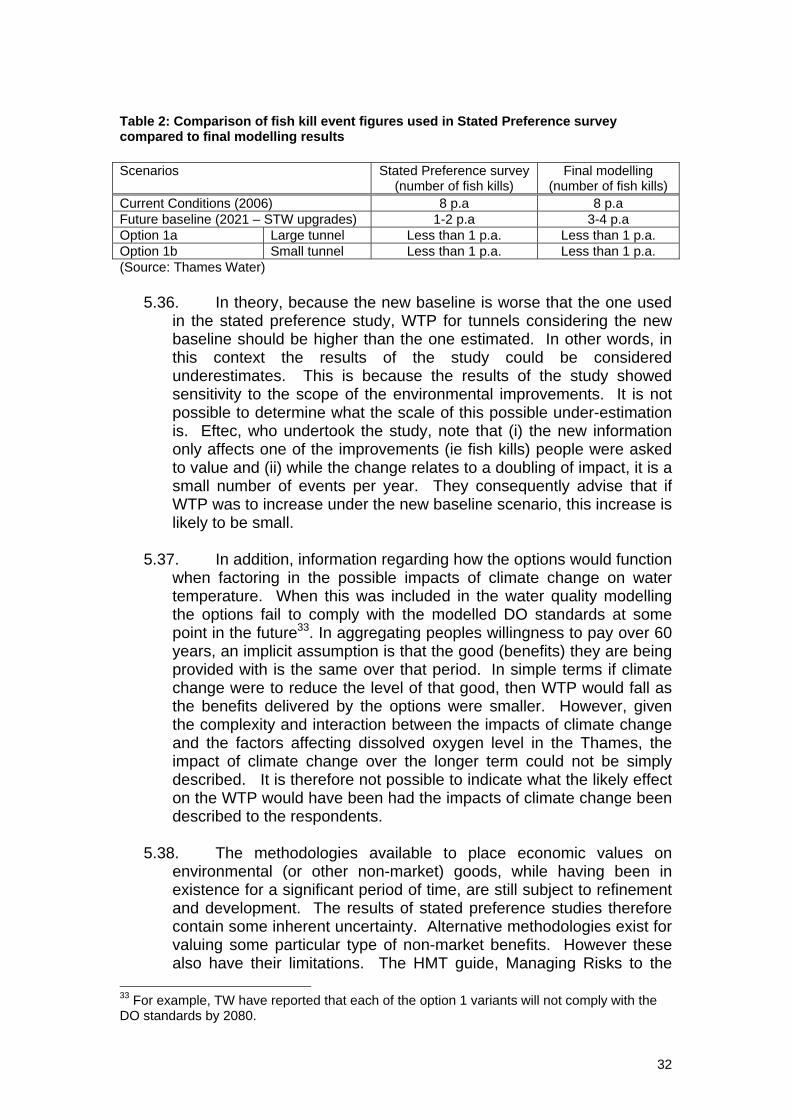
32
Table 2: Comparison of fish kill event figures used in Stated Preference survey compared to final modelling results Scenarios Stated Preference survey
(number of fish kills) Final modelling
(number of fish kills) Current Conditions (2006) 8 p.a 8 p.a Future baseline (2021 – STW upgrades) 1-2 p.a 3-4 p.a Option 1a Large tunnel Less than 1 p.a. Less than 1 p.a. Option 1b Small tunnel Less than 1 p.a. Less than 1 p.a. (Source: Thames Water)
5.36. In theory, because the new baseline is worse that the one used in the stated preference study, WTP for tunnels considering the new baseline should be higher than the one estimated. In other words, in this context the results of the study could be considered underestimates. This is because the results of the study showed sensitivity to the scope of the environmental improvements. It is not possible to determine what the scale of this possible under-estimation is. Eftec, who undertook the study, note that (i) the new information only affects one of the improvements (ie fish kills) people were asked to value and (ii) while the change relates to a doubling of impact, it is a small number of events per year. They consequently advise that if WTP was to increase under the new baseline scenario, this increase is likely to be small.
5.37. In addition, information regarding how the options would function
when factoring in the possible impacts of climate change on water temperature. When this was included in the water quality modelling the options fail to comply with the modelled DO standards at some point in the future33. In aggregating peoples willingness to pay over 60 years, an implicit assumption is that the good (benefits) they are being provided with is the same over that period. In simple terms if climate change were to reduce the level of that good, then WTP would fall as the benefits delivered by the options were smaller. However, given the complexity and interaction between the impacts of climate change and the factors affecting dissolved oxygen level in the Thames, the impact of climate change over the longer term could not be simply described. It is therefore not possible to indicate what the likely effect on the WTP would have been had the impacts of climate change been described to the respondents.
5.38. The methodologies available to place economic values on
environmental (or other non-market) goods, while having been in existence for a significant period of time, are still subject to refinement and development. The results of stated preference studies therefore contain some inherent uncertainty. Alternative methodologies exist for valuing some particular type of non-market benefits. However these also have their limitations. The HMT guide, Managing Risks to the
33 For example, TW have reported that each of the option 1 variants will not comply with the DO standards by 2080.

33
Public34 notes that economic valuation of risk is a developing area of expertise. This guidance sets out that, along with WTP studies, the use of the tool Quality Adjusted Life Year (QALY) could be a tool to used to asses the cost effectiveness of assessing health impacts. NERA (2007) noted that there are some problems in using QALY figures for valuing health impacts and environmental effects and that these are currently active research topics within Government and academia. Given the lack of information associated with the scientific information underpinning the impacts of the CSO discharges on elevated health risk, particularly in terms of pathogen load, exposure etc, it was not possible to undertake a specific QALY assessment for the health benefits delivered by the CSO options. When further robust information is available regarding these impacts it would be possible to undertake a QALY assessment.
5.39. For illustrative purposes, a QALY assessment was included in
the cost benefit analysis. NERA, 2007 undertook the following illustrative example of a QALY calculation:
Assuming that the number of recreational users per year (N) is 5000, the risk of infection during the year (R) is 18/1000, the average duration of illness as a fraction of a year (D) is 3/365 and the value of a QALY (V) is £30,000 and assuming that the loss of quality of life during the period of illness is total, this would then lead to an estimate of the annual cost of the health impact (=N*R*D*V) of £22,000 per year. The corresponding discounted present value of such a stream of annual costs in perpetuity, if discounted using the pure time preference rate for utility of 1.5% specified in the HMT Green Book, is £1.5million. NERA states ‘that discounting this figure at the time preference rate for monetary income would not be correct as the monetary value of health benefits increases with income. The pure time preference rate is the rate appropriate for discounting marginal utility.’35
5.40. Other specific issues include:
• as set out above there is uncertainty associated with the scale and nature of impacts of the CSO discharges due to a lack of (scientific and technical) information eg reduction in elevated health risk. This uncertainty is brought forward into the benefits estimates as it limited what the Stated Preference study could tell the survey respondents about the benefits of the options that they were being asked to value. However, it should be noted that the study tried to address, in part, this issue by ensuring that the limits of the scientific knowledge were made clear to the respondents in terms of how the impacts were described.
34 Available at http://www.hm-treasury.gov.uk/media/8AB/54/Managing_risks_to_the_public.pdf 35 Refer NERA (2007), Thames Tideway Cost Benefit Analysis, page 29.
34
• as WTP studies are based on asking people to value goods through the use of surveys, the context which people are asked about their values will affect their preferences for the good in question and therefore the values (ie WTP) they express. For example, asking questions about one environmental benefit (such as a cleaner river), may yield different higher valuations from questions about allocating money across a wider set of benefits. In other words, by valuing a specific good in isolation can lead to sum totals of WTP in excess of available budget. It therefore could be argued that the reliability of the benefits jurisdiction valuations, where the position regarding options and costs of water investment are a wider set than for the Thames region alone, need to be treated with particular caution. However, it should be noted that ideally a person’s value for a good outcome should be based on consideration of all the alternative uses for their expenditure. This applies to both TW and non-Thames customers who were surveyed. One way to help mitigate this possible source of over-valuation in WTP is to include in the questionnaire reminders to respondents that there are other things they could spend their money on. These reminders were provided in this study along with an additional statement to respondents that there are other reasons why respondents water bills would be increasing. These reminders will not solve the problem completely and there is continuing debate in the field of environmental valuation about the appropriate context that should be provided in WTP surveys.
• As set out earlier, the study found a distance-decay effect ie WTP declined based on distance from the Tideway. The distance-decay function (in particular its statistical specification) therefore makes a significant difference to the average WTP. However, as noted in Eftec (2006) there were very few sample points outside TW area so the resulting function is largely influenced by the outside TW sample. If there is an area close to the tideway in which values decline very slowly then depending on how large such an area is the function used might not model it very well. More statistical investigation would be need to determine as conclusively as possible what the best specification of the function is.
• the final water quality modelling results included an allowance for population increase in London up to 2021. The WTP estimates were aggregated based on the current population in TW area and beyond. Therefore the population increase included in the modelling is not reflected in the WTP estimates. It should be noted that as part of the Cost Benefit Analysis a sensitivity was undertaken that adjusted the WTP estimates for forecast population growth. See discussion below and refer to Annex 4.

35
Other Benefits Olympic Benefits associated with Option 1c phased
5.41. The Stated Preference Study also attempted to test whether respondents thought it important to avoid the risk of CSO discharge at Abbey Mills happening during the 2012 London Olympics and if so, whether they would be willing to pay over and above what they stated they would pay for the engineering options. This is a difficult benefit to define, measure and therefore value.
Table 3: Response to survey question regarding whether something should be done to reduce the risk of a CSO during the 2012 London Olympics Response TW (%) Non-TW (%) Yes 74.8 80.5 No 20.2 14.6 Don’t know 5.0 4.9 (Source: Eftec, 2006)
5.42. The above table shows that the majority of respondents stated that something should be done. However, when asked to state their WTP the number of those that agree to pay reduced significantly.
Table 4: Percentage of respondents willing to pay extra to reduce the risk of CSO during the 2012 London Olympics Response TW (%) Non-TW (%) Yes 51.4 59.4 No 42.9 33.1 Don’t know 5.7 7.4 (Source: Eftec 2006) Table 5: Mean additional WTP to avoid risk of CSO during the 2012 London Olympics Administrative Jurisdiction
(TW customer household) Benefits Jurisdiction (English households)
Unit WTP £/hh/year
Unit WTP £/hh/year
To avoid CSO happening during 2012 London Olympics
4.28 (3.17 -5.39)
4.90 (3.86-5.93)
Source: Thames Water (2006d) The figures in brackets represent the 95% confidence intervals and all estimates exclude protest zeros.
5.43. The mean willingness to pay more to avoid a discharge during the Olympics was positive36, although the median WTP for both Thames Water and non-Thames Water customers were zero, indicating that if there had been a referendum on the additional
36 A sensitivity analysis was undertaken which shows the impact of the overall CBA of taking these estimates into account.
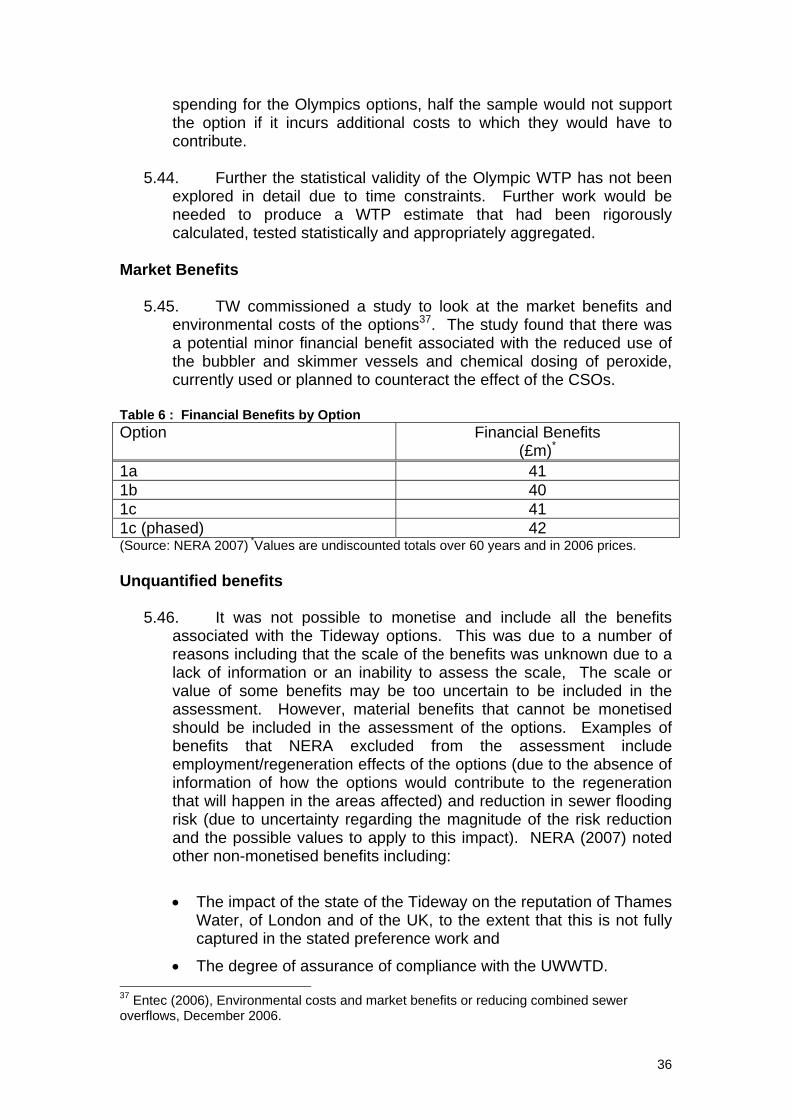
36
spending for the Olympics options, half the sample would not support the option if it incurs additional costs to which they would have to contribute.
5.44. Further the statistical validity of the Olympic WTP has not been
explored in detail due to time constraints. Further work would be needed to produce a WTP estimate that had been rigorously calculated, tested statistically and appropriately aggregated.
Market Benefits
5.45. TW commissioned a study to look at the market benefits and environmental costs of the options37. The study found that there was a potential minor financial benefit associated with the reduced use of the bubbler and skimmer vessels and chemical dosing of peroxide, currently used or planned to counteract the effect of the CSOs.
Table 6 : Financial Benefits by Option Option Financial Benefits
(£m)* 1a 41 1b 40 1c 41 1c (phased) 42 (Source: NERA 2007) *Values are undiscounted totals over 60 years and in 2006 prices. Unquantified benefits
5.46. It was not possible to monetise and include all the benefits associated with the Tideway options. This was due to a number of reasons including that the scale of the benefits was unknown due to a lack of information or an inability to assess the scale, The scale or value of some benefits may be too uncertain to be included in the assessment. However, material benefits that cannot be monetised should be included in the assessment of the options. Examples of benefits that NERA excluded from the assessment include employment/regeneration effects of the options (due to the absence of information of how the options would contribute to the regeneration that will happen in the areas affected) and reduction in sewer flooding risk (due to uncertainty regarding the magnitude of the risk reduction and the possible values to apply to this impact). NERA (2007) noted other non-monetised benefits including:
• The impact of the state of the Tideway on the reputation of Thames Water, of London and of the UK, to the extent that this is not fully captured in the stated preference work and
• The degree of assurance of compliance with the UWWTD. 37 Entec (2006), Environmental costs and market benefits or reducing combined sewer overflows, December 2006.
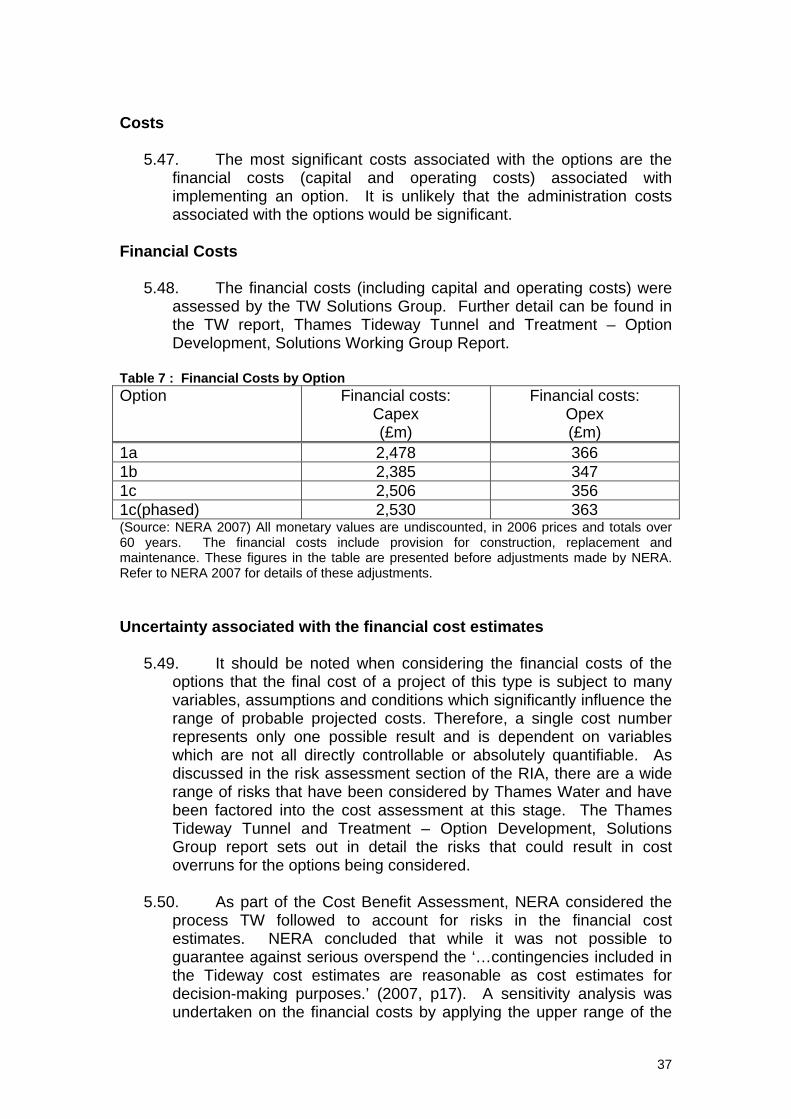
37
Costs
5.47. The most significant costs associated with the options are the financial costs (capital and operating costs) associated with implementing an option. It is unlikely that the administration costs associated with the options would be significant.
Financial Costs
5.48. The financial costs (including capital and operating costs) were assessed by the TW Solutions Group. Further detail can be found in the TW report, Thames Tideway Tunnel and Treatment – Option Development, Solutions Working Group Report.
Table 7 : Financial Costs by Option Option Financial costs:
Capex (£m)
Financial costs: Opex (£m)
1a 2,478 366 1b 2,385 347 1c 2,506 356 1c(phased) 2,530 363 (Source: NERA 2007) All monetary values are undiscounted, in 2006 prices and totals over 60 years. The financial costs include provision for construction, replacement and maintenance. These figures in the table are presented before adjustments made by NERA. Refer to NERA 2007 for details of these adjustments. Uncertainty associated with the financial cost estimates
5.49. It should be noted when considering the financial costs of the options that the final cost of a project of this type is subject to many variables, assumptions and conditions which significantly influence the range of probable projected costs. Therefore, a single cost number represents only one possible result and is dependent on variables which are not all directly controllable or absolutely quantifiable. As discussed in the risk assessment section of the RIA, there are a wide range of risks that have been considered by Thames Water and have been factored into the cost assessment at this stage. The Thames Tideway Tunnel and Treatment – Option Development, Solutions Group report sets out in detail the risks that could result in cost overruns for the options being considered.
5.50. As part of the Cost Benefit Assessment, NERA considered the
process TW followed to account for risks in the financial cost estimates. NERA concluded that while it was not possible to guarantee against serious overspend the ‘…contingencies included in the Tideway cost estimates are reasonable as cost estimates for decision-making purposes.’ (2007, p17). A sensitivity analysis was undertaken on the financial costs by applying the upper range of the
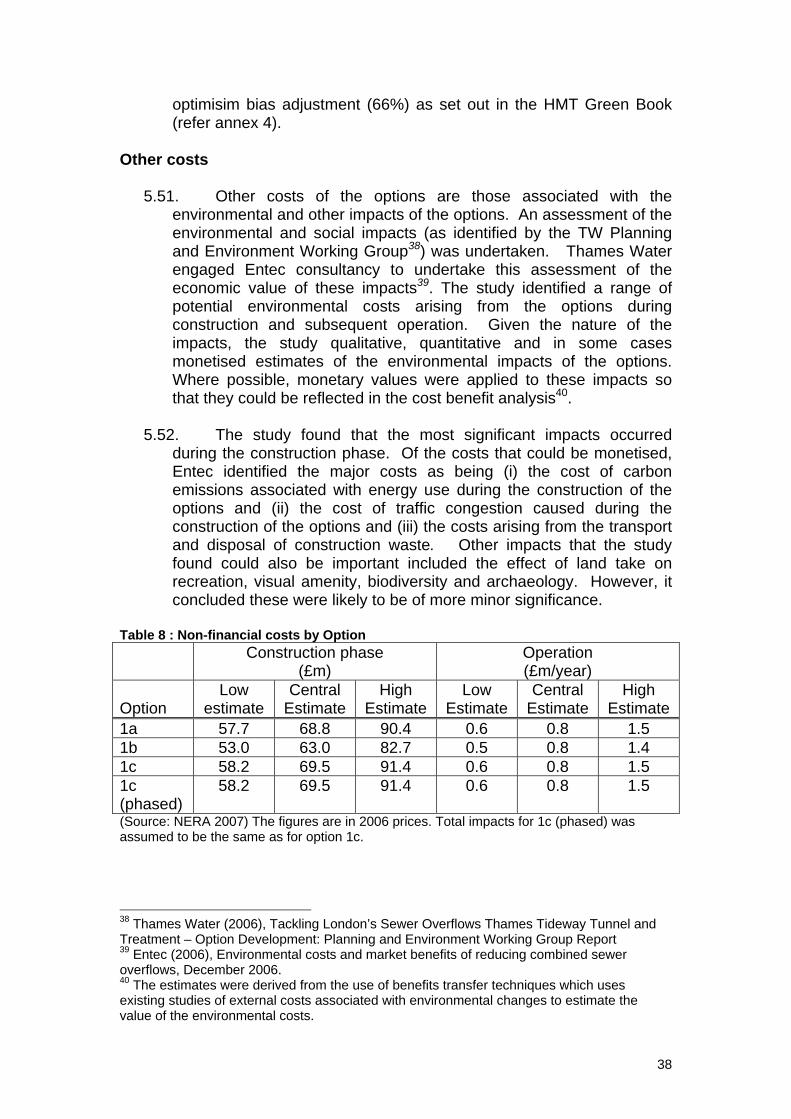
38
optimisim bias adjustment (66%) as set out in the HMT Green Book (refer annex 4).
Other costs
5.51. Other costs of the options are those associated with the environmental and other impacts of the options. An assessment of the environmental and social impacts (as identified by the TW Planning and Environment Working Group38) was undertaken. Thames Water engaged Entec consultancy to undertake this assessment of the economic value of these impacts39. The study identified a range of potential environmental costs arising from the options during construction and subsequent operation. Given the nature of the impacts, the study qualitative, quantitative and in some cases monetised estimates of the environmental impacts of the options. Where possible, monetary values were applied to these impacts so that they could be reflected in the cost benefit analysis40.
5.52. The study found that the most significant impacts occurred
during the construction phase. Of the costs that could be monetised, Entec identified the major costs as being (i) the cost of carbon emissions associated with energy use during the construction of the options and (ii) the cost of traffic congestion caused during the construction of the options and (iii) the costs arising from the transport and disposal of construction waste. Other impacts that the study found could also be important included the effect of land take on recreation, visual amenity, biodiversity and archaeology. However, it concluded these were likely to be of more minor significance.
Table 8 : Non-financial costs by Option Construction phase
(£m) Operation (£m/year)
Option
Low estimate
Central Estimate
High Estimate
Low Estimate
Central Estimate
High Estimate
1a 57.7 68.8 90.4 0.6 0.8 1.5 1b 53.0 63.0 82.7 0.5 0.8 1.4 1c 58.2 69.5 91.4 0.6 0.8 1.5 1c (phased)
58.2 69.5 91.4 0.6 0.8 1.5
(Source: NERA 2007) The figures are in 2006 prices. Total impacts for 1c (phased) was assumed to be the same as for option 1c. 38 Thames Water (2006), Tackling London’s Sewer Overflows Thames Tideway Tunnel and Treatment – Option Development: Planning and Environment Working Group Report 39 Entec (2006), Environmental costs and market benefits of reducing combined sewer overflows, December 2006. 40 The estimates were derived from the use of benefits transfer techniques which uses existing studies of external costs associated with environmental changes to estimate the value of the environmental costs.

39
Carbon Footprint
5.53. Information on the solution carbon footprint is at Annex 5. Area of Uncertainty/Sources of over or under-estimation of values
5.54. The main cause of uncertainty regarding the environmental and social costs estimates is the lack of information regarding the scale and nature of the environmental impacts. A comprehensive environmental impact assessment would need to be undertaken to improve the information regarding these impacts. In addition, as some of the values applied to the impacts were taken from existing studies rather than being original studies specific to the impacts of the options being considered, there is some inherent uncertainty associated with these estimates.. .
Cost Benefit Analysis
5.55. TW commissioned NERA to undertake a cost benefit analysis of the 2 principal options and their variants41. This would bring together the information on the financial costs (from the Solutions Group) and the studies commissioned by TW on environmental benefits and environmental and social costs42.
5.56. A summary of the CBA is set out in the Thames Water Summary
Report (section 6). Table 9: Cost Benefit Measures by Option
(Source: NERA 2007) All monetary values in 2006 prices, discounted to Oct 2006. * This ranking takes account of options being considered in the RIA. As NERA analysis covered both the full tunnel and two tunnel options, the ranking shown in the NERA report for this option was 7.
5.57. Key findings of the Cost Benefit analysis include:
• financial costs and monetised benefits are the largest element of costs and benefits of the options
41 NERA (2007), Thames Tideway Cost Benefit Analysis. 42 The appraisal period used was 60 years and the HMT Green Book discount rate of 3.5% (declining) was used.
Administrative Jurisdiction (TW customer households)
Benefits Jurisdiction (English Households)
Options NPV(£m)
NPV Rank
Benefit/Cost Ratio
Benefit/ Cost ratio
rank
NPV(£m)
NPV rank
Benefit/ Cost Ratio
Benefit/Cost ratio rank
1a -495 1 0.75 1 1,938 1 1.97 1 1b -1,055 4* 0.45 4 -61 4 0.97 4 1c -517 2 0.74 2 1,916 2 1.95 2 1c (phased) -606 3 0.71 3 1,826 3 1.87 3

40
• -.none of the options have a positive net present value for administrative jurisdiction ie Thames Water customer households.
• -Given that CBA should identify all costs and benefits, the results for the benefits jurisdiction should be considered. Option 1a, 1c and 1c (phased) have positive NPV values and are ranked in that order. There is no substantial difference between them on cost benefit grounds.
• Option 1b does not have a positive NPV for the Benefits jurisdiction. Uncertainties in the Cost Benefit Analysis
5.58. Given the uncertainty inherent in the analysis, a switching analysis43 and a number of sensitivity tests were undertaken. The results of the switching analysis for the benefit jurisdiction showed that for the three highest ranking options (ie option 1a, 1c and 1c (phased)), costs would have to approximately double relative to the benefits for the NPV to fall to zero. Conversely, benefits for these options would have to fall by approximately half for them to cease to be cost beneficial. For the Administrative Jurisdiction all of the Options have cost benefit ratios below 1. Therefore the benefits would have to increase or costs reduce for the options to become cost-beneficial on this measure.
5.59. As the assessment of costs and benefits of the options includes
a number of assumptions and uncertainties, there exist other plausible values for these impacts if the assumptions changed. In order to test the implication of changes to these assumptions, NERA undertook a number of sensitivity tests whereby some of the assumptions were changed and the new net present values and benefit cost ratios calculated. These changes differed in both their magnitude and direction of potential impact on estimated costs and benefits. The details and results of the sensitivity analysis are set out at annex 4. Full details of the sensitivity analysis is set out in section 8 of NERA (2007).The changes to the assumptions were:
• Time horizon for appraisal (extended from 60 to 100 years)
• Financial costs (increase in contingency costs to allow for greater optimism bias in the estimates)
• Monetised non-financial costs and financial benefits (upper and lower bound estimates used)
• Non-financial benefits (nominal estimates included)
• Assumed cost of private financing (TW cost of capital used)
• Population growth
43 Switching analysis identifies the magnitudes of changes to costs and benefits that would be required to achieve a cost benefit ratio of one.
41
• Inclusion of estimates of sewer flooding benefits
• Inclusion of estimates of the Olympic benefits
5.60. The sensitivity analysis demonstrated that by changing assumptions regarding costs (i.e. higher outturn costs) or the value of non-market benefits would reduce the NPVs or cost benefit ratios, only one of the sensitivity tests alters the ranking of the options. This occurred when the results of the valuation of the Olympic benefits were included in the analysis. This had the result of producing a significantly higher NPV and cost-benefit ratio for option 1c when compared with the other option 1 variants. NERA (2007) notes that both a poor outturn on costs and benefits or an alternative view of the status of WTP benefits could reduce the NPVs or benefit-cost ratios of the options.
Financing and Funding of Options
5.61. As stated previously, Thames Water would be responsible for delivery of the infrastructure options under consideration. To the extent that delivery of an option would be a function of Thames Water as the sewerage undertaker, the present system of economic regulation of the water industry requires Ofwat to secure that this was carried out properly and that the company was able to finance it.
5.62. Ofwat, as economic regulator, is responsible for determining price limits. These are the annual increases (or decreases) in charges that appointed water companies can make, and reflect what a company needs in order to finance the provision of services to customers.
5.63. For each company the price limits set by Ofwat apply to a basket of tariffs including measured and unmeasured charges for households, non-households and trade effluent customers. Individual tariffs within the basket may increase or decrease by more or less than the price limit but the average increase in charges should not exceed the price limit. Companies are responsible for deciding individual charges.
5.64. Each company is required to comply with its licence condition E which states that companies must not show undue preference or undue discrimination in their charging policies. This means that, where possible, there should be no cross subsidy between different classes of customer (eg households and non households). When companies submit their tariff proposals each year Ofwat checks to ensure that they comply with relevant licence conditions, such as condition E and any guidance on charging from the secretary of state.
5.65. Ofwat sets price limits for each company at periodic reviews conducted every five years. In cases where a company’s circumstances change within the five year period, Ofwat has

42
established procedures (eg interim determinations) to ensure that the company can continue to finance its functions.
5.66. Given the scale and nature (eg associated risks such as cost
overruns) of the options being considered in this RIA, Thames Water has commissioned a specialist consultant to undertake a study looking into how large capital projects could be funded. The purpose of the study is to examine whether the current regulatory regime is appropriate to deal with such projects and whether alternative approaches or delivery structures (eg a Private Finance Initiative-style arrangement) are available eg in terms of the allocation of risk. Further information regarding this study can be found in Thames Water's Tackling London's Sewer Overflows, Summary Report (section 8). The study is yet to be completed.
Bill Impacts
5.67. Ofwat has estimated the incremental bill impacts associated with the options. These bill impacts were based on preliminary cost information provided by Thames Water. Ofwat used its Aquarius 3 financial model, version 6.1 which runs over the period to 2029-30. Further information about the financial model can be found at http://www.ofwat.gov.uk/aptrix/ofwat/publish.nsf/Content/aq3_home
5.68. There are several sources of uncertainty associated with the
estimation of the bill impacts that should be noted.
5.69. The incremental bill impacts are measured as the difference between a base case (ie water bills without Tideway options) and each option. For the base case Ofwat included an allowance for future investment over the period that has been modelled (2009/10 – 2029/30). As future levels of investment (without considering the options) over this period are not known with certainty at this stage, the base case estimates include assumptions on future investment requirements across the range of TW services. Changes to these assumptions in the base case and any change to the level of investment associated with either the base case or the options modelled will lead to changes to in the incremental bill impacts of the options.
5.70. The incremental bill impacts reflect the cost of the design and
construction of the tunnelling options. They do not take account of longer term issues such as ongoing costs associated with the maintenance of the tunnel solutions and asset replacement costs which will impact on bills beyond 2029-30.
5.71. The financing of capital investment will also impact on costs,
and therefore customer bills. The financial assumptions used to model

43
2006-07
Maximum£
Year
Basecase
Financeability 61 2016-17Option 1a: Full Tunnel 7.2 diameter
36 2017-18Financeability 79 2016-17Option 1b: Full Tunnel 6.0 diameter 35 2017-18
Financeability 78 2016-17Option 1c: Full Tunnel 7.2 diameter (Abbey Mills – Beckton direct)
37 2017-18Financeability 80 2016-17Option 1c Phased: Full Tunnel 7.2 diameter (Abbey Mills – Beckton direct) Phased
37 2017-18Financeability 78 2016-17Option 1c phased part 1: Full Tunnel 7.2 diameter (Abbey Mills – Beckton) phased part 1
19 2012-13Financeability 68 2014-15
Year Movement from
2009-10£
%2009-10£
2014-15£
Movement from
2009-10£
Peak Bill£
282 375 93 386 2016-17 104 37%
282 398 115 422 2017-18 140 50%
282 397 115 420
282 398 116 423
2016-17 114 40%
282 402 120 423
282 390 108 396
Annual marginal bill effect
2017-18 141 50%
2017-18 138 49%
2017-18 140 50%
these bill impacts are the same as that used for the 2004 price review, including the approach taken for financeability44. Where necessary an allowance has been applied to price limits and therefore customer bills to achieve a satisfactory trend in the package of financial ratios. However, this is not the only approach that can be taken to ensure financeability. If alternative approaches were adopted, this would also change the scale and profile of the bill impacts of the options. Other changes to financing assumptions (eg cost of capital) will also lead to changes in the bill impacts.
The estimated base case and bill impacts are shown in table 10 below. Table 10: Estimate of Bill Impacts of Options
(Source: Ofwat) The annual profiles of the bills are shown in the graph below:
44 More information on the approach taken to financeability for PR04 can be found at: http://www.ofwat.gov.uk/aptrix/ofwat/publish.nsf/AttachmentsByTitle/pr04FD_chap15.pdf/$FILE/pr04FD_chap15.pdf
Tham es Tidew ay Full Tunnel O ptions - Annual B ills
250
270
290
310
330
350
370
390
410
430
2009
-10
2010
-11
2011
-12
2012
-13
2013
-14
2014
-15
2015
-16
2016
-17
2017
-18
2018
-19
2019
-20
2020
-21
2021
-22
2022
-23
2023
-24
2024
-25
2025
-26
2026
-27
2027
-28
2028
-29
2029
-30
Year
£
B ase C ase
O ption 1a
O ption 1b
O ption 1c
O ption 1cP hased
O ption 1cP hased part 1
Peak bills :O ption 1c phased in 2017-18: £423O ption 1c in 2017-18: £423O ption 1a in 2017-18: £422O ption 1b in 2017-18: £420O ption 1c phased part 1 in 2016-17: £396Basecase in 2016-17: £386
H ighest Im pacts:O ption 1c phased in 2017-18: £37O ption 1c in 2017-18: £37O ption 1a in 2017-18: £36O ption 1b in 2017-18: £35O ption 1c phased part 1 in 2012-13: £19
45
Affordability
5.72. Ofwat has assessed the incremental bill impacts associated with the options being considered in the RIA, these are set out in table 11 above and represent impacts for average annual household bills. In practice the bills faced by individual domestic customers of Thames Water will vary according to a number of factors, for example, whether they pay a measured or unmeasured charge.
5.73. The Cross-Government Review of Water Affordability 200445 set
out the position on water affordability across England and Wales. As noted in the TW summary report (section 7.2) water affordability needs to be seen in the context of the wide differences between water companies’ bill levels and individual customers’ circumstances; it has been an issue for some customers of some companies, particularly in the South West, but has not been at its most acute in the Thames area. However, additional costs will undoubtedly produce additional impacts for some customers
5.74. The estimated bill impacts of the options need to be considered
in the context of the general bill increases associated with base case which is shown in the graph above. The impact of estimated bill increases on domestic customers will depend on how income changes for different household groups over the period modelled.
5.75. There are difficulties in modelling the effect of these options on
TW’s customers. Income and family type information is collected on a regional or Government office area basis. These do not correlate to company boundaries, which are hydrological. In addition, some sewerage customers of TW pay their water bills to various water only companies, so it is not possible to determine the total bill impacts for these customers.
5.76. TW and the CCWater have made a general assessment of the
distributional effects on customers if the highest cost option, option 1c phased, were to be built and compared this with the base case. This work has had to make certain assumptions in order to model as closely as possible the effects of the addition of Thames Tideway costs onto average bills. These are modelling assumptions not predictions and, while indicative, will not show the actual effects on customers.
5.77. To model likely impacts in relation to household income TW and
CCWater have had to make assumptions that the income distribution of customers of Thames Water resembles within the corresponding areas the regional distribution of incomes for Inner London, Outer London, and elsewhere the overall distribution for the South East
45 Available at http://www.defra.gov.uk/environment/water/industry/affordability/pdf/wateraffordability.pdf
46
region, the distribution of bills for those customers and the increase in incomes to 2020. They have assumed that income distribution is as at 2004/05, and that incomes would increase in real terms by 2% each year.
5.78. TW looked at the proportion of income that the lowest paid, if
paying an average water and sewerage bill, would spend on their water and sewerage bills were option 1c to go ahead. Table 11 below shows that customers’ bills with both base case and Thames Tideway costs will increase over time, and that the poorest customers will be paying a higher proportion of their income in 2010 to 2020 than they do now. The impact of the additional Thames Tideway costs has meant that those households are likely to be spending a greater proportion of their income on water bills, over a longer time.
5.79. The cross Government review of water affordability looked at
determining the direction of change of affordability, specifically the indicator used was the number of households using more than 3% of disposable income on water bills. While the Government review examined income before housing costs, table 12 shows differences to be more marked when housing costs are also taken into consideration. There is potential for households with the lowest incomes spending more than 3% to increase, both with and without the additional cost of the Tideway option, but with the additional costs that level would be reached earlier and exceeded by a greater margin if a Tideway option goes ahead. The modelling suggests that when housing costs are considered, under the base case more than a fifth of TW customers would be paying over 3% of disposable household income on water bills between 2014/15 and 2018/19. Option 1c would bring this date forward by two years to 2012/13 and extend the period of this level of impact.
5.80. This pattern is true of each of the option, but the impact of each
of the less expensive options is likely to be less pronounced. Table 13 gives a summary of the impacts of each option on average water and sewerage bills.

47
Tab
le 1
1 -
Aff
ord
abili
ty d
ata
– H
ou
seh
old
wat
er a
nd
sew
erag
e b
ills
com
par
ed w
ith
inco
me
- B
efo
re H
ou
sin
g C
ost
s
20
05/0
6 20
06/0
720
07/0
820
08/0
920
09/1
020
10/1
120
11/1
220
12/1
3 20
13/1
420
14/1
520
15/1
620
16/1
720
17/1
820
18/1
920
19/2
020
20/2
1
Ave
rage
Tha
mes
Wat
er b
ill (b
ase
case
)46
£266
£2
73
£276
£2
79
£282
£2
99
£312
£3
33
£356
£3
75
£378
£3
86
£386
£3
84
£380
£3
74
Dis
posa
ble
hous
ehol
d in
com
e be
low
w
hich
wat
er b
ill >
3%
£8,8
75
£9,0
86
£9,1
99
£9,2
92
£9,4
02
£9,9
62
£10,
385
£11,
089
£11,
861
£12,
495
£12,
609
£12,
874
£12,
858
£12,
806
£12,
676
£12,
474
Pro
ject
ed lo
wes
t qui
ntile
inco
me
(nat
iona
lly) 47
£1
2,24
8 £1
2,91
3£1
3,17
2£1
3,43
5£1
3,70
4£1
3,97
8£1
4,25
7£1
4,54
2 £1
4,83
3£1
5,13
0£1
5,43
3£1
5,74
1£1
6,05
6£1
6,37
7£1
6,70
5£1
7,03
9
% o
f hou
seho
ld in
com
e sp
ent o
n w
ater
bill
for p
roje
cted
low
est q
uint
ile
inco
me
(nat
iona
lly)
2.2%
2.
1%
2.1%
2.
1%
2.1%
2.
1%
2.2%
2.
3%
2.4%
2.
5%
2.5%
2.
5%
2.4%
2.
3%
2.3%
2.
2%
Incr
ease
to a
vera
ge c
usto
mer
bill
du
e to
Tha
mes
Tid
eway
pro
ject
(O
ptio
n 1c
pha
sed)
£0
£0
£0
£0
£0
£3
£1
2 £2
1 £2
4 £2
7 £3
0 £3
4 £3
7 £3
6 £3
2 £2
8
Rev
ised
ave
rage
Tha
mes
Wat
er b
ill
incl
udin
g Th
ames
Tid
eway
sol
utio
n (u
nder
Opt
ion
1c p
hase
d) 48
£2
66
£273
£2
76
£279
£2
82
£302
£3
23
£354
£3
80
£402
£4
08
£420
£4
23
£420
£4
13
£403
Rev
ised
dis
posa
ble
hous
ehol
d in
com
e be
low
whi
ch w
ater
bill
>3%
£8
,875
£9
,086
£9
,199
£9
,292
£9
,402
£1
0,05
4£1
0,77
0£1
1,78
7 £1
2,67
8£1
3,40
3£1
3,60
3£1
4,00
3£1
4,09
2£1
3,99
9£1
3,75
8£1
3,41
9
Rev
ised
% o
f hou
seho
ld in
com
e sp
ent o
n w
ater
bill
for p
roje
cted
lo
wes
t qui
ntile
inco
me
(nat
iona
lly)
2.2%
2.
1%
2.1%
2.
1%
2.1%
2.
2%
2.3%
2.
4%
2.6%
2.
7%
2.6%
2.
7%
2.6%
2.
6%
2.5%
2.
4%
46 A
s pe
r Ofw
at m
odel
led
bill
impa
cts.
The
bas
e ca
se re
pres
ents
a p
laus
ible
leve
l of i
nves
tmen
t for
201
0 an
d be
yond
bas
ed o
n th
e be
st in
form
atio
n av
aila
ble
at th
is ti
me.
It d
oes
not f
orec
ast i
nput
s to
or p
redi
ct th
e ou
tcom
es fo
r the
200
9 pr
ice
revi
ew a
nd b
eyon
d. I
t sim
ply
prov
ides
the
base
line
from
whi
ch to
ass
ess
the
bill
impa
cts
of th
e co
sted
Tid
eway
opt
ions
. 47
200
4-05
bas
ed fr
om H
BA
I rep
ort 2
004/
05 ta
ble
2.3,
upl
ifted
to 2
006/
07 p
rices
@R
PI (
2.6%
200
5/06
, 3.3
% 2
006/
07),
assu
med
real
2%
per
ann
um g
row
th in
in
com
e –
low
est 2
0% o
f hou
seho
lds
belo
w th
is in
com
e le
vel
48 A
s pe
r Ofw
at m
odel
led
bill
impa
cts
for T
idew
ay o
ptio
n w
ith g
reat
est o
vera
ll bi
ll im
pact
(Opt
ion
1c)

48
Tab
le 1
2 -
Aff
ord
abili
ty d
ata
– H
ou
seh
old
wat
er a
nd
sew
erag
e b
ills
com
par
ed w
ith
inco
me
– A
fter
Ho
usi
ng
Co
sts
20
05/0
6 20
06/0
720
07/0
820
08/0
920
09/1
020
10/1
120
11/1
220
12/1
3 20
13/1
420
14/1
520
15/1
620
16/1
720
17/1
820
18/1
920
19/2
020
20/2
1
Ave
rage
Tha
mes
Wat
er b
ill (b
ase
case
)49
£266
£2
73
£276
£2
79
£282
£2
99
£312
£3
33
£356
£3
75
£378
£3
86
£386
£3
84
£380
£3
74
Dis
posa
ble
hous
ehol
d in
com
e be
low
w
hich
wat
er b
ill >
3%
£8,8
75
£9,0
86
£9,1
99
£9,2
92
£9,4
02
£9,9
62
£10,
385
£11,
089
£11,
861
£12,
495
£12,
609
£12,
874
£12,
858
£12,
806
£12,
676
£12,
474
Pro
ject
ed lo
wes
t qui
ntile
inco
me
(nat
iona
lly) 50
£9
,962
£1
0,50
3£1
0,71
3£1
0,92
7£1
1,14
6£1
1,36
9£1
1,59
6£1
1,82
8 £1
2,06
4£1
2,30
6£1
2,55
2£1
2,80
3£1
3,05
9£1
3,32
0£1
3,58
6£1
3,85
8
% o
f hou
seho
ld in
com
e sp
ent o
n w
ater
bill
for p
roje
cted
low
est q
uint
ile
inco
me
(nat
iona
lly)
2.7%
2.
6%
2.6%
2.
6%
2.5%
2.
6%
2.7%
2.
8%
2.9%
3.
0%
3.0%
3.
0%
3.0%
2.
9%
2.8%
2.
7%
Incr
ease
to a
vera
ge c
usto
mer
bill
du
e to
Tha
mes
Tid
eway
pro
ject
(O
ptio
n 1c
pha
sed)
£0
£0
£0
£0
£0
£3
£1
2 £2
1 £2
4 £2
7 £3
0 £3
4 £3
7 £3
6 £3
2 £2
8
Rev
ised
ave
rage
Tha
mes
Wat
er b
ill
incl
udin
g Th
ames
Tid
eway
sol
utio
n (u
nder
Opt
ion
1c p
hase
d) 51
£2
66
£273
£2
76
£279
£2
82
£302
£3
23
£354
£3
80
£402
£4
08
£420
£4
23
£420
£4
13
£403
Rev
ised
dis
posa
ble
hous
ehol
d in
com
e be
low
whi
ch w
ater
bill
>3%
£8
,875
£9
,086
£9
,199
£9
,292
£9
,402
£1
0,05
4£1
0,77
0£1
1,78
7 £1
2,67
8£1
3,40
3£1
3,60
3£1
4,00
3£1
4,09
2£1
3,99
9£1
3,75
8£1
3,41
9
Rev
ised
% o
f hou
seho
ld in
com
e sp
ent o
n w
ater
bill
for p
roje
cted
lo
wes
t qui
ntile
inco
me
(nat
iona
lly)
2.7%
2.
6%
2.6%
2.
6%
2.5%
2.
7%
2.8%
3.
0%
3.2%
3.
3%
3.3%
3.
3%
3.2%
3.
2%
3.0%
2.
9%
49 A
s pe
r Ofw
at m
odel
led
bill
impa
cts.
The
bas
e ca
se re
pres
ents
a p
laus
ible
leve
l of i
nves
tmen
t for
201
0 an
d be
yond
bas
ed o
n th
e be
st in
form
atio
n av
aila
ble
at th
is ti
me.
It d
oes
not f
orec
ast i
nput
s to
or p
redi
ct th
e ou
tcom
es fo
r the
200
9 pr
ice
revi
ew a
nd b
eyon
d. I
t sim
ply
prov
ides
the
base
line
from
whi
ch to
ass
ess
the
bill
impa
cts
of th
e co
sted
Tid
eway
opt
ions
. 50
200
4-05
bas
ed fr
om H
BA
I rep
ort 2
004/
05 ta
ble
2.3,
upl
ifted
to 2
006/
07 p
rices
@R
PI (
2.6%
200
5/06
, 3.3
% 2
006/
07),
assu
med
real
2%
per
ann
um g
row
th in
in
com
e –
low
est 2
0% o
f hou
seho
lds
belo
w th
is in
com
e le
vel
51 A
s pe
r Ofw
at m
odel
led
bill
impa
cts
for T
idew
ay o
ptio
n w
ith g
reat
est o
vera
ll bi
ll im
pact
(Opt
ion
1c)

49
Table 13: Summary of each option’s impact on lowest quintile incomes Option
Peak Bill Peak year for
Bill impact Peak
percentage of upper limit of
lowest income quintile
Peak year (in terms of
proportion of income)
Before Housing Costs Current bill (2006/07) £273 2.1% Base case £386 2016/17 2.5% 2014/15 Options1c phased £423 2017/18 2.7% 2016/17 Option 1c phased part 1
£396 2016/17 2.6% 2014/15
After Housing Costs Current bill (2006/07) £273 2.6% Base case £386 2016/17 3.0% 2014/15 Options 1c phased £423 2017/18 3.3% 2016/17 Option 1c phased part 1 £396 2016/17 3.2% 2014/15
5.81. 33% of households in inner London have incomes in the lowest
quintile nationally, 22% in outer London and 16% in the Greater South East, 2.8 million households in total52. These are the households that would be most affected should bills rise to levels of around £423. Nationally the types of households most likely to be within that range are those on fixed incomes such as pensioners, those relying on benefits, and single parents.
5.82. The Government takes affordability seriously. Since the ban on
disconnection in 2000 no household customer need fear being cut-off because of their inability to pay their bill.
5.83. The Government last reviewed water affordability in the cross-
Government review of water affordability report in December 200453. That recommended that:
• the vulnerable groups regulations54 should be extended to increase
eligibility - since publication the regulations have been extended to include those under 19 and in full time education and a more inclusive list of qualifying medical conditions;
52 DWP data - households below average income 53 http://www.defra.gov.uk/environment/water/industry/affordability/index.htm 54 The vulnerable groups tariff was set up to ensure that vulnerable customers on meters would not have to cut down on essential water use. The regulations cap bills at the average water and sewerage bill for a company area. Households are eligible for the vulnerable groups tariff if
o they are metered, o on certain income-related benefits, and o suffer either from medical conditions which cause substantial increase in use
of water or have three or more dependent children under the age of 19.

50
• a local pilot scheme of water affordability should be carried out – the pilot study is currently underway in the South West, we expect the results in Summer 2007;
• companies should spread and deliver best practice – Defra is working closely with The Consumer Council for Water and other stakeholders to encourage best practice by companies in administrating the vulnerable groups tariff; and
• studying effects of the charging system – Defra has been working closely with water companies and Ofwat to look at the likely distributional consequences of a range of tariffs for water consumers and will report to Ministers in the early part of 2007.
Progress in fulfilling the recommendations of the report continues to be made and Defra will continue to work closely with stakeholders to think of innovative ways to tackle this issue. 6. SMALL FIRMS IMPACT TEST
6.1. As it was not possible to identify small businesses from TW customer database, approximately 1,000 small businesses in the area covered by TW sewerage service were contacted using the DTI small business service database. The letter sent by DTI on behalf of Defra on 21 December drew the attention of small businesses to the update on progress published on the Defra website and noted that either of the two options would entail significant investment by TW which would be reflected in customer sewerage charges. Two of the five substantive replies received supported option 1 while a third was strongly supportive of action without specifying a preferred option. One respondent was unable to comment in the absence of specific information on the effect of the measures on customer bills, and one challenged the approach arguing that investment in recycling of oils and fats would improve the efficiency of the sewerage system.
7. COMPETITION ASSESSMENT (i) Competition effects in the market for the provision of sewerage services
7.1. The features of the water and sewerage industry limit the scope for direct market competition. There are currently 24 vertically integrated, incumbent water undertakers in England and Wales55. All 24 companies are statutory undertakers, with duties and responsibilities set out in primary and secondary legislation. Undertakers must also comply with conditions set out in their Instruments of Appointment,
55 Ten of these provide water and sewerage services, while the remaining 14 provide only water services. In areas where a water only company provides water, a water and sewerage company provides the sewerage service.
51
including observing price limits set by Ofwat applying to charges for the majority of their customers.
7.2. Undertakers are appointed for a specific geographic area, and
undertake (either directly or sometimes by contracting out) every aspect of the provision of water services, ie ownership and control of the operation of abstractions, reservoirs, pumping stations, treatment works and all elements of the public water distribution network.
7.3. Given the lack of market competition faced by companies56, Ofwat’s
regulatory regime is incentive based and decisions on price setting are informed by a comparative competition framework which compares the performance of each company and sets prices on the basis of the best performing company. The effectiveness of the regulatory framework in providing companies with incentives to improve their efficiency and be innovative is generally accepted to be more limited than market competition where that is possible.
7.4. Therefore, given the lack of market competition for provision of
sewerage services in the Thames area, it is not envisaged that there will be any competition effects in this market.
(ii) Competition effects on Non-domestic Thames Water Customers
7.5. The options under consideration in the RIA will result in increases in the sewerage bills of all TW sewerage customers, including non-domestic customers of TW. Charges to non-domestic customers typically vary according to the volume of water that the customer uses and the volume of wastewater or trade effluent that it discharges. Small non-domestic usually pay the same volumetric rates as household customers, although their standing charges may differ according to the size of their water meter. It is therefore not possible to provide an average or ‘typical’ non-domestic customers.
7.6. It should be noted that water companies licences specify that
companies must not show undue preference or undue discrimination in their water and sewerage charging polices ie there should be no cross-subsidy between different classes of customer (eg household and non-household).
7.7. Without information on the level of sewerage charges associated with
the options for non-domestic customer groups and how they contribute to non-domestic customers’ cost base, it is not possible to determine the impacts of increased bills. The impact on competitive position would depend on the circumstances of each company, the extent to
56 The Water Act 2003, which received Royal Assent on 20 November 2003 extended the opportunity for competition within the England and Wales water supply industry so that water non household customers with an annual consumption of at least 50 megalitres are eligible to switch supplier. This does not apply to the provision of sewerage services.
52
which water and sewerage charges were a significant part of their overall cost structure, and the extent to which they could recover any significant impact by increasing prices without materially affecting their ability to compete in their respective markets.
8. ENFORCEMENT, SANCTIONS AND MONITORING
8.1. Enforcement of compliance with the Urban Waste Water Treatment Directive is ultimately the responsibility of the Commission of the European Communities and the European Court of Justice. Further information on these enforcement mechanisms is given in section 2.
8.2. The Urban Waste Water Treatment Regulations 1994 which
implement the Directive in England and Wales supplement the general duty imposed on sewerage undertakers by Section 94 of the Water Industry Act 1991 (general duty to provide a sewerage system) by requiring the undertaker (in this case TW) to secure that collecting systems are provided by specific dates and comply with certain requirements. TW is also required to comply with discharge consents issued by the EA under the Water Resources Act 1991 which must themselves secure compliance with the requirements of the Directive (including limitation of pollution of receiving waters due to storm water overflows).
8.3. In the event that TW is unwilling or unable to deliver a solution for
dealing with the currently unsatisfactory overflows in the tidal Thames and River Lee which meets these requirements, enforcement action could be taken by the Secretary of State for the Environment, Food and Rural Affairs, the Water Services Regulation Authority or the EA depending on the precise nature of the failure of delivery. In addition the Ofwat could also require adjustment of price limits and customers’ bills to reflect any saving by the company.
9. IMPLEMENTATION, AND DELIVERY PLAN
9.1. Defra ministers are responsible for agreeing the way forward with Government colleagues and for conveying the outcome to TW and the economic and environmental regulators. It will then be for TW to prepare and implement an Action Plan and the scheme. This Action Plan will need to make provision for planning and funding applications as well as detailed feasibility, design and delivery plans and milestones will need to be agreed so that progress can be monitored.
53
10. POST IMPLEMENTATION MONITORING
10.1. The option selected for further development and implementation is the one judged to secure cost-effective delivery of environmental benefits and compliance with EU obligations. No formal review date can be set at this stage as this is dependent on the progress of the Commission’s consideration of the Government’s response to their reasoned opinion and the outcomes of any future action in the European Court of Justice.
11. SUMMARY AND RECOMMENDATION
11.1. The driver for this decision is the need to comply with the requirements of the 1991 Urban Waste Water Treatment Directive, as transposed in England and Wales in 1994. Government has accepted that more measures are needed to limit pollution from some of the storm water overflows that are part of the Beckton and Crossness sewerage systems.
11.2. The Thames Tideway Strategic Study found that combined
sewer overflows of these systems discharge some 32 million cubic metres per year of sewage mixed with rainwater, following moderate and heavy rainfall in London.
11.3. The EA considers that these frequent (average once a week)
and large quantities of overflow discharges are causing:-
• adverse environmental impacts on fish species; • unacceptable aesthetic issues; and • elevated health risks for recreational users of the Thames.
11.4. The EA considers, in the light of all this, that 36 out of the 57
overflows are unsatisfactory and require improvement.
11.5. The issue to be decided therefore, against the background of EU obligations, statutory requirements, the findings of studies since 2000, and the TTSS/EA objectives and advice, is how far we need to go to reduce overflows and limit their pollution during storms from these sewerage systems.
11.6. From studies it was found that a tunnel to intercept overflow
discharges and store/transfer them for treatment was the appropriate approach as it provided the required additional capacity, protection and flexibility. Consequently Minister’s instruction of 27 July 2006 to TW requested the consideration of two short-listed options, both involving large scale tunnels to pick up and store discharges, and transfer them for treatment. It was considered that other options would simply not be adequate in relation to EA advice, and would not fulfil our legal obligations.
54
55
Annex 1 Options and detailed information to be provided by Thames Water (extract from MSCCE letter of 27 July) The proposed options for detailed development, assessment and costing work by 31 December 2006 are: Option 1: a tunnel over 30km long to intercept intermittent discharges from
unsatisfactory overflows along the length of the tidal Thames and convey the waste water for treatment in East London. Based on the work of the Thames Tideway Strategic Study the options appear to be a 6 metre diameter tunnel (the minimum assessed to avoid operational problems), and a 7.2 metre diameter tunnel.
Option 2: two shorter tunnels, in west and east London, to intercept
intermittent discharges along these stretches of the river, and probably additional treatment in east London. Part of the work is to produce a better assessment of the performance and the environmental protection provided by such a scheme.
I should also like information to enable a decision on whether these options could be supplemented by smaller scale measures eg for boats to collect sewage derived litter from remaining overflow discharges. For each option the factors that the further work must include are:
a) collected waste water should receive secondary treatment or an
equivalent treatment except in situations such as unusually heavy rainfall where we are required to take measures to limit pollution from the overflows. Thames Water, with the Environment Agency, should assess and optimise the level of treatment required, and the preferred location for the provision of additional treatment. I’m aware that the London Thames Gateway Development Corporation, the Urban Development Corporations and the Greater London Authority want to be involved in discussions of location options.
b) achievement of environmental objectives developed by the Thames
Tideway Strategic Study, taking into account planned capacity increases and treatment improvements at Beckton, Crossness, Mogden and Riverside sewage treatment works and in-river measures. The extent to which the options achieve the treatment requirements and objectives, limit pollution from the storm water overflows, and represent best technical knowledge not entailing excessive cost, will enable views to be taken on which measures are appropriate to meet the requirements of the Urban Waste Water Treatment Directive;
c) predicted financial costs profiles of options and optimum variations so
that Ofwat can calculate the consequences of each for customer bills;

56
d) optimum phasing of an overall project, including consideration of whether:
i) a tunnel from Abbey Mills to Charlton to get overflows away from
the Olympic Park and Lower Lea Valley could be built by 2012, as part of a tunnel to take the overflows for treatment at Crossness or Beckton.
ii) a tunnel from Abbey Mills to Beckton, to reduce spills to the
River Lee, and an assessment of whether it could be in place by 2012.
Assessments will need to be made of the additional costs of any abortive work or stranded assets from phasing elements of construction, or doing work to a faster than normal timetable;
e) the estimated delivery timetable of options and variations to achieve an
effective and efficient use of resources; f) an assessment of all costs and benefits (including environmental and
social costs and benefits), of the options and variations. Given the time period, it is expected that this assessment will be largely based on existing analysis by the Thames Tideway Strategic Study. However this will be dependent on whether the results of the existing analysis are applicable to the current situation. Issues that will need to be considered include the length of time that has elapsed since the willingness-to-pay study and the assessment of the current baseline from which to undertake the assessment of costs and benefits. This work should comply with the HMT Green Book;
g) an assessment of the options and their variations in terms of wider issues:
• affordability; • likely requirements of the Water Framework Directive; • climate change; • regeneration in east London; • forecast developments eg housing, in catchment of system;
sewer flooding; • flexibility and robustness of options which are expected to last
for many years, to be adjusted to new demands eg improve water quality;
h) feasibility, issues and risks (planning, environmental, engineering and
financial) associated with construction and operation. Much of this information is available in existing reports, but a specific issue is odour management; and
i) assessment of sustainability issues such as energy use, renewable
energy, and energy recovery (energy from waste).
57
Planning, land, and funding Thames Water to do as much as possible, with others, to proactively move forward on resolving planning, land, and funding issues. On planning and land the preferred approach must be for all leading players and planning authorities to engage with each other and stakeholders to identify and seek to resolve issues before a planning application is made, and build commitment to moving forward quickly. On funding I am aware of the work on financing options that Thames Water has commissioned and am looking to Thames Water to liaise with Ofwat in taking forward this work so that investment is available at the right time for construction work to get underway.

58
Annex 2 References Entec (2006), Environmental costs and market benefits or reducing combined sewer overflows, December 2006. Eftec (2006), “Environmental costs and market benefits of reducing combined sewer overflows”, December 2006. NERA (2007), Thames Tideway Cost Benefit Analysis, January 2007. Thames Tideway Strategic Study (2005a), Steering Group Report, February 2005. Thames Tideway Strategic Study (2005b), Supplementary Report to Government, November 2005. Thames Water (2006a), Thames Tideway Tunnel and Treatment – Option Development, Objectives and Compliance Working Group Report, Volume I, December 2006. Thames Water (2006b), Thames Tideway Tunnel and Treatment – Option Development, Objectives and Compliance Working Group Report, Volume II, December 2006. Thames Water (2006c), Thames Tideway Tunnel and Treatment – Option Development Summary Report, December 2006. Thames Water (2006d), Thames Tideway Tunnel and Treatment – Option Development, Cost Benefit Working Group Report. Thames Water (2006e), Tackling London’s Sewer Overflows Thames Tideway Tunnel and Treatment – Option Development, Planning and Environment Working Group Report.
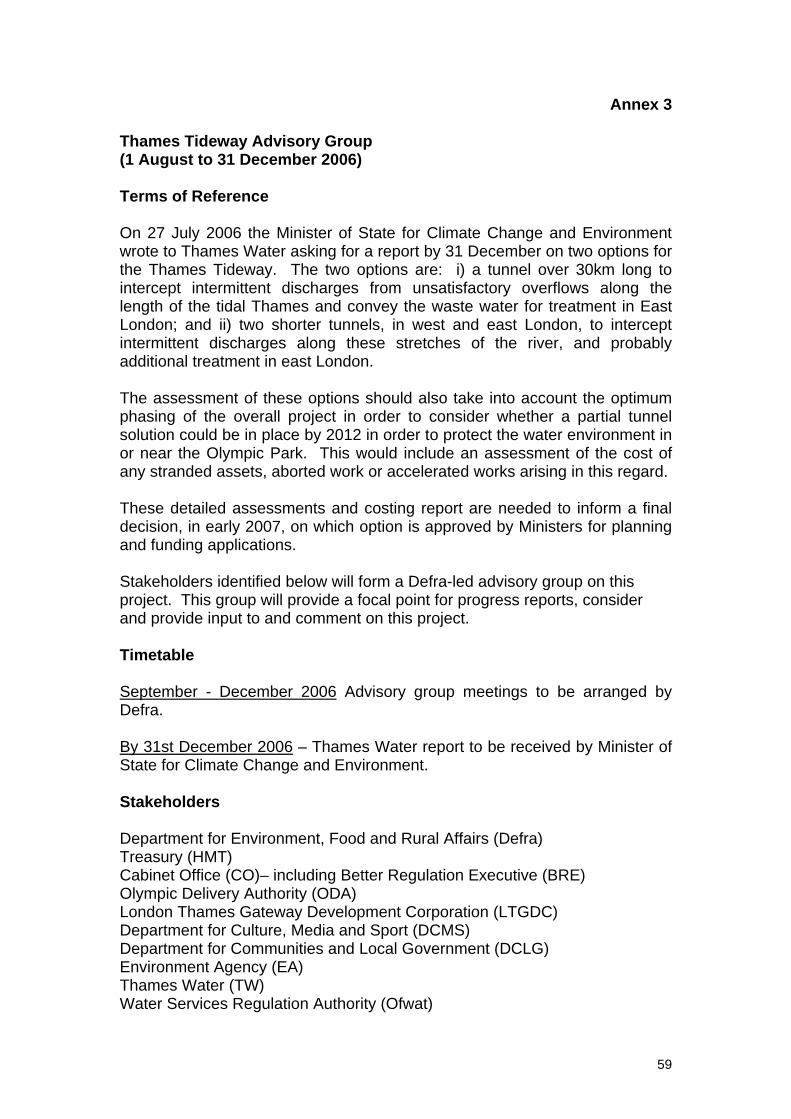
59
Annex 3 Thames Tideway Advisory Group (1 August to 31 December 2006) Terms of Reference On 27 July 2006 the Minister of State for Climate Change and Environment wrote to Thames Water asking for a report by 31 December on two options for the Thames Tideway. The two options are: i) a tunnel over 30km long to intercept intermittent discharges from unsatisfactory overflows along the length of the tidal Thames and convey the waste water for treatment in East London; and ii) two shorter tunnels, in west and east London, to intercept intermittent discharges along these stretches of the river, and probably additional treatment in east London. The assessment of these options should also take into account the optimum phasing of the overall project in order to consider whether a partial tunnel solution could be in place by 2012 in order to protect the water environment in or near the Olympic Park. This would include an assessment of the cost of any stranded assets, aborted work or accelerated works arising in this regard. These detailed assessments and costing report are needed to inform a final decision, in early 2007, on which option is approved by Ministers for planning and funding applications. Stakeholders identified below will form a Defra-led advisory group on this project. This group will provide a focal point for progress reports, consider and provide input to and comment on this project. Timetable September - December 2006 Advisory group meetings to be arranged by Defra. By 31st December 2006 – Thames Water report to be received by Minister of State for Climate Change and Environment. Stakeholders Department for Environment, Food and Rural Affairs (Defra) Treasury (HMT) Cabinet Office (CO)– including Better Regulation Executive (BRE) Olympic Delivery Authority (ODA) London Thames Gateway Development Corporation (LTGDC) Department for Culture, Media and Sport (DCMS) Department for Communities and Local Government (DCLG) Environment Agency (EA) Thames Water (TW) Water Services Regulation Authority (Ofwat)

60
Government Office for London (GOL) Greater London Authority (GLA) British Waterways (BW) Consumer Council for Water (CCWater) Olympics measures Another Defra-chaired group will co-ordinate the development of packages of measures to i) improve or protect the quality of the water environment in or near the Olympic Park, and in the Lower Lee Valley concerning sources of water pollution (other than the CSOs at Abbey Mills and Wick Lane), and ii) protect the Olympic Park should it not prove feasible to deliver the substantial engineering solution for Abbey Mills in time for the Olympic games. It is acknowledged that consideration of whether a partially complete tunnel solution can be delivered by 2012 to protect the Olympic Park Area from discharges during the 2012 games is an integral part of the assessment of the permanent tunnel solution undertaken by the main Thames Tideway Advisory Group. Defra Water Quality, 3 October 2006

61
Annex 4 Cost Benefit Analysis Sensitivity Analysis The assessment of costs and benefits of the options being considered in this RIA includes a number of assumptions and uncertainties. If these assumptions changed, then the estimates would also change. In order to determine how senstive the results of the analysis are to changes in the assumptions, Nera underook a sensitivity analysis. This annex provides a summary of the results of the sensitivity analysis for the options being considered in this RIA. Full details of the sensitivity analysis for the Cost Benefit Analysis are contained in NERA (2007), Thames Tideway Cost Benefit Analysis. The assumptions and factors that were tested in the sensitivity analysis set out in NERA (2007) include: (i) Period of appraisal Nera noted that physical life of a major asset like the Tideway tunnel options was assumed by the Thames Water Solutions Group to be in excess of 100 years57. However, projecting costs and, in particular, benefits over that timeframe is an area of considertable uncertainty. Therefore for the main CBA, Nera adopted a 60 year appraisal period. A 100 year appraisal timeframe was adopted in a sensitivity analysis. (ii) WTP estimates The stated preference study, which provided the estimates of the value of the environmental benefits, was based on surveying individuals in order to assess how they value (expressed through their willingness to pay) the benefits delivered by the options. This was done by asking respondents to provide an estimate of their willingness to pay in terms of a permanent increase in their water bill, starting in 2007. Nera argued that there was some uncertainty regarding whether respondents intended to state this monetary value expressed in real (i.e. monetary amounts with constant purchasing power) or nominal (i.e. constant monetary amounts with decreasing purchasing power). Therefore in the sensitivity analysis the nominal value of the WTP was held constant but the real value of the willingness to pay figures (per household) declined with inflation. That is, the future WTP values were adjusted downwards to account for the erosion of purchasing power caused by general price increases over time. The reduction in WTP for the options following this adjustment was for Option 1a - £1,229m, Option 1b - £578m and Option 1c and 1c (phased) - £1,229m. 57 For the options to remain operational over such a long period of time, components of the options would need to be replaced (i.e. STW assumed life is 60 years, pumping and power assets assumed life is 20yrs)

62
(iii) Financing costs: Nera noted that it may be appropriate to take explicit account of the cost of capital when assessing the costs and benefits of project options, where this is not achieved through the discounting procedures. This was due to the fact that raising private finance involved incurring a risk premium as compensation to debt and equity investors. On the assumption that the options would be funded privately ie by Thames Water, then consideration of the implications of raising private finance was relevant. The sensitivity analysis therefore considered the impacts that a private finance premium might have on an assessment of the costs and benefits of the options by assuming a real cost of capital of 5.5%. (iv) Optimism bias In the main CBA results included an allowance for risk and contingency based on the risk assessment undertaken by TW. As a sensitivity NERA considered the optimism bias upper bound adjustments (66%) for non-standard civil engineering recommended by the HM Treasury Green Book. (v) Sewer Flooding The report, Environmental costs and market benefits of reducing combined sewer overflows, by Entec (2006) identified the possibility that the options under consideration may lead to a reduction in the risk of sewer flooding to a small number of properties, in times of heavy rainfall. However, the magnitude of the reduction in risk is very uncertain. In addition, the value to attach to this impact is very uncertain. Nera therefore excluded this impact from the main cost benefit calculations. The sensitivity included this impact in the cost benefit calculations. (vi) Confidence intervals for non-financial costs and financial benefits The main cost benefit assessment by Nera included the central case estimates from the Entec report (2006) for the monetised social and environmental impacts. The sensitivity was undertaken using the estimated upper and lower bounds respectively. (vii) Impact of Population Growth A sensitivity was undertaken by adjusting the willingness to pay estimates for forecast population growth for England and the London government office as proxies for the Administrative and Benefits Jurisdictions. The annual population growth rates were then used to adjust the WTP values, by increasing the WTP estimates year on year by the forecast annual population growth rate. The source of the population growth forecasts was the ODPM statistical release 2006/0042, which can be found at the following link: http://www.communities.gov.uk/pub/242/TableE2003basedHouseholdProjections_id1164242.xls

63
(viii) Olympics The sensitivity analyses included a scenario where the additional mean willingness to pay estimates for the early delivery of a solution for the Olympics were included in the monetised cost benefit assessments. As explained in the main body of the RIA, these estimates need to be treated with caution as the statistical validity of the WTP estimates was not explored in detail in the TW assessment. The following table sets out the results of the sensitivity analysis for the options considered in this RIA for the Benefits Jurisdiction (English households). The results of the sensitivity analysis for the Administrative jurisdiction (TW customer households) can be found as an annex in Nera (2007).

Pag
e 64
of
65
Tab
le 1
4: S
ensi
tivi
ty A
nal
ysis
- S
um
mar
y (B
enef
its
Juri
sdic
tio
n)
B
ase
Cas
e (B
en
efit
s Ju
risd
icti
on
- E
ng
lan
d)
Ap
pra
isal
Per
iod
: 10
0 ye
ars
Op
tim
ism
Bia
s F
ina
nci
al B
en
efit
s an
d N
on
-fi
na
nci
al C
ost
s:
Hig
h V
alu
es
Fin
an
cial
Be
nef
its
and
No
n-
fin
an
cial
Co
sts
: L
ow
Val
ues
Op
tio
n
NP
V
Ran
k B
/C
rati
o
Ran
k N
PV
R
ank
B/C
ra
tio
R
ank
NP
V
Ran
k B
/C
rati
o
Ran
k N
PV
R
ank
B/C
ra
tio
R
ank
NP
V
Ran
k B
/C
rati
o
Ran
k
1a
1,93
8 1
1.
97
1
2,40
1 1
2.
16
1
1,41
1
1
1.56
1
1,
920
1
1.95
1
1,
949
1
1.98
1
1b
-6
1
4
0.97
4
12
0
4
1.06
4
-5
56
4
0.77
4
-7
7
4
0.96
4
-5
1
4
0.97
4
1c
1,
916
2
1.95
2
2,
380
2
2.13
2
1,
376
2
1.
54
2
1,89
8 2
1.
93
2
1,92
7 2
1.
96
2
1c p
ha
sed
1,
826
3
1.87
3
2,
290
3
2.05
3
1,
283
3
1.
48
3
1,80
8 3
1.
85
3
1,83
8 3
1.
88
3
R
edu
ced
Sew
er F
loo
din
g
Ris
k D
efla
ted
WT
P V
alu
es
WT
P A
dju
ste
d f
or
Fo
rec
ast
Po
pu
lati
on
G
row
th
1c (
ph
ased
): a
dd
itio
nal
WT
P t
o
avo
id r
isk
of
CS
O d
uri
ng
th
e 20
12 L
on
do
n O
lym
pic
s P
riva
te F
inan
cin
g C
ost
s
Op
tio
n
NP
V
Ran
k B
/C
rati
o
Ran
k N
PV
R
ank
B/C
ra
tio
R
ank
NP
V
Ran
k B
/C
rati
o
Ran
k N
PV
R
ank
B/C
ra
tio
R
ank
NP
V
Ran
k B
/C
rati
o
Ran
k
1a
2,02
4 1
2.
01
1
708
1
1.
35
1
2,42
5
1
2.21
1
1,
938
2
1.97
2
1,
545
1
1.65
1
1b
25
4
1.
01
4
-640
4
0.
67
4
168
4
1.
09
4
-61
4
0.
97
4
-439
4
0.
81
4
1c
2,00
2 2
1.
99
2
686
2
1.
34
2
2,40
3
2
2.19
2
1,
916
3
1.95
3
1,
516
2
1.63
2
1c
ph
ase
d
1,91
6 3
1.
91
3
597
3
1.
28
3
2,31
4
3
2.10
3
4,
082
1
2.94
1
1,
413
3
1.56
3
W
TP
Ben
efi
ts J
uri
sdic
tio
n
Wit
hin
160
Mile
s R
adiu
s
Op
tio
n
NP
V
Ran
k B
/C
rati
o
Ran
k
1a
1,43
9 1
1.
72
1
1b
-188
4
0.
90
4
1c
1,41
7 2
1.
70
2
1c p
ha
sed
1,
328
3
1.63
3
S
ourc
e: N
ER
A a
naly
sis.
Tab
le 8
.1 o
f NE
RA
(3
0 Ja
nuar
y 20
07)
“Th
ames
Tid
eway
Cos
t Ben
efit
Ana
lysi
s”.
Not
e: N
PV
: Net
Pre
sent
Val
ue, B
/C r
atio
: Ben
efit
Cos
t rat
io a
nd R
ank:
Ran
king
in te
rms
of th
e N
PV
or
B/C
rat
io.
NP
Vs
are
pres
ente
d in
£ m
illio
n, 2
006
pric
es; d
isco
unte
d to
Oct
obe
r 20
0
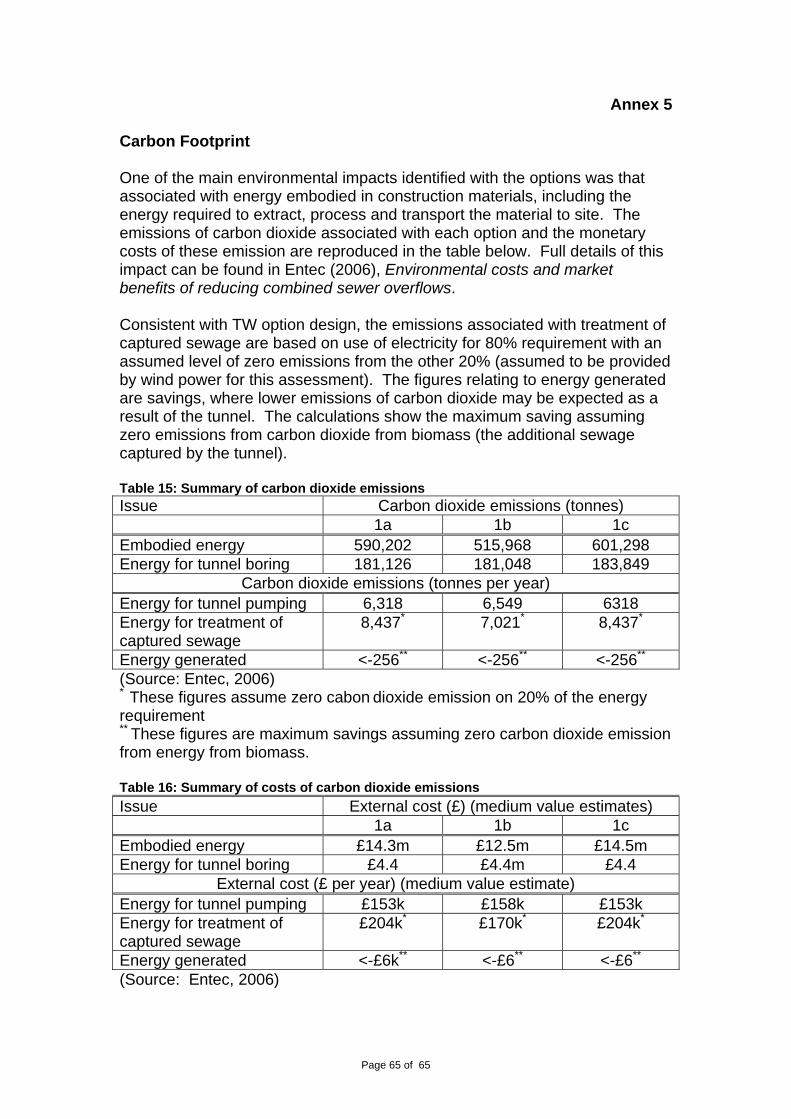
Page 65 of 65
Annex 5
Carbon Footprint One of the main environmental impacts identified with the options was that associated with energy embodied in construction materials, including the energy required to extract, process and transport the material to site. The emissions of carbon dioxide associated with each option and the monetary costs of these emission are reproduced in the table below. Full details of this impact can be found in Entec (2006), Environmental costs and market benefits of reducing combined sewer overflows. Consistent with TW option design, the emissions associated with treatment of captured sewage are based on use of electricity for 80% requirement with an assumed level of zero emissions from the other 20% (assumed to be provided by wind power for this assessment). The figures relating to energy generated are savings, where lower emissions of carbon dioxide may be expected as a result of the tunnel. The calculations show the maximum saving assuming zero emissions from carbon dioxide from biomass (the additional sewage captured by the tunnel). Table 15: Summary of carbon dioxide emissions Issue Carbon dioxide emissions (tonnes) 1a 1b 1c Embodied energy 590,202 515,968 601,298 Energy for tunnel boring 181,126 181,048 183,849
Carbon dioxide emissions (tonnes per year) Energy for tunnel pumping 6,318 6,549 6318 Energy for treatment of captured sewage
8,437* 7,021* 8,437*
Energy generated <-256** <-256** <-256** (Source: Entec, 2006) * These figures assume zero cabon dioxide emission on 20% of the energy requirement ** These figures are maximum savings assuming zero carbon dioxide emission from energy from biomass. Table 16: Summary of costs of carbon dioxide emissions
Issue External cost (£) (medium value estimates) 1a 1b 1c Embodied energy £14.3m £12.5m £14.5m Energy for tunnel boring £4.4 £4.4m £4.4
External cost (£ per year) (medium value estimate) Energy for tunnel pumping £153k £158k £153k Energy for treatment of captured sewage
£204k* £170k* £204k*
Energy generated <-£6k** <-£6** <-£6** (Source: Entec, 2006)

Copyright notice Copyright © Thames Water Utilities Limited January 2013. All rights reserved. Any plans, drawings, designs and materials (materials) submitted by Thames Water Utilities Limited (Thames Water) as part of this application for Development Consent to the Planning Inspectorate are protected by copyright. You may only use this material (including making copies of it) in order to (a) inspect those plans, drawings, designs and materials at a more convenient time or place; or (b) to facilitate the exercise of a right to participate in the pre-examination or examination stages of the application which is available under the Planning Act 2008 and related regulations. Use for any other purpose is prohibited and further copies must not be made without the prior written consent of Thames Water. Thames Water Utilities LimitedClearwater Court, Vastern Road, Reading RG1 8DB The Thames Water logo and Thames Tideway Tunnel logo are © Thames Water Utilities Limited. All rights reserved. DCO-DT-000-ZZZZZ-080300