100 baggers · 1979. “the bse sensex has a base of 100 for the year 1979,” the oswal report...
TRANSCRIPT

100Baggers:WhatI’velearned
ChrisMayer
MicroCapLeadershipSummit
September22-23,2016

Howthisstarted…ChuckAkregaveaspeechin2011Etled'AnInvestor'sOdyssey:TheSearchForOutstandingInvestments’(highlyrecommended).

MyupdateofPhelps…
• Studyofstocksthatreturnedatleast100xfrom1962-2014
• ScreenedoutEnieststocks• 365stocksremained

THE 100-BAGGERS OF THE LAST 50 YEARS 47
1–15 years 16–30 years 31–45 years 46–60 years
200
180
160
140
120
100
80
60
40
20
0
Total 100-baggers by year-range
Company Name
Franklin Resources Inc
Pharmacyclics Inc
Nexstar Broadcasting Group
Questcor Pharmaceuticals Inc
Biogen Idec Inc
Time Warner Inc
Valeant Pharmaceuticals Intl
Dell Inc
L Brands Inc
Qualcomm Inc
Cisco Systems Inc
Emc Corp/MA
Henry (Jack) & Associate
Vector Group Ltd
Edwards (A G) Inc
Hasbro Inc
Monster Beverage Corp
Southwest Airlines
Home Depot Inc
NVR Inc
Years to 100
4.2
5.0
5.0
5.0
5.5
6.0
6.5
7.2
7.3
7.3
7.3
7.7
8.3
8.5
8.7
9.5
9.5
9.5
9.7
9.7
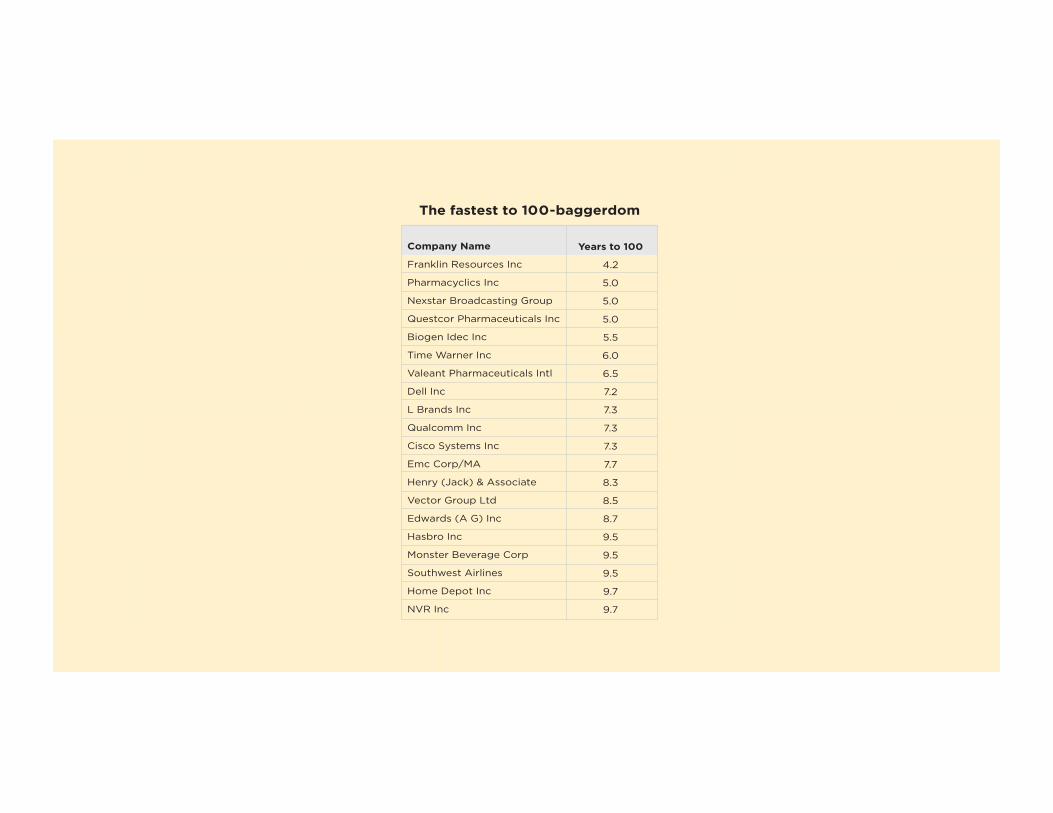
The fastest to 100-baggerdom

100-BAGGERS 36
You don’t have to hold onto a stock for 20 years to get a 100-bagger. But the idea is to show you the power of long-term compounding. To har-ness that power takes some time.
The Oswal study found 47 enduring 100-baggers in India over the past 20 years. It excluded fleeting bubble-like stocks. What’s shocking is that the Indian stock market as a whole is a 100-bagger relative to 1979. “The BSE Sensex has a base of 100 for the year 1979,” the Oswal report noted. “The Sensex first touched 10,000 in February 2006.” That’s a 100-bagger in 27 years, or 19 percent annually. As I write, the Sensex is at 27,000.
What I find most interesting are Oswal’s conclusions.After all, the aim here is to apply what we learn from the study to help
us find 100-baggers today. Based on my work (and Phelps’s), it’s easy to agree with Oswal when he wrote the single most important factor “is GROWTH in all its dimensions—sales, margin and valuation.”
Most 100-baggers had huge growth curves in these areas. Studying 100-baggers, then, comes down to studying growth: How it happens. And how it endures—as it must to reach the heights of 100-baggerdom. As the chart shows, a 21 percent annual return gets you there in about 25 years. (That’s about the average 100-bagger in my study.)
5 10 15 20 25 30 35 40 45 50Compounding rate in %
94
48
3325
21 18 15 14 12 11
Years it takes for 100x at different rates

Thetopperformers
THE 100-BAGGERS OF THE LAST 50 YEARS 45
Berkshire is in a category by itself, and we’ll look at it in more detail in chapter 9.
Kansas City Southern is a railroad stock. It’s up more than 16,000-fold since 1974. A $10,000 investment there turned into $160 million in 40 years. I would never have guessed a railroad stock would top the list. The second stock on the list is an oil-and-gas firm that now is mainly a refiner. It’s a 14,000-bagger.
Some of the other names are not so surprising. Walmart and McDonald’s are stocks you probably could’ve guessed. And remember, this is just the top. There are 365 stocks that have met our 100-bagger threshold since 1962.
The 100-bagger population seems to favor no particular industry. There are retailers, beverage makers, food processors, tech firms and many other kinds. The only thing they seem to have in common is the subject of the study: they returned at least 100 to 1.
It’s also worth considering the size of these companies when they started their march. Now I hesitate to make generalizations from the sta-tistics, as I’ve said. And that’s why my focus is more on anecdotal evidence and the ideas or theories behind 100-baggers. With that warning, I’ll add that the median sales figure for the 365 names at the start was about $170 million and the median market cap was about $500 million.
That’s interesting on two levels: One, it dispels a myth that to get a 100-bagger you have to start with tiny companies. True, these are small
Company Name
Berkshire Hathaway
Kansas City Southern
Altria Group Inc
Wal-Mart Stores Inc
Hollyfrontier Corp
Franklin Resources Inc
Forest Laboratories—CL A
TJX Companies Inc
Southwest Airlines
Newmarket Corp
DataDate
9/30/65
12/31/72
12/31/62
10/31/70
10/31/66
12/31/81
12/31/72
10/31/62
12/31/71
12/31/62
TotalReturn
18,261
16,931
15,120
12,382
12,279
11,363
7,874
6,946
5,478
5,077
Year to100
19.0
18.2
24.2
12.5
21.2
4.2
11.5
28.5
9.5
22.8
THE 100-BAGGERS OF THE LAST 50 YEARS 47
1–15 years 16–30 years 31–45 years 46–60 years
200
180
160
140
120
100
80
60
40
20
0
Total 100-baggers by year-range
Company Name
Franklin Resources Inc
Pharmacyclics Inc
Nexstar Broadcasting Group
Questcor Pharmaceuticals Inc
Biogen Idec Inc
Time Warner Inc
Valeant Pharmaceuticals Intl
Dell Inc
L Brands Inc
Qualcomm Inc
Cisco Systems Inc
Emc Corp/MA
Henry (Jack) & Associate
Vector Group Ltd
Edwards (A G) Inc
Hasbro Inc
Monster Beverage Corp
Southwest Airlines
Home Depot Inc
NVR Inc
Years to 100
4.2
5.0
5.0
5.0
5.5
6.0
6.5
7.2
7.3
7.3
7.3
7.7
8.3
8.5
8.7
9.5
9.5
9.5
9.7
9.7
The fastest to 100-baggerdom

WhatI’velearned• Startsmall

WhatI’velearned• Startsmall
• You’vegottoholdonforalongBme

EdRuscha,SunsettoPico
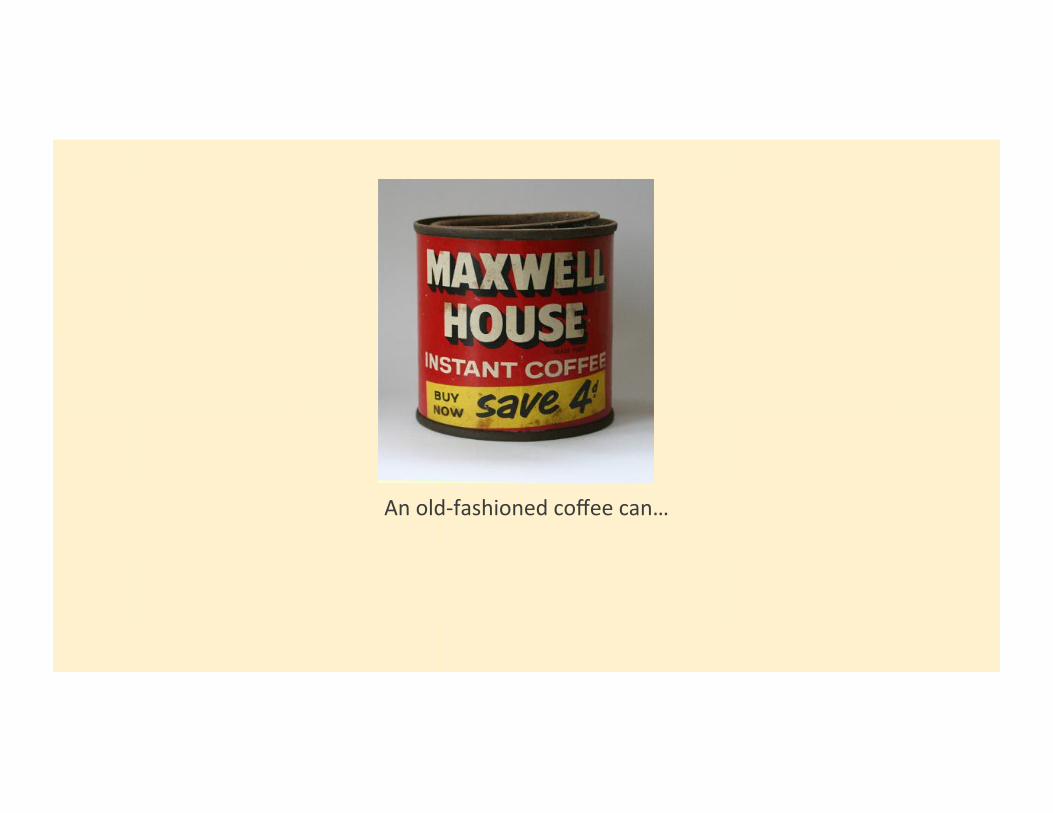
Anold-fashionedcoffeecan…

WhatI’velearned• Startsmall
• You’vegottoholdonforalongEme
• LowmulBplespreferred
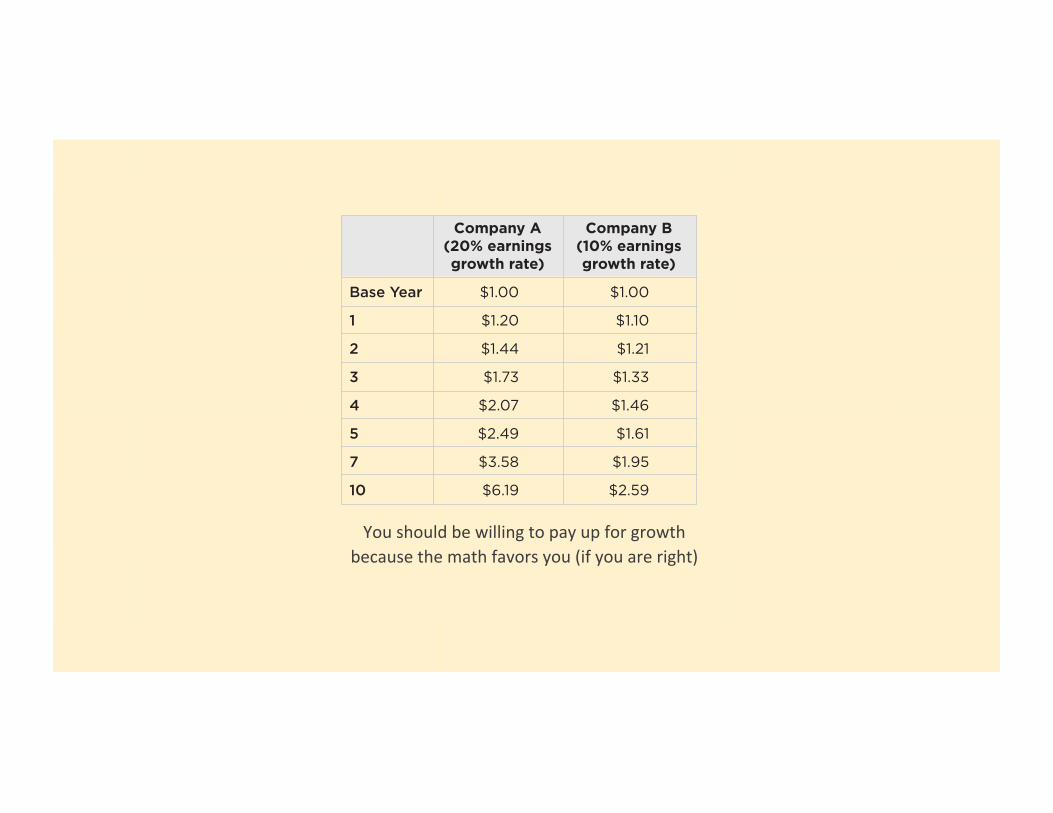
Youshouldbewillingtopayupforgrowth
becausethemathfavorsyou(ifyouareright)
100-BAGGERS 72
Here’s the math:
You can see what a radically different place you end up at with the fast grower after 5, 7 and 10 years. If both stocks retain their P/E, com-pany A will end up at $123.80 and will hand you a 5-bagger. Company B will sell for $25.90 and give you a double. Even if the 20-P/E stock fell to 10 P/E, you’d wind up with a lot more money still—a triple.
As Phelps reminds us, “good stocks are seldom without friends.” Hence, they are rarely cheap in the usual sense. Don’t let a seemingly high initial multiple scare you away from a great stock.
SummaryThere is no end to this kind of analysis. We could create a case study for each of the 365 100-baggers. That would make tough reading. So, I won’t spend too much time on case studies.
We’ve done enough with a range of 100-baggers. And we have a basic template emerging, which I’ll return to at the end of the book.
Again, I’d like to emphasize that I don’t take the statistical approach very seriously here. I am tempted to give more numbers on what a typical 100-bagger looked like. But that would be like giving you the average price of real estate in Columbus, OH. The latter doesn’t tell you much because there is residential property, commercial property, industrial property, and so forth. The population is too diverse. The number doesn’t mean anything. It’s the same with 100-baggers.
Base Year
1
2
3
4
5
7
10
Company A(20% earningsgrowth rate)
$1.00
$1.20
$1.44
$1.73
$2.07
$2.49
$3.58
$6.19
Company B(10% earningsgrowth rate)
$1.00
$1.10
$1.21
$1.33
$1.46
$1.61
$1.95
$2.59

WhatI’velearned• Startsmall
• You’vegottoholdonforalongEme
• LowmulEplespreferred
• Highreturnsoncapitalarereallyimportant

Overthelongterm,it’shardforastocktoearnamuchbeIerreturnthanthebusinesswhichunderliesitearns.Ifthebusinessearns6%oncapitalover40yearsandyouholditforthat40years,you’renotgoingtomakemuchdifferentthana6%re-turn—evenifyouoriginallybuyitatahugediscount.Conversely,ifabusinessearns18%oncapitalover20or30years,evenifyoupayanexpensivelookingprice,you’llendupwithafineresult.
–CharlieMunger

WhatI’velearned• Startsmall
• You’vegottoholdonforalongEme
• LowmulEplespreferred
• Highreturnsoncapitalarereallyimportant
• Owner-operatorspreferred

LotsofempiricalevidencetosupportinvesEngwithowners
OWNER-OPERATORS: SKIN IN THE GAME 85
On this topic, there is a wealth of research and practical experience. On the research front, here are a few relevant studies:
• Joel Shulman and Erik Noyes (2012) looked at the historical stock-price performance of companies managed by the world’s billionaires. They found these companies outperformed the in-dex by 700 basis points (or 7 percent annually).
• Ruediger Fahlenbrach (2009) looked at founder-led CEOs and found they invested more in research and development than other CEOs and focused on building shareholder value rather than on making value-destroying acquisitions.
• Henry McVey and Jason Draho (2005) looked at companies con-trolled by families and found they avoided quarterly-earnings guidance. Instead, they focused on long-term value creation and outperformed their peers.
There is much more, but you get the idea. People with their own wealth at risk make better decisions as a group than those who are hired guns. The end result is that shareholders do better with these owner-operated firms. Horizon Kinetics has a neat graphic to illustrate the difference between a typical public company and an owner-operator. (See the chart below.)
Personal Wealthat Risk
AgentManagement
CompensationFocused
Below Average Returns to
QuarterlyEarnings
“Flashy”Acquisitions
Superior ValueCreation
“Virtuous Feedback”Shareholders
Long-TermProfits
OpportunisticAcquisitions
Source: Horizon Kinetics
The typical public company vs. the owner-operator
Management &Shareholders

Afewstudies…• ShulmanandNoyes(2012)—Lookedatthehistoricalstockpriceperformanceofcompaniesmanagedbytheworld’sbillionaires.
• McVeyandDraho(2005)—Lookedatcompaniescontrolledbyfamiliesandfoundtheyavoidedquarterlyearningsguidance,focusedonlong-termvaluecreaEonandoutperformedtheirpeers.
• Lilienfield-ToalandRuenzi(2009)-FirmsinwhichtheCEOvoluntarilyholdsanon-trivialfracEonofthecompany’sstockoutperformthemarketsignificantlyaeercontrollingfortradiEonalriskfactors.

Andanecdotalevidenceaswell

Moreanecdotalevidence…
“The disenfranchisement of all shareholders by rapacious managements with kept boards… has cost shareholders billions upon billions. My experience as a money manager suggests that the entrepreneurial instinct equates with sizable equity ownership… If management and the board have no meaningful stake in the company – at least 10 to 20% of the stock – throw away the proxy and look elsewhere.” - Martin Sosnoff, Silent Investor, Silent
Loser

WhatI’velearned• Startsmall
• Growth,growthandmoregrowth
• LowmulEplespreferred
• Highreturnsoncapitalarereallyimportant
• Owner-operatorspreferred• Andnow,themostimportantingredientofall…

Themostimportantingredientofall• “Overaperiodofyears,ourthinkinghasfocusedmoreandmoreontheissueofreinvestmentasthesinglemostcriBcalingredientinasuccessfulinvestmentidea,onceyouhavealreadyidenEfiedanoutstandingbusiness.”
-ChuckAkre
Themostimportantlessonofall…
