10-year history of internet delay
DESCRIPTION
10-Year History of Internet Delay. DK Lee , Kenjiro Cho*, Gianluca Iannaccone **, Sue Moon CAIDA-WIDE-CASFI Joint Workshop April 24, 2010 Division of Computer Science, KAIST *IIJ Research Laboratory **Intel Research, Berkeley. For the Last Few Decades. - PowerPoint PPT PresentationTRANSCRIPT
10-Year History of Internet Delay
1April 24, 2010, [email protected]
DK Lee, Kenjiro Cho*, Gianluca Iannaccone**, Sue Moon
CAIDA-WIDE-CASFI Joint WorkshopApril 24, 2010
Division of Computer Science, KAIST*IIJ Research Laboratory
**Intel Research, Berkeley

For the Last Few Decades
• Many large-scale Internet measurements: – NLANR AMP, CAIDA’s Ark, DIMES, iPlane– UCSD network teloscope, RouteViews, RIPE RIS
• About the Internet evolution, we know that – Internet topology has been shrunken in terms of the av-
erage AS hop count (by network densification)– Dominant Internet traffic types have changed from web
to peer-to-peer traffic
April 24, 2010, [email protected] 2

What do we know about the overall Internet delay
performance?

What We Know About Internet Delay
• Transmission delay– Improved with faster link speed
• Propagation delay– Improved with new undersea cables
• Queuing and processing delay– Improved with faster devices
• Routing Issues – Loops or detours from VPNs, overlays– Delays can be Improved with new AS peering practices
April 24, 2010, [email protected] 4

Then, Has the Internet grown
shorter in delay?

What are the basic rules that govern
the long-term dynamics of
the Internet delay?
Talk Outline
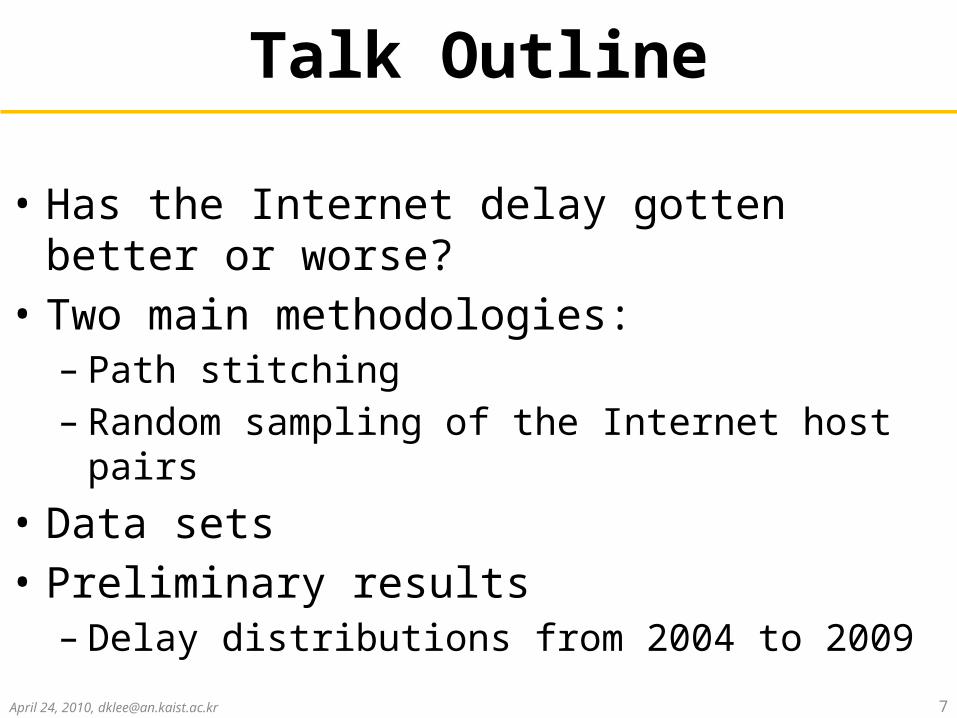
• Has the Internet delay gotten better or worse? • Two main methodologies: – Path stitching– Random sampling of the Internet host pairs
• Data sets• Preliminary results– Delay distributions from 2004 to 2009
April 24, 2010, [email protected] 7
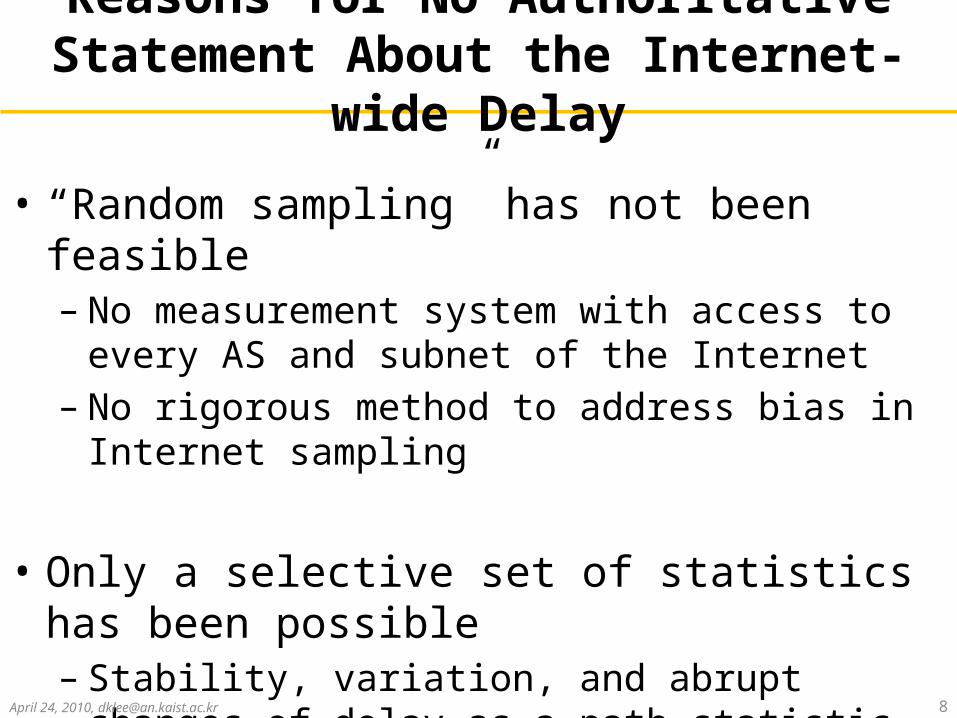
Reasons for No Authoritative Statement About the Internet-
wide Delay• “Random sampling” has not been feasible– No measurement system with access to every AS and
subnet of the Internet– No rigorous method to address bias in Internet sampling
• Only a selective set of statistics has been possible– Stability, variation, and abrupt changes of delay as a path
statistic have been well studied
April 24, 2010, [email protected] 8
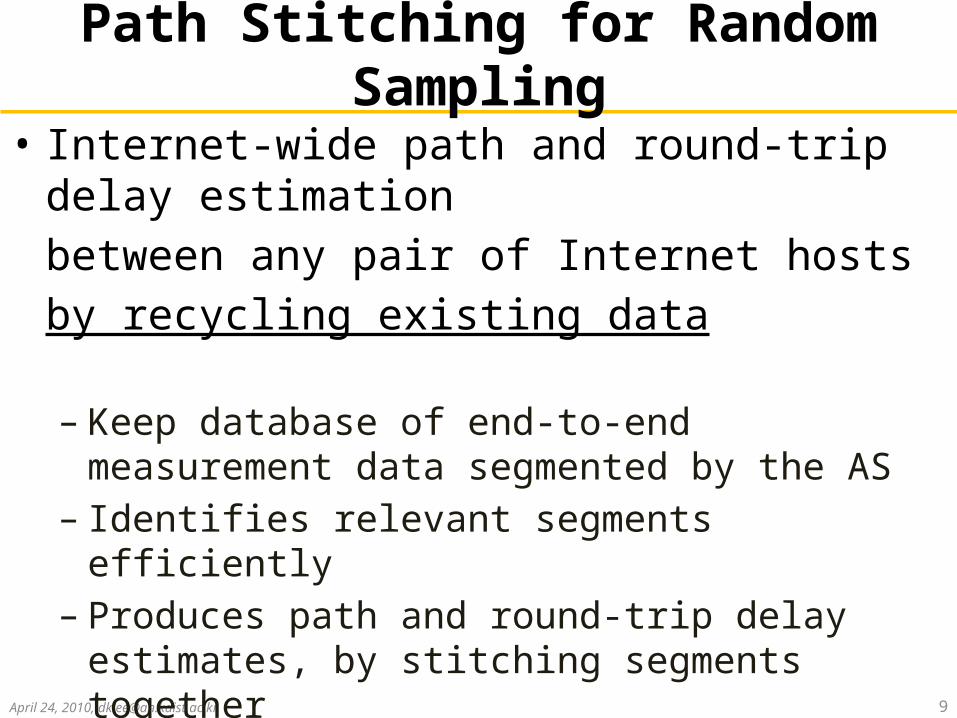
Path Stitching for Random Sampling
April 24, 2010, [email protected] 9
• Internet-wide path and round-trip delay estimation between any pair of Internet hostsby recycling existing data
– Keep database of end-to-end measurement data seg-mented by the AS
– Identifies relevant segments efficiently– Produces path and round-trip delay estimates, by stitch-
ing segments together
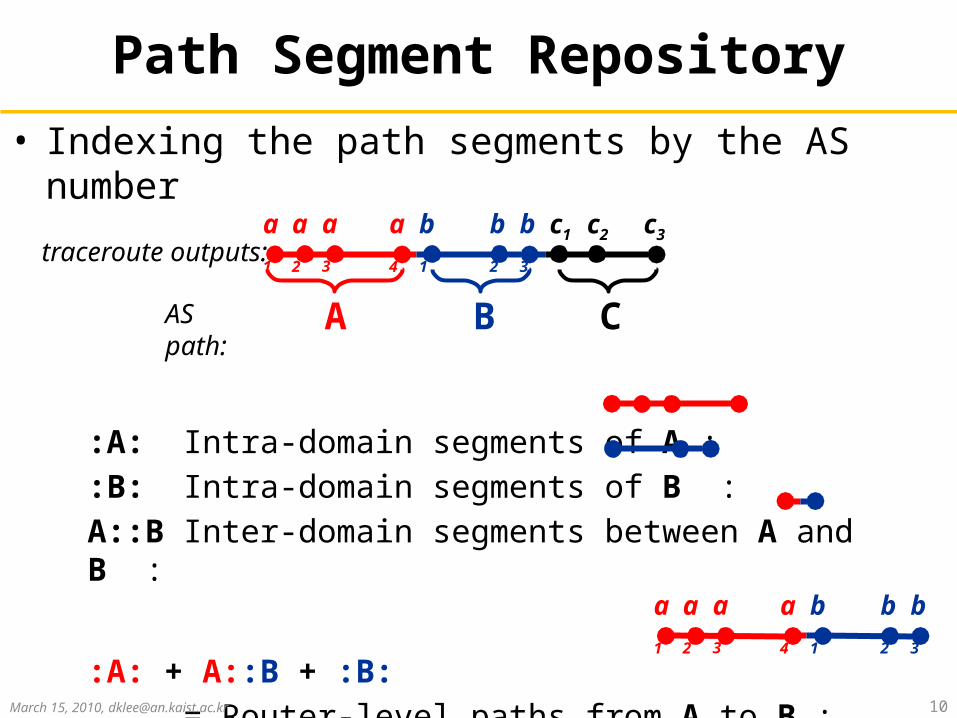
Path Segment Repository• Indexing the path segments by the AS number
:A: Intra-domain segments of A ::B: Intra-domain segments of B :A::B Inter-domain segments between A and B :
:A: + A::B + :B: = Router-level paths from A to B :
March 15, 2010, [email protected] 10
A B C
traceroute outputs:
AS path:
a1 a2 a3 a4 b1 b2 b3 c1 c2 c3
a1 a2 a3 a4 b1 b2 b3

Overview of Path Stitching• Question:
• Answers:
April 24, 2010, [email protected] 11
a ? c
A C
A CB
Step 1. IP-to-AS mapping
Step 2. AS path inference
:A: rttA
:C: rttC
:B:rttB
A::B rttAB
Step 3. Path stitching
:A::B::C:B::C rttBC
Router-level paths and RTT from a to c ?
Path =
RTT = rttA + rttAB + rttB + rttBC + rttC
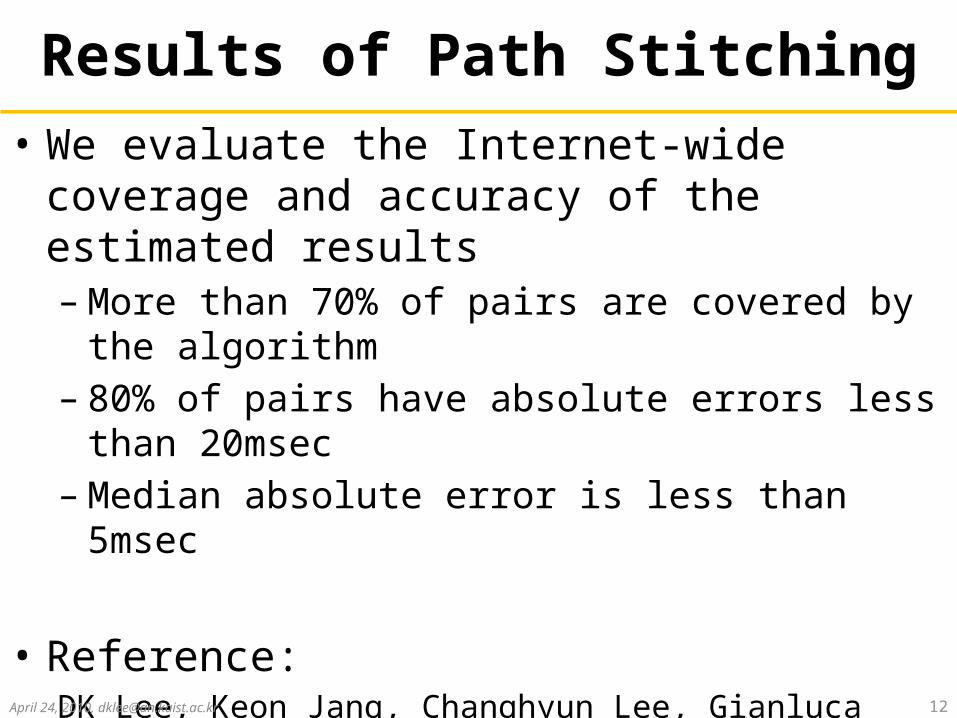
Results of Path Stitching• We evaluate the Internet-wide coverage and accu-
racy of the estimated results– More than 70% of pairs are covered by the algorithm– 80% of pairs have absolute errors less than 20msec– Median absolute error is less than 5msec
• Reference: DK Lee, Keon Jang, Changhyun Lee, Gianluca Iannaccone, Sue Moon, “Internet-wide Path and Delay Estimation from Existing Measurements”, IEEE INFOCOM 2010 Mini-conference
April 24, 2010, [email protected] 12

Survey Design: Select a Set of Host Pairs to
Examine• Random sampling design with size n– Internet consists of N unique pairs of /24 IP prefixes– Extract all routable /24 prefixes from BGP table– Randomly select n=10,000 pairs
• Fraction of responded pairs with path stitching– 67% in 2004 and 65% in 2009
April 24, 2010, [email protected] 13

Sampling Errors for the Population Median – (1)
• Confidence Interval (CI) for the population median estimator:
= q0.5 ±
• In 2009/06, n = 10,000= 211.6 ± 4.9 msec
• In 2009/06, n = 100,000= 213.0 ± 1.3 msec
April 24, 2010, [email protected] 14
n1
)(qf0.5)-0.5(1z
0.52

Sampling Errors for the Population Median – (2)
April 24, 2010, [email protected] 15
Sample size n=100,000 is very accurate

Sampling Errors for the Population Median – (3)
April 24, 2010, [email protected] 16
Results for the sample size n>=10,000 are almost identical
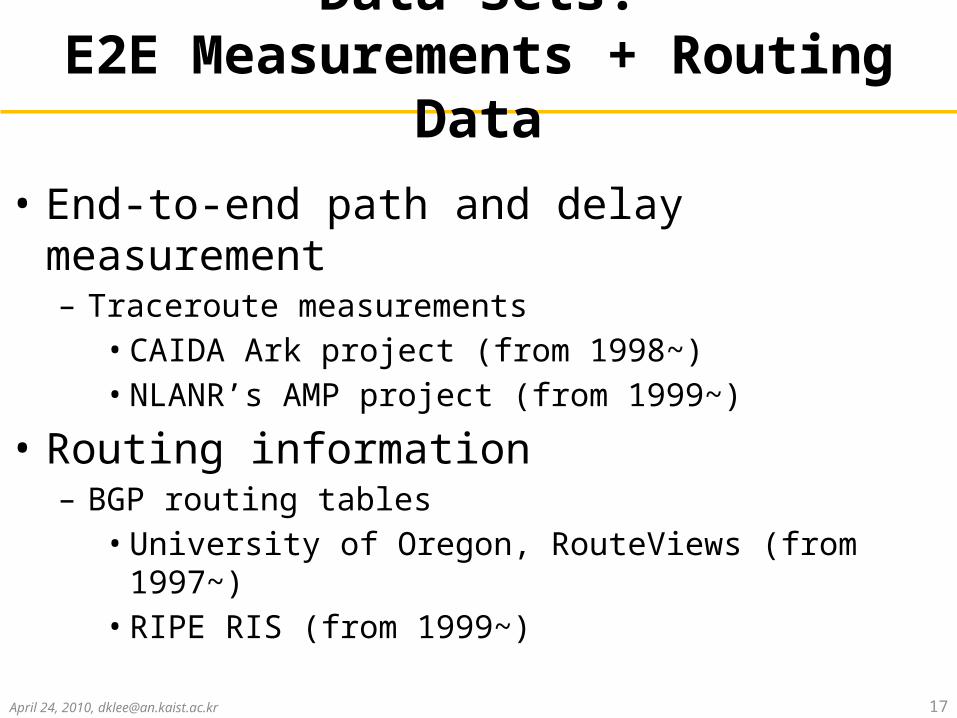
Data Sets:E2E Measurements + Routing
Data• End-to-end path and delay measurement– Traceroute measurements• CAIDA Ark project (from 1998~)• NLANR’s AMP project (from 1999~)
• Routing information– BGP routing tables• University of Oregon, RouteViews (from 1997~)• RIPE RIS (from 1999~)
April 24, 2010, [email protected] 17

Data Processing Oveview• For each YYYY/MM, we process:
April 24, 2010, [email protected] 18
Traceroute outputs
(Skitter .arts.gz)(Ark .warts.gz)
BGP Routing Table Snapshots
(RIPE RIS MRTv1, v2)(RouteViews `sh ip bgp`, MRTv1, v2)
Path Stitching Sampled pairs of
/24 prefixes
Queries
Path and delay estimations for queries
We choose a set of host pairs in each year, and
see the delay distribution
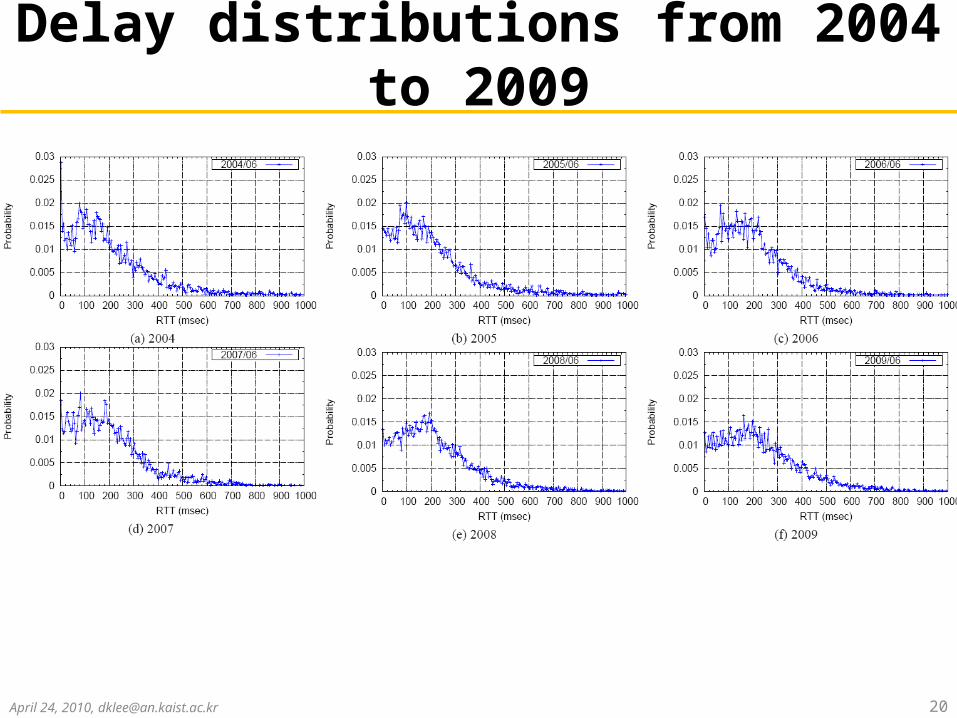


Median Delays Increase Con-stantly
• Delay distribution has gotten worse from 2004 to 2009, both at first/last mile and in the core
• IP/AS hop counts decreased end-to-end– IP hop counts: 14.8 (2004) 14.1 (2009) – AS hop counts: 3.77 (2004) 3.65 (2009)
April 24, 2010, [email protected] 23

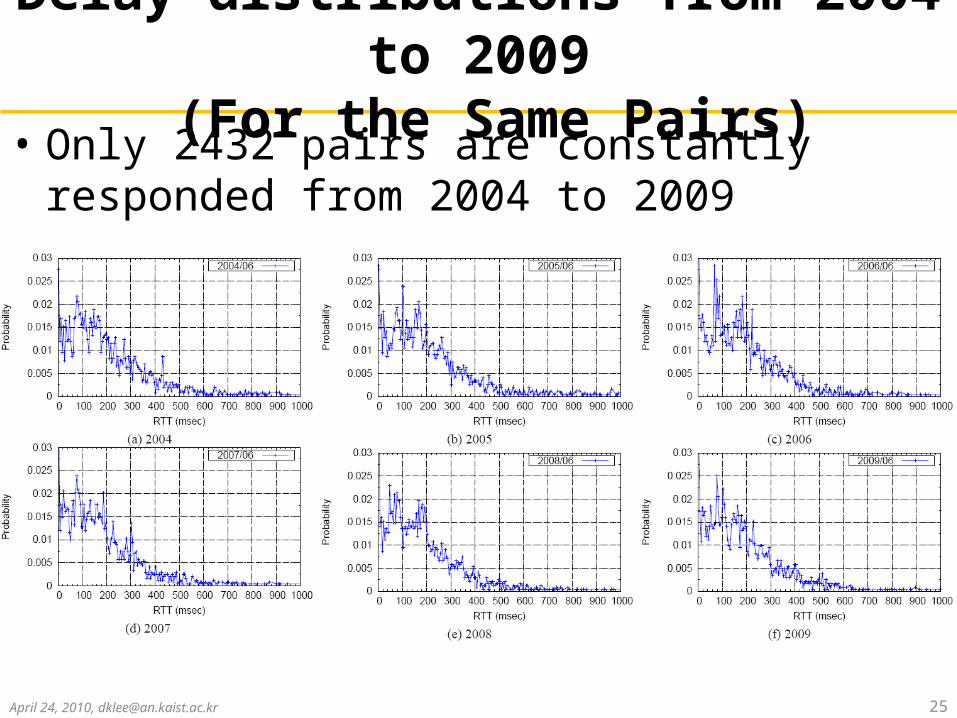
But what if we choose the same set of host pairs?
Delay distributions from 2004 to 2009
(For the Same Pairs)• Only 2432 pairs are constantly responded from 2004 to 2009
April 24, 2010, [email protected] 25

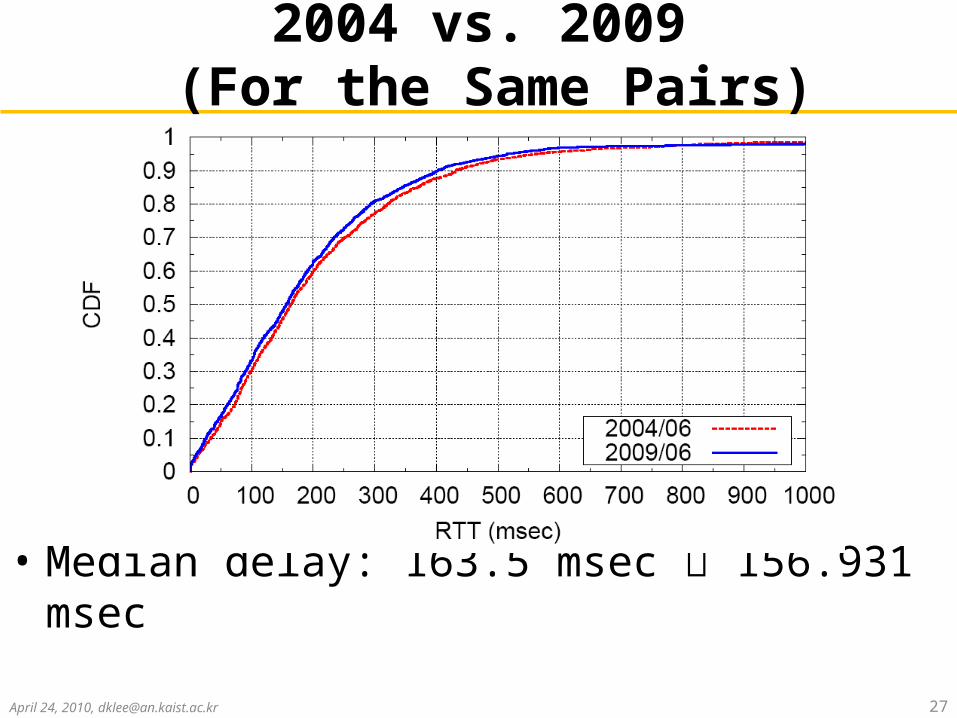
2004 vs. 2009 (For the Same Pairs)
• Median delay: 163.5 msec 156.931 msec
April 24, 2010, [email protected] 27
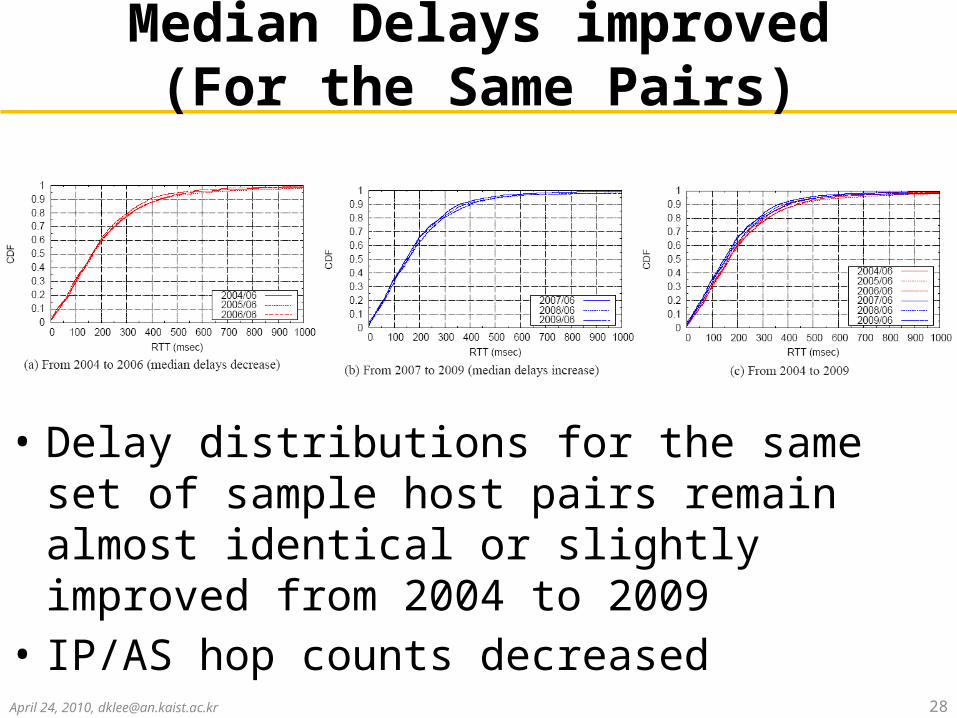
Median Delays improved(For the Same Pairs)
• Delay distributions for the same set of sample host pairs remain almost identical or slightly improved from 2004 to 2009
• IP/AS hop counts decreased
April 24, 2010, [email protected] 28

Finding the corroborating Evi-dence for the observations
• IP address usage have expanded from 2004 to 2009– /24 prefixes of those hosts in 2009 existed in 2004?– ASes of those hosts in 2009 existed in 2004? • In sampled pairs in 2009, compared to 2004,
1729 ASes are disappeared, 2091 Ases are newly appeared.
• Network densification helps AS hop count to de-crease. Does it also help IP hop count or delay to decrease?
April 24, 2010, [email protected] 29

Other Challenges
• Analyzing the delay distribution in 1999– Skitter’s old-format does not have hop-by-hop delays– NLANR AMP dataset is too small– RouteViews have very restricted number of peers
• Effect of non-response– Where does the missing 35% come from?
• Effect of measurement errorsApril 24, 2010, [email protected] 30
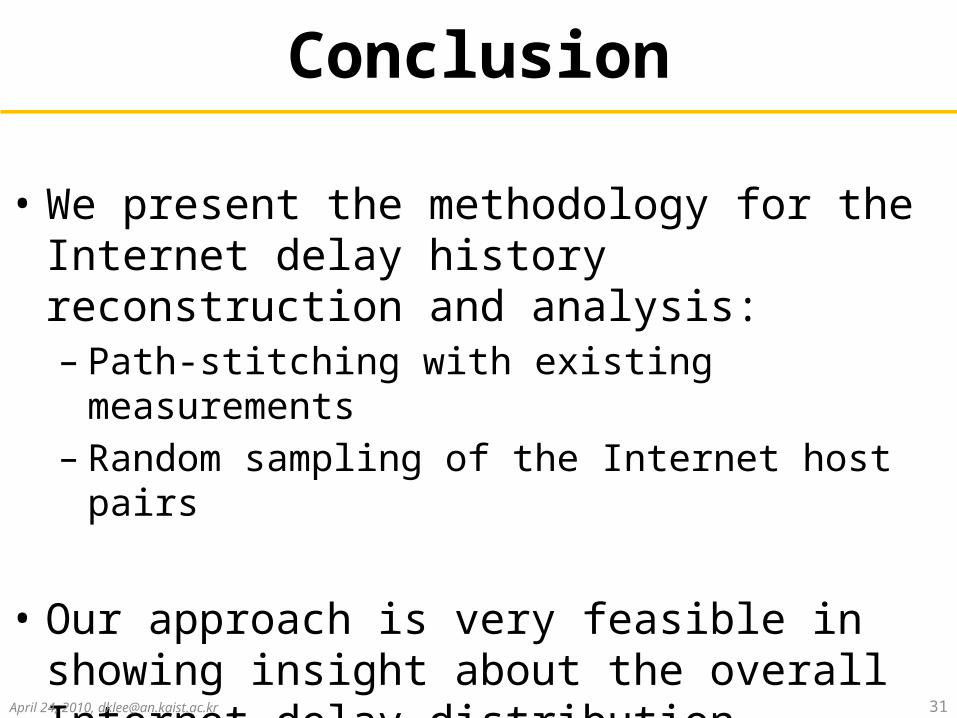
Conclusion
• We present the methodology for the Internet delay history reconstruction and analysis: – Path-stitching with existing measurements– Random sampling of the Internet host pairs
• Our approach is very feasible in showing insight about the overall Internet delay distribution
April 24, 2010, [email protected] 31
Thank You!• Any Questions?
• We are looking for other traceroute outputs and BGP table snapshots archived before 2000
April 24, 2010, [email protected] 32

Backup Slides
“To get to the essence of things, one has to work long and hard”
-- Vincent van Gogh
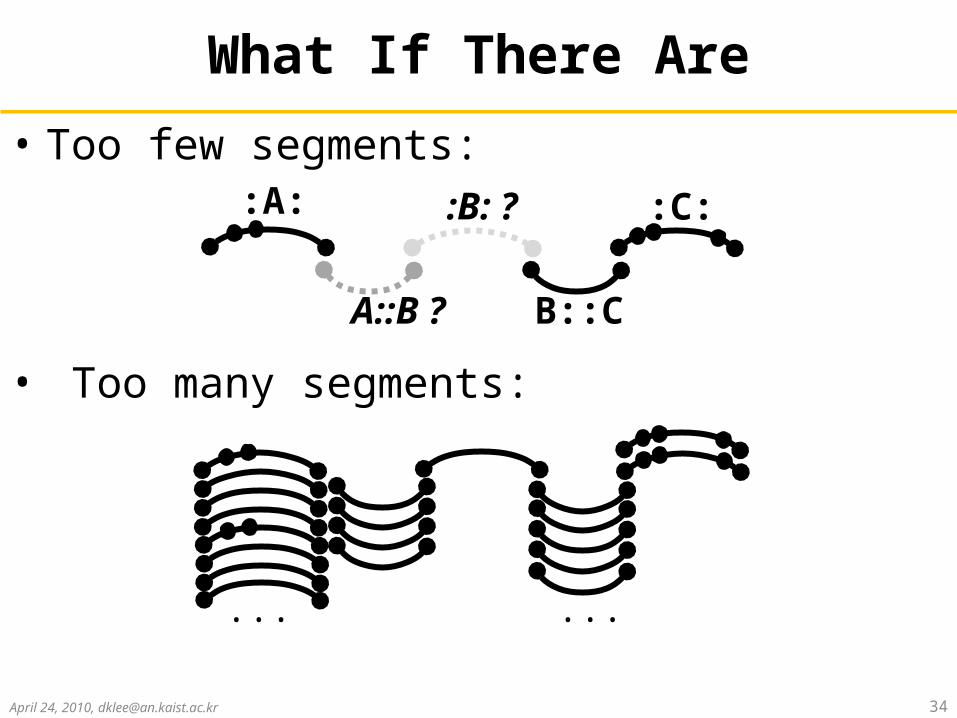
What If There Are• Too few segments:
• Too many segments:
April 24, 2010, [email protected] 34
A::B ? B::C
:A: :C::B: ?
... ...

When There Are Too Few or No Segments

We Employ Approximations(i) Missing AS
» No solutions (other than collecting more measurements. )
(ii) Missing inter-domain segment » Search for reverse path segments.
(i.e., if we cannot find A::B, use B::A instead)
(iii) Path segments do not rendezvous at the same address(i.e., the segment cannot be stitched)
» Identify nearby segments (on the same router, PoP, Prefix)
April 24, 2010, [email protected] 36
:A: :B:
B::A
X
Z
Y
W
A
X::A::W = ?

When There Are Too Many Segments
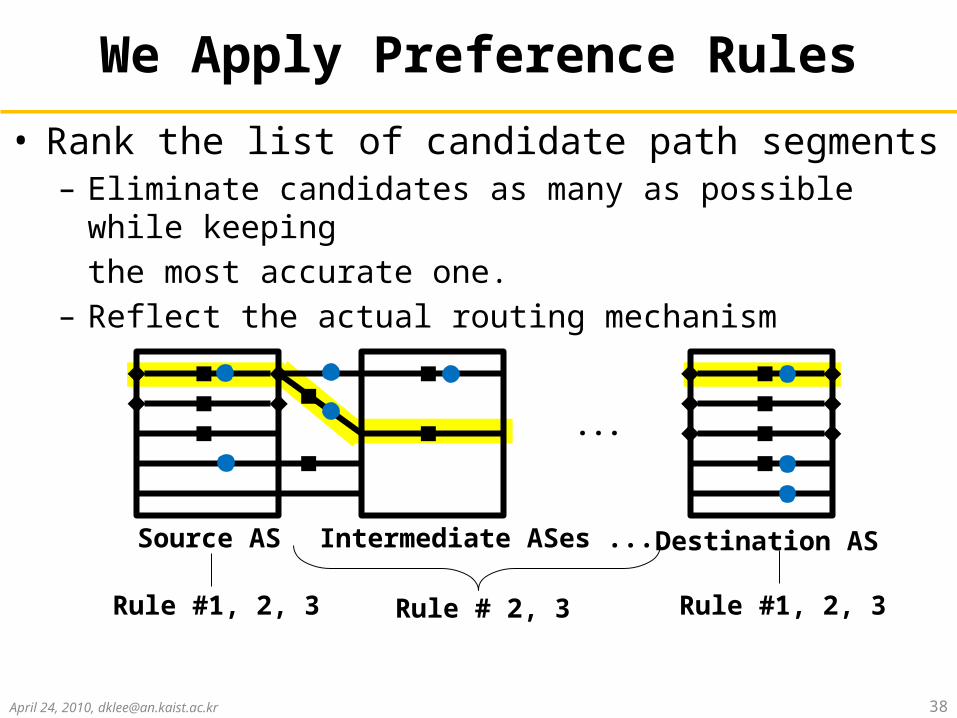
We Apply Preference Rules• Rank the list of candidate path segments– Eliminate candidates as many as possible while keeping
the most accurate one. – Reflect the actual routing mechanism
April 24, 2010, [email protected] 38
Source AS Destination ASIntermediate ASes ...
...
Rule #1, 2, 3 Rule #1, 2, 3Rule # 2, 3

Rule #1: Proximity• Preference to the path segments that closest to the queried
source and destination address
April 24, 2010, [email protected] 39
Source AS
a.b.c.1 a.b.c.2
a.b.1.1 d.b.1.2
x.y.z.1 x.y.z.2
Query: a.b.c.d --> x.y.z.w
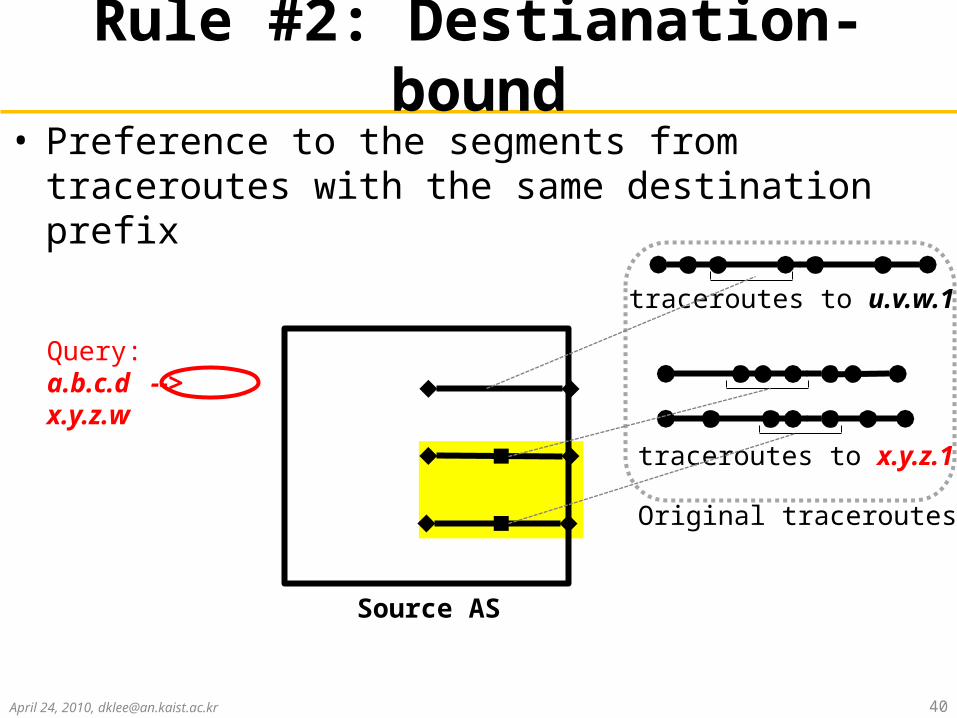
Rule #2: Destianation-bound
• Preference to the segments from traceroutes with the same destination prefix
April 24, 2010, [email protected] 40
Query: a.b.c.d --> x.y.z.w
Source AS
Original traceroutes
traceroutes to x.y.z.1
traceroutes to u.v.w.1

Rule #3: Most Recent• Preference to the most recent path segment
April 24, 2010, [email protected] 41
Query: a.b.c.d --> x.y.z.w
Source AS
Original traceroutestraceroutes to x.y.z.1
YYYYMMDD-12:30:00
YYYYMMDD-10:30:00
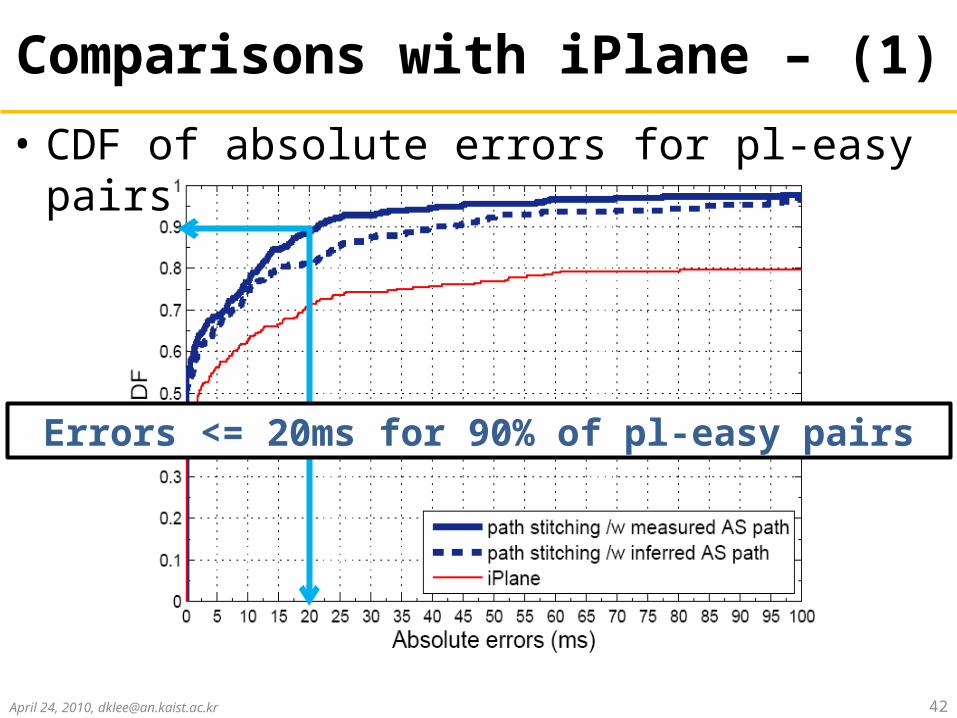
Comparisons with iPlane – (1)
April 24, 2010, [email protected] 42
• CDF of absolute errors for pl-easy pairs
Errors <= 20ms for 90% of pl-easy pairs

Comparisons with iPlane – (1)• CDF of absolute errors for pl-hard pairs
April 24, 2010, [email protected] 43
Very promising results:With accurate AS paths inference,
errors <= 20ms for 80% of pl-hard pairs