10. waste introduction - karnataka · 10. waste introduction ... treatment and disposal of waste...
TRANSCRIPT

10. WASTE
Introduction 10.1. The term ‘waste’ refers to all kinds of waste, whether generated during extraction of
raw materials, processing of raw materials into intermediate and final products, consumption
of final products, or other human activities, including municipal (residential, institutional,
commercial), agricultural, and social (health care, household hazardous waste, sewage
sludge). Waste management or waste disposal includes all the activities and actions such as
collection, transport, treatment and disposal of waste from its inception to its final disposal.
Waste management also encompasses the legal and regulatory framework relating to waste
management together with monitoring and regulation. Waste management is intended to
reduce adverse effects of waste on health, environment or aesthetics.
10.2. In earlier times, the amount of waste generated by humans was insignificant because
of low population density and low levels of exploitation of natural resources. Besides, the
waste was mostly organic or biodegradable. The onset of industrialization, along with rapid
urbanization that followed, witnessed mushrooming of concentrated population centers
resulting in building up of waste or garbage. Industrialization led to economic growth and
prosperity triggering rise in income levels and spurt in consumption patterns. Industrialization
also led to exploitation of more and more natural resources, including mineral resources,
resulting in generation of more waste material a large portion of which was no longer
biodegradable. As industrialization progressed, proportion of non-biodegradable or even
hazardous substances, in the waste material increased.
10.3. The cardinal principle of waste management is waste minimization which is achieved
through three waste management strategies, namely, ‘reduce, reuse and recycle’. Efficient
waste management implies that all these three options are fully explored before taking action
for final disposal of waste. The first step towards waste management is to prevent the
generation of waste. Substantial portion of what we describe as waste may also be a valuable
resource. It is therefore necessary to assess the potential of such resource and make the best use of it
so that waste disposal can be minimized. Less waste means less pressure on natural resources and
lower carbon emissions. More waste means more pollution which puts more pressure on the planet's
ecosystems. The scientific community is in agreement that waste and pollution are
contributing to global warming, water stress, water scarcity, global habitat loss, biodiversity
loss as well as environmental degradation. One way to reduce pressure on the environment and to
preserve scarce resources is to divert waste before it gets to landfills.
10.4. Solid waste management has contributed to livelihood for many professionals
including rag pickers, street cleaners, door to door waste collectors, enforcing officers, policy
makers, non-government organizations, bulk waste processors, health inspectors, waste
recyclers, workers in waste disposal facilities, housekeeping and waste handling staff in
commercial/industrial establishments including health care establishments, waste dealers, etc.
This chapter makes an attempt to track various issues with respect to different waste streams
as on date.
10.5. Environmental systems play a fundamental role in determining economic output as
well as human well-being — providing resources and services. It also absorbs emissions and
wastes. However, the earlier concept of dilution as solution to pollution is no longer valid
considering the large volumes of waste generated now and their complex interrelation with
the ecosystems.

10.6. The status of waste management in the urban areas of Karnataka, as in other parts of
the country, has been by and large very poor. Most of the populated areas present a picture of
inadequately managed and uncontrolled dumpsites with poor, sometimes non-existent, waste
collection services. To the city/town administrators, waste management is an ongoing
challenge and they struggle due to weak institutions, poor infrastructure, chronic resource-
crunch and rapid urbanization. All these challenges and handicaps, along with the lack of
understanding of different factors that contribute to waste management, affect the treatment
of waste. The problem of waste management is also compounded by the lackadaisical attitude
of the common man who is not inclined to contribute his mite to the cause of waste
management and leaves the entire responsibility to the civic authorities. As a matter of fact,
implementation of environment related laws is yet to make an impact on Karnataka’s
ecosystems and therefore on the health and living conditions of its citizens. In many parts of
the state, the local bodies are unable to tackle the problems of pollution control, waste
management and nature protection.
10.7. India already has a number of legislations to strengthen the hands of the
administrators in matters relating to waste management. The major streams or types of waste
for the management of which India has legislation are given in Table-10.1.
Table-10.1: Major streams or types of waste for which India has legislation
Type of
waste
Applicable Legislation Impact
Hazardous
waste
Hazardous and Other
Wastes (Management and
Transboundary Movement)
Rules, 2016
Pollution
Fire hazard
Entry into food chain
Corrosion of material
Climate change
Food contamination
Impact on health
Resource depletion
Habitat loss and affect flora/fauna
Bio-magnification
Loss of soil fertility
Biomedical
Waste
Bio-Medical Waste
Management Rules, 2016 Infection
Pollution
Climate change
Food contamination
Impact on health
Resource depletion
Habitat loss and affect flora/fauna
Plastic waste
Plastic Waste Management
Rules, 2016 Choking of sewerage and drainage
Choking of digestive system of
animals
Food contamination
Impact on health
Resource depletion
Habitat loss and affect flora/fauna

Lead acid
Battery
waste
The Batteries (Management
and Handling) Rules, 2001 Pollution
Lead poisoning
Food contamination
Impact on health
Resource depletion
Habitat loss and affect flora/fauna
Construction
and
demolition
waste
Construction and
Demolition Waste
Management Rules, 2016
Pollution
Choking of sewerage and drainage
Impact on health
Resource depletion
Habitat loss and affect flora/fauna
Bio-magnification
Loss of soil fertility
Municipal
Solid waste
Solid Waste Management
Rules, 2016 [ Pollution
Choking of sewerage and drainage
Impact on health
Climate change
Choking of sewerage and drainage
Choking of digestive system of
animals
Resource depletion
Street dog menace
Rodent menace
Habitat loss and affect flora/fauna
Fire hazard
Entry into food chain
Corrosion of material
Food contamination
Bio-magnification
Loss of soil fertility
Infection
E-waste
e-waste (Management)
Rules, 2016 Impact on health
Pollution
Resource depletion
Radioactive
waste
Atomic Energy (Safe
Disposal Of Radioactive
Wastes) Rules, 1987
Impact on health
Pollution
Resource depletion
Affect flora/fauna
Fly ash Flyash Notification by
MoEF&CC dtd. 14th
September, 1999
Impact on health
Pollution
Resource depletion
Affect flora/fauna
10.8. The major streams or types of waste for the management of which India is yet to have
specific legislation are given in Table-10.2.

Table-10.2
Major streams or types of waste for which India is yet to have specific legislation
Type of waste Impact
End of life vehicle (ELV) Pollution
Choking of sewerage and drainage
Impact on health
Resource depletion
Food waste Pollution
Choking of sewerage and drainage
Impact on health
Resource depletion
Dog menace
Rodent menace
Slaughter house waste Pollution
Choking of sewerage and drainage
Impact on health
Resource depletion
Dog menace
Rodent menace
Loss of indigenous species
Infection
Impact on biodiversity
Bottom ash Pollution
Disaster waste Pollution
Obstruction to sewerage, drainage and roads
Impact on health
Resource depletion
Dog menace
Rodent menace
Infection
10.9. The impact of waste disposal on flora and fauna is given in Box 10.1.
Box 10.1 Impact of waste on flora and fauna
Karnataka is blessed with very rich biodiversity with varieties of flora and fauna. Population
explosion, industrialization and urbanization have resulted in numerous waste streams which
affect flora and fauna. While the fly-ash and dust particles cover leaves reducing photosynthesis
and respiration, plastic waste in soil hinders the nutrient absorption capacity by plants.
Indiscriminate burning of waste emits numerous toxic gases which directly impact the health of
animals and plants. The leachate from waste dump is absorbed by plants resulting in their
malformation or death. Toxic substances absorbed by plants are passed on to herbivores and
subsequently to carnivores resulting in bio-magnification. Contaminated or poisonous waste
dumped in or near forest is harmful to animals who may feed on such waste. The menace of
plastic on aquatic and terrestrial ecosystem has been well documented. Plastic covers and articles
affect photosynthesis of aquatic plants by obstructing sunlight. Plastic materials choke digestive
system in fauna when ingested.

10.10. Provisions of waste management in various legislations are indicated in Box 10.2. It
must however be added that in spite of these provisions, there are gaps between the objectives
of the laws and their implementation. Various factors such as inadequate budgetary support,
weak institutions, lack of infrastructure, public apathy, etc. come in the way of proper
implementation of the laws.
Box 10.2 Provisions of Waste Management in various legislations
Historically, public nuisance is governed by Indian Penal Code under Sections 278, 290,
291 reproduced below:
278. Making atmosphere noxious to health.—Whoever voluntarily vitiates the atmosphere
in any place so as to make it noxious to the health of persons in general dwelling or
carrying on business in the neighbourhood or passing along a public way, shall be
punished with fine which may extend to five hundred rupees.
290. Punishment for public nuisance in cases not otherwise provided for.—Whoever
commits a public nuisance in any case not otherwise punishable by this Code, shall be
punished with fine which may extend to two hundred rupees.
291. Continuance of nuisance after injunction to discontinue.—Whoever repeats or
continues a public nuisance, having been enjoined by any public servant who has lawful
authority to issue such injunction not to repeat or continue such nuisance, shall be
punished with simple imprisonment for a term which may extend to six months, or with
fine, or with both.
Section 346 (F) of the Karnataka Municipalities Act, 1964 impose responsibility on
Industrial Township Authority as reproduced below:
364(F). Functions and duties of Industrial Township Authority.- It shall be incumbent on
the Authority to make adequate provision by any means or resources which it may lawfully
use or take for each of the following matters within the Industrial Township, namely:- (1)
Regulation and construction of buildings; (2) Planning for economic and social
development; (3) Roads and bridges; (4) Water supply for domestic, industrial and
commercial purposes; (5) Public, health, sanitation, conservancy and solid waste
management and fire services; (6) Urban forestry, protection of environment and
promotion of ecological aspects; (7) Safeguarding the interests of weaker sections of
society, including handicapped and mentally retarded and improvement of slums.
The State enacted series of waste management related legislations since notification of the
Hazardous Wastes (Management and Handling) Rules, 1989 which underwent several
changes before taking present day shape. The other legislations pertaining to lead acid
battery, plastic waste, biomedical waste, municipal solid waste management and e-waste
also went through series of changes from 1989 to till date.
Municipal Solid Wastes (Management & Handling) Rules, 2000 brought further changes in
the system. Bruhat Bengaluru Mahanagara Palike (BBMP) notified Municipal Solid Waste
(Prohibition of Littering and Regulation of Segregation, Collection, Processing &
Disposal) Rules, 2012 on 01-10-2012.
The Karnataka Municipal Corporations Act, 1976 amended in 2013 added Schedule-XIII
to said act fixed fine for certain activities.

Rapid urbanisation and waste management
10.11. Rapid urbanization has escalated the problems of waste management due to
heterogeneous nature of waste, lack of awareness among the public, lack of appropriate
infrastructure, disintegrated and unscientific approach of waste management, etc. (Fig. 10.1).
10.12. Urbanization which is caused by development (industrialization/economic activities)
as well as migration results in generation of waste, increase in pollution level and
environmental degradation (Fig. 10.2).
Fig. 10.2 Relation between development, migration and waste
Development
Migration
Demand for fresh water, air, food, shelter, energy, transportation, goods, services
Waste/pollution/
environmental degradation
Creation of infrastructure
Fig. 10.1 Waste choking drains
in Bengaluru

10.13. The positive net migration rate for high-income states like Haryana, Maharashtra,
Punjab as well as Gujarat has gone down as per the 2011 Census, compared to the 2001
Census. Some states, namely Tamil Nadu as well as Karnataka, have recorded highest net
gain (Table-10.3). Historical trends in most industrial economies show that resource use and
waste generation are linked to economic activity. But it is possible to de-link economic
growth from resource use through resource efficiency.
Table-10.3: Net Inter-state Migration Rate (Per 100 of population) for Major States during
1991-2011
State Census, 1991-01 National Sample
Survey, 2007-08
Census, 2001-11
(estimated)
Andra Pradesh -0.31 -0.87 -2.02
Assam -0.69 -0.50 -2.21
Bihar -2.67 -5.64 -3.39
Gujarat 1.67 1.63 1.64
Haryana 4.07 3.52 2.01
Himachal Pradesh 0.98 - -0.40
Jammu and Kashmir -0.42 -1.24 0.37
Karnataka 0.29 0.97 1.88
Kerala -0.57 -4.43 -5.41
Madhya Pradesh -0.04 -0.68 0.48
Maharastra 3.02 1.10 2.70
Orissa -0.65 -1.26 -0.55
Punjab 1.66 1.27 0.77
Rajastan -0.59 -0.93 -1.34
Tamil Nadu -0.68 -1.42 4.92
Uttar Pradesh -2.04 -3.10 -1.94
West Bengal 0.37 1.34 -0.50
India 0.09 -0.26 -0.33
Source: Avijit Mistri (2015)
10.14. For want of adequate protection and safeguards, large volumes of waste generated in
urban areas ultimately find entry into lakes, rivers and ocean, besides nearby forest (Fig.
10.3). It is quite common to come across large dumps of solid waste in the peripheral areas of
cities and towns (Fig. 10.4) which result in air pollution and leachate (Fig.10.5). Some of the
waste dumps are covered with a layer of soil (Fig. 10.6) to mitigate the impacts to some
extent. However, attempts at waste management are by and large half hearted. The reasons
for inadequate attention given to urban waste management could be many, but considering
the serious impact it has on the natural environment and human health, immediate and drastic
action for improvement in waste management is absolutely necessary.

10.15. Proper disposal of radioactive wastes which are generated in small quantities in
nuclear power plants is very important for the safety of human health as well as the
environment. As per information hosted in the website of the Department of Atomic Energy
(DAE, 2017), the low and intermediate level nuclear waste containing radioactive substances
Fig. 10.3 Waste discarded in
Doresanipalya forest,
Bengaluru
Fig. 10.4 Waste dump Mandoor in
Bengaluru
Fig. 10.5 Leachate collection at
Mandoor, Begaluru
Fig. 10.6 Landfill at Mandoor in
Bengaluru after covering with soil
generated at nuclear power plants is processed by fixing it in materials like cement, polymers,
glass, etc. The solidified waste is then stored in specially fabricated double walled high
integrity stainless steel containers. These containers are stored inside a high integrity concrete
pit at each of the nuclear power plant site. Such facilities are located at all the nuclear power
stations, namely, Kalpakkam (Tamilnadu), Tarapur (Maharashtra), Rawatbhata (Rajasthan),
Narora (Uttar Pradesh), Kakrapar (Gujarat) and Kaiga (Karnataka). The quantity of low as
well as intermediate level waste to be stored at site during the life time is within 0.15 cubic
meter/year/MW.
Municipal solid waste
10.16. Management of municipal solid waste is one of the basic functions of the
Municipalities. However, for effective waste management, the generators of waste have a
responsible role to play and it is necessary to drive home this concept to all the stakeholders.
The heritage city of Mysuru bagged the prestigious ‘Cleanest City’ in India award for two
consecutive years (2015 and 2016) before it moved to fifth spot in 2017. This achievement
has been possible due to proactive efforts of the Mysuru Mahanagara Palike (Mysuru City
Corporation) with unstinted support from the citizens of Mysuru. The Swachh Survekshan
2017 (Cleanliness survey) listed 27 urban local bodies of Karnataka in the list - Mysuru-5,
Mangaluru-63, Udupi-143, Shivamogga-147, Mandya-148, Tumkuru-152, Gadag Betagiri-
167, Hubbali-Dharwad-199, Bagalkot-203, Bengaluru-210, Bhadravati-217, Ranebennur-
220, Chikmagalur-225, Hasan-227, Belagavi-248, Bellary-283, Davanagere-288, Kalaburagi-
294, Vijayapura-312, Bidar-315, Hospet-317, Raichur-328, Chitradurga-337, Robertsonpet-
347, Kolar-373, Gangavati-381, Badami-388. The above rating by the Ministry of Urban
Development, GOI, included 423 cities which cover 72 per cent of the urban population of
the country.
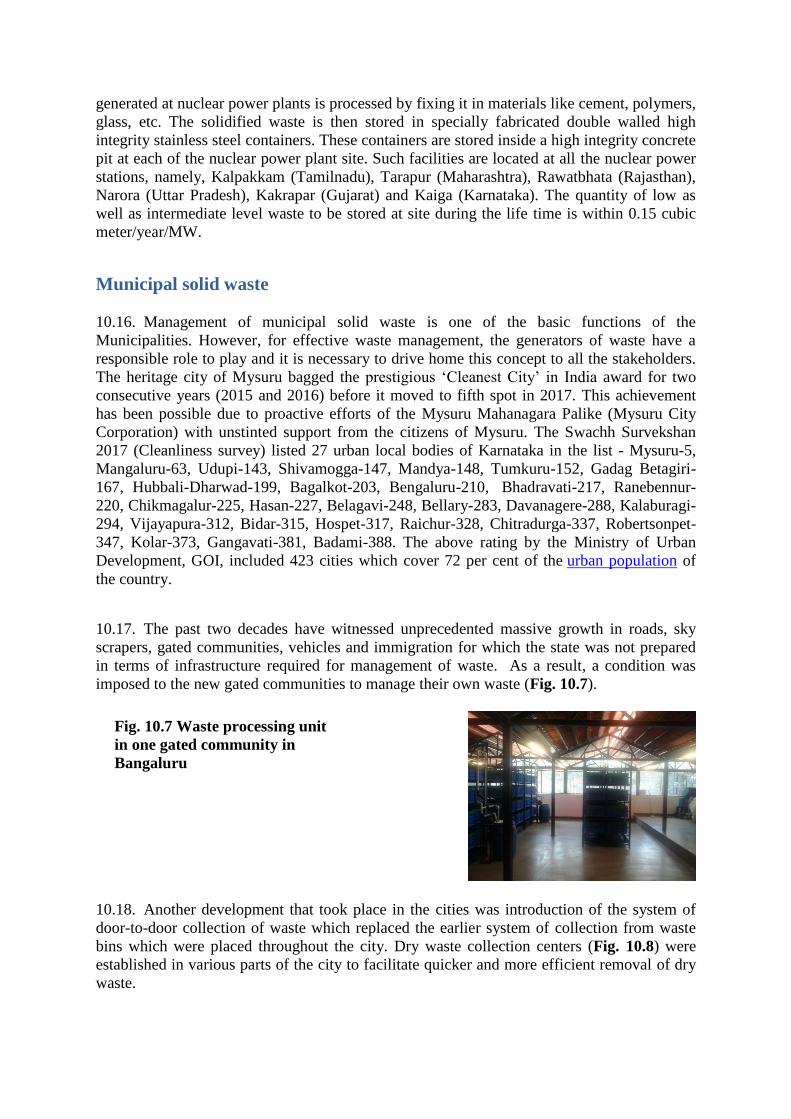
10.17. The past two decades have witnessed unprecedented massive growth in roads, sky
scrapers, gated communities, vehicles and immigration for which the state was not prepared
in terms of infrastructure required for management of waste. As a result, a condition was
imposed to the new gated communities to manage their own waste (Fig. 10.7).
10.18. Another development that took place in the cities was introduction of the system of
door-to-door collection of waste which replaced the earlier system of collection from waste
bins which were placed throughout the city. Dry waste collection centers (Fig. 10.8) were
established in various parts of the city to facilitate quicker and more efficient removal of dry
waste.
Fig. 10.7 Waste processing unit
in one gated community in
Bangaluru

10.19. In response to the demand for infrastructure and with an objective to improve the
quality of solid waste management (SWM) services in the limits of Bruhat Bengaluru
Mahanagara Palike (BBMP), the Government of Karnataka decided to establish facilities for
processing, treatment and disposal of solid waste. Such facilities (Fig. 10.9) have been
established in six locations besides upgrading the plant managed by the Karnataka Compost
Development Corporation (KCDC). These plants can handle about 2,300 tonnes per day
(TPD) of waste. The Karnataka Urban Infrastructure Development and Finance Corporation
(KUIDFC) have engaged consultants for the preparation of DPRs for treatment and disposal
facilities under the technical assistance component of the World Bank aided Karnataka
Municipal Reforms Project (KMRP). All necessary waste processing equipment and
machineries and waste handling vehicles have been procured.
10.20. There are totally 271 Urban Local Bodies(ULBs) in the State [BBMP, 10 city
corporations (CC), 57 city municipal councils (CMC), 113 town municipal councils (TMC)
and 90 town panchayaths (TP)]. As per the Municipal Solid Wastes (MSW) Rules, all the
ULBs are responsible for development of any infrastructure required for collection, storage,
segregation, transportation, processing and disposal of municipal solid wastes.
10.21. Table-10.4 provides the quantities of municipal solid waste generation, collection and
treatment in Karnataka. However, lack of data and its variation in the definitions of wastes as
well as variance in waste collection across cities/time, present too much uncertainty in the
trends of waste generation and disposal.
Table-10.4: Quantities of Municipal Solid Waste generation, collection and treatment
Municipal solid
Waste MT/ day
1999-2000
Generated in Class – I cities (TPD) 3,118
Generated in Class – II Towns (TPD) 160
Total Generated (TPD) 3,278
Fig. 10.8 Dry waste Collection
center at Koramangala, Bengaluru
Fig. 10.9 solid waste processing,
treatment and disposal facilities

Municipal solid
Waste MT/ day
(2009-12)
Generated (TPD) 6,500
Collected (TPD) 2,100
Treated (TPD) 2,100
Source: CPCB (2017)
10.22. Table-10.5 provides the details of the mechanical composting facilities in Bengaluru
and their current status.
Table-10.5: Details of the mechanical composting facilities and their current status
Name of the
Location
Extent(acres)
Capacity(TPD)
Status as on
31.03.2016
Lingadheeranahalli 11 200 Commissioned
Doddabidarkal 9 200 Commissioned
Kannahalli 23.75 500 Commissioned
Seegehalli 7 200 Commissioned
Subbarayanapalya 9.34 200 Commissioned
Chikkanagamangala 15.3 500 To be commissioned
KCDC, Kudlu 30 500 Processing of 200
TPD of waste
using existing
facility is in
progress
Upgradation
works underway
Funds allocated for solid waste management (SWM)
10.23. Under the State Budget, Rs.51.82 crore was provided during the year 2013-14. A sum
of Rs.75 crore was exclusively released during the year 2014-15 to ULBs of the state for
SWM purposes. A sum of Rs.45 crore was allocated in 2015-16. Under Swachh Bharat
Mission, the Ministry of Urban Development (MoUD), GOI has allocated Rs.512.52 crore as
central share for SWM in 219 ULBs of Karnataka including BBMP (Department of
Planning,Programme Monitoring & Statistics, Government of Karnataka).
The provisions of Karnataka Municipal Corporation (KMC) Act, 1976 empowered Corporations to
levy SWM cess on every owner or occupier of buildings or lands or both in the city and prescribed the
rate of cess on plinth area basis. The rates for collection of SWM cess (March 2004) ranged from a
minimum of Rs. 10 per month for a residential building of plinth area up to 1,000 square feet (sqft) to
a maximum cess rate of Rs. 600 per month for hotels, kalyanamantapas, etc., with plinth area
exceeding 50,000 sqft(Table 10.6)(CAG, 2014).
From the year 2011-12 onwards, the payment of SWM cess was linked to property tax returns. BBMP
realised `66.54 crore as user charges during 2011-13, which was only 17 per cent of the projected
Operation & Maintenance (O&M) cost (`402.34 crore). This resulted in extra burden on BBMP in
meeting these expenses at the cost of creating infrastructure facilities. Actual collection ofuser
charges during 2011-13 was 73 per cent of the collection proposed (`90.62 crore) in Detailed Project
Report (CAG, 2014).
BBMP had notified (February 2011) that cess will be collected with property tax. As the property tax
returns were not filed in respect of BBMP-rented properties, these properties did not pay SWM cess.
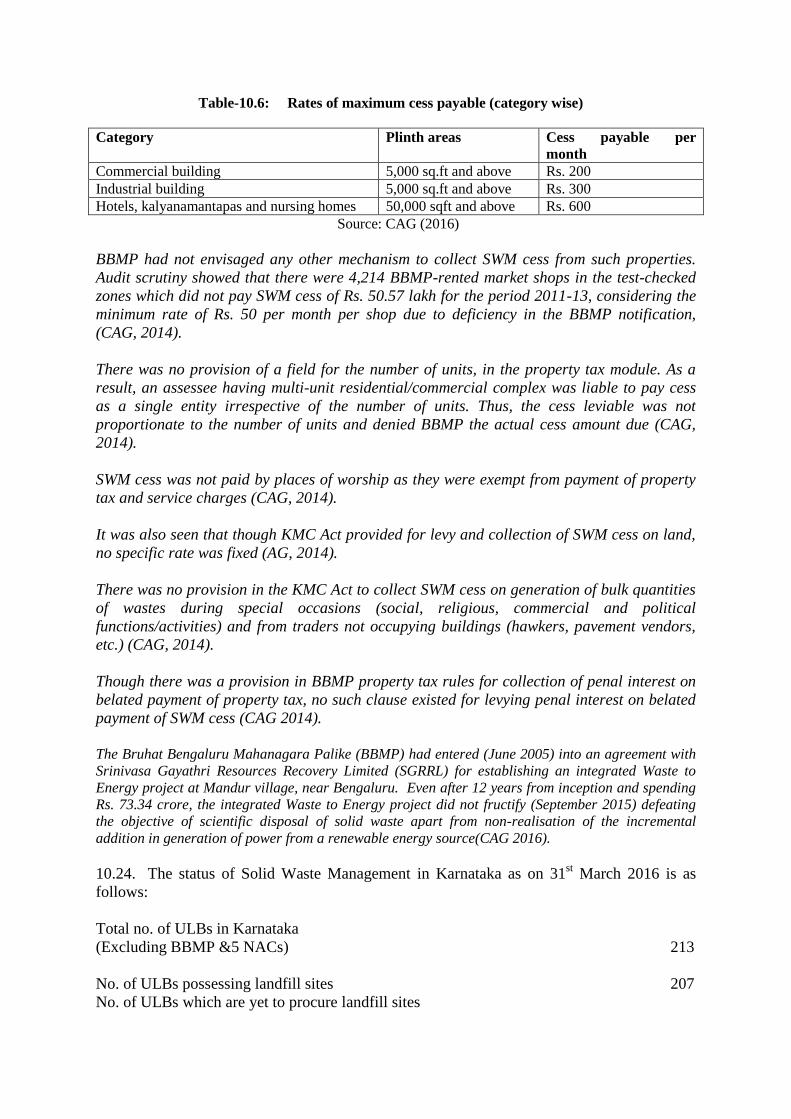
Table-10.6: Rates of maximum cess payable (category wise)
Category Plinth areas Cess payable per
month
Commercial building 5,000 sq.ft and above Rs. 200
Industrial building 5,000 sq.ft and above Rs. 300
Hotels, kalyanamantapas and nursing homes 50,000 sqft and above Rs. 600
Source: CAG (2016)
BBMP had not envisaged any other mechanism to collect SWM cess from such properties.
Audit scrutiny showed that there were 4,214 BBMP-rented market shops in the test-checked
zones which did not pay SWM cess of Rs. 50.57 lakh for the period 2011-13, considering the
minimum rate of Rs. 50 per month per shop due to deficiency in the BBMP notification,
(CAG, 2014).
There was no provision of a field for the number of units, in the property tax module. As a
result, an assessee having multi-unit residential/commercial complex was liable to pay cess
as a single entity irrespective of the number of units. Thus, the cess leviable was not
proportionate to the number of units and denied BBMP the actual cess amount due (CAG,
2014).
SWM cess was not paid by places of worship as they were exempt from payment of property
tax and service charges (CAG, 2014).
It was also seen that though KMC Act provided for levy and collection of SWM cess on land,
no specific rate was fixed (AG, 2014).
There was no provision in the KMC Act to collect SWM cess on generation of bulk quantities
of wastes during special occasions (social, religious, commercial and political
functions/activities) and from traders not occupying buildings (hawkers, pavement vendors,
etc.) (CAG, 2014).
Though there was a provision in BBMP property tax rules for collection of penal interest on
belated payment of property tax, no such clause existed for levying penal interest on belated
payment of SWM cess (CAG 2014).
The Bruhat Bengaluru Mahanagara Palike (BBMP) had entered (June 2005) into an agreement with
Srinivasa Gayathri Resources Recovery Limited (SGRRL) for establishing an integrated Waste to
Energy project at Mandur village, near Bengaluru. Even after 12 years from inception and spending
Rs. 73.34 crore, the integrated Waste to Energy project did not fructify (September 2015) defeating
the objective of scientific disposal of solid waste apart from non-realisation of the incremental
addition in generation of power from a renewable energy source(CAG 2016).
10.24. The status of Solid Waste Management in Karnataka as on 31st March 2016 is as
follows:
Total no. of ULBs in Karnataka
(Excluding BBMP &5 NACs) 213
No. of ULBs possessing landfill sites 207
No. of ULBs which are yet to procure landfill sites

(Devanahalli, Vijayapura, Dandeli & Kolar) 4
No. of ULBs having common landfill sites
(Ullala TMC in Mangalore CC & Saligrama TP in Udupi CMC) 2
No. of ULBs in which basic infrastructures at landfill sites are established 191
No. of ULBs in which sanitary landfill facilities are developed (Mangalore,
Belgaum, Udupi, Shimoga, Karwar, Puttur, Kundapur, Kalaburagi,
Bellary, Bagalkot, Mudhol, Chitradurga and Mysuru)
13
No. of ULBs in which composting facilities such as Windrow platforms /
vermi sheds are constructed / being constructed 155
Number of ULBs in which Door to Door collection of waste is carried out
(partially) 205
Number of ULBs in which segregation is started (partially in few wards) 106
10.25. In order to operate and maintain these plants, Private Operators have been appointed
through a “Performance Based Management Contract” for carrying out day-to-day operations
in an efficient and effective manner.
10.26. As per ‘Status Report on Municipal Solid Waste Management’ published by CPCB,
the key issues relating to management of MSW in the country are as follows:
(i) There is no comprehensive short and long term plan with municipal authorities to
handle MSW in accordance with the MSW Rules, 2000.
(ii) Majority of the municipal authorities do not have preparedness to set up waste
processing and disposal facilities.
(iii) Waste management is being looked either for making wealth or generate revenue;
or otherwise is allowed to putrefy in cities/towns.
(iv) Cities and towns, in future, will not get wastelands for further dumping of wastes.
In fact, there will be a need to go for ‘total’ recycling and re-use of waste and aim
for negligible or ‘Zero Waste’ for land filling.
Observation made in Report of the Comptroller and Auditor General of India on Local Bodies for the year ended March 2013 10.27. “Bruhat Bangalore Mahanagara Palike discharges its obligatory function of solid
waste management as per the provisions of Karnataka Municipal Corporations Act, 1976. A
performance audit of solid waste management in Bruhat Bangalore Mahanagara Palike
showed, inter alia, the absence of a notified policy for solid waste management, resulting in
lack of direction for effective management and scientific disposal of waste. Absence of
reliable and complete data about quantum of waste generated in the city, non preparation of
contingency plan and inadequate institutional mechanism rendered waste management
programmes ineffective. Consequently, the main objectives of minimising the burden on the
landfills, as envisaged in Municipal Solid Waste Rules and prevention of environmental
degradation were not achieved. Inadequate operational controls resulted in weak financial
management, leading to unfruitful and excess expenditure as well as diversion of funds.
Bruhat Bangalore Mahanagara Palike had lost the assistance of `280.17 crore due to delay
in preparation of master plan. Efficiency in collection of waste was poor and no efforts had

been made to promote waste segregation. Lack of scientific processing facilities at landfill
sites and noncompliance with the rules resulted in open dumping of mixed wastes leading to
environmental pollution. Adequate efforts to mobilise revenue resources through user
charges were not made to meet the cost of operation and maintenance for waste
management. Cases of improprieties in contract management of works relating to waste
management wherein payment of `630.28 crore made to contractors for packages and
additional works were also observed. Lack of monitoring by Bruhat Bangalore Mahanagara
Palike and Urban Development Department resulted in unscientific disposal of wastes posing
potential public health hazards (CAG, 2014).”
Plastic Waste 10.28. The Forest, Ecology and Environment Department, Government of Karnataka, vide
Notification No. FEE 17 EPC 2012, Bangalore Dated 11.03.2016 and in exercise of the
powers conferred under the Environment (Protection) Act, 1986, issued directions imposing
ban on manufacture, supply, sale and use of plastic carry-bags, plastic banners, flex, plastic
flags, plastic plates, plastic cups, plastic spoons, cling films and plastic sheets used for
spreading on dining table including the above items made out of thermocol and plastic which
use plastic micro beads in Karnataka. However, exemption has been given to plastic carry
bags manufactured exclusively for export against export orders located in a special economic
zone and export oriented units. The state has also exempted plastic used for milk and milk
products, apart from those which constitute an "integral part of packaging in which goods are
sealed prior to use at manufacturing/processing units”. The exemption is also extended to use
of plastic in horticulture and nurseries for raising plants/seedlings on indents from
government departments.
10.29. Most of the plastic waste is disposed through recycling (Fig.10.10), road making,
processing and rest is either unattended or left to enter waste piles/waste dumps. Apart from
disposal of waste generated in Karnataka, waste from Goa is being disposed in M/s. ACC,
Wadi and Vasvadatta cement works for co-processing of plastic waste generated in the state
of Goa (GSPCB, 2013).
Observations made in Report of the Comptroller and Auditor General of India on Local Bodies for the year ended March 2013
10.30. Audit by comptroller and auditor general of India observed the following in respect of plastic
wastes for the year ended in March 2013 (CAG 2016):
a) During joint physical verification of landfills, huge quantities of plastics were seen dumped at the
sites without recovering the plastic for channelisation to recyclers.
Fig. 10.10 Plastic recycling unit
in Bengaluru

b) Segregation of waste was minimal and the processing of plastics was done only in two out of ten
landfills.
c) Under the principle of Extended Producer’s Responsibility (EPR) plastic manufacturers should
finance the establishment of plastic waste collection centers but no action was taken by BBMP in this
regard.
d) Plastic rules were not incorporated in the Municipal bye laws of BBMP.
Bio Medical Waste
10.31. The income of the health care sector in Karnataka is projected to shoot up to US$ 30
billion by 2020 from the current income of about US$5 billion (Techspirit, 2015). This
projection has been made in view of large numbers of hospital admissions for health-related
problems many of which can be attributed to pollution and indiscriminate disposal of waste in
addition to numerous injury-related cases due to accidents. In addition to large numbers of
multispecialty hospitals, one is not be surprised in Bengaluru to see self-proclaimed health
treatment centers run in makeshift tents (Fig. 10.11) adjacent to busy roads in the heart of the
city.
10.32. The quantum of biomedical waste generated in India is estimated to be 1-2 kg per bed per day
in a hospital and 600 gm per bed per day in a clinic. About 85% of the hospital waste is non-
hazardous and the remaining 15% is infectious or hazardous.
10.33. Recycling is an indicator of community commitment to share the responsibility for
environmental stewardship. But biomedical waste should not be recycled considering the
impact on human health. Reusing containers of chemicals and pathological samples for
plastic cups or spoons is not a welcome idea and so also is using contaminated cotton to make
ear-buds and toys. Even though there is lack of evidence and no history of punishment, the
practice cannot be ruled out considering that cheap toys/ear-buds/plastic items are sold in the
foot paths and road joints in Bengaluru and other cities.
10.34. Mixing of hazardous waste results in contamination and it makes the entire waste
hazardous. Hence it is necessary to segregate hazardous waste from non-hazardous waste and
treat these wastes separately. Improper disposal increases risk of infection, encourages
recycling of prohibited disposables and disposed drugs and encourages development of
resistant micro-organisms (PIB, 2016).
10.35. Karnataka is one among five states in India which have been chosen for Global
Environment Facility (GEF)-financed project, namely, “Environmentally Sound Management
of Medical Waste in India” to be implemented in 28 healthcare facilities and one model
district each in Karnataka, Punjab, Maharashtra, Gujarat, and Odisha. Mysuru district has
been taken up as a model district for implementing the project.
10.36. The Bio-medical waste generated from the Health Care establishments is being monitored in
accordance with the provisions of the Bio Medical Waste (Management & Handling) Rules 1998. The
KSPCB has identified 27,746 health care establishments and the Drugs Control department has
identified 26,658 pharmaceutical stores (Table-10.7) in the State. It is estimated that 52 tonnes of
biomedical waste is generated in the State per day, which either are sent to 25 common bio-medical
waste treatment facilities in the State or are disposed in the captive facilities (KSPCB, 2016).

Table-10.7: Supply chain with respect to Pharmaceutical and cosmetic goods
Particulars 2011-12 (31-03-2012)
Number of Manufacturers in the State
Regular license 230
Loan Licenses 272
Cosmetic Licenses 059
Cosmetic Loan Licenses 024
Re packing Licenses 005
Approved Laboratories 015
Blood Banks 176
Blood Storage Centers 103
Number of Sales premises in the State 26,658
Source: Drugs Control Department (2017)
10.37. Not all blood collected (Table 10.8) is used for administering to needy patients.
Outdated blood has to be disposed of as medical waste. During 2015-16, 64,361 blood units
were disposed of out of which 32,644 units were ‘outdated’ (Niranjan, 2017).
Table-10.8: Blood collection units
Year
2010-11 2011-12 2012-13 2013-14 2014-15 2015-16
(Apr-Dec)
Total blood
units collection
6,14,787 5,94,512
6,60,138 6,94,151 7,54,485 4,83,681
Blood units
collected from
voluntary
donors
3,78,933 3,93,694 4,35,258 4,08,974 5,19,260 3,45,992
Source: DPPMSGoK (2016)
10.38. Biomedical waste is generated right from child/animal birth and subsequently at all
stages of diagnosis, immunization, treatment and research. During 2014-15, 28.45 lakhs
artificial inseminations were done in the state resulting in birth of 6.30 lakh calves. The total
weight of placenta (considering weight of placenta as 4kg/birth) for the year 2014-15 was
25,20,000 kg (2,520 tonnes). The figure for humans for the said year was 55, 88, 390 kg
(5,588 tonnes) (Table-10.9).
Fig. 10.11 Make shift health
care establishment on foot path
of Bengaluru

Table-10.9: Estimation of quantity of waste from child birth
Year Birth
rate
Birth considering base population
of 61,095,297
Weight of placenta (@0.5
kg/birth)
2011 18.8 11482156 5741078
2012 18.5 11298930 5649465
2013 18.3 11176779 5588390
2014 18.3 11176779 5588390
2015 18.3 11176779 5588390
Source :Source: DPPMSGoK (2016)
Observation made in Report of the Comptroller and Auditor General of India on Local Bodies for the year ended March 2013
10.39. Audit scrutiny of BMW Registers for the period from December 2010 to March 2013
showed that there were 1,051 instances when BMW had not been collected on a daily basis
from 24 Referral hospitals/maternity homes. Untreated BMW had not been collected up to six
days, which was in violation of BMW Rules.
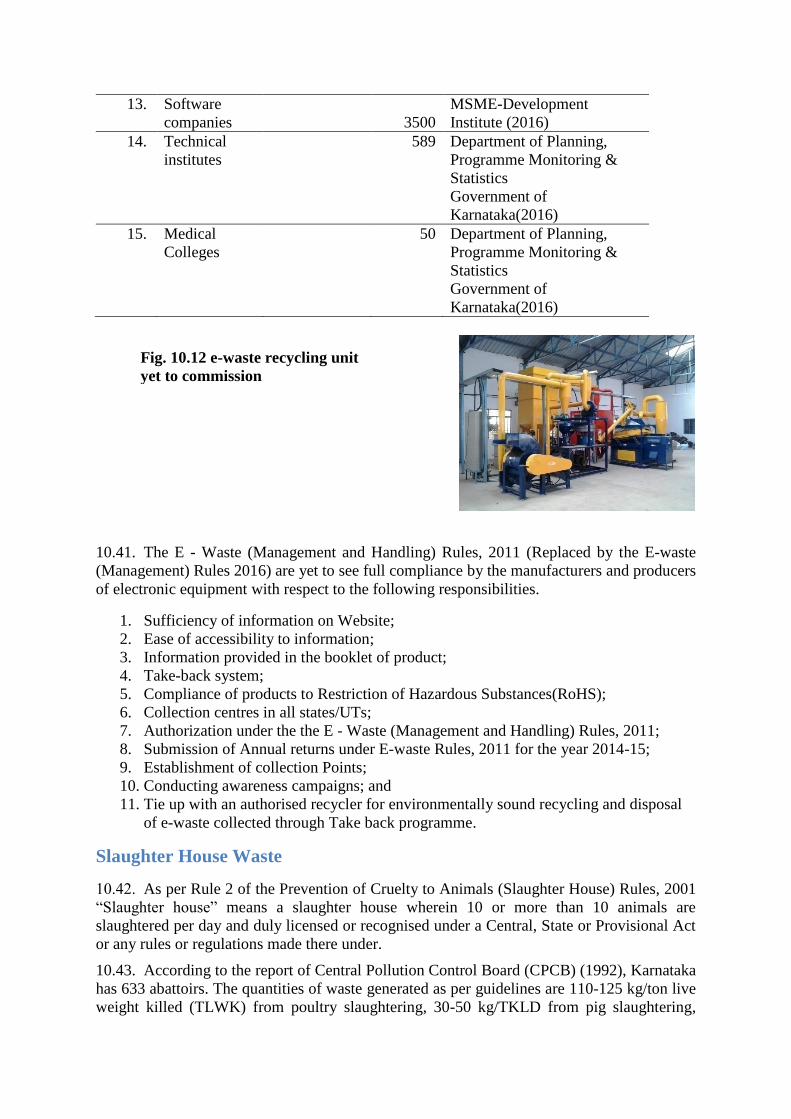
Electronic Waste 10.40. The Karnataka State Pollution Control Board (KSPCB) has authorized 50 units for
recycling (Fig. 10.12) and dismantling of e-waste of capacity 44,680.5 MTPA. These
recyclers help in re-use and recovery of resources and reduction of waste to the landfill sites.
Table-10.10 gives major bulk consumers excluding school/college/corporate offices.
Table-10.10: Major bulk consumers
Sl. No. Bulk Consumers Number Source
Type Subtype
1. Karnataka
State
government
office
Departments 38 GOK (2017a)
2. Boards &
Corporations
16 GOK (2017b)
3. Central
government
offices
157 Central government welfare
coordination committee
(2009)
4. Universities State 18 Education information (2017)
5. Central 1
6. Deemed 15
7. Banks 46 Tax information network of
income tax department(2017)
8. Airport International 1 Airport Authority India
(2017) 9. Customs 1
10. Domestic 3
11. Ports 10 Department of Ports and
Internal Water Transport
(2017)
12. Railways 1
13. Software
companies
3500
MSME-Development
Institute (2016)
14. Technical
institutes
589 Department of Planning,
Programme Monitoring &
Statistics
Government of
Karnataka(2016)
15. Medical
Colleges
50 Department of Planning,
Programme Monitoring &
Statistics
Government of
Karnataka(2016)
10.41. The E - Waste (Management and Handling) Rules, 2011 (Replaced by the E-waste
(Management) Rules 2016) are yet to see full compliance by the manufacturers and producers
of electronic equipment with respect to the following responsibilities.
1. Sufficiency of information on Website;
2. Ease of accessibility to information;
3. Information provided in the booklet of product;
4. Take-back system;
5. Compliance of products to Restriction of Hazardous Substances(RoHS);
6. Collection centres in all states/UTs;
7. Authorization under the the E - Waste (Management and Handling) Rules, 2011;
8. Submission of Annual returns under E-waste Rules, 2011 for the year 2014-15;
9. Establishment of collection Points;
10. Conducting awareness campaigns; and
11. Tie up with an authorised recycler for environmentally sound recycling and disposal
of e-waste collected through Take back programme.
Slaughter House Waste
10.42. As per Rule 2 of the Prevention of Cruelty to Animals (Slaughter House) Rules, 2001
“Slaughter house” means a slaughter house wherein 10 or more than 10 animals are
slaughtered per day and duly licensed or recognised under a Central, State or Provisional Act
or any rules or regulations made there under.
10.43. According to the report of Central Pollution Control Board (CPCB) (1992), Karnataka
has 633 abattoirs. The quantities of waste generated as per guidelines are 110-125 kg/ton live
weight killed (TLWK) from poultry slaughtering, 30-50 kg/TKLD from pig slaughtering,
Fig. 10.12 e-waste recycling unit
yet to commission

167-173 kg/TKLD from goat and sheep slaughtering and 250-320 kg/TKLD from bovine
slaughtering.
10.44. As per the guidelines dated 05-02-2014 for Slaughter Houses issued by Karnataka
State Pollution Control Board:
1. The slaughter houses shall be treated like food industry.
2. Similar to any industrial plant, slaughter house should have proper treatment plant for
waste water and control equipment for the air emissions from the various sources.
3. New slaughter house shall be located in accordance with CPCB guidelines i.e. outside
or on periphery of the city/town and shall be away from the Airport. Main services
such as water, electricity and waste disposal facility are prerequisite.
4. The slaughter houses shall be located preferably at aerial distance of 1 kilometre away
from solid waste management processing facility/land fill site identified and not less
than 500 meters away from common waste facility like STP/ETP/CBMWTP to
prevent menace from birds and stray animals which are mainly responsible for
spreading infectious diseases.
5. The slaughter houses shall be provided with green belt with at least 5 rows of tall trees
all along the boundary
6. The existing slaughter houses, if operating within the core area of the town / city,
shall provide treatment plant and control equipments and may discharge the effluent
to the area specified in the consent issued by the KSPCB from time to time.
10.45. But considering the current scenario the reality is far from the statutory and scientific
requirements. Many animals are slaughtered within the meat shops to cater to the growing
need of the non-vegetarian community (Table-10.11, Table-10.12). As per (DPPMS,GoK,
2016) Karnataka has witnessed decline in consumption of Livestock and increase in
consumption of Poultry.
Table 10.11: Livestock and poultry statistics in Karnataka
Particulars Livestock census number in crore Percentage change in
2012 over 2007 2003 2007 2012
Cattle 0.95 1.05 0.95 -9.52
Buffalo 0.40 0.43 0.35 -18.60
Goat & Sheep 0.18 1.57 1.44 -8.28
Other Livestock 0.30 0.24 0.16 -33.33
Total live stock 2.83 3.29 2.9 -11.85
Poultry 2.44 4.24 5.34 25.94
Source: DPPMSGoK (2016)
Table-10.12: Meat production from 2011-120 to 2015-16 (in Tons)
2011-12 2012-13 2013-14 2014-15 2015-16 (up to
Dec 2015)
Percentage change in
2014-15 over 2013-14
139553 166059 169894 181312 177323 6.72
Source: DPPMSGoK (2016)
10.46. In order to achieve scientific disposal of waste generated in slaughter houses, modern
abattoirs are planned in major cities of the state. There is a proposal for establishing modern abattoirs
at nine urban local bodies to be executed in a time bound manner by the local bodies.

10.47. Rapidly growing waste from meat and food items has resulted in the increase in street dog
population; incidents of attack of children by these dogs have become very common. Apart from
slaughtering in slaughter houses and meat shops, animals are also butchered at individual
residences and places of worship and the waste is disposed of unscientifically. Box 10.3
provides legislations about killing of animals.

Box 10.3 Legislations restricting killing of animals
10.48. As many as 60 dog bite cases were reported in the KC General Hospital, Bengaluru on
a single day in Bangalore in November 2009. This is apart from the average number of 20 to
25 cases reported daily in each government-run and BBMP hospital. Bites by pets are fewer
than stray dog bites. Between April and December 2006, there were 13,419 cases of dog bites
out of which pet dogs accounted for 41 per cent or 5,544 cases (Ravi Sharma, 2007). During
June 2009, there were 1,106 stray dog bites and 820 pet dog bites. The numbers during July,
As per Section 428 of the Indian Penal Code 1860
Mischief by killing or maiming animal of the value of ten rupees.—Whoever
commits mischief by killing, poisoning, maiming or rendering useless any
animal or animals of the value of ten rupees or upwards, shall be punished
with imprisonment of either description for a term which may extend to two
years, or with fine, or with both.
As per Section 429 of the Indian Penal Code 1860
Mischief by killing or maiming cattle, etc., of any value or any animal of the
value of fifty rupees.—Whoever commits mischief by killing, poisoning,
maiming or rendering useless, any elephant, camel, horse, mule, buffalo, bull,
cow or ox, whatever may be the value thereof, or any other animal of the
value of fifty rupees or upwards, shall be punished with imprisonment of
either description for a term which may extend to five years, or with fine, or
with both.
As per Section 11 of the Prevention of Cruelty To Animals Act, 1960,
person treating animals cruelly shall be punishable in the case of a first
offence, with fine which shall not be less than ten rup6es but which may
extend to fifty rupees and in the case of a second or subsequent offence
committed within three years of the previous offence, with fine which shall not
be less than twenty-five rupees but which may extend, to one hundred rupees
or with imprisonment for a term which may extend, to three months, or with
both.
Nothing in this section shall apply to –
(a) the dehorning of cattle, or the castration or branding or noseroping of any
animal in the prescribed manner, or
(b) the destruction of stray dogs in lethal chambers by such other methods as
may be prescribed or
(c) the extermination or destruction of any animal under the authority of any
law for the time being in force; or
(d) any matter dealt with in Chapter IV; or (e) the commission or omission of
any act in the course of the destruction or the preparation for destruction of
any animal as food for mankind unless such destruction or preparation was
accompanied by the infliction of unnecessary pain or suffering.

August and September, 2009 were stray dogs bites (807, 729 and 674 persons) as against pet
dog bites (609, 660 and 623 persons) respectively (Hindu 2009). As per 19th Livestock
Census 2012, there were 1.03 lakh stray dogs in Bengaluru City and 34,125 in Bengaluru
Rural. However, NGOs such as CUPA and Sarvodaya Sevabhavi Samstha estimate that the
number could be as high as 3.5 lakh (both urban and rural) (Sarumathi, 2017).
10.49. As animal birth control measures have not been very effective in Bengaluru, dogs are
multiplying at an alarming rate. The city’s decaying garbage problem has made waste dumps
a favorite haunt for dogs (Deccan Chronicle, 2017). BBMP had brought out ‘Guidelines for
the grant of compensation to the victims of attacks by stray dog/s.’ in order to compensate
victims of attacks by stray dogs.
Observation made in Report of the Comptroller and Auditor General of India on Local Bodies for the year ended March 2013
10.50. There are three slaughter houses functioning under the jurisdiction of BBMP. About 18.95
lakh animals were slaughtered in these three slaughter houses during the period 2009-13 and animal
waste generated during this period ranged from 7 to 8.25 MT per day. The details for 2008-09 had
not been furnished to Audit. On the directions (August 2002) of the Hon’ble High Court of Karnataka
to relocate slaughter houses to the outskirts of city limits, BBMP had purchased(July 2005 and
August 2006), from Karnataka Industrial Area Development Board (KIADB), 40.68 acres of land at
Iggalur for a sum of `2.24 crore. However, the construction of modern abattoir at Iggalur could not
be taken up due to public protests. BBMP then purchased (November 2009) another 40 acres of land
from KIADB at Harohalli for `24 crore, besides paying a sum of `93.51 lakh as penal interest for
delayed payment. However, the project at Harohalli was also not completed due to public protests.
Thus, the expenditure of `27.18 crore incurred on purchasing lands at Iggalur/Harohalli has
remained unfruitful (January 2014) and slaughter houses continue to function within the city limits.
The civil slaughter house at Tannery Road is the oldest slaughter house operating since 1920. The
authorisation and consent granted (October 2008) by KSPCB to operate this slaughter house was
valid up to June 2009. However, the authorisation was not renewed as KSPCB had pointed out
following persistent violations in the operation and maintenance of the slaughter house (CAG 2014):
The Effluent Treatment Plant (ETP) constructed for treatment of wash water was not
working;
The untreated effluents were being discharged into BBMP storm water drains and foul smell
spread to the surrounding areas;
The sample analysis report of untreated effluent to the adjacent storm water drain showed
that total suspended solids had exceeded the stipulated standards;
The housekeeping near ETP was very poor; and
Solid waste, accumulated cow dung and other body parts of animals were not disposed off
properly. Despite opportunities given by KSPCB, BBMP did not comply with the conditions
stipulated by the Board. The slaughter house continued to operate without valid
authorisation. Finally, KSPCB issued (April 2013) prohibitory orders to prevent the
discharge of effluent outside the premises or into storm water drain. However, it was
observed during joint physical verification (July 2013) that the slaughter house was
functioning in insanitary conditions and the violations, as observed by KSPCB, still persisted.
Some of the photographs below taken during joint inspection confirm the audit contentions.
Hazardous waste
10.51. Most of the hazardous waste in the state comes from industries even though waste like
paint/pesticide/chemical bins from residential/institutional/agricultural activity contributes to
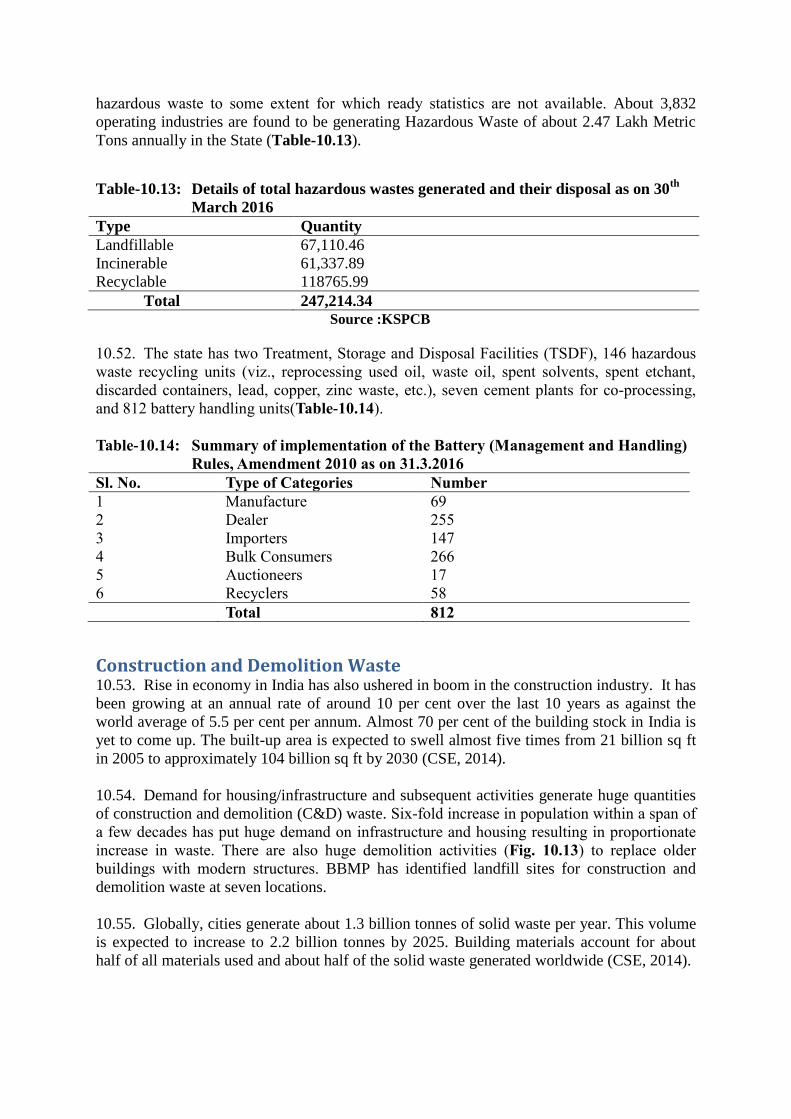
hazardous waste to some extent for which ready statistics are not available. About 3,832
operating industries are found to be generating Hazardous Waste of about 2.47 Lakh Metric
Tons annually in the State (Table-10.13).
Table-10.13: Details of total hazardous wastes generated and their disposal as on 30th
March 2016
Type Quantity
Landfillable 67,110.46
Incinerable 61,337.89
Recyclable 118765.99
Total 247,214.34
Source :KSPCB
10.52. The state has two Treatment, Storage and Disposal Facilities (TSDF), 146 hazardous
waste recycling units (viz., reprocessing used oil, waste oil, spent solvents, spent etchant,
discarded containers, lead, copper, zinc waste, etc.), seven cement plants for co-processing,
and 812 battery handling units(Table-10.14).
Table-10.14: Summary of implementation of the Battery (Management and Handling)
Rules, Amendment 2010 as on 31.3.2016
Sl. No. Type of Categories Number
1 Manufacture 69
2 Dealer 255
3 Importers 147
4 Bulk Consumers 266
5 Auctioneers 17
6 Recyclers 58
Total 812
Construction and Demolition Waste 10.53. Rise in economy in India has also ushered in boom in the construction industry. It has
been growing at an annual rate of around 10 per cent over the last 10 years as against the
world average of 5.5 per cent per annum. Almost 70 per cent of the building stock in India is
yet to come up. The built-up area is expected to swell almost five times from 21 billion sq ft
in 2005 to approximately 104 billion sq ft by 2030 (CSE, 2014).
10.54. Demand for housing/infrastructure and subsequent activities generate huge quantities
of construction and demolition (C&D) waste. Six-fold increase in population within a span of
a few decades has put huge demand on infrastructure and housing resulting in proportionate
increase in waste. There are also huge demolition activities (Fig. 10.13) to replace older
buildings with modern structures. BBMP has identified landfill sites for construction and
demolition waste at seven locations.
10.55. Globally, cities generate about 1.3 billion tonnes of solid waste per year. This volume
is expected to increase to 2.2 billion tonnes by 2025. Building materials account for about
half of all materials used and about half of the solid waste generated worldwide (CSE, 2014).

10.56. In India, although some valuable material is recovered from construction and
demolition (C&D) waste and some of it is used for filling, most of it gets disposed in landfills
or through unauthorized dumping in low lying areas, open spaces, road sides or water bodies
creating enormous nuisance and environmental problems. India requires a paradigm shift
from a dumping based approach to efficient utilization of C&D Waste. C&D Waste can be
recycled to replace natural building material; this is not only beneficial for the environment
but also results in substantial saving in costs and resources.
10.57. The normal rate of generation of C&D Waste from construction, repair and
demolition are 40 kg/sq.m, 50 kg/sq.m and 450 kg/sq.m respectively (GIZ, 2016). About
30% of C&D waste in India comprises of Bricks Masonry while 35 % constitutes soil, sand
and gravel (GIZ, 2016).
10.58. Construction and demolition is usually carried out by contractors meant for the
purpose. A portion of the waste is sold to dealers specialized in their trade. Many local
entrepreneurs are active in reusing the waste. Considering the magnitude of the problem,
Government of India notified Construction and Demolition (C &
D) Waste Management Rules, 2016. As per the rules, duties of C&D waste generator are
clearly defined. Further Central Pollution Control Board in 2017 has published Guidelines on
Environmental Management of Construction & Demolition (C&D) Wastes.
Best Practices
10.59. Any state or country cannot develop or manage environment in isolation with global
happenings. Many of the concepts, legislations and policies in developing countries are
influenced by or borrowed from abroad and adopted due to intervention of development
agencies. Industrial Emissions Directive (EU, 2010) of the European Union sets out
requirements for some 50,000 large industrial installations to avoid or minimize emissions
and waste. Similar approach in all sectors including government departments, hotel,
education, tourism, manufacturing, transportation and service sector is required to protect the
fragile ecosystem which is already under tremendous pressure.
10.60. Efficiency of any system depends on sufficiency of resources. Better waste
management needs better monitoring of waste generated. This requires enhancement and
improvement in manpower in the implementing, enforcement and monitoring wings. There is
also need for proper documentation at all levels.
Fig. 10.13 Demolition activity in
Bangalore

10.61. The environmental Kuznets curve hypothesis proposes that an economy tends to
degrade its environmental quality during its early economic growth, but that beyond a
threshold point in its economic augmentation, its environmental quality starts to improve as
per-capita income continues to grow (Van Alstine and Neumayer, 2009). While data with
respect to Karnataka is not sufficient to substantiate the hypothesis, the migration and
spending capacity of migrants play important parameters as the affluent migrants contribute
to waste generation while the poor migrants in slums may collect the waste for recycling.
10.62. Confederation of Indian Industry (CII) in association with Cement Manufacturers
Association (CMA) is working on an initiative to facilitate use of urban and industrial waste
as Alternate Fuel and Raw Materials (AFR) in Indian cement industry; the main objective of
the project is to accelerate AFR initiatives in the country, leveraging the Cement sector,
through capacity building, data availability and facilitating exchange of waste by working
closely with Central Pollution Control Board (CPCB) and State Pollution Control Boards
(PCB)(CII waste exchange, 2017).
10.63. 'Towards a circular economy — A zero waste programme for Europe’ proposed by
the European Commission (EC, 2014) breaks down the overarching aim of achieving a zero-
waste society into a set of more specific interim targets. As per the said communication, the
transition to a circular economy requires changes across consumption choices, supply chains,
including in product design, business models, and prevention and management of waste.
Adoption of similar policy in Karnataka would help to reduce impact of waste on
environment.
10.64. Between 2004 and 2010, Iceland and Norway reduced the amount of waste deposited
in landfills substantially. Better waste management has decreased pressures associated with
waste disposal, such as pollution from incineration or land filling. But it has also mitigated
pressures associated with extracting as well as processing new resources.
10.65. Without proper staff strength in enforcing agency it is not possible to achieve
objectives of the organization. Comparison of staff strength of a few Environmental Enforcing
Agencies is discussed in Box 10.4. There is urgent need to enhance the staff strength in proportion to
population of the state.

Box 10.4: Comparison of Staff Strength of a few Environmental Enforcing Agencies
Recommendations and Suggestions
10.66. Since the 1990s, the recognition of diffuse pressures from various sources has led to
an increased focus on the integration of environmental concerns in many developed countries
within sectoral policies, such as in transport or agriculture, with mixed results. Karnataka
needs to integrate waste policy with migration, industrialization, education, housing, tourism
and transportation.
10.67. Establishment of few collection centers in industrial, commercial and residential areas
for efficient collection of different categories of waste from smaller generators and
transferring the same to authorized recyclers may be considered.
10.68. Many organizations have to take multiple permits (consent, authorization,
registration) and file multiple returns. Hence single comprehensive legislation combining
different waste rules together would improve ease of business and reduce paper work.
10.69. Apart from these, interventions required to enhance waste management are outlined in
Table-10.15.
Environment agency (Environmental enforcing agency in England and Wales) has a strength of
about 1,900 people across England (Population: about 53 million) and Wales (population: 30.064
million) (Epanet 2017). USEPA of USA (Population: around 313 million) employs about 15,408
people (USEPA 2017). Swedish Environment Protection Agency of Sweden (population: about
9.6 million) has about 530 employees (Epanet 2017). Umweltbundesamt (Environment Agency)
of Austria (Population: about 8.5 million) has 501 employees (Epanet 2017). Finnish Environment
Institute has staff strength of about 700 in Finland (Population: nearly 5.5 million).
Umweltbundesamt (Federal Environment Agency) of Germany has about 1,500 employees in
Germany (Population: about 82 million) and PBL Netherlands Environmental Agency has about
200 staff (Epanet 2017) in Netherlands (Population: about 17 million). The Federal Office for the
Environment in Swtizerland has staff of about 485 (Epanet 2017) in Switzerland (Population:
about 8.37 million). Environment Protection Agency of Denmark has staff strength of about 430
(Epanet 2017) in Denmark (Population: about 5.75 million).
As on 31.03.2016 the total staff of SPCB was 333 while staff responsible for enforcement
in SPCB stood at 149 serving a community of more than six crore population.

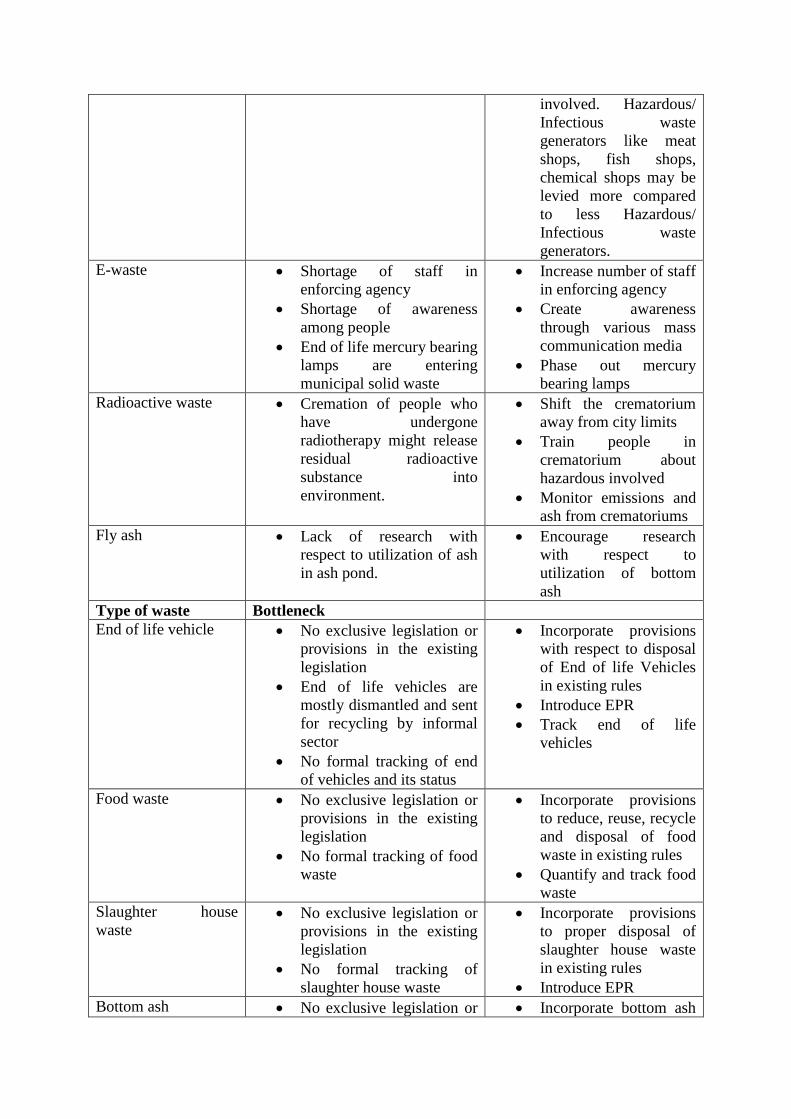
Table-10.15: Major interventions required with respect major streams of waste
Type of waste Bottleneck Recommendations
Hazardous waste Shortage of staff in
enforcing agency
Absence of Treatment,
Storage and Disposal
Facilities (TSDF) in north
Karnataka
Distance between generator
and treatment/disposal sites
Increase number of staff
in enforcing agency
Establish TSDF in north
Karnataka
Biomedical Waste
Shortage of staff in
enforcing agency
Tracking of plastic stream
from biomedical waste is
yet to be done as they are
recycled
No mechanism to cross
check quantity of waste
generated as annual
consumption of medical
consumables is not
published
Increase number of staff
in enforcing agency
Track the plastic stream
Consumption of
medical consumables
every year may be
published by concerned
department.
Plastic waste
Shortage of staff in
enforcing agency
Increase number of staff
in enforcing agency
Lead acid Battery
waste Shortage of staff in
enforcing agency
Increase number of staff
in enforcing agency
Construction and
demolition waste
Shortage of staff in
enforcing agency
Awareness among people
needs to be increased
Shortage of recycling
facility
Increase number of staff
in enforcing agency
Create awareness
through various mass
communication media
Encourage recycling
facilities under PPP
model at the outskirts of
each local bodies
Encourage
prefabricated building
Municipal Solid
waste
Shortage of staff in
enforcing agency
Awareness among
stakeholder needs to be
increased
Shortage of processing
facility
Difficulty in adopting
‘Polluter Pay’ principal
Increase number of staff
in enforcing agency
Create awareness
through various mass
communication media
Encourage recycling
facilities under PPP
model at the outskirts of
each local bodies
Collect SWM cess
proportionate to
quantity and risk
involved. Hazardous/
Infectious waste
generators like meat
shops, fish shops,
chemical shops may be
levied more compared
to less Hazardous/
Infectious waste
generators.
E-waste
Shortage of staff in
enforcing agency
Shortage of awareness
among people
End of life mercury bearing
lamps are entering
municipal solid waste
Increase number of staff
in enforcing agency
Create awareness
through various mass
communication media
Phase out mercury
bearing lamps
Radioactive waste
Cremation of people who
have undergone
radiotherapy might release
residual radioactive
substance into
environment.
Shift the crematorium
away from city limits
Train people in
crematorium about
hazardous involved
Monitor emissions and
ash from crematoriums
Fly ash Lack of research with
respect to utilization of ash
in ash pond.
Encourage research
with respect to
utilization of bottom
ash
Type of waste Bottleneck
End of life vehicle No exclusive legislation or
provisions in the existing
legislation
End of life vehicles are
mostly dismantled and sent
for recycling by informal
sector
No formal tracking of end
of vehicles and its status
Incorporate provisions
with respect to disposal
of End of life Vehicles
in existing rules
Introduce EPR
Track end of life
vehicles
Food waste No exclusive legislation or
provisions in the existing
legislation
No formal tracking of food
waste
Incorporate provisions
to reduce, reuse, recycle
and disposal of food
waste in existing rules
Quantify and track food
waste
Slaughter house
waste No exclusive legislation or
provisions in the existing
legislation
No formal tracking of
slaughter house waste
Incorporate provisions
to proper disposal of
slaughter house waste
in existing rules
Introduce EPR
Bottom ash No exclusive legislation or Incorporate bottom ash

provisions in the existing
legislation
Lack of research for
utilization of bottom ash
in existing rules
Encourage research
with respect to
utilization of bottom
ash
Disaster waste No exclusive legislation or
provisions in the existing
legislation
No estimation of waste
envisaged in each local
body at different possible
calamity
Incorporate provisions
for disaster waste in
existing rules
Estimate and publish
waste envisaged in each
local body for different
possible calamity
10.70. The state government has banned plastic carry bags to put an end to an all pervading menace.
Similar action towards banning of electronic goods is necessary if a particular brand has not
established collection centre. This will ensure better disposal of e-waste.
10.71. The extended producer responsibility (EPR) concept has been fairly successful in European
countries. But, its implementation in the Indian context is not going to be smooth. However, it is
prudent to bring out policy imposing responsibility on producers for collecting the waste from the
following items which are infectious or not readily picked by rag pickers as they do not fetch any
value.
1. Waste oil
2. Medical consumables
3. Sanitary napkin
4. Multi layered packing material
5. Crackers
10.72. Training may be imparted to all officials of local bodies by officials of Mysore City
Corporation which was awarded prestigious ‘Cleanest City’ award twice.
10.73. Considering the increase in vehicles and their impact on environment, CPCB in
November 2016 has published ‘Guidelines for Environmentally Sound Management of ‘End-
of-Life Vehicles (ELVs)’. As per the CPCB publication, production of automobiles took off in
the early 1990s, and became one of the country’s fastest growing industries. In 2010 the number of
vehicles were more than 110 million and an additional 10,37,88,457 vehicles were produced in the
period 2010 – 2015 (CPCB, 2016). In view of these developments, management of end-of-life
vehicles is going to be a very serious challenge in the country. Hence there is urgent need to tackle
this waste stream.
Reference
Airport Authority India (2017), http://www.aai.aero/allAirports/airports.jsp accessed on
04.08.2017
AvijitMistri (2015), Estimation of Internal Migration in India, 2011 Census based on Life
Table Survival Ratio (LTSR) Method, Centre fro Study of Regional Development, School of
Social Sceinces, Jawaharlal Nehru University, https://mpra.ub.uni-
muenchen.de/61577/1/MPRA_paper_61577.pdf accessed on 18 September 2017
BBMP (2015), Guidelines For The Grant Of Compensation To The Victims Of Attacks By
Stray Dog/S, 10-06-2015, http://bbmp.gov.in/documents/10180/426530/
19+PAGES+GUIDELINES-DOG+BITE-17-06-2015.pdf/27864a94-6173-428b-92e1-
7d198da9d10d accessed on 01.08.2017
CAG (2014), Report of the Comptroller and Auditor General of India on Local Bodies for the
year ended March 2013 http://www.cag.gov.in/sites/default/files/audit_report_files
/Karnataka_Report_5_2014.pdf
CAG (2016), Report of the Comptroller and Auditor General of India on Public Sector Under
Takings for the year ended March 2015
http://www.cag.gov.in/sites/default/files/audit_report_files/Karnataka_PSUs_Report_No_3_2
016.pdf
Central government welfare coordination committee (2009), List of central government
offices in Karnataka http://cgewcckarnataka.blogspot.in/2009/09/list-of-central-govt-offices-
in.html accessed on 04.08.2017
Centre for Science and Environment (CSE) (2014), Construction and Demolition Waste,
http://www.cseindia.org/userfiles/Construction-and%20-demolition-waste.pdf accessed on 15.09.2017
CII waste exchange (2017), http://www.ciiwasteexchange.org/dataoncoprocessing.php
accessed on 29.7.2017
Connecting EPAs across Europe http://epanet.pbe.eea.europa.eu/european_epas/countries/
environmental-protection-agency-denmark-member-profile accessed on 07.11.2017
CPCB (2016), Guidelines for Environmentally Sound Management of End –of-Life Vehicles
(ELVs)
CPCB (2017), ‘Status Report On Municipal Solid Waste Management’
http://www.cpcb.nic.in/divisionsofheadoffice/pcp/MSW_Report.pdf accessed on 15.09.2017
DAE (2017), http://www.dae.nic.in/writereaddata/lsus274.pdf accessed on 29.7.2017
Deccan chronicle (2017), Neutering has failed, time for a tough
call?http://www.deccanchronicle.com/nation/current-affairs/290317/neutering-has-failed-
time-for-a-tough-call.html Deccan chronicle Mar 29, 2017 accessed on November 04,
2011
Department ports and Internal Water Transport (2017), http://karnatakaports.org/ accessed on
04.08.2017
DPPMSGoK (2016), Economic survey of Karnataka 2015-16
Drugs control Depatment (2017), http://drugs.kar.nic.in/node/269.html accessed on 29.7.2017
EC (2014), Communication from the Commission to the European Parliament, the Council,
the European Economic and Social Committee and the Committee of the Regions 'Towards a
circular economy — A zero waste programme for Europe', COM(2014) 398 final of 2 July
2014
Education information (2017), List of universities in Karnataka http://www.
indiaeduinfo.co.in/state/karnataka.htm accessed on 04.08.2017
EPA (2017 ), EPA's Budget and Spending https://www.epa.gov/planandbudget/budget
accessed on 07.11.2017
Epanet (2017), European Network of the Heads of Environment Protection Agencies
EU (2010), Directive 2010/75/EU of the European Parliament and of the Council of 24
November 2010 on industrial emissions (integrated pollution prevention and control), OJ L
334, 17.12.2010, pp. 17–119.
GesellschaftfürInternationaleZusammenarbeit (GIZ) (2016), Construction and Demolition
Waste Utilisation for Recycled Products in Bengaluru: Challenges and Prospects, July 2016
GOK (2017a), Government Departments http://www.karnataka.gov.in/Pages/
Departments.aspx Government of Karnataka accessed on 04.08.2017
GOK (2017b), Boards and corporations http://www.karnataka.gov.in/Pages/
boardscorporation.aspx Government of Karnataka accessed on 04.08.2017
GSPCB (2013), http://www.goaspcb.gov.in/Media/Default/uploads/2012-13-plastic.pdf
accessed on 29.7.2017
Hindu (2009), Dog-bite cases on the rise in Bangalore, November 17, 2009
http://www.thehindu.com/todays-paper/tp-national/tp-karnataka/Dog-bite-cases-on-
the-rise-in-Bangalore/article16477054.ece accessed on November 04, 2011
KPSCB,(2016), Annual report 2015-6, KSPCB, 2016
MSME-Development Institute (2016), Karnataka State industrial profile 2015-2016
NiranjanKaggere (2017), 60,000-odd units of donated blood go down the drain every year,
reveals Karnataka govt Bangalore Mirror Bureau Jun 14, 2017
http://timesofindia.indiatimes.com /city/bengaluru/60000-odd-units-of-donated-blood-go-
down-the-drain-every-year-reveals-karnataka-govt/articleshow/59141350.cms accessed on
02.08.2017
PIB (2016), New Bio-Medical Waste Management Rules will Change The way Country Used
to Manage Waste Earlier; Make a Big Difference to Clean India Mission’: Javadekar. New
Bio-Medical Waste Management Rules Notified http://pib.nic.in/newsite/
PrintRelease.aspx?relid=138353 accessed on 01.08.2017
Ravi Sharma (2007), Beware of dogs, Frontline, Volume 24 - Issue 06 :: Mar. 24-Apr. 06,
2007 http://www.frontline.in/navigation/?type=static&page=
flonnet&rdurl=fl2406/stories/20070406002610200.htm accessed on November 04, 2011
Sarumathi K (2017),‘Rise in the stray dog population in the last two years’ The Hindu, January
31, 2017, http://www.thehindu.com/news/cities/bangalore/ ‘Rise-in-the-stray-dog-

Population-in-the-stray-dog-population-in-the-last-two-
years%e2%80%99/article17124336.ece accessed on 04.11.2017
Tax information network of income tax department (2017), List of banks https://
tin.tin.nsdl.com/tan/Bank.html accessed on 04.08.2017
Techspirit (2015), Private health care industry in Karnataka to grow to $ 30 billion by
2020http://techspirit.in/private-health-care-industry-karnataka-grow-30-billion-2020/
accessed on 02.08.2017
Time Magazine (1940), "Dachshunds Are Tenderer". November 25, 1940
http://content.time.com/time/magazine/article/0,9171,884181,00.html accessed on
01.08.2017
Van Alstine, J., and Neumayer, E. (2009), The environmental Kuznets Curve. In Kevin P.
Gallagher (ed.): Handbook on Trade and the Environment. Cheltenham: Edward Elgar 2009,
pp. 49-59.
WRAP (2012), Decoupling of waste and economic indicators, Final report, Waste &
Resources Action Programme, United Kingdom.