10. relation between pore fluid chemistry …...relation between pore fluid chemistry and gas...
TRANSCRIPT
Carson, B., Westbrook, G.K., Musgrave, R.J., and Suess, E. (Eds.), 1995Proceedings of the Ocean Drilling Program, Scientific Results, Vol. 146 (Pt. 1)
10. RELATION BETWEEN PORE FLUID CHEMISTRY AND GAS HYDRATES ASSOCIATED WITHBOTTOM-SIMULATING REFLECTORS AT THE CASCADIA MARGIN, SITES 889 AND 8921
Miriam Kastner,2 Keith A. Kvenvolden,3 Michael J. Whiticar,4 Angelo Camerlenghi,5 and Thomas D. Lorenson3
ABSTRACT
Prominent seismic bottom-simulating reflectors (BSRs) were penetrated at two sites on the Cascadia Margin, off Vancou-ver Island (Site 889, at 224 mbsf) and off Oregon (Site 892, at 74 mbsf) Although solid gas hydrate was not recovered at thedepth of either of these prominent BSRs, the -1.4°C temperature measured in a core ~8 m above the BSR depth at Site 889, andthe observed coincidence of very low pore fluid Cl and very high headspace methane concentrations at the depth of both BSRs,together with an increase in seismic velocities, strongly imply the presence of gas hydrate in situ with methane as the dominantgas within the hydrate cages. Pore-space occupancy by hydrate of a minimum of 15% and -10% at Sites 889 and 892, respec-tively, is inferred from geochemical and geophysical evidence. Assuming, however, bottom-water Cl concentration, the maxi-mum Cl dilutions observed, 36% at Site 889 and 15% at Site 892, correspond to pore-space hydrate occupancies of 39% and16%, respectively. Mixing with a diffusing, or upward-migrating, low-Cl fluid from a deeper source at Sites 889 and 892accounts for the difference between the two estimates. As gas hydrate was not recovered, it is suggested that finely dissemi-nated hydrate prevails at these sites. Thus, the high amplitudes of these BSRs are not solely related to gas hydrate content, butalso to the presence and concentration of free gas below the BSR. The persistence of the zone of maximum Cl dilution belowthe BSR depth (Site 889) probably reflects a rather recent, interglacial, upward migration of the base of the hydrate stabilityfield.
At both sites the measured in situ borehole temperatures at the depth of the seismic BSRs are lower by approximately 2°Cthan the calculated temperatures for the base of a pure H2O-pure CH4 hydrate stability field at the corresponding pressures.Addition of gases such as ethane, CO2, or H2S further increases the hydrate stability temperature at corresponding pressures.The measured temperatures, however, are within the uncertainties of the base of the stability field of a seawater-CH4 hydrate.This observation has important implications for using seismic BSRs for mapping heat flow.
Solid gas hydrate was recovered only at Site 892 between 2 and 19 mbsf, but this gas hydrate was not associated with theBSR, which occurs at a depth of 74 mbsf. This is a mixed hydrate that contains both CH4 and up to 10% H2S, with minoramounts of ethane and some CO2.
INTRODUCTION
Gas hydrates are crystalline substances of an expanded solid-wa-ter lattice with cages containing guest gaseous hydrocarbon mole-cules bonded by Van der Waals forces, which occur under conditionsof low to moderate pressures and low temperatures. Methane hydrateis the most common natural gas hydrate in the marine environment.In the modern ocean, methane-hydrate may form in sediments wherewater depths exceed 300 to 500 m to a subsurface depth of up to about1100 meters below seafloor (mbsf) (Kvenvolden and McMenamin,1980).
In addition to temperature and pressure, the stability of gas hy-drate depends on the amount and composition of the guest gas(es)and on the chemistry of the pore fluid, especially its salinity. Favor-able temperature-pressure conditions for the formation of hydrocar-bon gas hydrates exist at the seafloor at all holes drilled during Leg146 (e.g., Kvenvolden and McMenamin, 1980; Sloan, 1990; Engle-
1 Carson, B., Westbrook, G.K., Musgrave, R.J., and Suess, E. (Eds.), 1995. Proc.ODP, Sci. Results, 146 (Pt. 1): College Station, TX (Ocean Drilling Program).
2Scripps Institution of Oceanography, University of California, San Diego, La Jolla,CA 92093, U.S.A.
3U.S. Geological Survey, 345 Middlefield Road, MS-999, Menlo Park, CA 94025,U.S.A.
4 School for Earth and Ocean Sciences, University of Victoria, Victoria, BritishColumbia V8W 2Y2, Canada.
5Osservatorio Geofisico Sperimentale, Dipartimento di Geofisica della Litosfera, I-34016 Trieste Opicina, Italy.
zos and Bishnoi, 1988, and references therein). Leg 146 was only thesecond Ocean Drilling Program (ODP) leg with sites purposely locat-ed to penetrate bottom-simulating seismic reflectors (BSRs). BSRsappear on marine seismic records and result from the acoustic imped-ance contrast between gas hydrate-bearing sediment lying above sed-iment devoid of gas hydrate and/or containing free gas. During ODPLeg 141, at Site 859 in the vicinity of the Chile Triple Junction, thesediment section that included the BSR was logged for the first time.On the basis of the geochemical and geophysical evidence, Bangs etal. (1993) concluded that there is insufficient hydrate above the BSRto produce the large impedance difference at the interface betweenthe hydrate-bearing and hydrate-free sediments. The presence of avery small amount of free gas beneath the BSR provides a reasonableexplanation for the existence of the seismic reflection.
A major objective of Leg 146 was to investigate the nature ofprominent BSRs, and to determine their relationship to the presenceand amount of gas hydrate and/or free gas at the Cascadia margin. Amajor objective of this paper is to determine the relationship betweenpore fluid chemistry and gas hydrate associated with these prominentBSRs. Site 889 off Vancouver Island is dominated by diffusive fluidflow, whereas Site 892 offshore from Oregon is dominated by con-fined-fluid flow (Kastner et al., this volume; Foucher, this volume).Adjacent to Site 892, at the hydrologically active fault that was inter-sected by drilling, the BSR is displaced upward toward the seaflooras a consequence of warming from the rising fluids (Moore et al.,1990; Davis et al., this volume). The locations of these sites areshown in Figure 1.
175
M. KASTNER ET AL.
50°N
an
Cascadia Basin,
42 km/m.y., .Juan de Fuca , '
Plate /i Astoria\ Fan\
Site 891
• • i ' • . • • •
130°W 128° 126C 124C
Figure 1. Location of Cascadia Margin sites drilled during ODP Leg 146(from Westbrook, Carson, Musgrave, et al., 1994).
The prominent seismic BSR at Site 889 is located at -224 mbsf(from seismic reflector and downhole logging data). Although solidgas hydrate was not recovered at this site, its presence is inferredfrom geophysical and geochemical measurements and from sedimen-tological observations (Westbrook, Carson, Musgrave, et al., 1994).Vertical seismic profile (VSP) data at Site 889 show a rise in velocityabove the BSR (MacKay et al., 1994). Assuming a bottom-water Clconcentration, a Cl dilution of 36%, corresponding to a 39% methanehydrate occupancy, was determined for the depth just above the BSR.Also, a temperature of-1.4°C was measured in a section of a core at-217 mbsf, indicating in situ gas hydrate dissociation. However, thistemperature measurement suggests that only - 3 % of the pore spacewas filled with gas hydrate, which dissociated during the drilling andcore recovery operations. This amount of hydrate is insufficient toproduce the impedance difference observed at this BSR, as originallysuggested by Hyndman et al. (1992) and Hyndman and Davis (1992).Furthermore, the rather frequent occurrence of unusually wet,"soupy," sediment intervals predominantly in cores within the mod-ern methane hydrate stability field, relative to the section beneath theBSR, suggests that the wetness of these "soupy" intervals reflects dis-sociation of disseminated gas hydrate upon core recovery. All theseindications of gas hydrate, when combined with the observation oflower than seawater VSP velocities immediately below the BSR,suggest at least a moderate amount of gas hydrate above the BSR anda small amount of free gas below it (Westbrook, Carson, Musgrave,et al., 1994; MacKay et al., 1994).
The measured in situ temperature at the Site 889 seismic BSR islower by approximately 2°C than the calculated temperature for thebase of the pure H2O-pure CH4 hydrate stability field at the corre-sponding pressure (Katz et al., 1959; see compilation by Sloan,1990). If no uncertainties in the temperature and depth of BSR esti-mates are assumed, it is also lower, by almost 1 °C, than the calculatedtemperature for the base of the seawater-CH4 hydrate stability field(Dholabhai et al., 1991; Dickens and Quinby-Hunt, 1994).
Neither the sonic-log nor the VSP data show distinct anomalousvelocities above the prominent seismic BSR located in Hole 892C at-74 mbsf, suggesting the presence of only small amounts of gas hy-drate, if any (MacKay et al., this volume). No solid gas hydrate wasrecovered at or in the vicinity of the BSR depth. The observed maxi-mum Cl dilution of 15% at the BSR depth, which corresponds to-16% methane hydrate pore-space occupancy, is sufficient to cause
only a small part of the acoustic impedance difference observedacross the BSR interface. The VSP velocities, which indicate thepresence of free gas beneath the BSR, could be responsible for mostof the BSR amplitude (Westbrook, Carson, Musgrave, et al., 1994;MacKay et al., 1994). At this site, "soupy" sediment intervals occuronly within the methane hydrate stability field, above the BSR. De-spite the different geological setting of Site 892, the disparities be-tween the measured in situ temperature at the seismic BSR and thecalculated temperatures for the bases of the pure H2O-pure CH4 andthe seawater-CH4hydrate stability fields, are almost identical to thoseencountered at Site 889, which are -2° and ~1°C, respectively.
Although gas hydrate was not recovered in the vicinity of the BSRat Site 892, unexpectedly, gas hydrate samples were recovered inshallow cores between 2 and 19 mbsf at this site. Unlike previous gashydrate samples recovered from DSDP or ODP cores, which werepredominantly methane hydrate, the gas hydrate found at Site 892contains both methane and up to 10% H2S.
GEOLOGIC SETTING
Site 889 is located on a gently undulating 15-20 km-wide seafloormid-slope terrace of the continental margin off Vancouver Island, at1320 m water depth (Fig. 1). This region is separated from the lowerslope by a steep escarpment of about 1 km relief. Stratified upperQuaternary to lower Pleistocene hemipelagic sediments with inter-bedded turbidite slope deposits cover the underlying deformed ac-creted Pliocene clayey silts and sands. These accreted sediments arecharacterized by laterally incoherent seismic reflectors and a well-de-veloped BSR at -224 mbsf (Hyndman and Spence, 1992). Diageneticcarbonates, although not plentiful, do occur throughout the section.No important thrust faults exist in the vicinity of this drill site. Thegeo thermal gradient measured during Leg 146 was 54°C/km and waslinear with depth (Westbrook, Carson, Musgrave, et al., 1994).
Site 892 is located on the western flank of the second ridge, -16km east of the thrust front, on accreted sediments of the lower conti-nental slope off Oregon, at 670 m water depth (Fig. 1). ThesePliocene terrigenous silty-clay sediments with interlayered sand weredeposited in an abyssal plain environment. Beneath the ridge, thesub-bottom seismic reflectors have poor lateral coherence. At thissite, in addition to lesser faults, an out-of-sequence, prominent land-ward-dipping thrust fault was intersected. Its surface trace, located-0.5 km west of the site, is associated with a massive bioherm andbenthic community, indicating that the fault zone is, and has been, anactive aquifer (e.g., Kuhn et al., 1986; Moore et al., 1990; Carson etal., 1990, 1994, and references therein). Because the section is cut byseveral faults, physical properties are discontinuous with depth. Littleor no increase in consolidation occurs below the BSR depth (-74mbsf). Diagenetic carbonate nodules, cement, and layers are wide-spread throughout the section. Seismic reflection data from these sed-iments are characterized by a distinct BSR, which, west of thislocality, is deflected upward at its intersection with the active fault(Moore et al., 1990). Except for two positive temperature excursionsof 1.6° and 2.5°C at 67.5 and 87.5 mbsf, respectively, in Hole 892A,the geothermal gradient measured during Leg 146 is 51°C/km and islinear with depth (Graham, Carson, Musgrave, et al., 1994).
NATURE OF THE BSRS AT SITES 889 AND 892
Background
At three previous DSDP and ODP locations, the Blake-BahamaOuter Ridge, Peru Margin, and Nankai Trough, the depth of the BSR,although within the measurement uncertainties of the seawater-meth-ane stability field, correlates well with the inferred base of the stabil-
176

PORE FLUID CHEMISTRY
ity field of a pure H2O-pure CH4 gas hydrate (Hyndman et al., 1992).Based on the measured geothermal gradients at Sites 889 and 892,however, a significant difference exists between the depths of theseismically defined position of the BSR and the pure H2O-pure CH4
hydrate stability field. At both sites the seismic BSR occurs at a shal-lower depth, equivalent to ~2°C lower temperature, than the calculat-ed depth of the base of the pure H2O-pure CH4 stability field. At Sites889 and 892 the seismic BSRs are at -224 (14.8° C) and -74 (8.5°C)mbsf, respectively (Westbrook, Carson, Musgrave, et al., 1994;Mac Kay et al., 1994), and the calculated bases of the pure H2O-pureCH4 stability field, at the corresponding geothermal gradients of54°C/km and 51°C/km, are 260 (16.8° ± 0.2°C) and 112 (10.4° ±0.2°C) mbsf, respectively. An almost identical disparity betweenthese two depths was observed at the ChileTriple Junction, Site 859(Bangs et al., 1993).
The BSR that underlies most of the Cascadia Margin was postu-lated to be caused by the presence of considerable amounts of gas hy-drate (-50% of pore space occupancy, >5 m thick layer, Hyndman etal., 1992), but none was recovered at either site. The following ques-tions thus arise:
1. Is gas hydrate present at the Cascadia margin?2. Is the amplitude of the BSR directly related to gas hydrate con-
tent?3. If gas hydrate dissociates prior to core recovery, is the Cl con-
centration of the pore water a reliable measure for the amountof dissociated gas hydrate?
4. What is the cause of the Pressure-Temperature (P-T) devia-tion of the base of the gas hydrate stability field away from thepure H2O-pure CH4 curve at these sites and at the Chile TripleJunction, or toward this curve at the Blake-Bahama OuterRidge, offshore from Peru, and at the Nankai Trough?
In order to address these questions, the relevant geophysical,geochemical, and sedimentological observations at each of the sitesare summarized in Table 1 and discussed below.
Evidence for the Presence and Content of Gas HydrateAbove the BSR
The geophysical, geochemical, and sedimentological evidence forthe presence and content of gas hydrate associated with the BSR atSites 889 and 892 consists of:
1. Velocity-depth profiles across the BSRs.2. Temperature of a core measured upon retrieval.3. Chloride (and other components) concentration-depth profiles
across the BSRs.
4. Depth distribution of unusually wet, "soupy" sediment inter-vals.
5. Gas composition.
Velocity-depth Profiles across the BSRs
At Site 889 above the BSR, from 130 to 224 mbsf, sonic-log andVSP velocities are greater than expected by > 100 m/s from normalvelocity-porosity relations, suggesting the presence of gas hydrate ofat least 15% pore space occupancy. The increase in velocity is not as-sociated with low neutron porosity or high density and resistivity,characteristic of diagenetic induration (Serra, 1984). At Site 892,however, sonic-log or VSP velocity increases above the BSR are notvery distinct, suggesting the presence of <10% gas hydrate. At bothsites, just below the BSR, a marked drop in sonic-log and VSP veloc-ities to near that of water velocity was recorded, indicating low con-centrations of free gas. The BSR amplitude is apparently related asmuch to the amount of gas than to the amount of gas hydrate at Sites889 and 892. For a detailed discussion of the velocity structures andrelations to the BSRs at these sites, see Westbrook, Carson, Mus-grave, et al. (1994) and MacKay et al. (this volume).
These geophysical observations imply that, at Site 889, <10-20%of the pore space is filled with gas hydrate that has dissociated duringcore recovery operations (MacKay et al., this volume). On the basisof the gas chemistry (Westbrook, Carson, Musgrave, et al., 1994;Whiticar et al, this volume), it is primarily a methane hydrate, possi-bly including some CO2 and ethane. The presence of N2 and O2, how-ever, strongly suggests that air contamination is responsible for atleast some of the CO2 observed.
The bases of the low-velocity zones immediately below the BSRswere not reached in the downhole logging, but their thicknesses fromseismic data are inferred to be ~ 15 m and -50 m at Sites 889 and 892,respectively (MacKay et al., 1994). Thus vertical advection of meth-ane is an unlikely source of the high methane concentrations near andat the depth of the BSRs. Two other possible methane sources are lat-eral advection or in situ dissociation of pre-existing gas hydrate, be-neath the present BSR. The geochemical depth profiles acquired onboard the JOIDES Resolution (Westbrook, Carson, Musgrave, et al.,1994) and shore-based analyses (shown in Figures 2, 3, and 4) do notsupport lateral fluid advection at the appropriate depth interval at Site889. However, the Hole 892A data do support lateral fluid advectionat the BSR (-68 mbsf), where a 1.6°C temperature anomaly (West-brook, Carson, Musgrave, et al., 1994), may possibly be sufficient toinfluence the in situ gas hydrate stability.
Uplift of the seafloor as a result of sedimentation or tectonic ele-vation, and/or warming of the bottom water following the last glacialmaximum would prompt upward movement of the base of the stabil-ity field and in situ dissociation of gas hydrate. (A present-day uplift
Table 1. Comparison of data for Sites 889 and 892.
Site 889 off Vancouver Island Site 892 off Central Oregon
Water Depth (m)Geothermal gradient
Depth of Seismic BSR (mbsf)Maximum Cl dilution*Base of pure H2O-pure CH4
gas hydrate stability fieldCH4 distributionOccurrence of "soupy" core intervalsFree gas
132054°C/km and line.At both sites the gradient is compatible with conductive heat transfer.22436%At both sites at ~2°C higher than the temperature at the seismic BSR,or at a
corresponding greater burial depth (greater pressure).A coincidence between low Cl and high CH4 headspace at both sites.Predominantly above 280 mbsfPresent below the BSR depthAt both sites inferred from low VSP velocity.
67051 °C/km and linear
7415%
Only above the BSR depthPresent below the BSR depth
Note: * = Assuming bottom-water Cl concentration.
177
M. KASTNER ET AL.
along the Cascadia subduction zone of up to 5 mm/yr was recordedby Mitchell et al., 1994). At least 50 to 100 m of tectonic uplift andsedimentation together with a -70 m displacement caused by inter-glacial bottom-water warming, discussed in Westbrook, Carson,Musgrave, et al. (1994), indicates that an upward migration of thebase of the stability field of gas hydrate (and BSR) of >120 m mostprobably has occurred over the past 10 to 15 millennia in the Casca-dia margin. Accordingly, during the last glacial maximum, the baseof the stability field (and BSR) at Site 889 is inferred to have beenconsiderably deeper: at 300 to 350 mbsf at Site 889 instead of at -224mbsf, and at -150 to 200 mbsf at Site 892 instead of at -74 mbsf.
The most prominent geochemical consequences of the upwardmigration of the base of the gas hydrate stability field (and BSR) arethe release of the guest gas from the hydrate cages, and of H2O fromthe dissociation of the solid water clathrate. In most natural gas hy-drates, methane is the dominant gas. Its solubility in seawater is verylow (Yamamoto et al., 1976); therefore, methane supersaturationwould ensue upon methane hydrate dissociation. It would requireover I05 years to erase this geochemical perturbation, assuming re-gional upward fluid advection at a rate <l .0 mm/yr, caused by com-paction of sediments with 50% porosity (Hyndman et al., 1993;Wang et al., 1993). Accordingly, in the Cascadia subduction zone, inregions with upward fluid advection resulting only from regional tec-tonic compaction, based on the above calculated -120 m upward mi-gration of the BSR since the last glacial maximum (18,000 yr BP), a70- to 90-m-thick zone of diluted pore fluids might be anticipated un-derneath the modern BSR. The upward-migrating methane driven bythe advection and buoyancy would form new hydrate above the BSR.Some of the released methane might be retarded by "trapping" asbubbles beneath the new BSR, but probably for relatively short geo-logical periods, until the bubbles coalesce and migrate upward toform new hydrate. The formation of hydrate would cease only whenall pore space is occupied by the hydrate. Regardless of the processesfor attaining gas supersaturation, on the basis of thermodynamic con-siderations in simple two component systems, the Gibbs phase rulerequires the presence of a gas phase at the base of the stability fieldof a gas hydrate zone.
Temperature of a Core Measured upon Retrieval
Further evidence for the presence of gas hydrate at Site 889 is pro-vided by the lower-than-in situ temperature measured in Core 3R ofHole 889B at a depth of 217 mbsf immediately after recovery. Thecore temperature measured was -1.4°C. Excluding the heat exchangethat occurred during recovery, the in situ temperature is higher by14.4°C, given a geothermal gradient of 54°C/km. Cores are cooled,however, by passage through deep sea (~2°C) during recovery, ac-cordingly the minimum cooling by hydrate dissociation is from 2° to-1.4°C. On the basis of the heat required to dissociate a unit volumeof methane hydrate (Makogon, 1981; Sloan, 1990), the wet sedimentheat capacity and the density of methane hydrate (0.92 g/cm3), at 49%in situ porosity dissociation of - 3 % of pore space hydrate occupancywould yield the observed temperature drop. Similar low temperatureswere measured in cores that contained the solid CH4-H2S hydrate, at2 to 19 mbsf at Site 892.
Chloride Concentration-depth Profiles across the BSRs
Chloride has usually been assumed to behave conservatively dur-ing diagenesis and metamorphism. Recent findings, involving chlo-rine stable isotope ratios, however, indicate that Cl is directlyinvolved in hydrous silicate reactions, including clay mineral authi-genesis and transformation reactions in subduction zones (Ransom etal., 1995). Nevertheless, Cl involvement in silicate reactions impactsonly the baseline Cl concentration. Cl will be diluted or concentratedby gas hydrate dissociation or formation, respectively; therefore, Cl
concentration depth profiles are highly effective for detecting recent-ly dissociated gas hydrate. In addition to gas hydrate dissociation,other important reactions involving the release of water in subductionzones are hydrous silicate dehydration and/or transformation, mem-brane ion filtration, and mixing with meteoric water. Hydrous silicateformation is an important reaction involving the uptake of H2O, asdoes gas hydrate formation. The residual fluid from clay membranefiltration is also saline. A detailed discussion of these reactions andtheir relation to Cl concentrations is given in Kastner et al. (1991).
Because methane hydrate is primarily composed of CH4 and H2O,the only significant geochemical consequences of its dissociation are:(1) the release of a large volume of methane (at STP the volumetricratio of H2O/CH4 of a saturated methane hydrate CH4 5% H2O is 1/164 [Davidson et al., 1978; Sloan, 1990]); (2) the release of fresh wa-ter; and (3) the fresh water released contains heavier values of the ox-ygen and hydrogen isotopes than the pore fluid with which it mixes.The isotope behavior during formation of gas hydrate is closely anal-ogous to the formation of sea ice. Experimentally derived fraction-ation factors for oxygen for the ice-water system range from 1.0031to 1.0027 (O'Neil, 1968; Suzuki and Kimura, 1973, Craig and Hom,1968. However, only Craig and Hom (1968) studied the formation ofsea ice and derived the fractionation factor of 1.0027. Their value isclosest to that of Davidson et al. (1983), who determined directly the18O enrichment of gas hydrate to be 1.0026. For hydrogen, the exper-imentally derived fractionation factor for the ice-water system rangesfrom 1.0235 to 1.0195 (Merlivat andNief, 1967; O'Neil, 1968; Craigand Hom, 1968; Arnason, 1969). The only natural gas hydrate froma subduction zone analyzed for its H2O oxygen and hydrogen isotopiccompositions is a methane hydrate sample from the Peru subductionzone. Its extrapolated 618O value is 2.4%O and δD value is 21.8%o(Kvenvolden and Kastner, 1990). These values lie approximatelywithin the ranges of the above experimental values, suggesting a sim-ilar mode of formation. The remaining chemical components in thepore fluids will be simply diluted by the same proportion as Cl con-centrations; thus normalization to Cl concentration should result inno shifts. Clearly, isotopic ratios, such as Sr, should not be affectedby the dilution.
Chloride concentration-depth profiles from Sites 889 and 892, al-though strikingly different, clearly show significant Cl dilution atvarious depth intervals (Fig. 2). Both sites lie within the methane hy-drate stability field from the seafloor to the depths of their BSRs.
Site 889/890
At Site 889, the Cl diffusion profile in the uppermost 130 m is pri-marily controlled by a low-Cl fluid conduit at ~ 130 mbsf (Figs. 2 and3) (Kastner et al., this volume; Westbrook, Carson, Musgrave, et al.,1994), which is not directly related to the gas hydrate-BSR relation-ship dealt with in this paper, and thus will not be discussed further.The almost constant low Cl concentration of 362 ± 1 0 mM, mostlybetween 190 to -310 mbsf, suggests either gas hydrate dissociationupon core recovery or advection of a low-Cl fluid from >l to 3 kmdepth, at which clay mineral transformation and dehydration reac-tions occur along the 54°C/km geothermal gradient (Perry and How-er, 1972). Dilution as a result of mixing with meteoric water is notsupported by the geological setting of this site, and the very low effi-ciency of the membrane ion filtration process excludes it as an impor-tant factor in such a considerable dilution. Evidence from depthprofiles of other chemical concentrations given in Westbrook, Car-son, Musgrave, et al. (1994), normalized to Cl in Tables 2 and 3 andFigure 2, suggests dilution by gas hydrate as the most plausible originfor much of the Cl dilution between 190 to -310 mbsf. Furthermore,as discussed below and in Westbrook, Carson, Musgrave, et al.(1994), the extension of the low-Cl zone below the BSR, at 224 mbsf,suggests that it most likely represents an integrated modern and lastglacial methane hydrate zone. Porosity variations with depth between42% and 56% (Westbrook, Carson, Musgrave, et al, 1994) could
178

PORE FLUID CHEMISTRY
Cl (mM)400 500
B600 0.0
Ca/CI (10'2) Li (µM) D80 120 160 200
Li/CI (10"4)2.0 4.0 6.0
400
Sr (µM) Sr/CI (I0"4) G β7Sr/86Sr H δ1 β0(β/o ( )SM0W)
75 7 1 0 0 0.6 1.0 1.4 S7 1.8
100 -
a.
Q
200 -
300 -
400
-1.0 0.0
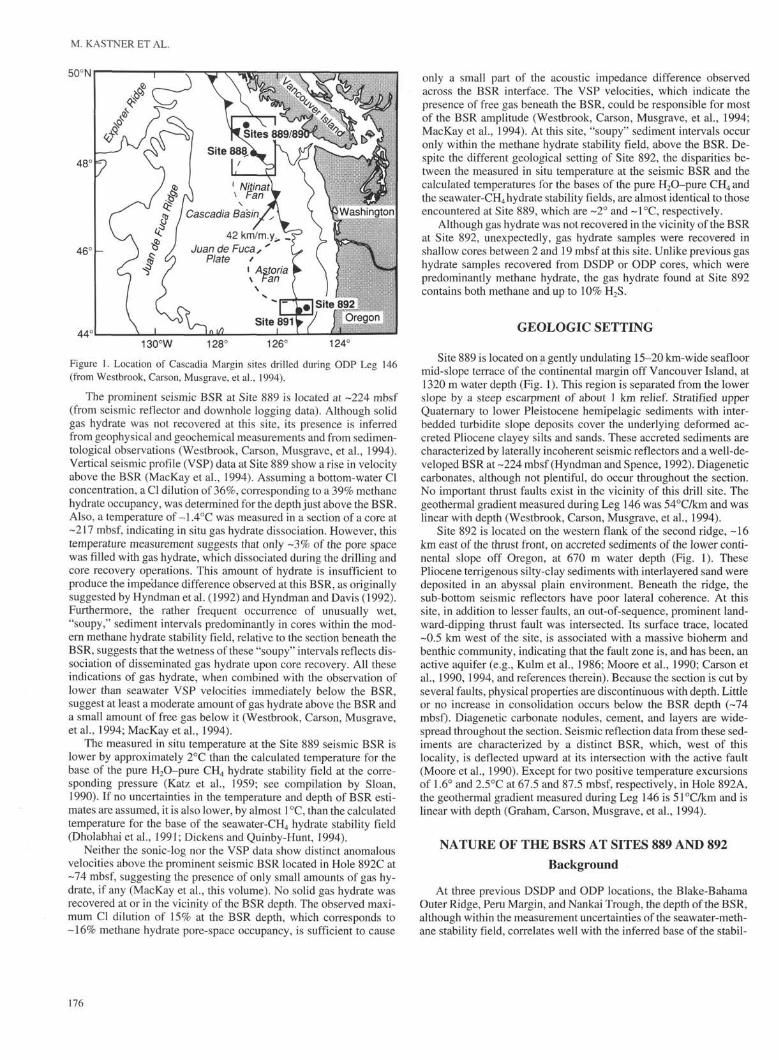
Figure 2. Depth profiles of pore fluid chemical composition (A-F) and isotopic composition (G-H) from Site 889. A. Cl concentrations. B. Ca/CI ratios. C. Liconcentrations. D. Li/CI ratios. E. Sr concentrations. F. Sr/CI ratios. G. 87Sr/86Sr ratios. H. δ 1 8 θ (%o SMOW) values. Arrow indicates seawater composition.Dotted line represents the conduit at -130 mbsf.
easily account for the observed ±10 mM in Cl concentrations withinthis depth interval.
In addition, the coincidence of low chlorinity with high concen-trations of headspace methane (Fig. 3A) supports the conclusion thatchiefly methane hydrate is present at this site. Its dissociation duringcore recovery apparently is responsible for most of the observedchemical dilutions and for much of the high methane concentrations.
The extent of Cl dilution would indicate the amount of gas hydratepresent, if the baseline chemistry were known, which is not the casefor this site. Assuming a bottom-water Cl concentration of 548 mM,(derived by extrapolating the Cl profile of Figure 2 to the seafloor),dilution to 362 mM at -50% porosity and 0.92 g/cm3 methane hydratedensity, implies that 37% of the pore space must have been occupiedby gas hydrate. As discussed earlier, the geophysical evidence sug-gests pore space occupancy of -15%. Although pore fluids with low-er-than-seawater Cl concentrations are ubiquitous in accretionaryprisms, -35% seawater dilution was previously observed only once,in the Middle America Trench, during DSDP Leg 84 (Hesse et al.,1985). There a large mass of gas hydrate was recovered, and only afraction of it dissociated during core recovery operations.
Adopting a pore space methane hydrate occupancy of a minimumof 15% and assuming initial pore fluid Cl concentration equal to thebottom-water concentration of 548 mM, the dissociation of all the hy-
drate would have lowered the Cl concentration to 466 mM; instead,the observed value is 362 ± 10 mM (Table 2), that is, 104 mM toolow. On the other hand, if the in situ pore fluid Cl concentration is 420mM, fresher than bottom water by 126 mM Cl, the dissociation ofmethane hydrate, which occupies 15% of the pore space, at 50% po-rosity would lower the pore-fluid Cl concentration to the observed362 mM. An in situ Cl baseline of 420 mM suggests that other pro-cesses have previously diluted it. Diffusional communication withthe overlying low-Cl fluid aquifer at 130 mbsf is a plausible process.At 50% porosity and a formation factor of -8 (Westbrook, Carson,Musgrave, et al., 1994) the calculated sediment diffusion coefficient(Ds) is 2.5 × I0"6 cm2s~'. Accordingly, diffusional communicationfrom ~ 130 mbsf to the depth of the BSR would require 700 millennia,and almost 2 m.y., to reach -310 mbsf. This time is longer than theaccretion time available at this margin of -1 m.y. (Westbrook, Car-son, Musgrave, et al., 1994). At Ds = 2.5 × I0"6 cm2 s~1 the diffusionpath length over 1 m.y. is -120 m, from 130 mbsf to a maximumdepth of 250 mbsf. Therefore, an additional low-Cl fluid source mustexist at greater depth.
If pore space occupancy by methane hydrate is approximately15%, then supersaturation with respect to methane solubility will oc-cur upon hydrate dissociation. The oxygen isotopic composition ofthe pore fluid would, however, be influenced by a maximum of 0.4%c
179

M. KASTNER ET AL.
A Methane (ppmv)A λ 0 30,000 60,000 90,000
Lith.Ethane (ppmv) Propane (ppmv) ^ / C g u n j t s
0 100 200 0 2 4 6 101 102 103 104 105
100 -
200 -
300 -
400
Methane (ppmv)0 50,000 100,000
Ethane (ppmv)
200 400
Carbon dioxide (ppmv)0 6000 0 2000 4000
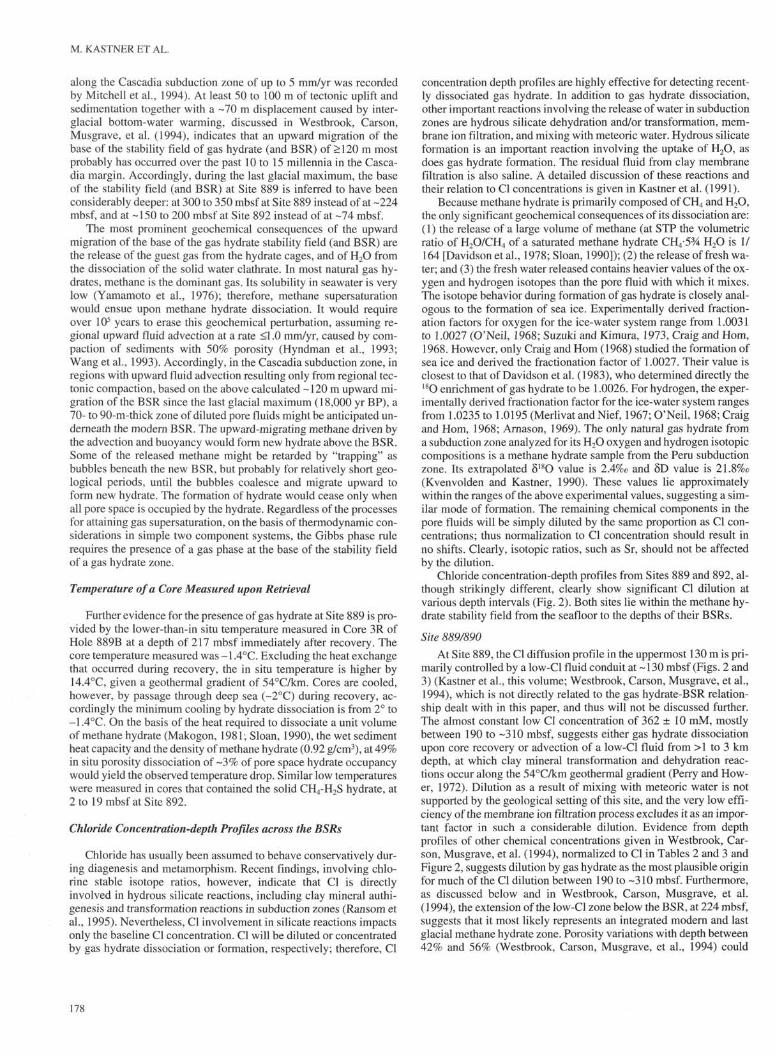
Figure 3. Depth profiles from (A) Site
Carson, Musgrave, et al., 1994).
and (B) Site 892, showing concentrations of methane, ethane, propane or CO2, and Cj/C2 ratios (from Westbrook,
at 50% porosity. Such a small change in isotopic composition couldbe difficult to recognize in pore fluids altered isotopically by diagen-esis.
The above calculations suggest that a minimum of one-third of theCl dilution observed between 190 to -310 mbsf has been generatedby dissociation of the Holocene and older gas hydrates. This conclu-sion is supported by the chemical and isotopic composition depthprofiles, shown in Figures 2 and 3, in Tables 2 and 3, and in West-brook, Carson, Musgrave, et al. (1994). Most of the remaining ob-served dilution above the BSR has originated from diffusionalcommunication with the low-Cl aquifer at -130 mbsf (whose originmost likely is also related to gas hydrate dissociation at its source re-gion), and below 310 mbsf, from communication with a deeper-source low-Cl fluid. The geochemical, isotopic (O, Sr) and hydrocar-bons depth profiles (Figs. 2, and 3) indicate that fluids have migratedby dispersive (non-channelized) flow from a depth where thermogen-ic hydrocarbons are being generated. Given a geothermal gradient of54°C/km, such a depth occurs at >1.5 to <4 km. In order to remainconsistent with a linear geothermal gradient, the flow rate must be<l-2 mm/yr. The aquifer at ~ 130 mbsf acts as a barrier to this disper-
sive flow; no allochthonous thermogenic hydrocarbons exist above it(Whiticar et al., this volume., and Fig. 3). Even though the Sr isotopevalues throughout the section are less radiogenic than those of mod-ern seawater or of the contemporaneous marine sediments (Table 3and Fig. 2), the source of the Sr above the aquifer is the nonradiogen-ic aquifer fluid, not the deeper-source fluid.
The fluid from the deeper-source is geochemically different, ischaracterized by low Cl and Mg concentrations, elevated Ca and sil-ica concentrations, higher (Ca/Cl), Li (Li/Cl), Sr (Sr/Cl), ratios, high-er, light (negative) oxygen isotopes, and nonradiogenic Sr isotopes.The Sr-isotope values of the pore fluids, which are solely representa-tive of sources and sinks, and the depth distribution of the thermogen-ic hydrocarbons ethane and propane beneath the 130 mbsf aquifer,clearly divide this low-Cl section into three domains (Figs. 2-4):from 130 mbsf to the BSR depth the Sr isotope ratios remain basicallyconstant, and the ethane and propane concentrations are very low,probably too low for structure II hydrate to form. Because the sourceof the elevated N2 concentrations observed at and near the depth ofthe BSR (Westbrook, Carson, Musgrave, et al., 1994) is uncertain,whether a component of the in situ gases or from air contamination,
180
PORE FLUID CHEMISTRY
Table 2. Chemical composition of pore fluid samples from Site 889.
Core, section,interval (cm)
146-889A-1H-2, 1-61H-4, 145-1502H-5, 145-1503H-5, 1-64H-5, 143-1505H-3, 143-1506H-5, 145-1507H-2, 143-1508H-3, 140-1509H-6, 137-15010H-4, 140-150HH-1, 140-15011H-2, 130-15012H-4, 140-15013H-CC, 0-514H-1, 153-15815P-1.6-1317X-2, 70-8018X-4, 36^622X-7, 0-2024X-5, 120-14025X-2, 0-2026X-4, 130-15028X-4, 80-10030X-4, 130-15031X-5, 140-16032X-1, 130-15036X-1, 99-11440X-4, 45-6541X-3, 130-15043X-2, 0-544X-1.0-15
146-889B-3R-1,79-944R-2,45-605R-1, 26-366R-1, 54-697R-1, 103-1268R-2, 130-1509R-1, 130-15010R-2, 0-2012R-1, 130-15013R-2, 35-5514R-1, 111-13615R-1, 125-15017R-l,0-1518R-l,0-1020R-CC, 0-3
Depth(mbsf)
21.626.035.545.056.062.575.080.091.0
103.4109.9115.0116.4125.0128.0128.5129.1132.4144.5179.8195.1198.8212.7222.6233.7244.0248.0267.7306.6316.4329.9337.3
216.5227.3235.1244.9255.0265.6274.3282.0299.6309.1317.0326.0342.2351.1377.6
Cl(mM)
52852!499488462456442432424412405401
398391378363379388378366364370372358352360364365362367376
368380370365362372370371364365375368379369366
Ca/Cl(I0"2)
0.660.570.610.590.440.270.500.610.730.880.950.99
0.991.041.071.210.960.871.061.191.071.131.111.131.071.141.171.201.391.561.49
0.981.171.201.171.161.151.121.291.211.301.351.501.561.411.74
Li(µM)
19.822.722.722.722.722.726.631.531.531.535.840.240.241.044.650.0
49.049.057.962.466.566.566.570.078.871.7
107.9108.4
79.984.084.790.684.099.2
110.3105.9
127.8
106.0195.2
Li/Cl
(1CH)
0.380.440.450.470.490.500.600.730.740.760.881.00
1.031.141.32
1.261.301.581.711.801.791.861.992.191.972.962.99
2.102.272.322.502.262.68
3.032.90
3.47
2.875.33
Sr(µM)
74.771.866.559.852.052.054.456.756.754.452.052.038.452.052.050.138.1
50.446.361.552.759.256.749.753.256.158.760.560.862.6
63.352.558.759.854.5
56.659.1
66.862.770.960.777.6
Sr/Cl
(10^)
1.411.381.331.231.131.141.231.311.341.321.281.30
1.311.331.331.05
1.301.221.681.451.601.521.391.511.561.611.661.681.71
1.671.421.611.651.47
1.531.62
1.781.701.871.642.12
its potential role in controlling the hydrate structure type is not con-sidered here. Between the BSR and -310 mbsf, 87Sr/86Sr ratios de-crease slowly with depth and become less radiogenic, whereas ethaneconcentrations increase. Below -310 mbsf, 87Sr/86Sr ratios decreasemore sharply, and ethane and propane concentrations rapidly in-crease with depth (Kastner et al., this volume; Whiticar et al., this vol-ume). This division implies that the deeper-source fluid carryingthermogenic hydrocarbons has little influence on the pore fluidsabove the BSR or on the gas hydrate composition. Between the BSRand -310 mbsf, the influence of the deep-source fluid increases, andbelow -310 mbsf pore fluid is strongly influenced by fluid which hasmigrated from >1.5 km depth. On the basis of the geothermal gradi-ent, the light oxygen isotopic composition of this fluid suggests thatits origin is from ~2 but <3 km depth (Lawrence et al., 1975), ade-quate for thermogenic hydrocarbon generation. Heavier oxygen iso-topes would characterize a fluid originating from >3 km depth. Theabove subdivision of the section into three geochemical domains,with only the shallowest one related to modern gas hydrate, is furthersupported by most inorganic and organic chemical data, providedthat, since the last glacial maximum, the base of the stability field(and BSR) has migrated upward by > 120 m.
Site 892
At Site 892 the distinctly non-steady-state Cl concentration pro-file, characterized by closely spaced concentration reversals particu-larly above the BSR, is superimposed on an overall decrease of Clconcentrations with depth. Although in Hole 892C the BSR was de-
termined to be at 74 mbsf (Mackay et al., 1994), on the basis ofgeochemical evidence from Figures 3B and 5 and Table 4, it must beat -68 mbsf in Hole 892A. This offset is not surprising for a stronglyfaulted section; other offsets between the various holes drilled at thissite exist (Westbrook, Carson, Musgrave, et al., 1994). The strongestCl dilution and highest methane concentrations observed in the up-permost -20 mbsf are related to the dissociation of an H2S-rich meth-ane hydrate partially recovered at this site (Kastner et al., unpubl.data). It is, however, important to note the clear influence a dissoci-ating, dominantly methane hydrate has on the pore fluid geochemis-try: Cl concentrations, as well as all other components analyzed, aresignificantly lower than the corresponding seawater concentrationsbecause of dilution by H2O released, methane concentrations are ex-tremely high, and the δ 1 8 θ values are less negative (Figs. 3B and 5,Tables 4-6).
Above the BSR, between -20 to 68 mbsf, three narrow (1-2-m-wide) low-Cl intervals, at -30, -56, and 68 mbsf, are seen in Fig. 5.The extent of dilution increases with depth, from 9% at 30 mbsf, to11% at -56 mbsf, and to approximately 15% seawater dilution at 68mbsf, the depth of the BSR. Below the BSR, the Cl and othergeochemical depth profiles are considerably smoother, although lesspronounced Cl minima occur at -88, -106, and 136 mbsf. Were anyof these 3 deeper Cl-minima generated by paleo-gas-hydrate dissoci-ation, or do they manifest advective flow? The limited vertical extentof the Cl-minima intervals, a maximum of 2 m, precludes the possi-bility of having paleo-gas-hydrate intervals below the BSR. With adiffusion coefficient of 3 × I0"6cm2 s~1, derived based on 55% poros-
181
M. KASTNER ET AL.
Table 3. Isotopic composition of pore fluid samples from Leg 146, Site
889.
Core, section,interval (cm)
146-889A-3H-5, 1-64H-5, 143-1505H-3, 143-1506H-5, 145-1508H-3, 140-15011H-1, 140-15012H-4, 140-15013H-CC, 0-515P-1,6-1317X-2, 70-8018X-4, 36-4624X-5, 120-14026X-4, 130-15028X-4, 80-100
146-889B-4R-2, 45-60
146-889A-30X-4, 130-15032X-1, 130-150
146-889B-8R-2, 130-150
146-889A-36X-1,99-114
146-889B-9R-1, 130-150
146-889A-40X-4,45-6543X-2, 0-5
146-889B-18R-1, 0-1020R-CC, 0-3
Depth(mbsf)
45.056.062.575.091.0
115.0125.0128.0129.1132.4144.5195.1212.7222.6
227.3
233.7248.0
265.6
267.7
274.3
306.6329.9
351.1377.6
Sr(µM)
59.852.052.054.456.752.052.052.038.1
50.461.559.256.7
63.3
49.756.1
54.5
58.7
60.562.6
60.777.6
87Sr/86Sr
0.7089770.7088990.708826
0.7086370.7085210.708544
0.7086220.7085140.7084970.708507
0.708492
0.708554
0.7084380.708402
0.708477
0.708449
0.7082370.708224
0.7082130.707766
2σ
191618
201818
17151716
16
18
1816
19
15
1816
1819
δ l 8 θ(‰ SMOW)
-0.63-0.77-1.07-1.19-1.37
-1.49
-1.44-1.32-1.44-1.30
-1.38
-1.42
-1.43-1.40
-1.53-1.38
ity and a formation factor of 6 (Westbrook, Carson, Musgrave, et al.,1994), with no advection a 2-m-wide low-Cl interval would disap-pear in 50 to 60 yr. On the other hand, the depths of the lower threedistinct Cl-minima are fault zones, which serve as active fluid con-duits, as discussed in Westbrook, Carson, Musgrave, et al. (1994). At-88 mbsf a 2.5°C temperature anomaly occurs, and strong ther-mogenic hydrocarbon peaks occur at the other two intervals (Fig.3B).
Above the BSR, from -20 to 68 mbsf, other depth profiles of ma-jor ions (Na, K, Ca, and Mg) exhibit concentration minima at thesame three depths as the Cl minima (Westbrook, Carson, Musgrave,et al., 1994). At the 30 and 56 mbsf intervals, the smooth normalized-to-Cl depth profiles (Fig. 5), indicate that these other components ex-hibit dilutions equivalent to those reflected by Cl. In addition, in theadjacent Hole 892D at 28 mbsf, a core temperature of 0.9°C was mea-sured, which, at a geothermal gradient of 5 l°C/km and 4.7°C bottomwater temperature, is 5.2°C lower than the in situ temperature, and3.6°C lower than the bottom water temperature, suggesting that 3%to 4% of the pore space was filled with gas hydrate that dissociated.These low-Cl intervals are associated with "soupy" layers; no discon-tinuities in physical properties nor faults have been identified at the30 and 56 mbsf Cl minima. Therefore, chemical anomalies of at leastthe two uppermost Cl-minimum intervals must have been generatedfrom small local concentrations of gas hydrate that dissociated uponcore recovery. The chemical baseline is unknown and cannot be ex-trapolated to the seafloor because of the pore-fluid anomalies in theuppermost -20 mbsf resulting from the partial dissociation of theH2S-rich methane hydrate. Hence, the volume of pore-space occu-pied by the gas hydrate could not be calculated. An estimate of <l 0%hydrate volume is made on the basis of seawater dilution calcula-tions. Specific lithologic horizons probably favor the formation ofgas hydrate. More such hydrate intervals may exist, based on the fre-
0.7092
0.7086
tos 0.7080
0.7074
0.70680.001
45-130 m
306-378 m
Site 889
0.010 0.019 0.0Z8
0.7092
0.7086
CΛ
to
).7080
0.7074
0.7068
20-165 m
Site 892
0.001 0.010 0.019I/Sr
0.028
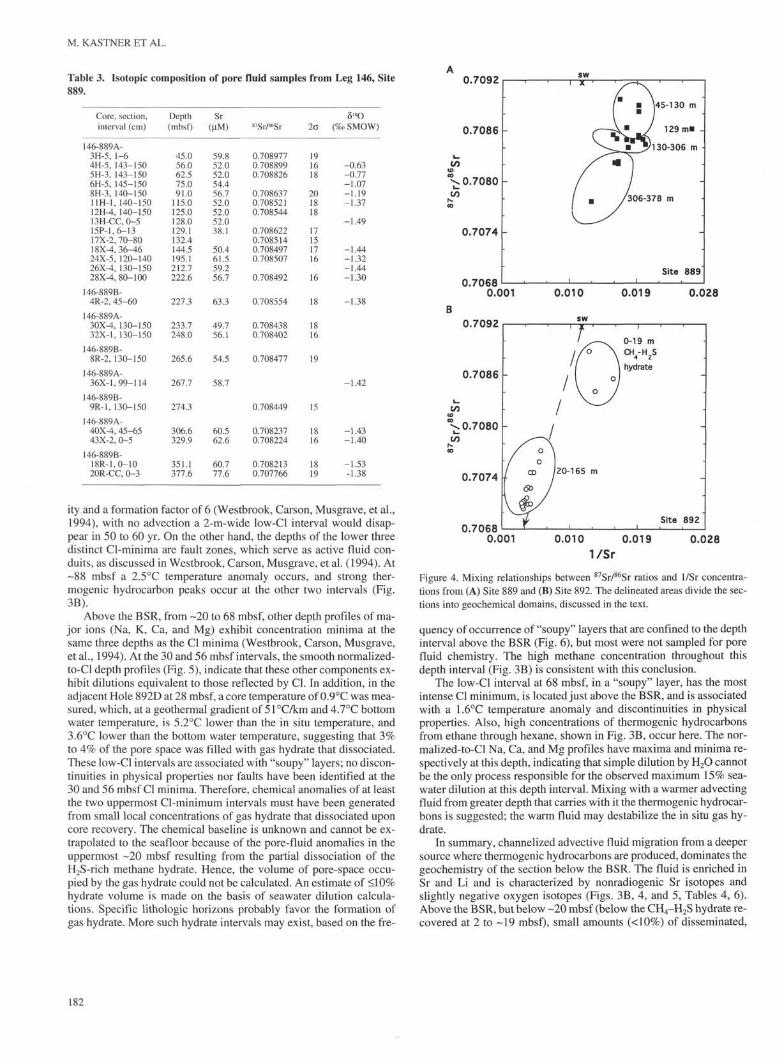
Figure 4. Mixing relationships between 87Sr/86Sr ratios and I/Sr concentra-tions from (A) Site 889 and (B) Site 892. The delineated areas divide the sec-tions into geochemical domains, discussed in the text.
quency of occurrence of "soupy" layers that are confined to the depthinterval above the BSR (Fig. 6), but most were not sampled for porefluid chemistry. The high methane concentration throughout thisdepth interval (Fig. 3B) is consistent with this conclusion.
The low-Cl interval at 68 mbsf, in a "soupy" layer, has the mostintense Cl minimum, is located just above the BSR, and is associatedwith a 1.6°C temperature anomaly and discontinuities in physicalproperties. Also, high concentrations of thermogenic hydrocarbonsfrom ethane through hexane, shown in Fig. 3B, occur here. The nor-malized-to-Cl Na, Ca, and Mg profiles have maxima and minima re-spectively at this depth, indicating that simple dilution by H2O cannotbe the only process responsible for the observed maximum 15% sea-water dilution at this depth interval. Mixing with a warmer advectingfluid from greater depth that carries with it the thermogenic hydrocar-bons is suggested; the warm fluid may destabilize the in situ gas hy-drate.
In summary, channelized advective fluid migration from a deepersource where thermogenic hydrocarbons are produced, dominates thegeochemistry of the section below the BSR. The fluid is enriched inSr and Li and is characterized by nonradiogenic Sr isotopes andslightly negative oxygen isotopes (Figs. 3B, 4, and 5, Tables 4, 6).Above the BSR, but below -20 mbsf (below the CH4-H2S hydrate re-covered at 2 to -19 mbsf), small amounts (<10%) of disseminated,
182
PORE FLUID CHEMISTRY
Table 4. Chemical composition of pore fluid samples from Site 892.
Core, section,interval (cm)
146-892A-1X-5, 10-132X-3, 0-113X-2, 0-103X-3, 0-104X-2, 0-106X-2, 0-106X-2, 10-307X-5, 140-1508X-3, 0-109X-1, 69-7411X-2,O-1O11X-2, 70-9512X-1, 0-713X-4, 0-2513X-6, 69-8214X-1, 35-3815X-1, 88-10016X-1, 34-4317X-2, 3-1318X-1, 115-14018X-1, 140-15020X-2, 0-1020X-3,0-10
146-892D-1X-1,9-122X-1, 145-1502X-2, 140-1503X-1, 40-454X-2,4-ll4X-2, 21-304X-3, 80-885X-2, 140-1506X-4, 140-1507X-3, 142-1508X-3, 0-109X-4, 0-1510X-4, 0-1511X-1, 130-15012X-3, 130-15013X-CC, 22-2414X-1, 115-13015X-2, 110-13515X-2, 135-15016X-3, 135-15016X-5, 135-150
Depth(mbsf)
6.112.620.622.130.140.640.755.961.068.279.680.387.5
101.6105.3106.9116.9125.8136.6145.8146.0165.1166.5
0.110.011.418.429.029.230.839.952.458.264.773.8
104.5110.9123.4128.5139.2148.6148.9161.4164.4
Cl(mM)
483468557552523544545507534480517516489504501491497
481487487489496
547539447433575505570560550551541500496505488484490
492484485
Ca/Cl(io-2)
0.700.901.000.801.001.001.101.201.201.301.301.401.501.401.401.601.401.401.401.401.401.401.40
1.800.600.700.80
1.00
1.001.100.700.800.90
0.900.90
0.801.000.800.700.80
Li(µM)
28.428.766.771.684.3
110.3116.4143.4155.8
176.3186.8
188.4161.6215.3168.5168.3156.3167.9161.0156.9154.0
33.331.227.8
82.061.084.1
104.3126.7147.2154.7163.0175.2170.7165.2
156.8160.5147.7141.0136.4
Li/Cl(10-)
0.590.611.201.301.612.032.142.832.92
3.413.62
3.743.234.383.393.413.253.453.313.213.11
0.610.580.620.671.431.211.481.862.302.672.863.263.533.383.39
3.203.283.002.912.81
Sr(µM)
70.775.4
164.3159.6169.0192.4199.4208.7229.8232.7267.2262.5245.0259.4213.2234.8223.7260.2207.5264.9260.2278.9261.4
87.180.163.754.2
161.7131.3180.7197.0211.1234.5239.1250.8273.7277.0260.2272.9267.2246.2267.2267.2267.2
Sr/Cl(I0"4)
1.461.612.952.893.233.543.664.124.304.855.175.095.025.154.264.784.505.284.315.445.345.705.27
1.591.491.431.252.812.603.173.523.844.264.425.025.525.495.335.645.455.035.435.525.51
mainly methane hydrate are concentrated along specific sediment ho-rizons. The warm fluid flowing along the BSR depth horizon at -68mbsf may destabilize the in situ gas hydrate, cause the release of itscaged gases, and thus supersaturate the associated pore fluid withmethane. It seems that geophysical data are not sensitive enough todetect the presence of <10% of disseminated hydrate.
Depth Distribution of Unusually Wet, "Soupy" Sediment Intervals
Numerous unusually wet, "soupy" sediment intervals, some ofwhich are sandy, are sandwiched between undisturbed "normal" sed-iment sections. The layers often consist of a fluidized, homogeneousmixture of sediment and water with dispersed fragments of firm sed-iment. A slight increase in the mean size of the bulk sediment hasbeen noted across some intervals at Site 892. The thickness of thesoupy layers is usually less than 1 m (lower than 0.6 m at Site 892)and interspacing varies from 1 to 6 m. At Site 889 "soupy" layers oc-cur above the BSR and a few also occur in the inferred paleo-hydratezone below the BSR. At Site 892, all of the "soupy" intervals occurabove the BSR, none below (Fig. 6). The pore fluids of several pairsof "soupy" and adjacent "normal" sediment intervals were analyzed,especially for Cl and sulfate concentrations. Dissolved sulfate is oneof the most sensitive indicators of drilling contamination (by surfaceseawater) in reduced sediment sections, and Cl concentrations areused for determining the extent of pore water dilution. Surface sea-water (the drilling water) was analyzed at both sites, providing nec-
essary information for baseline corrections, because "soupy"intervals are more prone to drilling contamination than are normal,undisturbed sediment intervals. The results clearly indicated excessCl dilution of the pore fluids of the "soupy" layers, as discussed inWestbrook, Carson, Musgrave, et al. (1994). The only available insitu dilutant appears to be gas hydrate; because of hydrate dissocia-tion upon core recovery these sediment intervals apparently becomeliquefied.
Gas Composition
On the basis of the gas chemistry the gas hydrate associated withthe BSRs is primarily a methane hydrate, possibly including someCO2 and ethane as suggested in Fig. 3. The gas chemistry is discussedin detail in Whiticar et al., this volume.
Which Gas Hydrate Stability Field Do the CascadiaMargin BSRs Represent?
Pressure and temperature (P-T) conditions of the pure H2O-pureCH4 hydrate system have been investigated extensively from a largerange of natural environments including permafrost to subductionzone accretionary complexes (Platteeuw and Van der Waals, 1958;Van der Waals and Platteeuw, 1959; Katz et al., 1959; Miller, 1974;Sloan, 1990, and references therein). The effects of mixing with othergases and of electrolyte solutions on the P-T conditions have been in-vestigated over a narrower range of natural environments (e.g., En-glezos and Bishnoi, 1988; Sloan, 1990; Dholabhai et al., 1991;Dickens and Quinby-Hunt, 1994, and references therein). Therefore,these conditions need to be extrapolated to the typical P-T conditionsprevailing in subduction zones. As shown in Figure 7, at least at pres-sures of < 100 MPa, the addition of CO2 increases the maximum tem-perature of hydrate formation, whereas the addition of NaCldepresses it. On the basis of thermodynamic considerations Englezosand Bishnoi (1988) predicted that by adding simple salts to water thesequence of intensity of depression of the methane hydrate formationtemperature is CaCl2 > KC1 > NaCl. Experiments have shown similarsalt effects (Katz et al, 1959; Menton et al., 1981; Sloan, 1990;Dholabhai et al., 1991). Recently, Dickens and Quinby-Hunt (1994)conducted experiments on methane hydrate stability in seawater be-tween 2.75 to 10 MPa pressure. They showed that throughout thispressure range the stability field is depressed approximately by a con-stant 1.1 °C relative to the pure H2O-pure CH4 stability field. No ex-perimental data at >lO-MPa pressures exist for the seawater-methanehydrate stability field. The experimental data obtained by Dholabhaiet al. (1991) in an artificial electrolyte solution resembling seawaterare in agreement with the results obtained by Dickens and Quinby-Hunt (1994) for the seawater-methane hydrate stability field.
On the basis of the above experiments and theoretical consider-ations, it would be predicted that in the oceanic environment the sta-bility field of the predominantly methane hydrate (Kvenvolden andMcMenamin, 1980; Kvenvolden, 1988) should correspond with theexperimental seawater-methane stability field. Good field calibra-tions of the temperature of the BSR are, however, difficult to obtain.On the basis of the limited available temperature data from the Blake-Bahama Outer Ridge and Peru and Nankai Trough accretionary com-plexes, Hyndman et al. (1992) concluded that the estimated P-T ofthe BSR at these sites best fit the base of the pure H2O-pure CH4 hy-drate stability field. The measurement uncertainties, however, en-compass the seawater stability field. If the difference between theseawater-methane system and the pure H2O-pure CH4 system indeedremains constant at ~ 1.1 °C to 60 to 70 MPa, equivalent to 5 to 6 kmwater depth, the cases of correspondence with the pure H2O-pureCH4 base of the stability field (Fig. 7) may be simply a consequenceof the uncertainties in acquired or extrapolated P-T data, or result
183
M. KASTNER ET AL.
A. Cl (mM)
400 5000
"2B. Ca/CI (10"') c. Li GiM) D Li/CI ( I0' 4 )600 0.5 1.0 1.5 ‰ O 0 ' ^ 5 0 100 150 200 0.0'j? 2.0 4.0
200
Sr (µM) Sr/CI (I0"4) G.0.7070
'Sr/86Sr0.7080 0.7090
δlβ0(β/ooSM0W)
-0.5 0.0
1I
1
1 1
*-• •w
J5H
-
200
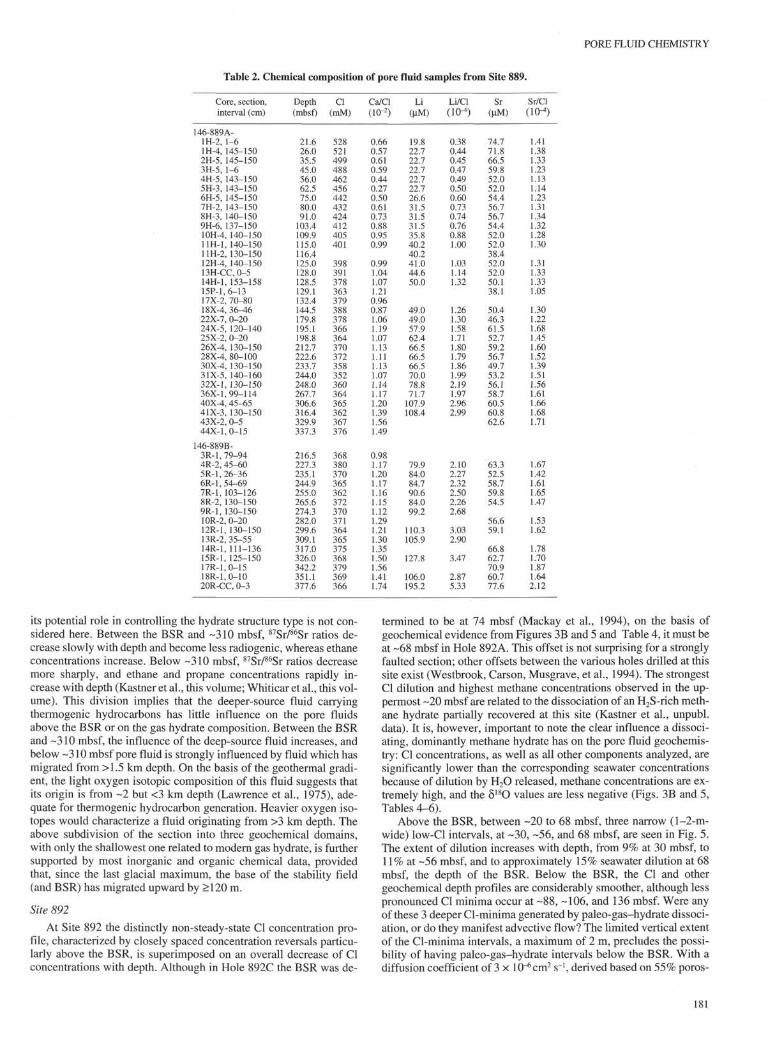
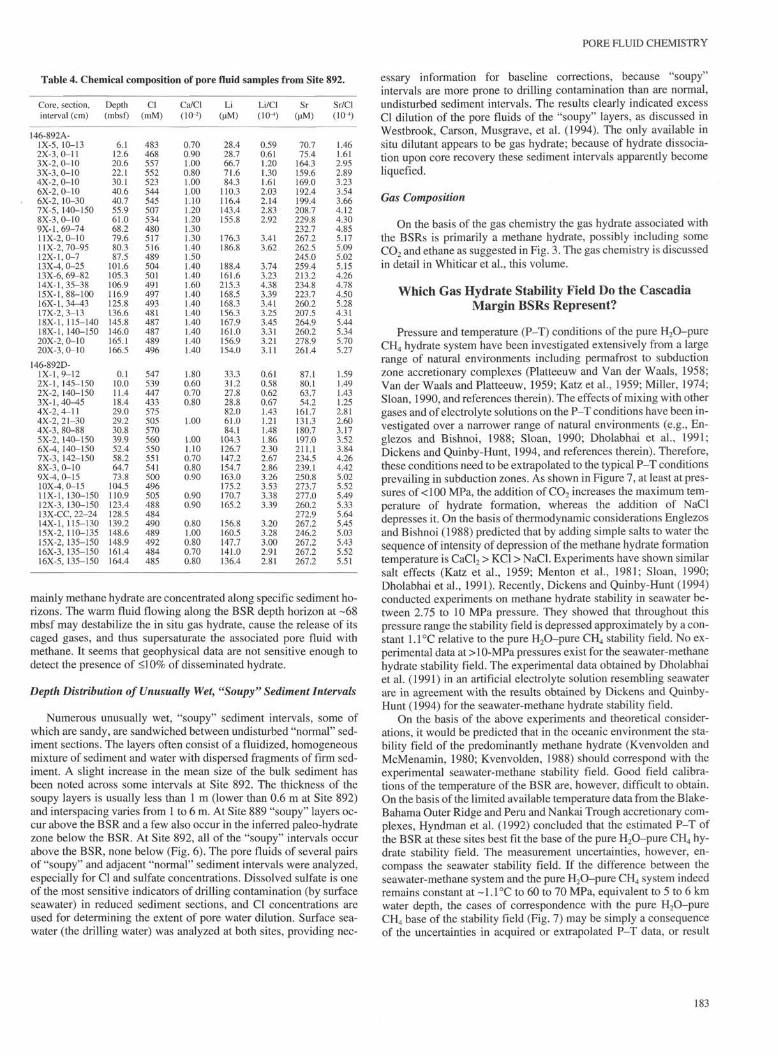
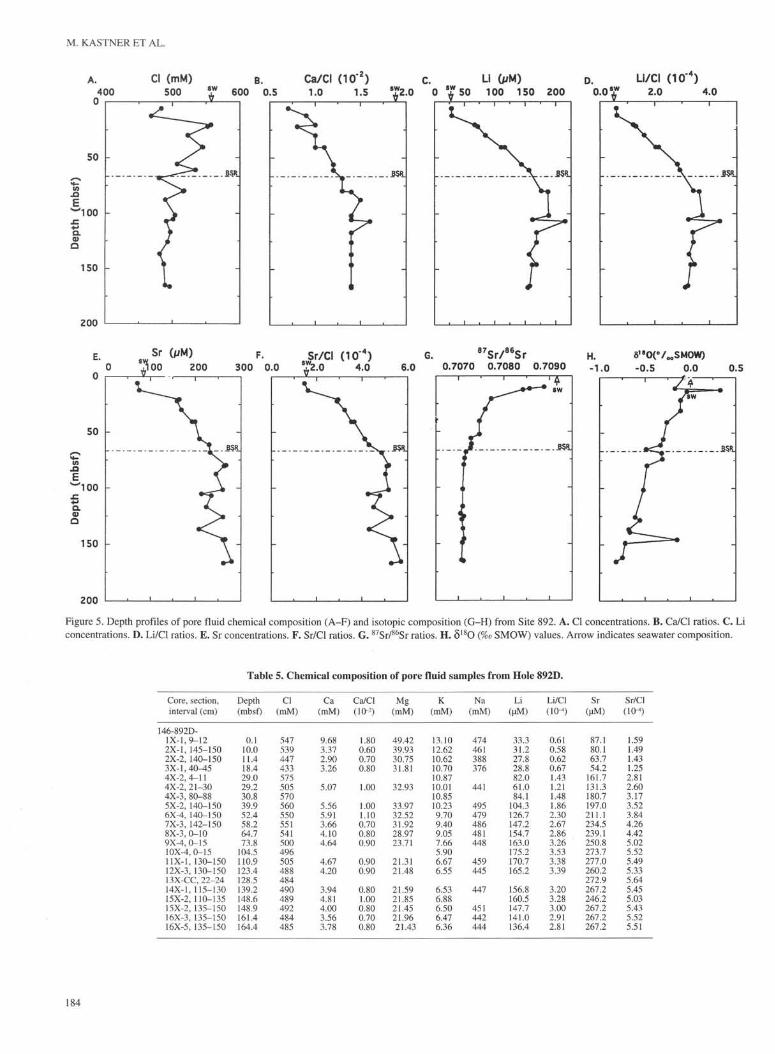
Figure 5. Depth profiles of pore fluid chemical composition (A-F) and isotopic composition (G-H) from Site 892. A. Cl concentrations. B. Ca/CI ratios. C. Li
concentrations. D. Li/CI ratios. E. Sr concentrations. F. Sr/CI ratios. G. 87Sr/86Sr ratios. H. δ 1 8 θ (%o SMOW) values. Arrow indicates seawater composition.
Table 5. Chemical composition of pore fluid samples from Hole 892D.
Core, section,interval (cm)
146-892D-1X-1,9-122X-1, 145-1502X-2, 140-1503X-1,40-454X-2, 4-114X-2, 21-304X-3, 80-885X-2, 140-1506X-4, 140-1507X-3, 142-1508X-3, 0-109X-4, 0-1510X-4, 0-1511X-1, 130-15012X-3, 130-15013X-CC, 22-2414X-1, 115-13015X-2, 110-13515X-2, 135-15016X-3, 135-15016X-5, 135-150
Depth(mbsf)
0.110.011.418.429.029.250.8
39.952.458.264.773.8
104.5110.9123.4128.5139.2148.6148.9161.4164.4
Cl(mM)
547539447433575505570560550551541500496505488484490489492484485
Ca(mM)
9.683.372.903.26
5.07
5.565.913.664.104.64
4.674.20
3.944.814.003.563.78
Ca/CI(1O2)
1.800.600.700.80
1.00
1.001.100.700.800.90
0.900.90
0.801.000.800.700.80
Mg(mM)
49.4239.9330.7531.81
32.93
33.9732.5231.9228.9723.71
21.3121.48
21.5921.8521.4521.9621.43
K(mM)
13.1012.6210.6210.7010.8710.0110.8510.239.709.409.057.665.906.676.55
6.536.886.506.476.36
Na(mM)
474461388376
441
495479486481448
459445
447
451442444
Li(µM)
33.331.227.8
82.061.084.1
104.3126.7147.2154.7163.0175.2170.7165.2
156.8160.5147.7141.0136.4
Li/CIdo-4)
0.610.580.620.671.431.211.481.862.302.672.863.263.533.383.39
3.203.283.002.912.81
Sr(µM)
87.180.163.754.2
161.7131.3180.7197.0211.1234.5239.1250.8273.7277.0260.2272.9267.2246.2267.2267.2267.2
Sr/CI(1(H)
1.591.491.431.252.812.603.173.523.844.264.425.025.525.495.335.645.455.035.435.525.51
184
PORE FLUID CHEMISTRY
Table 6. Isotopic composition of pore fluid samples from Site 892.
Core, section,interval (cm)
146-892D-1X-1,9-12LX-1, 145-1502X-2, 140-150
146-892A-2X-3, 0-113X-2, 0-104X-2, 0-106X-2, 0-10
146-892D-6X-4, 140-150
146-892A-7X-5, 140-1508X-3, 0-10
146-892D-8X-3, 0-10
146-892A-9X-1, 69-74
146-892D-9X-4, 0-15
146-892A-11X-2,O-1O13X-4, 0-2515X-1, 88-100
146-892D-12X-3, 130-150
146-892A-16X-1,34-43
146-892D-13X-CC, 22-24
146-892A-17X-2, 3-13
146-892D-14X-1, 115-130
146-892A-18X-1, 115-140
146-892D-15X-2, 135-15016X-3, 135-15016X-5, 135-150
146-892A-20X-2, 0-10
Depth(mbsf)
0.110.011.4
12.620.630.140.6
52.4
55.961.0
64.7
68.2
73.8
79.6101.6116.9
123.4
125.8
128.5
136.6
139.2
145.8
148.9161.4164.4
165.1
Sr(µM)
87.180.163.7
75.4164.3169.0192.4
211.1
208.7229.8
239.1
232.7
250.8
267.2259.4223.7
260.2
260.2
272.9
207.5
267.2
264.9
267.2267.2267.2
278.9
87Sr/86Sr
0.7088780.708560
0.7084110.7077180.7075890.707461
0.707461
0.7072770.707289
0.707268
0.707168
0.707137
0.7071160.7070950.707094
0.707043
0.707115
0.707076
0.707098
0.707126
0.707088
0.707069
0.707109
2σ
1918
20181816
20
1821
18
18
17
201816
22
18
15
18
15
21
18
17
δ 1 8 o(‰ SMOW)
-0.07-0.17
0.33
-0.04-0.11-0.11-0.26
-0.30-0.33
-0.49
-0.32
-0.31
-0.48-0.52
-0.61
-0.56
-0.68
-0.67
-0.15
-0.72-0.75
-0.82
Cascadia margin sites, as well as at the CTJ Site 859, the tempera-tures at the BSR depths are consistently lower by ~1°C than the max-imum temperature derived from the extrapolated seawater-CH4
hydrate univariant curve at the corresponding pressures. This signif-icant difference could be due to (1) remaining problems with fieldcalibrations of the temperature at the BSR, which are difficult to ob-tain; (2) overestimations of the in situ pressures, which is not too like-ly; (3) the assumption that the maximum temperature of the seawater-CH4 hydrate stability field remains shifted at a constant ~1.1°C evenat pressures >IO MPa; or (4) that the chemistry of the in situ pore flu-ids, which is different from seawater composition, has an importanteffect on shifting the maximum temperature of the stability field.Chloride and all major cation concentrations are diluted relative toseawater (Tables 2 and 4). This dilution should have shifted the sta-bility field in the opposite direction (Dickens and Quinby-Hunt,1994). In addition to the Cl and cation dilutions, the most importantchemical differences between seawater and the pore fluids are theirnotably elevated alkalinities and absence of dissolved sulfate, for ex-ample at Site 889 (data in Westbrook, Carson, Musgrave, et al.,1994). The effects of the concentrations of these anions on the stabil-ity field of methane hydrate are unknown. Depending on pressures,mixing with other gases, such as CO2 or H2S, would also shift the sta-bility field in the opposite direction.
H2S-CH4 HYDRATE
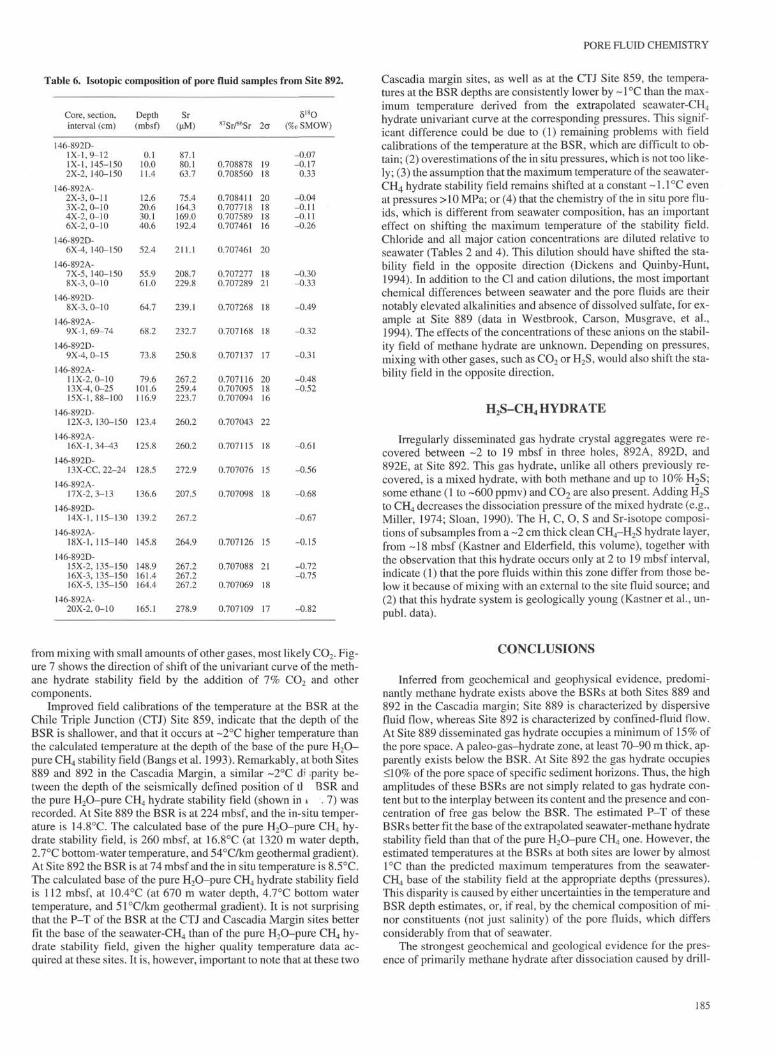
Irregularly disseminated gas hydrate crystal aggregates were re-covered between ~2 to 19 mbsf in three holes, 892A, 892D, and892E, at Site 892. This gas hydrate, unlike all others previously re-covered, is a mixed hydrate, with both methane and up to 10% H2S;some ethane (1 to -600 ppmv) and CO2 are also present. Adding H2Sto CH4 decreases the dissociation pressure of the mixed hydrate (e.g.,Miller, 1974; Sloan, 1990). The H, C, O, S and Sr-isotope composi-tions of subsamples from a ~2 cm thick clean CH4-H2S hydrate layer,from ~ 18 mbsf (Kastner and Elderfield, this volume), together withthe observation that this hydrate occurs only at 2 to 19 mbsf interval,indicate (1) that the pore fluids within this zone differ from those be-low it because of mixing with an external to the site fluid source; and(2) that this hydrate system is geologically young (Kastner et al., un-publ. data).
from mixing with small amounts of other gases, most likely CO2. Fig-ure 7 shows the direction of shift of the univariant curve of the meth-ane hydrate stability field by the addition of 7% CO2 and othercomponents.
Improved field calibrations of the temperature at the BSR at theChile Triple Junction (CTJ) Site 859, indicate that the depth of theBSR is shallower, and that it occurs at ~2°C higher temperature thanthe calculated temperature at the depth of the base of the pure H2O-pure CH4 stability field (Bangs et al. 1993). Remarkably, at both Sites889 and 892 in the Cascadia Margin, a similar ~2°C di parity be-tween the depth of the seismically defined position of tl BSR andthe pure H2O-pure CH4 hydrate stability field (shown in ± .7) wasrecorded. At Site 889 the BSR is at 224 mbsf, and the in-situ temper-ature is 14.8°C. The calculated base of the pure H2O-pure CH4 hy-drate stability field, is 260 mbsf, at 16.8°C (at 1320 m water depth,2.7°C bottom-water temperature, and 54°C/km geothermal gradient).At Site 892 the BSR is at 74 mbsf and the in situ temperature is 8.5°C.The calculated base of the pure H2O-pure CH4 hydrate stability fieldis 112 mbsf, at 10.4°C (at 670 m water depth, 4.7°C bottom watertemperature, and 51°C/km geothermal gradient). It is not surprisingthat the P-T of the BSR at the CTJ and Cascadia Margin sites betterfit the base of the seawater-CH4 than of the pure H2O-pure CH4 hy-drate stability field, given the higher quality temperature data ac-quired at these sites. It is, however, important to note that at these two
CONCLUSIONS
Inferred from geochemical and geophysical evidence, predomi-nantly methane hydrate exists above the BSRs at both Sites 889 and892 in the Cascadia margin; Site 889 is characterized by dispersivefluid flow, whereas Site 892 is characterized by confined-fluid flow.At Site 889 disseminated gas hydrate occupies a minimum of 15% ofthe pore space. A paleo-gas-hydrate zone, at least 70-90 m thick, ap-parently exists below the BSR. At Site 892 the gas hydrate occupies<10% of the pore space of specific sediment horizons. Thus, the highamplitudes of these BSRs are not simply related to gas hydrate con-tent but to the interplay between its content and the presence and con-centration of free gas below the BSR. The estimated P-T of theseBSRs better fit the base of the extrapolated seawater-methane hydratestability field than that of the pure H2O-pure CH4 one. However, theestimated temperatures at the BSRs at both sites are lower by almost1°C than the predicted maximum temperatures from the seawater-CH4 base of the stability field at the appropriate depths (pressures).This disparity is caused by either uncertainties in the temperature andBSR depth estimates, or, if real, by the chemical composition of mi-nor constituents (not just salinity) of the pore fluids, which differsconsiderably from that of seawater.
The strongest geochemical and geological evidence for the pres-ence of primarily methane hydrate after dissociation caused by drill-
185

M. KASTNER ET AL.
B
£
50 -
100 -
150
S" 200T3
O
§ 250
CO 3 0 0
350 "
400
•
•
•
: o » #o«
-
-1
1
• •
o|
1 1 1
•
1
p o π
0
1 1 1
•
o1
1
0
•
-
-
Hole 889 A
Hole 889 B
J_i
_i_
, ii •
CO
"I 50
8" 100
Eg 150o
"I1
1
•
1 1
1 1
•
1 1
i i Φ .
ö a
Hole892A
i i0.2 0.4 0.6 0.8 1 1.2 1.4 1.6
Thickness of soupy layers (m)
0.2 0.4 0.6 0.8 1 1.2 1.4 1.6 6
Thickness of soupy layers (m)
Figure 6. Depth distribution of "soupy" sediment intervals at (A) Site 889 and (B) Site 892.
30
40
50
60708090
100
Field of no hydrate
7% CO 2
E&B seawater
Pure waterf
Vancouvermargin
Temperature vs.depth,
Site 889
Blake-Bahama
Nankai
Field of hydrate stability
i i i i
200
300
400
5006007008009001000
10 20Temperature (°C)
2000
3000
4000
5000
6000700080009000
Figure 7. The stability fields of methane hydrate from compilation of Sloan(1990). The seawater dashed curve is from the equation of state derivationfor artificial seawater by Englezos and Bishnoi (1988) (= E&B) and from theexperimental seawater-CH4 hydrate data by Dickens and Quinby-Hunt(1994).
ing and coring operations consists of the following observations:lower than in situ Cl concentration, dilution of the other major seawa-ter cations equivalent to Cl, high methane concentration, lower thanbottom water core temperature, "soupy" sediment interval, and en-hanced seismic velocity.
A fluid rich in CH4 and containing ethane, advecting from inter-mediate depth into the in situ sulfate reducing zone and migratingalong a low-angle fault, is responsible for the formation of the mixedCH4-H2S hydrate near the sediment/seawater interface at 2-19 mbsf.
ACKNOWLEDGMENTS
We greatly appreciate the Leg 146 shipboard scientists for stimu-lating dialogues, we thank the technicians for their assistance, specif-ically the ODP chemistry technicians Anne Pimmel and Dennis K.Graham for their skillful help in the shipboard geochemical work,and the staff and drilling crews aboard the JOIDES Resolution fortheir cooperation. We are especially grateful for Dr. G. Lugmair atScripps Institution of Oceanography for his assistance in the Sr iso-topic analyses. The manuscript greatly benefitted from reviews byDrs. R.D. Hyndman, R.C. Burruss, and M. Rowe. This research wassupported by a JOI-USSAC grant and by an NSF grant OCE 91-15784 to M.Kastner.
REFERENCES
Arnason, B., 1969. Equilibrium constant for the fractionation of deuteriumbetween ice and water. J. Phys. Chem., 73:3491-3494.
Bangs, N.L.B., Sawyer, D.S., and Golovchenko, X., 1993. Free gas at thebase of the gas hydrate zone in the vicinity of the Chile triple junction.Geology, 21:905-908.
186

PORE FLUID CHEMISTRY
Carson, B., Seke, E., Paskevich, V., and Holmes, M.L., 1994. Fluid expul-sion sites on the Cascadia accretionary prism: mapping diagenetic depos-its with processed GLORIA imagery. J. Geophys. Res., 99:11959-11969.
Carson, B., Suess, E., and Strasser, J.C., 1990. Fluid flow and mass fluxdeterminations at vent sites on the Cascadia margin accretionary prism. /.Geophys. Res., 95:8891-8897.
Craig, H., and Hom, B., 1968. Relationship between deuterium, oxygen-18and chlorinity in the formation of sea ice. Trans. Am. Geophys. Union,49:216-217.
Davidson, D.W., El-Defrawy, M.K., Fuglem, M.O., and Judge, A.S., 1978.Natural gas hydrates in northern Canada. Proc. 3rd Int. Conf. Perma-frost, 3:937-943.
Davidson, D.W., Leaist, D.G., and Hesse R., 1983. Oxygen-18 enrichment inwater of a clathrate hydrate. Geochim. Cosmochim. Acta., 47:2293-2295.
Dholabhai, P.D., Englezos, P., Kalogerakis, N., and Bishnoi, P.R., 1991.Equilibrium conditions for methane hydrate formation in aqueous mixedelectrolyte solutions. Can. J. Chem. Eng., 69:800-805.
Dickens, G.R., and Quinby-Hunt, M.S., 1994. Methane hydrate stability inseawater. Geophys. Res. Lett, 21:2115-2118.
Englezos, P., and Bishnoi, P.R., 1988. Predictions of gas hydrate formationconditions in aqueous solutions. Am. Inst. Chem. Eng., 34:1718-1721.
Hesse, R., Lebel, J., and Gieskes, J.M., 1985. Interstitial water chemistry ofgas-hydrate-bearing sections on the Middle America Trench slope, Deep-Sea Drilling Project Leg 84. In von Huene, R., Aubouin, J., et al., Init.Repts. DSDP, 84: Washington, DC (U.S. Govt. Printing Office), 727-737.
Hyndman, R.D., and Davis, E.E., 1992. A mechanism for the formation ofmethane hydrate and seafloor bottom-simulating reflectors by verticalfluid expulsion. J. Geophys. Res., 97:7025-7041.
Hyndman, R.D., Foucher, J.P., Yamano, M., Fisher, A., Berner, U., et al.,1992. Deep sea bottom-simulating-reflectors: calibration of the base ofthe hydrate stability field as used for heat flow estimates. Earth Planet.Sci. Lett, 109:289-310.
Hyndman, R.D., and Spence, G.D., 1992. A seismic study of methanehydrate marine bottom simulating reflectors. J. Geophys. Res., 97:6683-6698.
Hyndman, R.D., Wang, K., Yuan, T., and Spence, G.D., 1993. Tectonic sed-iment thickening, fluid expulsion, and the thermal regime of subductionzone accretionary prisms: the Cascadia margin off Vancouver Island. J.Geophys. Res., 98:21865-21876.
Kastner, M., Elderfield, H., and Martin, J.B., 1991. Fluids in convergentmargins: what do we know about their composition, origin, role indiagenesis and importance for oceanic chemical fluxes? Philos. Trans. R.Soc. London A, 335:243-259.
Katz, D.L., Cornell, D., Kobayashi, R., Poettmann, F.H., Vary, J.A., Elen-baas, J.R., and Weinaug, CF., 1959. Water-hydrocarbon systems. InKatz, D.L., et al. (Eds.), Handbook of Natural Gas Engineering: NewYork (McGraw-Hill), 189-221.
Kulm, L.D., Suess, E., Moore, J.C., Carson, B., Lewis, B.T., Ritger, S.D.,Kadko, D.C., Thornburg, T.M., Embley, R.W., Rugh, W.D., Massoth,G.J., Langseth, M.G., Cochrane, G.R., and Scamman, R.L., 1986. Ore-gon subduction zone: venting, fauna, and carbonates. Science, 231:561-566.
Kvenvolden, K.A., 1988. Methane hydrate—a major reservoir of carbon inthe shallow geosphere? Chem. Geol., 71:41-51.
Kvenvolden, K.A., and Kastner, M., 1990. Gas hydrates of the Peruvianouter continental margin. In Suess, E., von Huene, R., et al., Proc. ODP,
Sci. Results, 112: College Station, TX (Ocean Drilling Program), 517—526.
Kvenvolden, K.A., and McMenamin, M.A., 1980. Hydrates of natural gas: areview of their geologic occurrence. Geol. Surv. Circ. (U.S.), 825.
Lawrence, J.R., Gieskes, J.M., and Broecker, W.S., 1975. Oxygen isotopeand cation composition of DSDP pore waters and the alteration of LayerII basalts. Earth Planet. Sci. Lett., 27:1-10.
MacKay, M.E., Jarrard, R.D., Westbrook, G.K., and Hyndman, R.D., 1994.Origin of bottom-simulating reflectors: geophysical evidence from theCascadia accretionary prism. Geology, 22:459^162.
Makogon, Y.F., 1981. Hydrates of Natural Gas: Tulsa, OK (PennWell).(Trans, by W.J. Cieslesicz)
Menton, P.D., Parrish, W.R., and Sloan, E.D., 1981. Effect of inhibitors onhydrate formation. Ind. Eng. Chem. Process Des. Dev., 20:399-401.
Merlivat, L., and Nief, G., 1967. Fractionnement isotopique lors de change-ment d'état solide-vapeur et liquide-vapeur de l'éau a des temperatures à0°C. Tellus, 19:122-127.
Miller, S.L., 1974. The nature and occurrence of clathrate hydrates. InKaplan, LR. (Ed.), Natural Gases in Marine Sediments: New York (Ple-num), 151-177.
Mitchell, C.E., Vincent, P., Weldon, R.J., and Richards, M.A., 1994. Present-day vertical deformation of the Cascadian margin, Pacific Northwest,United States. J. Geophys. Res., 99:12257-12277.
Moore, J.C., Orange, D., and Kulm, L.D., 1990. Interrelationship of fluidventing and structural evolution: Alvin observations from the frontalaccretionary prism. J. Geophys. Res., 95:8795—8808.
O'Neil, J.R., 1968. Hydrogen and oxygen isotope fractionation between iceand water. J. Phys. Chem., 72:3683-3684.
Platteeuw, J.C., and van der Waals, J.H., 1958. Thermodynamic properties ofgas hydrates. Mol. Phys., 1:91-96.
Perry, E.A., and Hower, J., 1972. Late-stage dehydration in deeply buriedpelitic sediments. AAPG Bull, 56:2013-2021.
Ransom, B., Spivack, A.J., and Kastner, M., 1995. Stable chlorine isotopesin subduction zone pore waters: implications for fluid-rock reactions andthe cycling of chlorine. Geology, 23:715-718.
Serra, O., 1984. Fundamentals of Well-Log Interpretation (Vol. 1): TheAcquisition of Logging Data: Amsterdam (Elsevier).
Sloan, E.D., 1990. Clathrate Hydrates of Natural Gasses: New York (Mar-cel Dekker).
Suzuki, T., and Kimura, T., 1973. D/H and 18O/16O fractionation in ice-watersystems. Mass Spectros. (Tokyo), 21:229-233.
van der Waals, J.H., and Platteeuw, J.C., 1959. Clathrate solution. Adv.Chem. Phys., 2:1-57.
Wang, K., Hyndman, R.D., and Davis, E.E., 1993. Thermal effects of sedi-ment thickening and fluid expulsion in accretionary prisms: model andparameter analysis. J. Geophys. Res., 98:9975-9984.
Westbrook, G.K., Carson, B., Musgrave, R.J., et al., 1994. Proc. ODP, Init.Repts., 146 (Pt. 1): College Station, TX (Ocean Drilling Program).
Yamamoto, S., Alcauskas, J.B., and Crozier, T.E., 1976. Solubility of meth-ane in distilled and seawater. J. Chem. Eng. Data, 21:78-80.
Date of initial receipt: 9 December 1994Date of acceptance: 31 May 1995Ms 146SR-213
187