10 map projections in the renaissance - the university of ...€¦ · • map projections in the...
TRANSCRIPT

10 • Map Projections in the RenaissanceJohn P. Snyder
365
This chapter is organized in four main sections reflectingbroad types of maps for which projections were useful inthe European Renaissance: world maps (and globes),nautical charts, regional maps, and celestial maps.
Projections for World Maps
When we talk of a “world map,” it is important to dis-tinguish between a map of the world as known at the timethe map was made (the inhabited world or oikoumene)and a map of the whole 360 degrees of longitude and 180degrees latitude of the earth. One of the themes thatemerges in this chapter is how the demand for maps ofthe whole world, and not just the oikoumene, expandedthe options for developing map projections. The worldmap had to be expanded in two directions to accommo-date new geographical knowledge on the part of Euro-peans. The southern hemisphere, the traditional classicallocation of the antipodes beyond the equatorial TorridZone, became known to Portuguese navigators in the fif-teenth century. The identity of the western hemisphere,which would eventually become the New World or theAmericas, developed in the sixteenth. The map could beexpanded in three main ways: by simply doubling the traditional circular representation of a hemisphere; bygeometrically projecting the whole world into a singlegeometric figure, such as a rectangle or an oval; or bysplitting the world into a number of small geometricpieces (gores) that could be used to make globes (fig.10.1). This division is similar to that of Jacques Severt, theauthor of a rare contemporary general description of mapprojections. Severt discusses five types of world projec-tions according to their general shape: a polar azimuthalprojection he named after Guillaume Postel (see fig.47.6), a double hemisphere (named after André Thevet),an oval (named after Giacomo Gastaldi), an extended“cordiform” (named after Gemma Frisius), and a rectan-gular (named after Gerardus Mercator).1
one hemisphere to two
The classical and medieval zonal diagrams usually consistof hemispheres bounded by circles with horizontal
straight parallels usually limited to the equator, the Arctic and Antarctic circles, and the tropics of Cancerand Capricorn. This is the case with a 1493 zone map by
Editor’s note: John Parr Snyder completed his chapters for Volumes3–6 of the History of Cartography so early that he was encouraged topublish them as a separate book, which appeared as Flattening theEarth: Two Thousand Years of Map Projections (Chicago: University ofChicago Press, 1993; reprinted with corrections 1997). In the preface tothat book, he explains the history of his association with the History ofCartography Project (xvii–xviii).
This chapter complements Snyder’s already published work. Its pur-pose is not to summarize the original text but to recast it in a more gen-eral mode and to add information and references that have appearedsince the author’s death in 1997. The structure has been modified according to the main types of map for which the projections were in-tended rather than following Snyder’s original arrangement accordingto mathematical typology or developable surface (plane, cone, cylinder).The reader frequently is referred to Snyder’s book for details on themathematics and for specific bibliographical references on individualprojections. The choice of figures is also intended to supplement Sny-der’s book; they illustrate the historical maps themselves rather than themodern reconstructions that he used.
Accessible general secondary references to the history of map projec-tions other than Snyder include, in chronological order: M. d’Avezac,“Coup d’oeil historique sur la projection des cartes de géographie,” Bul-letin de la Société de Géographie, 5th ser., 5 (1863): 257–361 and 438–85, reprinted in Acta Cartographica 25 (1977): 21–173; Matteo Fiorini,Le projezioni delle carte geografiche, 1 vol. and atlas (Bologna:Zanichelli, 1881); A. E. Nordenskiöld, Facsimile-Atlas to the Early His-tory of Cartography with Reproductions of the Most Important MapsPrinted in the XV and XVI Centuries, trans. Johan Adolf Ekelöf andClements R. Markham (Stockholm: P. A. Norstedt, 1889; reprintedNew York: Dover, 1973); Johannes Keuning, “The History of Geo-graphical Map Projections until 1600,” Imago Mundi 12 (1955): 1–24;Richard E. Dahlberg, “Evolution of Interrupted Map Projections,” In-ternational Yearbook of Cartography 2 (1962): 36 –54; J. A. Steers, AnIntroduction to the Study of Map Projections, 15th ed. (London: Uni-versity of London Press, 1970); and Ad Meskens, “Le monde sur unesurface plane: Cartographie mathématique à l’époque d’Abraham Or-telius,” in Abraham Ortelius (1527–1598): Cartographe et humaniste,by Robert W. Karrow et al. (Turnhout: Brepols, 1998), 70–82.
1. Jacques Severt, De orbis catoptrici: Sev mapparvm mvndi prin-cipiis, descriptione ac vsv, libri tres, 2d ed. (Paris: Lavrentivs Sonnivm,1598), 97–110; copy in Chicago, Newberry Library, Case foliooGA103.S49 1598. Other works contemporary to our period includeBernhardus Varenius, Geographia generalis, in qua affectiones generalestelluris explicantur (Amsterdam: L. Elzevirium, 1650), and Louis deMayerne Turquet [Louis Turquet de Mayerne], Discours sur sa carteuniverselle (Paris, 1648).

Zacharius Lilius. Nearly a century later, the basic zonemap design was still being used by Benito Arias Montanoin his Sacrae geographiae tabulam ex antiquissimorumcultor (1571).2
In the thirteenth century, Roger Bacon described a de-vice for plotting places using longitude and latitude val-ues. A map was made with this device, and although he did not describe the drawing of a graticule for it, thevery plotting of the places from an equally divided equa-tor and outer meridian imply a projection. In the six-teenth century, two-hemisphere projections based on thisprinciple appeared, possibly linked to a map introducedby Pierre d’Ailly (Petrus Alliacus), whose interest inBacon’s work has been established.3 An early examplewas prepared by Franciscus Monachus about 1527 inwhich the equator was marked equally for degrees of lon-gitude and a bounding circle was marked equidistantlyfor parallels of latitude (fig. 10.2). A much larger andmore elaborate example was the map engraved on circu-lar copperplates published by Michele Tramezzino in1554.4 Severt’s archetypal map by André Thevet appearsto be Thevet’s continental map that appeared in La cos-mographie vniverselle (1575).
Similar views of the earth were portrayed in pseudo-globular projections, such as in the map in the Germanedition of Ptolemy’s Geography of about 1495 (see fig.9.8). This map was not, however, the first to “extend thePtolemaic grid to cover the complete sphere,” as Randlessuggests.5 The map shows only 180 degrees of longitude.
366 The History of Renaissance Cartography: Interpretive Essays
fig. 10.1. THREE WAYS OF EXPANDING THE WORLDMAP. Before the explorations of the Renaissance, mapmakershad only one hemisphere to represent, the hemisphere inwhich the oikoumene or inhabited world resided. Cartogra-phers interested in projecting the entire globe had basicallythree choices: (1) making two hemispheres; (2) containing theprojection within some geometric shape, such as an oval, rec-tangle, or cordiform; or (3) splitting the world in various waysto produce globe gores.
2. Snyder, Flattening the Earth, 15–16.3. David Woodward with Herbert M. Howe, “Roger Bacon on Ge-
ography and Cartography,” in Roger Bacon and the Sciences: Com-memorative Essays, ed. Jeremiah Hackett (Leiden: E. J. Brill, 1997),199–222.
4. Rodney W. Shirley, The Mapping of the World: Early PrintedWorld Maps, 1472–1700, 4th ed. (Riverside, Conn.: Early World,2001), 61 (no. 57) and 109–11 (no. 98).
5. W. G. L. Randles, “Classical Models of World Geography andTheir Transformation Following the Discovery of America,” in TheClassical Tradition and the Americas, ed. Wolfgang Haase and MeyerReinhold, vol. 1, European Images of the Americas and the ClassicalTradition, 2 pts. (Berlin: W. de Gruyter, 1994), pt. 1, 5–76, esp. 36.
6. Globus mundi (Strasbourg, 1509), title page; Johannes Schöner,Opusculum geographicum (Nuremberg, 1553), title page; Peter Apian,Cosmographicus liber (Landshut, 1524), title page and fol. 1v; and seeSnyder, Flattening the Earth, 289 n. 44.
7. Snyder, Flattening the Earth, 16 –29.8. Snyder, Flattening the Earth, 17–18.9. Filippo Camerota, personal e-mail to David Woodward, 2 January
2001. For the maps, see Shirley, Mapping of the World, 146 – 47 (no.124) and 224 –25 (no. 206).
Similar woodcuts of terrestrial globes include images of1509 (anonymous), 1533 (Johannes Schöner), and 1524and later editions (Peter Apian).6
Projections of a hemisphere that could be extended totwo hemispheres covering the whole world also includedmathematically rigorous azimuthal projections.7 They in-clude the orthographic, perspective, stereographic, andazimuthal equidistant projections. The gnomonic projec-tion was used exclusively for sundials during this periodand is discussed later in the section on sundials.
Without precise measurement of the graticule, it is dif-ficult to establish the difference between perspectivehemispherical projections centered at a finite distancefrom earth and the orthographic, the projection center ofwhich is at infinity. For example, the projection of the terrestrial globe constructed for Johannes Stabius by Al-brecht Dürer in 1515 (fig. 10.3) has been described as an oblique orthographic.8 It is more likely to be a per-spective projection, however, because it shows only 150degrees of longitude along the equator, whereas the or-thographic projection would show 180 degrees. Further-more, the ellipses representing the parallels are not simi-lar figures (as they are in the orthographic projection)but, moving from the north to the south pole, appear pro-gressively less foreshortened because of their varying dis-tances from the horizon line. If we compare Dürer’s globeto the orthographic projection that appears as an inset tothe world map Nova totivs terrarvm orbis descriptio of1571 by Gerard de Jode or the hemispheres of 1597drawn by Fausto Rughesi (fig. 10.4), we find very differ-ent results.9
Although the earliest use of the stereographic projec-tion was for the star maps on astrolabes (see the sectionon celestial maps that follows), polar, equatorial, and

oblique cases were all used for terrestrial maps in the six-teenth century.10 On the polar aspect, the meridians arestraight lines and the parallels are concentric circles, thespacing of which increases away from the pole. In 1507,Walter Lud of St. Dié prepared the earliest existing worldmap based on the polar stereographic.11 Gregor Reisch(1512) and Peter Apian (1524) also used the polar aspect.In 1596 John Blagrave used the north polar stereographicto the equator but appended the southern hemisphere infour sections according to an uncertain projection, nei-ther conformal nor azimuthal, which placed the world ina square (fig. 10.5).12
The oblique stereographic was recommended for geo-graphical maps as an original projection by Stabius andpromoted as the fourth of four new projections byJohannes Werner in his 1514 revision and translation intoLatin of part of Ptolemy’s Geography.13 In spite of this in-terest, the oblique stereographic was seldom used formaps during the sixteenth century, although Jacques deVaulx produced an unusual example in a manuscript at-las of 1583 for a pair of hemispheres centered on Parisand its opposite point.14
The equatorial stereographic apparently did not ap-pear as a world map until 1542 in the manuscript “Bokeof Idrography” by Jean Rotz.15 But it was the two-hemisphere world map of 1587 by Rumoldus Mercatorthat launched what was to become the most commonprojection for the eastern and western hemispheres in theseventeenth century (fig. 10.6). In the so-called Drakemap, published about 1595, Jodocus Hondius shifted thecentral meridians 90 degrees so that Europe, Africa, andthe Americas could appear in one hemisphere, therebyshowing the circumnavigational routes of Francis Drakeand Thomas Cavendish to better advantage (fig. 10.7).Philip Eckebrecht prepared a map in 1630 for JohannesKepler’s astronomical use, with one hemisphere splitdown the central meridian and the halves placed on eitherside of the intact hemisphere, which was centered on Eu-rope and Africa (fig. 10.8).16
The azimuthal equidistant projection made its debuton an incomplete and rudimentary star map of 1426 by
Map Projections in the Renaissance 367
FIG. 10.2. DOUBLE HEMISPHERE MAP BY FRANCISCUSMONACHUS, CA. 1527. In these images, taken from the titlepage and first page of De orbis situ, Monachus centered theOld World in the Indian Ocean in order to include Africa andAsia in this simple projection in which meridians are spacedequally along the equator. The hemisphere containing the NewWorld shows South America as a separate continent, butNorth America is joined to Asia.Diameter of each hemisphere: 6.5 cm. Photograph courtesy ofthe John Carter Brown Library at Brown University, Provi-dence (F529.F819d).
10. Snyder, Flattening the Earth, 20–28.11. Walter Lud (Gualterius Ludd), Speculi orbis succintissima sed
neque poenitenda, neque inelegans declaratio et canon (Strasbourg:Johannes Grüninger, 1507), referenced in Keuning, “Geographical MapProjections,” 7–8.
12. Snyder, Flattening the Earth, 22–23, and Shirley, Mapping of theWorld, 212–13 (no. 191).
13. Claudius Ptolemy, Noua translatio primi libri Geographiæ . . . ,ed. and trans. Johannes Werner, in In hoc opere haec continentur, byJohannes Werner (Nuremberg, 1514), containing Libellus de quatuorterrarum orbis in plano figurationibus.
14. BNF, MS. Franç. 159, fols. 27r and v.15. BL, Royal MS. 20 E IX.16. Shirley, Mapping of the World, 178–79 (no. 157), 208–9
(no. 188), and 358–59 (no. 335).

Conrad of Dyffenbach and had appeared several times bythe mid-sixteenth century, including in a map by Dürer ofabout 1515.17 The polar form consists simply of equallyspaced latitude circles centered about the pole with radi-ating straight meridians. This projection was used for twoterrestrial hemispheres by Henricus Glareanus about1510 and by several others between 1511 and 1524, in-cluding Giovanni Vespucci, who in 1524 showed thesouthern hemisphere split into two semicircular halvesplaced tangent to the northern hemisphere (fig. 10.9). Ap-parently the first to prepare a north polar azimuthalequidistant map of the entire world was Louis de May-erne Turquet in 1648, who also explained it and otherprojections in a manual of mapmaking.18 The world mapon the floor of the Paris Observatory was drawn on it inthe 1680s.
from the OIKOUMENE to a single geometric figure containing the whole world
In his second-century a.d. Geography, Claudius Ptolemyintroduced two conic-like projections for maps of theoikoumene of Greco-Roman times that covered just overa quarter of the earth’s surface.19 The first projection,with meridians represented as straight lines broken at theequator and parallels of latitude represented as concen-
368 The History of Renaissance Cartography: Interpretive Essays
fig. 10.3. PERSPECTIVE PROJECTION BY DÜRER ANDSTABIUS, 1515. This projection of the Old World, using amodified Ptolemaic representation (but without a closed In-dian Ocean) has often been described as an oblique ortho-graphic, but the inclusion of only 150 degrees of longitude
along the equator (rather than the 180 degrees required by anorthographic) disprove this.Size of the original: 63.7 � 85 cm. Photograph © copyrightthe Trustees of the British Museum, London (1848-11-11-8).
17. Snyder, Flattening the Earth, 29–30.18. Mayerne Turquet, Discours sur la carte universelle, and Shirley,
Mapping of the World, 397–98 (no. 375); for Vespucci, see 58–59 (no.54).
19. Snyder, Flattening the Earth, 10–14, and O. A. W. Dilke and eds.,“The Culmination of Greek Cartography in Ptolemy,” in HC 1:177–200, esp. 185–88.

tric, circular arcs, was used in several early manuscriptsof the Geography and in the first printed edition withmaps (Bologna, 1477). Ptolemy’s second projection, theone he preferred, has concentric, equidistant, circular arcsfor parallels, but curved rather than straight meridians.The northern, southern, and middle parallels of theoikoumene (about 63�N, 16�25�S, and 23�50�N, respec-tively) are marked off correctly for meridians up to 90 de-grees on each side of the central meridian. Meridians withcircular arcs were drawn through these three points.Nicolaus Germanus first used it in his manuscripts ofPtolemy’s Geography dating from about 1470.
Ptolemy’s projections were modified in the late fifteenthcentury to accommodate European geographical discov-eries beyond the oikoumene, but they still did not coverthe whole earth.20 Giovanni Matteo Contarini’s 1506map modified Ptolemy’s first projection in three ways: it
doubled the span of meridians from 180 degrees to thefull 360 degrees; it extended latitudes to the north pole(shown as a circular arc); and it continued the meridiansunbroken to about 35�S without a bend at the equator.21
Ptolemy’s second projection was modified for HenricusMartellus Germanus’s map of about 1490. The mapshows all 360 degrees of longitude. The parallels extend,however, from the north pole to 40�S instead of fromabout 63�N to 16�S on Ptolemy’s projection. MartinWaldseemüller’s 1507 map is on a similar projection, ex-cept that the breaks at the equator are much more abruptthan on the Martellus map, a difference that Keuning as-cribes to practical limitations in the sizes of the wood-
Map Projections in the Renaissance 369
fig. 10.4. OBLIQUE ORTHOGRAPHIC PROJECTION BYFAUSTO RUGHESI, 1597. Titled Novissima orbis vniversi de-scriptio Romæ accvratissime delineata, this elegant construc-tion neatly highlights the northern hemisphere on the right
side and the southern hemisphere on the left, thus emphasiz-ing areas of the world that had been better known.Size of the original: ca. 52.8 � 70 cm. Photograph courtesy ofthe BL (Maps 184.i.1[1]).
20. Snyder, Flattening the Earth, 29–38.21. Shirley, Mapping of the World, 23–25 (no. 24).

blocks used.22 Bernardo Silvano’s map in the 1511 editionof Ptolemy’s Geography extended the meridians ofPtolemy’s projection to 320 degrees of the globe andmarkedly decreased the radii of the latitude circles toplace their center about 10 degrees above the north pole.
Although Ptolemy was concerned only with mappingthe oikoumene, his scheme of describing the position ofplaces by their longitude and latitude could theoreticallybe applied to the whole sphere. The potential of a systemof spatial reference by which every point on earth couldbe plotted on a map on which every potential route forexploration could be shown might seem attractive. It is ageographical idea of elegant simplicity. But maps extend-ing this principle to representations of the whole worldwere slower to appear than we might think.
About 1500, Johannes Stabius, a professor of mathe-matics in Vienna, invented a series of three heart-shaped(cordiform) projections publicized by Johannes Werner of
Nuremberg in 1514. All three were mathematically ofequal area (unlike Ptolemy’s projections) and were devel-oped into several influential maps that are discussed later.The first Werner-Stabius projection was apparently notused, while the third was apparently first employed byOronce Fine for a world map in 1534/36 (see plate 57)that was copied by Giovanni Paolo Cimerlini in 1566.23
The second Werner (or Stabius-Werner) projection firstappeared on a world map by Apian (Ingolstadt, 1530). Itis the only one of the Stabius-Werner projections thatshows the whole world. It was modified in 1531 by Fineto produce a double cordiform world map. Separatenorthern and southern hemispheres were drawn accord-
370 The History of Renaissance Cartography: Interpretive Essays
fig. 10.5. POLAR STEREOGRAPHIC PROJECTION WITHEXTENSIONS TO A SQUARE, BY JOHN BLAGRAVE,1596. This unusual projection was designed as a mathemati-cal instrument, as is evident from the scales and rotating point-
ers, which were intended to be cut out.Size of the original: ca. 26.5 � 26.5 cm (map). Photographcourtesy of the BL (Harl. 5935[15]).
22. Keuning, “Geographical Map Projections,” 11, and see figure 9.9in this volume.
23. Snyder, Flattening the Earth, 33–38, and Shirley, Mapping of theWorld, 77 (no. 69) and 135 (no. 116).

ing to the Werner projection and centered about the re-spective poles; the two circular arcs representing theequator were made tangent at the central meridian. Afterother editions, Fine’s double cordiform projection wasused by Mercator for his world map of 1538.24 There wasoccasional later use, such as in the 1592 map of the north-ern hemisphere by Christian Sgrooten, but the cordiformprojections all but disappeared by the eighteenth centuryin favor of Rigobert Bonne’s projection, which was amore general adaptation of Werner’s projection that pro-vided for less angular distortion in a map of a continent.
In 1556, the Norman navigator Guillaume Le Testushowed cartographic versatility by using six different pro-jections in a manuscript sea atlas. The types of projectionused include Fine’s octant (projection of an eighth of aglobe), Apian’s globular, an Apianlike oval, anothermodified Werner, a rudimentary attempt at an obliqueperspective, and a four-lobed star. The last projection, inwhich petal lobes bounded by circular arcs of meridians90 degrees apart were joined at the north pole, wasamong the first of a general style that has repeatedly beenused up to the present in different forms.25
The oval type of projection resembles a worldwide ver-sion of some of the globular hemispheres.26 It was pro-duced with several variations. Common to nearly all ovalprojections are equidistant horizonal lines for parallels
and curved meridians equidistant at the equator. The firstmap on which the oval projection was extended to thewhole world (globes excepted) was the small oval mapmade about 1508 by Francesco Rosselli, a commercialprintmaker in Florence. This small world map has an im-portance extending far beyond its modest appearance.Graduated with 360 degrees of longitude and 180 degreesof latitude, it is thus the earliest extant map of the worldin the modern sense of “map” and “world.” The equatorand central meridian are both evenly divided in this 10degree graticule, and the ratio of their lengths is very closeto 2:1. Rosselli’s meridians are near-ellipses or ovals con-nected at the poles and cutting each parallel approxi-mately equidistantly (see plate 16).27 Typus orbis ter-rarum, the world map in Abraham Ortelius’s Theatrumorbis terrarum (1570), is probably the best-known ex-
Map Projections in the Renaissance 371
24. Shirley, Mapping of the World, 68–69 (no. 63), 72–73 (no. 66),and 83–84 (no. 74). See figures 42.14 and 47.2 in this volume.
25. Keuning, “Geographical Map Projections,” 23–24, and Snyder,Flattening the Earth, 40.
26. Snyder, Flattening the Earth, 38– 40.27. David Woodward, “Starting with the Map: The Rosselli Map of
the World, ca. 1508,” in Plantejaments i objectius d’una història uni-versal de la cartografia � Approaches and Challenges in a WorldwideHistory of Cartography (Barcelona: Institut Cartogràfic de Catalunya,2001), 71–90.
fig. 10.6. DOUBLE HEMISPHERE STEREOGRAPHICPROJECTION BY RUMOLDUS MERCATOR, 1587. Al-though not the earliest example of such projection, which hadpreviously appeared in manuscript, Rumoldus Mercator’sprinted map set a fashion for world maps, making the double
hemisphere stereographic the most common projection forworld maps in the seventeenth century.Size of the original: ca. 28.5 � 51.9 cm (map). Photographcourtesy of the BL (Maps C.3.c.4).

ample of an oval projection (see fig. 44.9), but the pro-jection is nearly identical to the one that Battista Agneseused on several maps of about 1540.28
The last of the major new projections of the wholeearth during the period was the sinusoidal, named for itsmeridians drawn as sine curves. It combines some impor-tant qualities with simple construction: areas are showncorrectly, and the scale along the central meridian andalong every parallel of latitude is correct. The projectionis, in effect, an equatorially centered modification of thepole-centered Werner projection.
The origin of this projection has been variously re-ported. Jean Cossin used it for a world map in 1570 (plate12), and Hondius used it for maps of South America andAfrica in some of his editions of Mercator’s atlases of1606 –9. The latter use is probably the basis for one of itsnames, the Mercator equal-area projection. Nicolas San-son d’Abbeville used it beginning about 1650 for maps ofseveral continents, while John Flamsteed, the first as-
tronomer royal of England, used it—perhaps curiously,considering its nonconformality—for star charts, result-ing in the common name Sanson-Flamsteed.29
globe gores
The earliest extant globe is Martin Behaim’s globe of1492, although we have references to earlier examples.30
These fifteenth-century globes were painted directly on
372 The History of Renaissance Cartography: Interpretive Essays
fig. 10.7. DOUBLE HEMISPHERE STEREOGRAPHICPROJECTION BY JODOCUS HONDIUS, CA. 1595. Thehemispheres on Hondius’s world map showing Drake’s andCavendish’s voyages are unusually centered. Abandoning thetraditional division between the Old World and the New (see
fig. 10.6), Hondius put South America and Africa in the samehemisphere, probably to avoid splitting the Atlantic.Size of the original: ca. 38 � 53.5 cm. Photograph courtesy ofthe BL (M.T.6.a.2).
28. Meskens, “Le monde sur une surface plane,” 81–82.29. Snyder, Flattening the Earth, 49–51.30. The issue of “the earliest terrestrial globe” is fraught with the
usual caveats of “famous firsts,” and is thus more complicated than itwould appear. To begin with, there were references to terrestrial globesin the classical period, such as Strabo’s description of the large globemade for Crates of Mallos and Ptolemy’s allusion to globes in the Ge-ography. Martin Behaim’s globe is justly celebrated as the earliest extantterrestrial globe, an assertion that has yet to be challenged. But late

Map Projections in the Renaissance 373
the spherical surface, so no projection was required.From the early sixteenth century, however, printed globeswere usually made by pasting strips, known as gores, ona ball. These gores, which could be of various thicknessesand could extend from pole to pole or pole to equatoralong meridians usually 10 degrees to 30 degrees apart,were a type of map projection. The earliest extant setseems to be those Martin Waldseemüller prepared for asmall globe in 1507 consisting of twelve gores 30 degreeswide with a 10 degree graticule.31 Some other gore mapsare joined at the poles instead of the equator, such as mid-sixteenth century sets of gores 10 degrees wide in thenorthern and southern hemispheres, which appear on a1542 manuscript map by Alonso de Santa Cruz and a1555 engraved map by Antonio Floriano.32
Other gore arrangements represent more interruptedmap projections. A manuscript map in the style ofFrancesco Ghisolfi (ca. 1550) has a central gore of 120degrees covering Africa and Europe, flanked by two pairsof gores of 60 degrees for the rest of the world.33 Anothermap, by Georg Braun (1574), was drawn in the shape ofthe Habsburg double eagle, with Africa, Europe, andmuch of Asia in an unbroken section of the projectionand the Americas and East Asia literally in the wings (fig.10.10).34
From time to time, cartographers have also been in-trigued by the concept of projecting the globe onto a poly-
fig. 10.8. DOUBLE HEMISPHERE STEREOGRAPHICPROJECTION BY PHILIP ECKEBRECHT, 1630. Ecke-brecht’s variation on the double hemisphere projection on thismap, which shows positions of places derived from JohannesKepler’s Rudophine Tables, was intended to preserve the in-
tegrity of the European and African continents as well as theAtlantic, while splitting the Pacific Ocean.Size of the original: 38.5 � 68 cm. Photograph courtesy of theBL (48.f.7).
medieval references to nonextant terrestrial globes also need to be takeninto account. Nicolaus Germanus made a pair of globes for the Vaticanlibrary in 1477, as described by Józef Babicz in “The Celestial and Ter-restrial Globes of the Vatican Library, Dating from 1477, and TheirMaker Donnus Nicolaus Germanus (ca 1420–ca 1490),” Der Globus-freund 35–37 (1987–89): 155–68. Earlier nonclassical reports includethe globe made by Guillaume Hobit for Philip the Good, duke of Bur-gundy, between 1440 and 1444, but a manuscript in the BNF describesthe construction by Jean Fusoris of an earlier globe (1432) to show theprinciple of longitude (see chapter 9 in this volume, note 142). Anotherless clear allusion is to a treatise called “Regionum sive civitatum dis-tantiae,” which is described by Johannes Schöner, whose original ver-sion may date back to 1430–35 (see p. 139), but the basis for this dat-ing is in doubt. The primacy of the Fusoris and “Regionum” allusionsstill needs to be established.
31. Figure 6.5 and Shirley, Mapping of the World, 28–29 (no. 26).A method for constructing such gores was described by HenricusGlareanus in his manual of geography, D. Henrici Glareani poetælavreati De geographia liber vnvs (Basel, 1527). See Nordenskiöld, Fac-simile-Atlas, 71–75, esp. 74.
32. The Santa Cruz map is reproduced in Leo Bagrow, History ofCartography, 2d ed., rev. and enl. R. A. Skelton, trans. D. L. Paisey(Chicago: Precedent, 1985), pl. 65. The Floriano map is reproduced inShirley, Mapping of the World, 113 (no. 99).
33. Dahlberg, “Interrupted Map Projections,” fig. 2.34. Shirley, Mapping of the World, 154 –55 (no. 130).

374 The History of Renaissance Cartography: Interpretive Essays
hedron as a compromise between a flat sheet and theround globe. Dürer proposed projecting onto a regulartetrahedron (four triangles), dodecahedron (twelve pen-tagons), icosahedron (twenty triangles), and other solids.He included diagrams in a book published in 1538 butapparently did not construct maps based on them.35
The surface of the globe may also be conveniently di-vided into eight equilateral spherical triangles, or octants,each section bounded by the equator and two meridians90 degrees apart. One such set of octant gores has beencontroversially attributed to Leonardo da Vinci. Al-though he may have sketched out ideas for such a pro-jection, as the suggestive page from the Codex Atlanticusshows (fig. 10.11), the drawing in the world map of 1514 does not appear to be in Leonardo’s style.36 Latersixteenth-century versions occur in Oronce Fine’s Sphaera
mundi (Paris, 1551), in which he added meridians andparallels as equidistant, circular arcs within each octant;in one of the 1556 maps by Le Testu; and in a 1616 mapby Daniel Angelocrator.37
Projections for Sea Charts
Although the sea charts of the Mediterranean that beganto be made in the thirteenth century normally have no
fig. 10.9. AZIMUTHAL EQUIDISTANT PROJECTIONCENTERED ON THE NORTH AND SOUTH POLES BYGIOVANNI VESPUCCI, 1524. The arrangement of the hemi-spheres in this projection is similar in concept to Eckebrecht’s,except that the aspect is polar, not equatorial, and the projec-tion is equidistant, not stereographic. Because the map was
produced in association with the Badajoz-Elvas Conference,its purpose was presumably to allow the visualization of theSpanish and Portuguese realms in both eastern and westernhemispheres.Size of the original: 27.5 � 37.5 cm. By permission ofHoughton Library, Harvard University (51-2573 PF).
35. Albrecht Dürer, Underweysuug [sic] der Messung, mit dem Zirc-kel vnd Richtscheyt, in Linien Ebnen vñ gantzen Corporen (Nuremberg:Hieronymum Andreae, 1538).
36. As Nordenskiöld correctly pointed out in Facsimile-Atlas, 76 –77,it appears to be more in the style of a clerk or copyist.
37. Snyder, Flattening the Earth, 40.

graticule, graduations of longitude and latitude along theequator and some meridians on early sixteenth-centurycharts suggest the equirectangular projection. Their al-most universally uniform spacing, as on the world chartsof 1529 by Diogo Ribeiro, indicates the preeminence ofthis projection for sixteenth-century nautical charts untilMercator’s projection became more widely acceptedmany years after it was presented in 1569.38
The plane chart is the simplest way of representing thewhole world on a projection, depicting it as a rectangle360 degrees wide and 180 degrees high graduated insquares or rectangles. It was credited by Ptolemy to Mari-nus of Tyre around 100 a.d., but Ptolemy recommended
using this projection only for maps of smaller areas be-cause of its large degree of deformation in higher latitudes(discussed later). The plane chart represented one of twoentirely different world map traditions in the sixteenthcentury. A map compiled in this tradition was called ei-ther a carta da navigare or a carta marina. It could be eas-ily recognized by the superimposition of a compass roseand radiating lines. The other kind of world map—calleda cosmographia, descriptio, or tabula, was intended for
Map Projections in the Renaissance 375
fig. 10.10. INTERRUPTED CORDIFORM MAP OF THEWORLD BY GEORG BRAUN, 1574. The concept of inter-rupting a map projection to preserve the representation ofshape and area on the globe is similar to the concept of globegores, but here it has been ingeniously manipulated to con-
form to the shape of the Habsburg double eagle.Size of the original: 86 � 100 cm. Photograph courtesy of theHerzog August Bibliothek, Wolfenbüttel (KartensammlungK 2.6).
38. Ribeiro’s charts are illustrated in figures 30.29 and 30.30; Mer-cator’s chart is figure 10.12; and see also Snyder, Flattening the Earth,5–8.
scholarly or educational use. The distinction between thetwo was explicitly recognized, and the maps often camein pairs.
Although the large manuscript maps of the world drawnin the early sixteenth century (by Alberto Cantino, Nicolòde Caverio, etc.) have no graduations in longitude or lati-tude (see appendix 30.1), Martin Waldseemüller’s 1516Carta marina, which used these charts as a model, wasgraduated in squares. The term “planisphere” has oftenbeen used to describe these large nautical charts, but thisusage is misleading. If the root meaning of the word (a flatsphere) is examined, the term could be applied to all mapprojections that attempt to represent a spherical surface ona plane. Ptolemy originally used the term planisphaeriumto describe the stereographic projection until François deAguilón named it the stereographic in 1613.39
Unquestionably, the most famous projection originat-ing in the Renaissance (and since) has been the one sim-ply named for the inventor Gerardus Mercator.40 It was
presented in his 1569 world map of eighteen sheets,which was mounted in twenty-one sections totaling about1.3 by 2 meters in size (fig. 10.12). Like the equirectan-gular projection, it has equidistant, straight meridians,with parallels of latitude that are straight, parallel, andperpendicular to the meridians. Unlike the equirectangu-lar, it has parallels that are spaced directly proportionalto the increasing scale along the parallels. Mercator prob-ably determined the spacing graphically, because tables ofsecants had not been invented.
Mercator’s stated purpose in developing this projectionwas to provide an aid for navigators. All lines of constantbearing (loxodromes or rhumb lines) are straight lines.The projection thus became valuable to sailors, who
376 The History of Renaissance Cartography: Interpretive Essays
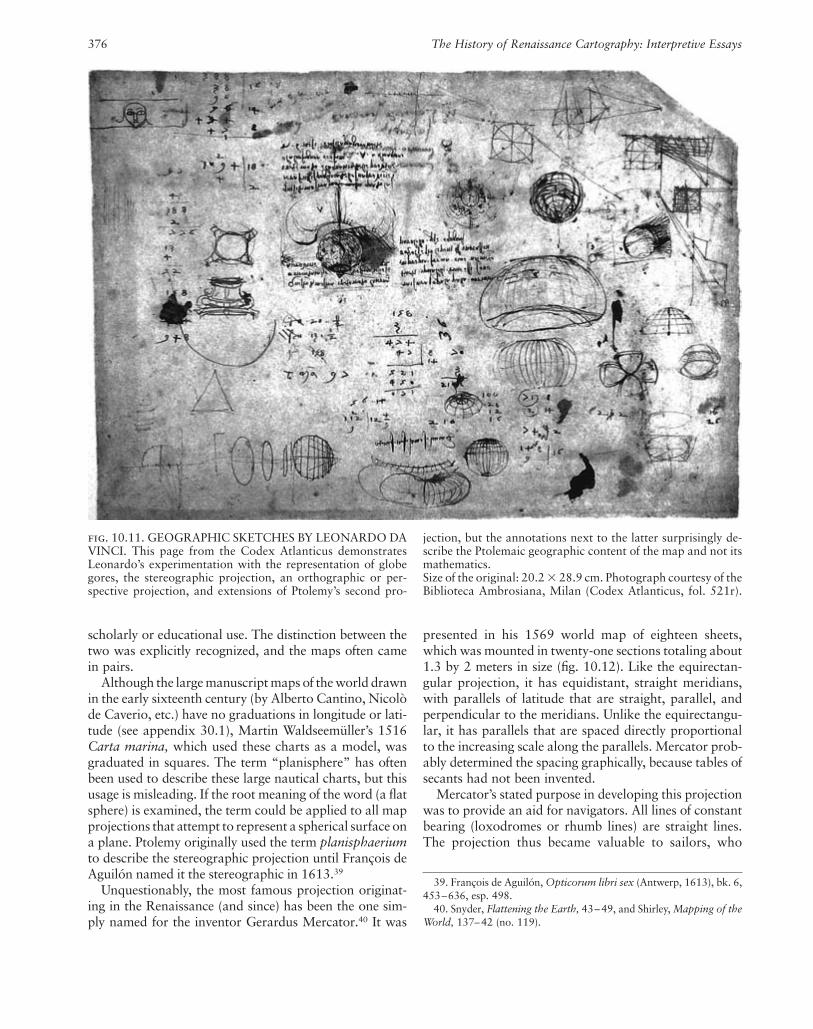
fig. 10.11. GEOGRAPHIC SKETCHES BY LEONARDO DAVINCI. This page from the Codex Atlanticus demonstratesLeonardo’s experimentation with the representation of globegores, the stereographic projection, an orthographic or per-spective projection, and extensions of Ptolemy’s second pro-
jection, but the annotations next to the latter surprisingly de-scribe the Ptolemaic geographic content of the map and not itsmathematics.Size of the original: 20.2 � 28.9 cm. Photograph courtesy of theBiblioteca Ambrosiana, Milan (Codex Atlanticus, fol. 521r).
39. François de Aguilón, Opticorum libri sex (Antwerp, 1613), bk. 6,453–636, esp. 498.
40. Snyder, Flattening the Earth, 43– 49, and Shirley, Mapping of theWorld, 137– 42 (no. 119).

fig
.10
.12.
TH
E M
ER
CA
TO
R P
RO
JEC
TIO
N,
1569
. A
l-th
ough
att
empt
s ha
ve b
een
mad
e to
cit
e pr
ecur
sors
to
Ger
ar-
dus
Mer
cato
r’s
conc
ept
of p
rodu
cing
a m
ap o
n w
hich
line
s of
cons
tant
com
pass
dir
ecti
on w
ere
repr
esen
ted
as s
trai
ght,
thi
sei
ghte
en-s
heet
pri
nted
map
can
cla
im t
o be
dra
wn
usin
g th
em
ost f
amou
s pr
ojec
tion
of t
he R
enai
ssan
ce. T
he s
mal
l dia
gram
inse
t at t
he lo
wer
rig
ht p
rovi
des
a gr
aphi
c re
pres
enta
tion
of t
heco
nstr
ucti
on o
f th
e pr
ojec
tion
.Si
ze o
f the
ori
gina
l: 12
4 �
202
cm. P
hoto
grap
h co
urte
sy o
f the
Öff
entl
iche
Bib
lioth
ek d
er U
nive
rsit
ät, B
asel
(Kar
tens
amm
lung
AA
3-5
).

could follow a single compass setting (adjusted for mag-netic declination) based on the bearing or azimuth of thestraight line connecting the point of departure and thepoint of destination on the map.
Edward Wright, a Cambridge University professor andnavigational consultant for the East India Company, laterstudied the Mercator projection, apparently indepen-dently. In his Certaine Errors in Navigation (1599, rev.1610 and 1657), he included “A Table of Latitudes” inwhich he provided the distance from the equator of eachprojected parallel, in increments of one minute, with aprecision equivalent in modern terminology to four deci-mal places. His underlying calculations were of far greateraccuracy than Mercator’s graphical construction. Thiscombination of great precision and accuracy—and possi-bly national pride—led a number of writers, includingEdmond Halley, to credit Wright rather than Mercatorwith the invention.41
Although use of the projection began slowly, PetrusPlancius used it for a world map for which the Dutch gov-ernment granted him a twelve-year patent in 1592. Afterthe patent expired in 1604, Willem Jansz. Blaeu decidedto bring out another version in 1606 –7.42 It was not un-til later that the Mercator projection became all too com-mon in world maps used for geographic purposes in ad-dition to navigation, which has remained an importantuse to the present. In promoting use of the projection forgeographic purposes, a use unintended by Mercator, onecannot overlook the importance of the fact that Europe isportrayed with about twice its true area in proportion tocountries near the equator.43
Projections for Regional Maps
The requirements of projections for maps covering smallerareas of the world are somewhat different than for worldmaps. At larger scales, the difference between key proper-ties such as conformality and equivalence (equal area) maynot be as evident. Simplicity of construction is thus upper-most. The most common projection for regional maps inthe Renaissance became known as the trapezoidal becauseof its straight parallel parallels and straight convergingmeridians.44 Used in a rudimentary form in 1426 by Con-rad of Dyffenbach, the trapezoidal projection also appearson a map of central and southern Africa in the mid-fifteenth century Wilczek Brown codex of maps fromPtolemy’s Geography.45 Nicolaus Germanus claimed it ashis own invention in 1482 and used it in several manu-scripts of Ptolemy’s Geography, beginning in 1466, and inthe 1482 and 1486 printed Ulm editions.46 The projectionwas often the basis for regional maps in other atlases, in-cluding those of Ortelius and Mercator. Mercator used amodification of the trapezoidal projection for larger terri-tories in the first and second parts of his atlas (1585 and
1589). In this projection, the parallels of true scale are notthe outer ones, but they are about one quarter and threequarters of the distance between the limiting latitudes toreduce the overall distortion.47
Projections for Celestial Maps
The energy devoted to the construction of astrolabes inthe Middle Ages was astounding.48 Central to the effortwas the construction of star maps to appear on the rete,while the tympans (plates) bore networks of lines of equalazimuths and altitudes that were latitude dependent. Thestars were projected for the rete using a generic, polarstereographic projection because it was conformal anddisplayed the movement of the heavens in relation to thehorizon as perceived by the observer. The angle betweenany three stars in the sphere is the same as the angle be-tween the projection of these stars onto the plane. Fur-thermore, any circle in the celestial sphere, such as theecliptic, celestial equator, or celestial tropics, could berepresented as a circle on the projection. The principlesof the stereographic were known to Hipparchus, andPtolemy wrote a manual on its use, the Planisphaerium.The equatorial aspect of the stereographic was employedby the Arab astronomer al-Zarqello (Azarquiel) of Toledoin the eleventh century in an astrolabe design.49
The use of the stereographic projection carried overinto the printed celestial maps of the Renaissance, in-cluding Albrecht Dürer’s star maps of the northern andsouthern celestial hemispheres (1515). Dürer’s graticule is
378 The History of Renaissance Cartography: Interpretive Essays
41. Snyder, Flattening the Earth, 47– 48 and n. 107.42. Günter Schilder, “Willem Jansz. Blaeu’s Wall Map of the World,
On Mercator’s Projection, 1606 –07 and Its Influence,” Imago Mundi31 (1979): 36 –54.
43. Christa Binder and Ingrid Kretschmer, “La projection mercato-rienne,” in Gérard Mercator cosmographe: Le temps et l’espace, ed.Marcel Watelet (Antwerp: Fonds Mercator Paribus, 1994), 192–207,esp. 193, and Mark Monmonier, Rhumb Lines and Map Wars: A So-cial History of the Mercator Projection (Chicago: University of ChicagoPress, 2004).
44. Snyder, Flattening the Earth, 8–10.45. See plate 10. On Dyffenbach’s maps, see Richard Uhden, “An
Equidistant and a Trapezoidal Projection of the Early Fifteenth Cen-tury,” Imago Mundi 2 (1937): 8, and Dana Bennett Durand, TheVienna-Klosterneuburg Map Corpus of the Fifteenth Century: A Studyin the Transition from Medieval to Modern Science (Leiden: E. J. Brill,1952), pl. I. On the Wilczek-Brown Codex, see O. A. W. Dilke andMargaret S. Dilke, “The Wilczek-Brown Codex of Ptolemy Maps,”Imago Mundi 40 (1988): 119–24.
46. See Nicolaus Germanus’s dedicatory letter to Pope Paul II fromthe Ulm 1482 edition, quoted in Nordenskiöld, Facsimile-Atlas, 14.
47. Johannes Keuning, “The History of an Atlas: Mercator-Hondius,” Imago Mundi 4 (1947): 37–62, esp. 39.
48. R. T. Gunther, The Astrolabes of the World, 2 vols. (Oxford: Ox-ford University Press, 1932).
49. Emilie Savage-Smith, “Celestial Mapping,” in HC 2.1:12–70,esp. 28–31, and Keuning, “Geographical Map Projections,” 8.

limited to ecliptic longitude lines radiating from the cen-tral ecliptic poles, but star positions indicate the stereo-graphic. Johannes Honter included some small circles ofthe celestial graticule in his pair of star maps in 1532.50
Other projections were used for star maps in the pe-riod. I have already mentioned Flamsteed’s use of the si-nusoidal equal-area projection. Wilhelm Schickard, aGerman astronomer and mathematician from Tübingen,was the first of several seventeenth- and eighteenth-century mapmakers to use the conic projection for celes-tial maps.51 Johannes Kepler employed the equatorial as-pect of a gnomonic projection for a star map of 1606, andvarious aspects were used for constellations in a 1612 at-las by Christoph Grienberger and for some star charts byhis colleague Orazio Grassi in 1619.52
Projections for sundials provide a specialized case. The gnomonic projection has a direct connection withsundial design. The angles between the hour markings ona sundial designed for a particular latitude are identicalwith the angles between the meridians on a gnomonicprojection centered at the same latitude, counting each 15degrees of longitude from the central meridian as onemore hour from noon. To allow one to read time, the
Map Projections in the Renaissance 379
50. Snyder, Flattening the Earth, 22.51. Wilhelm Schickard, Astroscopium, pro facillima stellarum cogni-
tione noviter excogitatum (Tübingen, 1623; Nordlingae, 1655), refer-enced and reproduced in Deborah Jean Warner, The Sky Explored: Celestial Cartography 1500–1800 (New York: Alan R. Liss, 1979),224 –28.
52. Warner, Sky Explored, 135, 100, and 99, respectively.
fig. 10.13. GNOMONIC PROJECTION BY FRANZ RIT-TER, 1610. The gnomonic projection, in which all great cir-cles are represented by straight lines, was usually employed forsundials. In this example, centered near Nuremberg, a repre-sentation of the earth has also been incorporated to show the
relative time at various places. The deformation of shape awayfrom the center is dramatically shown.Size of the original: 29.5 � 36 cm. Photograph courtesy of theNewberry Library, Chicago (Novacco 2F7).

gnomonic map is first rotated so that the north pole issouth of the center of projection rather than north. Thenthe triangular gnomon of the sundial is placed with itsbase along the central meridian and its shadow-castingback touching the north pole on the map. The local suntime is indicated by the meridian along which the shadowof the sun then falls.
The use of the gnomonic projection for maps duringthe Renaissance was rare, apparently postdating 1600.One early geographic example is an oblique aspect of thegnomonic centered near Nuremberg, with a 5 degreegraticule, which was published in 1610 (fig. 10.13).53
Erhard Etzlaub used a projection similar to Mercator’sin appearance if not in function for a small map limitedto Europe and North Africa on the cover of some sundialsconstructed in 1511 and 1513 (fig. 10.14). It extended in1 degree intervals of latitude from the equator to 67�N,with spacing that increases in a way similar to that of the
Mercator projection. Englisch has postulated a direct linkbetween Etzlaub’s map and Mercator’s, suggesting thatthe projection should be called the Etzlaub-Mercator.54
Conclusion
By 1500 it was already clear that the classical frame ofPtolemy’s maps would no longer contain the new geo-graphical discoveries in the hemispheres opposite theoikoumene in the south and west. Yet Ptolemy’s Geogra-phy did possess the theoretical seeds—a system of world-wide coordinates—to allow this transformation to takeplace. When the Geography arrived in Western Europe atthe end of the fourteenth century, it was first translated byJacopo Angeli because of the perceived authority of theancient text. Humanistic interest in Ptolemy’s text astranslated into Latin was far greater than in the maps.
By the last quarter of the fifteenth century, however, theGeography was a bestseller among illustrated printedbooks. When world trade beyond Europe expanded to acircumnavigated world, an effective method of mappingit with latitude and longitude was already understood inscholarly circles. Even then, the early interest in coordi-nate systems and projections was motivated more by aninterest in mathematical games and geometric shapes (cir-cle, sphere, oval) expressing the ideals of perfection andwholeness than by an interest in pinpointing places forwayfinding or inventorying places for imperial ambitions.The empirical data for compiling an accurately plottedmap were largely unavailable until the position of a largenumber of key astronomical observatories had been fixedin the seventeenth century as Eckebrecht’s 1630 map rep-resents so clearly.
This may explain why workaday maps for wayfinding(such as nautical charts) were rarely compiled using longi-tude and latitude until later in the sixteenth century. Thisis illustrated by the parallel development of two entirelydifferent kinds of world map, the carta marina and the cos-mographia. The first looked like a nautical chart; the sec-ond like a world map out of a geographical textbook.Maps of the two types were published in pairs: FrancescoRosselli sold a pair around 1508 that are still found to-gether, and Martin Waldseemüller’s 1507 Vniversalis cos-mographia and 1516 Carta marina are well-known largerexamples.55 It is tempting to postulate that the practice oc-
380 The History of Renaissance Cartography: Interpretive Essays
53. Published in Franz Ritter, Speculum solis (Nuremberg: PaulFürstens, 1610), referenced and reproduced in David Woodward,“Early Gnomonic Projection,” Mapline 13 (1979): [1–2]. See alsoShirley, Mapping of the World, 290–91 (no. 270).
54. Brigitte Englisch, “Erhard Etzlaub’s Projection and Methods ofMapping,” Imago Mundi 48 (1996): 103–23.
55. See Shirley, Mapping of the World, 32–33 (nos. 28 and 29[Rosselli]), 29–31 (no. 27 [Waldseemüller]), and 46 – 49 (no. 42 [Wald-seemüller]), and see also plate 16 and figures 1.3 and 9.9.
fig. 10.14. MAP OF EUROPE AND NORTH AFRICA FORUSE WITH A SUNDIAL, DRAWN BY ERHARD ETZLAUBON A “MERCATOR-LIKE” PROJECTION, 1511. The in-creasing spacing of the parallels of latitude toward the northpole (south is at the top) have led some authors to cite this mapas a precursor to the Mercator projection, but because the mapfunctioned as a sundial and not a map for the use of naviga-tors, any direct link is unlikely.Size of the original: 11.8 � 8 cm. Photograph courtesy of theGermanisches Nationalmuseum, Nuremberg (WI 28).

curred as early as the last decade of the fifteenth century;perhaps a carta marina version of Henricus Martellus Ger-manus’s large cosmography of ca. 1490 will somedayemerge. The pairing was later evident in editions of Ptol-emy’s Geography and other cosmographies in the six-teenth century. The combination of these two types ofworld map was achieved in the elegance of the Mercatorprojection in 1569. It provided a plane chart that could becompiled with longitude and latitude values.
Ease of construction was certainly an important con-cern for plane charts and regional maps on trapezoidalprojections that continued to be used into the eighteenthcentury. Graticules of meridians and parallels constructedentirely with straight lines, especially in the projectionsattributed to Marinus and Nicolaus Germanus, gave wayonly in part to those employing a mixture of circular arcsand straight lines, especially the conic-like projections ofPtolemy and of those who improved upon his designs, aswell as oval and globular types of projections. Straightlines were also used for Mercator’s new projection fornavigation, but the property of straight rhumb lines wascentral to the use of his projection rather than the recti-linear graticule; the mathematical spacing between theparallels was the complicating factor.
The special mathematics needed for the stereographicand gnomonic projections had been understood in the
Middle Ages in the context of astronomical instruments.Theoretical properties of equal area and conformalitywere understood by mathematicians such as JohannesStabius, Johannes Werner, Johannes Schöner, GemmaFrisius, and Oronce Fine, as is illustrated by a bewilder-ing variety of cordiform projections with complex curves.Elegant solutions were proposed, and fierce rivalries as tothe primacy of a particular invention (such as the Merca-tor projection) were not only common then, but have alsocontinued today on the part of modern historians.
The mathematics was still largely based on Euclid, as isshown by general writing about projections during theperiod. Artisans who made instruments, such as naviga-tors, were not always skilled in mathematics, and thepractical need for it was not always evident. What wasmissing was a means of describing projections and theirproperties by means of algebraic equations. It remainedfor the dramatic development of calculus in the late sev-enteenth century to answer the need for more mathemat-ically based map projections. Although the major projec-tion types in use in the modern era were in place by theend of the period under consideration, a roadblock hadbeen encountered, and a Leibnitz, Lambert, or Gauss wasneeded to break through it.
Map Projections in the Renaissance 381