10 m interferometry of disks around young stars file10 m interferometry of disks around young stars...
TRANSCRIPT
10 µm interferometry of disks around young stars
Roy van BoekelMax-Planck-Institut fur Astronomie, Konigstuhl 17, D-69117 Heidelberg, Germany
E-mail: [email protected]
Abstract.This contribution reviews results from interferometric observations of circumstellar disks around young
stars of .3 M�, performed with the MIDI instrument operating in the 10 µm spectral region. Two maintopics, the disk structure on ∼1-10 AU scales and the dust properties in the same region, are illustrated withseveral examples of MIDI studies, covering various evolutionary stages. The spatially resolved observationslargely confirm SED-only based hypotheses on disk structure, yet also reveal degeneracies that may occurin such SED modeling. The properties of the dust on the disk surface show a strong radial dependence: thedust close to the central star has generally larger grain sizes and in particular a much higher crystallinitythan the dust in more remote disk regions.
1. IntroductionCircumstellar disks are ubiquitous around stars during much of their formation. Disks have been studiedfor numerous years around young stars of ∼1 and 2-3 solar masses, known as ”T Tauri” and ”Herbig Ae”(HAe) stars, respectively. Excellent overviews can be found in the ”Protostars and Planets V” book [1].More recently, evidence has been found for disks around brown dwarfs [2] as well as high mass stars[3; 4], thus extending the mass range of young stars around which disks are known to exist to at least 2decades.
In an early stage of the pre-main sequence evolution, much of the stellar mass is accreted onto theforming star through the disk, while angular momentum is carried away. In a later phase, the stars aresurrounded by a still massive disk consisting of gas and dust, but the accretion rate is lower by severalorders of magnitude. It is during this phase that giant gas planets and terrestrial planets (or at least”planetesimals”, their kilometer sized seeds) are thought to form. The disks dissipate on a time scaleof several Myr [5], with the inner disk regions close to the star being cleared first while the outer diskregions appear to survive somewhat longer [see e.g. 6, and references therein].
During the early, high accretion phase the luminosity of the system is dominated by the release ofgravitational energy of accreting material and hence the disks are called ”active”. Later, radiation fromthe stellar photosphere is the main energy source; the disk absorbs part of the stellar light and is therebyheated. The absorbed energy is re-emitted at infrared to millimeter wavelengths, causing the ”infraredexcess” emission that is a key feature of circumstellar material. Since the disks are not self-luminousduring this phase but merely reprocess stellar radiation, they are called ”passive”. The passive diskphase lasts roughly an order of magnitude longer than the earlier active disk phase, and passive disks aretypically much less enshrouded in natal cloud material than younger systems. Hence, most observationsof disks are of objects in the passive phase, this is true for the observations reviewed here as well.
arX
iv:0
810.
5534
v1 [
astr
o-ph
] 3
0 O
ct 2
008
1.1. Observations of circumstellar disksObservational studies of young stars and their disks are immensely numerous and cover theelectromagnetic spectrum from X-rays to radio wavelengths. In the scope of this conference, it is usefulto divide such studies into two categories: those that do not spatially resolve the disks, and those that do.
The majority of spatially unresolved studies focus on observing and modeling the SED of youngstar+disk systems from the UV/optical to mm wavelengths. Physical models of disks, and sometimesalso envelopes, are employed to reproduce the infrared excess emission [see 7, and references therein].Thereby, also the spatial structure of the circumstellar environment is derived, albeit in an indirect way.High spectral resolution optical and near-infrared spectroscopy of emission lines of mainly Hydrogenthat trace accretion activity often show strong day-to-day variability, demonstrating that the innermostdisk region is a highly dynamical environment [e.g. 8, and references therein]. Spectro-polarimetryprobes the structure of gaseous inner accretion disks down to a scale of a few stellar radii [9]. Theseexamples show that from spatially unresolved observations, it is sometimes possible to derive propertiesof the circumstellar material on scales much below the resolution limit of those measurements, and evenon scales that are still inaccessible even to the highest spatial resolution observations available today.However, these benefits often come at a price in the form of degeneracies in the derived results that canbe lifted by spatially resolved observations.
Since these are proceedings of a conference on high (angular) resolution astronomy, the focusnaturally is on observations that do spatially resolve the disk. Due to the small angular sizes ofcircumstellar disks, interferometric techniques are commonly needed to resolve them. In some cases,though, single telescopes may spatially resolve the outer disk regions of nearby objects. Some disks havebeen resolved in optical/NIR scattered light, after meticulous subtraction of the vastly dominant directstellar light [e.g. 10, and references therein]. A handful of the nearest circumstellar disks have beenspatially resolved in infrared thermal emission using single 4-10 m class telescopes [e.g. 11; 12; 13]
Intereferometric observations have spatially resolved circumstellar disks from near-infrared tomillimeter wavelengths. In millimeter continuum emission we see the cold dust near the disk midplaneand since the disks are usually optically thin at this wavelength, the total dust mass can be estimated[e.g. 14; 15]. Millimeter emission lines of mainly CO trace the disk kinematics on scales of ∼tens ofAU, and reveal keplerian velocity fields [16]. In the mid-infrared (by which here the 10 µm atmosphericwindow is meant) we see the disk surface and can probe the disk structure and dust properties on scales∼1-10 AU. A truly vast amount of near-infrared interferometry has been done in recent years. Theseobservations are most sensitive to emission from the inner edge of the dusty disk, which is usuallylocated at the radius where the temperature equals the silicate dust sublimation temperature of ∼1500 K[e.g. 17; 18; 19; 20; 21; 22; 23; 24; 25; 26]. The inner edge of the dusty disk was proposed to have alocally increased scale height geometry [27, see also figure 2], and indeed models that do include such a”puffed-up” inner rim generally fit the near-infrared visibilities considerably better than models that donot. Inward of the dust sublimation radius, evidence for hot gas is found in the most recent spectrallyresolved near-infrared measurements [e.g. 28; 29].
The observations reviewed here were done with MIDI [30], the 10 µm instrument of the VLTinterferometer [31]. MIDI is a 2-element interferometer, capable of pairwise combination of the lightfrom any of VLT’s four 8.2 m Unit Telescopes and four 1.8 m Auxiliary Telescopes. The spatialresolution of MIDI is ∼5 to several tens of milli-arcseconds. For typical distances to nearby starformation regions (∼150-500 pc), this resolution is well matched to the region where most 10 µmemission is emitted: ∼1-10 AU from the central star. This is a highly interesting region, since hereterrestrial and giant gas planet formation take place, though this process occurs near the mid-plane of thedisk and is hidden from our view at 10 µm. With MIDI we see only the disk surface, and can study thespatial structure of the disk as well as the dust properties in the surface layer.
1 10 100 1000Wavelength [µm]
1e-17
1e-16
1e-15
1e-14
1e-13
1e-12
1e-11
1e-10
λF [W
/m²]
Stellar Contribution
8 9 10 11 12 13Wavelength [µm]
0
0.1
0.2
0.3
0.4
0.5
0.6
0.7
0.8
0.9
1
Ca
libra
ted
Vis
ibili
ty
UT2-UT3: ModelUT2-UT4: ModelUT3-UT4: ModelUT2-UT3: ObservationsUT2-UT4: ObservationsUT3-UT4: Observations
Assumed Disk Position Angle: 93.4 deg
Atm
osp
he
ric
ozo
ne
ba
nd
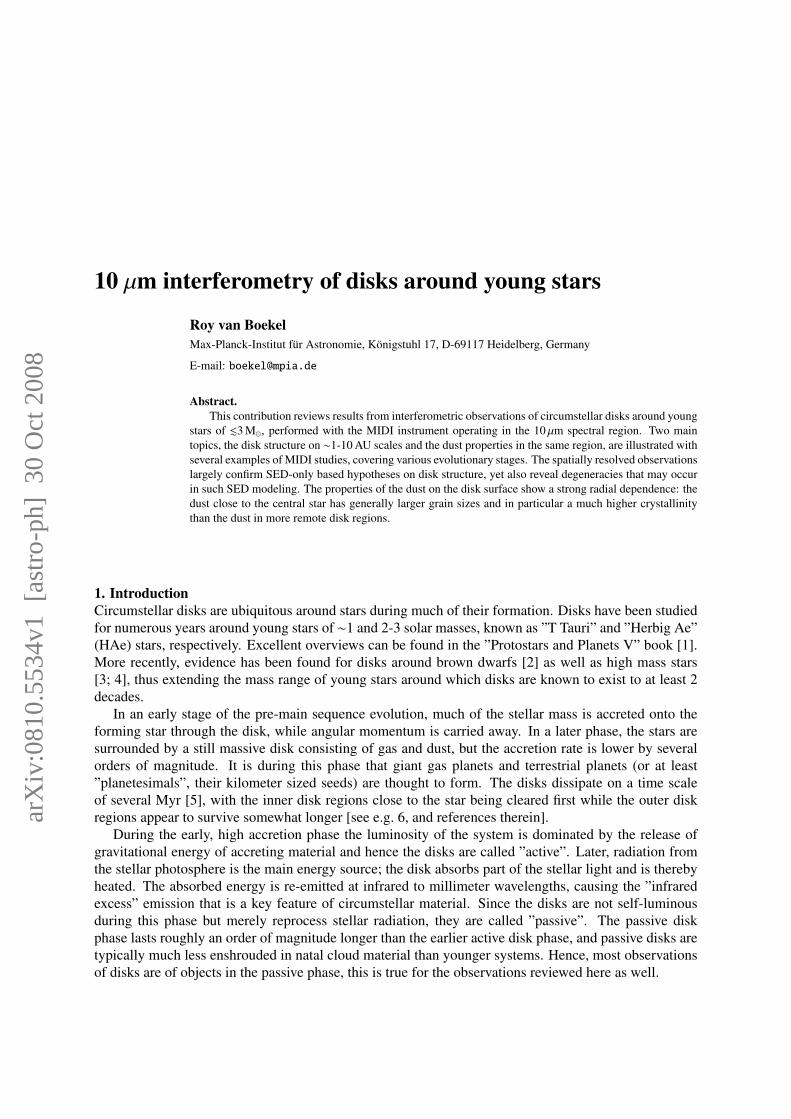
Figure 1. Observations of FU Orionis. Left: the SED from optical to millimeter wavelengths. Right:observed and modeled MIDI visibilities. The level of the observed visibilities indicates that the objectis slightly but significantly resolved. The simple, parameterized disk model used to fit the observationsreproduces the spatial extent of the emission well, but the deviation between the observed and modeledcurves, in particular on the UT3-UT4 baseline, reveal that the actual source geometry is more complexthan accounted for by the model. See section 2.2 and Quanz et al. [32].
1.2. Scope of this reviewDue to speaking time and writing space constraints, the scope of this contribution is necessarily limited.Rather than attempting to give a complete review of all work done with MIDI in the field to date, I willfocus on a number of selected studies that will serve to illustrate the possibilities and limitations of thetechnique, and will give the reader a reasonable impression of what has been achieved. The two maintopics covered, disk structure and dust mineralogy, are each illustrated with a few examples, and preludedby a short general introduction.
2. Disk structure on 1-10 AU scales2.1. IntroductionObserving and modeling the spatial structure and dynamics of circumstellar disks is a key topic in thestudy of star and planet formation. Long before circumstellar disks could be spatially resolved, theobserved infrared excess was interpreted using initially simple and later ever more sophisticated diskmodels. Disk models evolved from simple geometrically thin and optically thick disks, through opticallyand geometrically thick flared disks [33] and refined versions of such models including an optically thindisk atmosphere [34; 27], to 2D and 3D radiative transfer disk models in which the temperature andvertical structure are computed self-consistently [35]. Physical disk models remain an essential tool tointerpret also spatially resolved data.
Since circumstellar disks contain material at a vast range of temperatures, observations at a rangeof wavelengths are required to characterize their emission and study their structure. On sub-AU scaleswe find very hot material that is best seen in the near-infrared, whereas material near the disk mid-plane and in the cold outer disk regions is best studied at millimeter wavelengths. At 10 µm we probeemission from the disk surface at scales of .20 AU. A key study into the structure of this region of thedisk was that of Meeus et al. [36]. While analyzing ISO spectra of a sample of Herbig Ae stars, theyfound that the infrared SEDs of these objects come in two flavors: stars with approximately a power lawspectrum throughout the infrared, and stars that additionally display a relatively cool component peakingaround 60 µm. The objects with the cool component were dubbed ”group I”, the ones lacking the coolcomponent ”group II”. Meeus et al. speculated that stars showing group I SEDs exhibit flared disks,whereas group II objects have ”flat”, or ”self-shadowed” disks (see figure 2), yet their observations had

Self−shadowed disk
Flaring disk
Figure 2. Spectral energy distributions, qualitative disk models and MIDI observations of HAe stars.Left: typical SEDs of a group I and a group II object. Middle: disk geometries proposed to explain thedifference in IR spectral shape. Right: the spatial extent of the 10 µm emission as measured with MIDI.The group II sources appear spatially more compact than the group I sources, confirming the SED-basedhypothesis. See section 2.3 and Leinert et al. [38].
vastly insufficient spatial resolution to directly assess the disk geometry.In this section we will see the results of MIDI studies of an actively accreting disk, a sample of
presumably more evolved passive disks, and an even more mature system that is thought to be in thetransition phase towards a gas-deprived debris disk.
2.2. FU Orionis: an active accretion diskFU Orionis is the prototype FUOR variable. These objects show ”outbursts” during which the systemmay brighten by >5 mag at optical wavelengths over the course of several months, followed by a slowdecline which can last tens of years or even centuries. It is thought that the brightening is caused byan episode of strongly enhanced accretion, induced by a yet not fully understood instability in the innerdisk region. During an outburst, the system luminosity is fully dominated by the release of gravitationalpotential energy of the accreting material. See Hartmann & Kenyon [37] for a detailed overview of theFUOR phenomenon.
Figure 1 shows the SED and MIDI observations of FU Ori as presented by Quanz et al. [32]. Theseobservations spatially resolve the FU Ori disk, for the first time at 10 µm. The authors model the SED andMIDI visibilities simultaneously, and find that a disk model with a broken power law temperature profileprovides the best fit to their observations. Within ∼3 AU from the central star, the temperature followsT ∝R−0.75, whereas at larger radii, T ∝R−0.53. These results indicate that the heating in the inner diskregion is dominated by the release of gravitational energy (which has a radial dependence of dE/dt∝R−3,per unit area), and in the outer region by the absorption of radiation (which follows an R−2 law in theoptically thin disk atmosphere). Thus, in the inner region the disk has a temperature profile typical ofan active accretion disk, whereas further out the temperature equals that of a passive, reprocessing disk.Such behavior can be understood: even in an accretion dominated system, the main heating source of diskmaterial at larger radii will be absorption of radiation emitted in the central region, due to the differentradial dependencies of heating by accretion and absorption. Whether the ”central engine” is a stellarphotosphere like in a ”standard” T Tauri system, or a luminous inner accretion disk as in a FUOR objectin outburst, is irrelevant in this respect.
2.3. HAe stars: the structure of passive disksAs found by Meeus et al. [36], the infrared SEDs of circumstellar disks show a range of spectral shapes,that were proposed to be related to the spatial structure of the disks. Disks with ”red” IR colors were
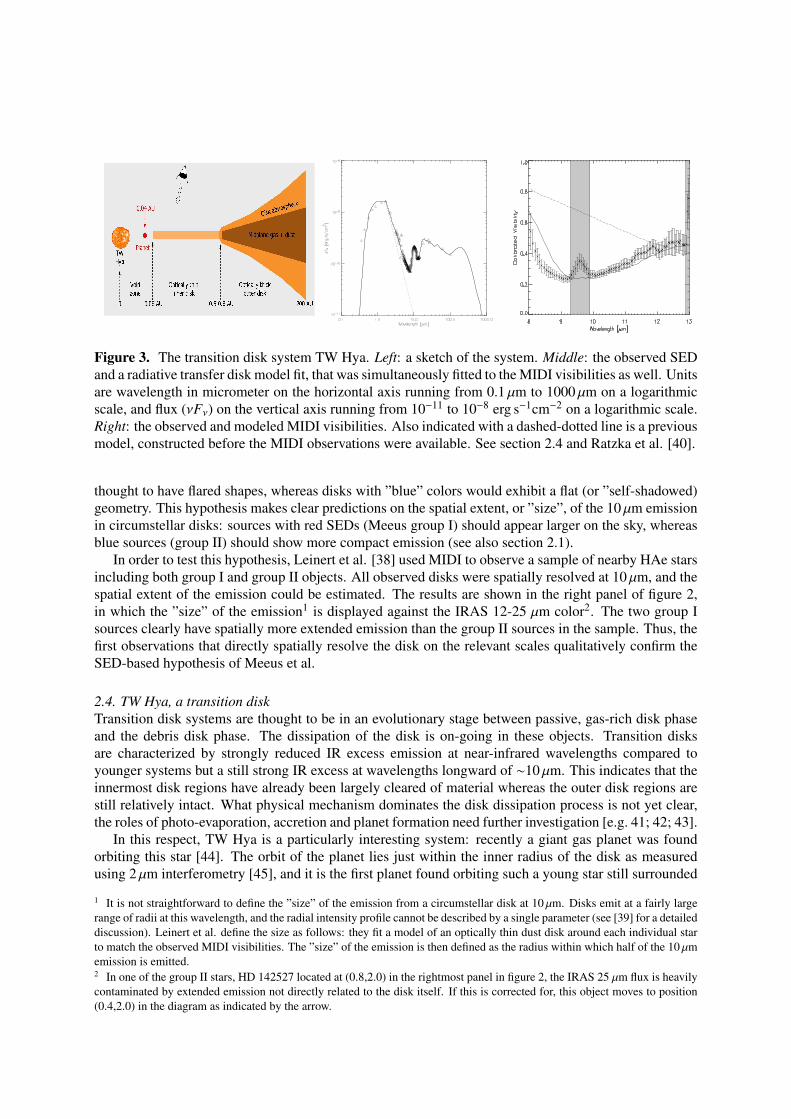
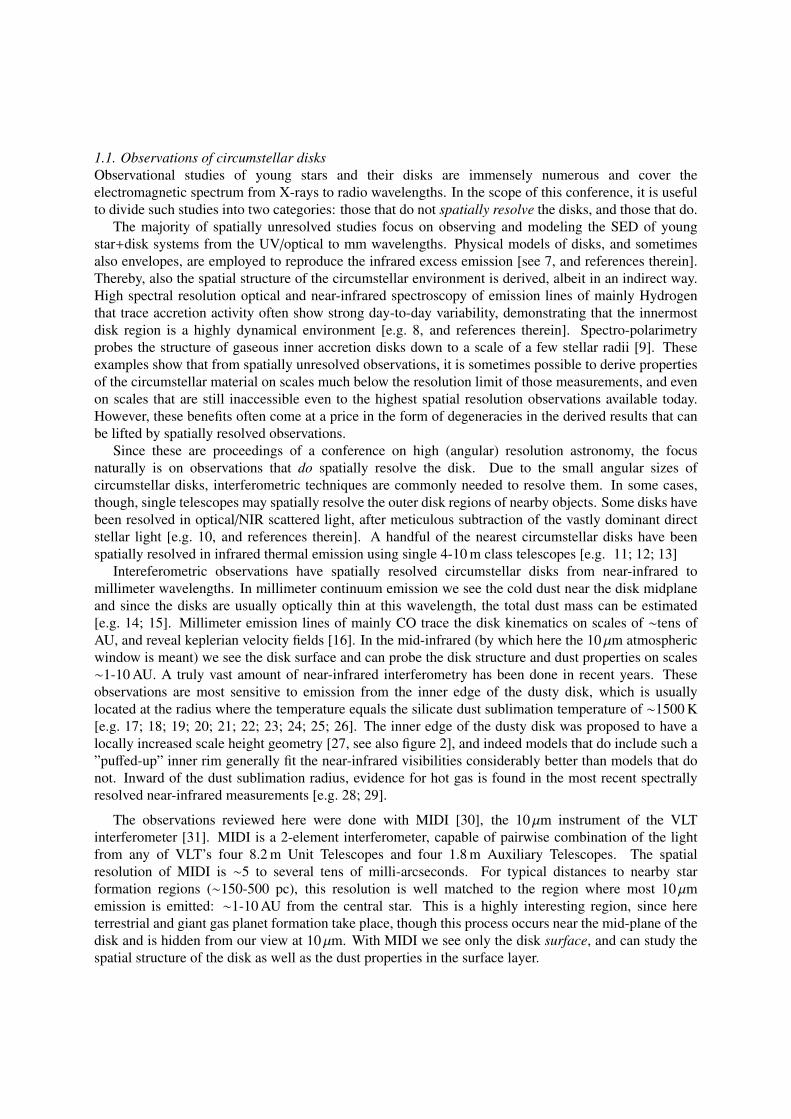
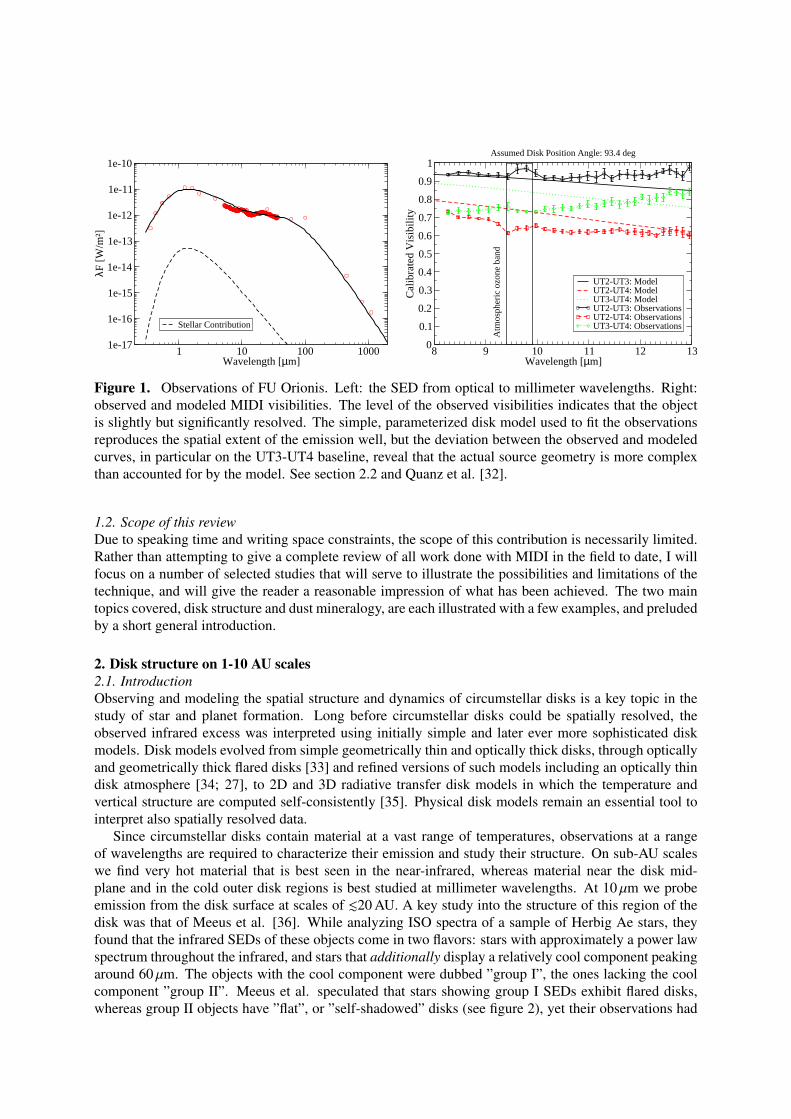
Figure 3. The transition disk system TW Hya. Left: a sketch of the system. Middle: the observed SEDand a radiative transfer disk model fit, that was simultaneously fitted to the MIDI visibilities as well. Unitsare wavelength in micrometer on the horizontal axis running from 0.1 µm to 1000 µm on a logarithmicscale, and flux (νFν) on the vertical axis running from 10−11 to 10−8 erg s−1cm−2 on a logarithmic scale.Right: the observed and modeled MIDI visibilities. Also indicated with a dashed-dotted line is a previousmodel, constructed before the MIDI observations were available. See section 2.4 and Ratzka et al. [40].
thought to have flared shapes, whereas disks with ”blue” colors would exhibit a flat (or ”self-shadowed)geometry. This hypothesis makes clear predictions on the spatial extent, or ”size”, of the 10 µm emissionin circumstellar disks: sources with red SEDs (Meeus group I) should appear larger on the sky, whereasblue sources (group II) should show more compact emission (see also section 2.1).
In order to test this hypothesis, Leinert et al. [38] used MIDI to observe a sample of nearby HAe starsincluding both group I and group II objects. All observed disks were spatially resolved at 10 µm, and thespatial extent of the emission could be estimated. The results are shown in the right panel of figure 2,in which the ”size” of the emission1 is displayed against the IRAS 12-25 µm color2. The two group Isources clearly have spatially more extended emission than the group II sources in the sample. Thus, thefirst observations that directly spatially resolve the disk on the relevant scales qualitatively confirm theSED-based hypothesis of Meeus et al.
2.4. TW Hya, a transition diskTransition disk systems are thought to be in an evolutionary stage between passive, gas-rich disk phaseand the debris disk phase. The dissipation of the disk is on-going in these objects. Transition disksare characterized by strongly reduced IR excess emission at near-infrared wavelengths compared toyounger systems but a still strong IR excess at wavelengths longward of ∼10 µm. This indicates that theinnermost disk regions have already been largely cleared of material whereas the outer disk regions arestill relatively intact. What physical mechanism dominates the disk dissipation process is not yet clear,the roles of photo-evaporation, accretion and planet formation need further investigation [e.g. 41; 42; 43].
In this respect, TW Hya is a particularly interesting system: recently a giant gas planet was foundorbiting this star [44]. The orbit of the planet lies just within the inner radius of the disk as measuredusing 2 µm interferometry [45], and it is the first planet found orbiting such a young star still surrounded
1 It is not straightforward to define the ”size” of the emission from a circumstellar disk at 10 µm. Disks emit at a fairly largerange of radii at this wavelength, and the radial intensity profile cannot be described by a single parameter (see [39] for a detaileddiscussion). Leinert et al. define the size as follows: they fit a model of an optically thin dust disk around each individual starto match the observed MIDI visibilities. The ”size” of the emission is then defined as the radius within which half of the 10 µmemission is emitted.2 In one of the group II stars, HD 142527 located at (0.8,2.0) in the rightmost panel in figure 2, the IRAS 25 µm flux is heavilycontaminated by extended emission not directly related to the disk itself. If this is corrected for, this object moves to position(0.4,2.0) in the diagram as indicated by the arrow.

by a disk. TW Hya is an estimated 10 Myrs old and at a distance of 51 pc it is very nearby, making it anexcellent target for spatially resolved studies [46].
Figure 3 shows a sketch of the system, as well as the SED and MIDI observations discussed here. TheSED shows a small but significant IR excess above the photospheric level in the 3-8 µm range, indicatingsmall amounts of hot material are present close to the star. Calvet et al. [47] model the SED with anoptically thin gas and dust distribution close to the central star, surrounded by an optically thick disk.They put the edge of the optically thick disk around 3-4 AU, where it does not contribute to the 10 µmemission; in their model, the 10 µm emission arises solely in the optically thin inner disk region. Hugheset al. [48] present millimeter interferometry of the continuum emission probing the bulk dust in theTW Hya disk. They find the emission has a central depression, indicating an inner gap of similar size tothat modeled by Calvet et al. [47].
Ratzka et al. [40] observed TW Hya with MIDI. Their observations are shown in the right panelof figure 3. They model the SED and the MIDI observations using a qualitatively identical diskconfiguration to that of Calvet et al., yet the MIDI observations force the transition region between theoptically thin inner disk and the optically thick outer part to be much closer to the central star, at ∼0.6-1.0 AU. In the Ratzka model, the 10 µm emission is dominated by the inner edge of the optically thickouter disk. The 10 µm visibilities predicted by the Calvet and Ratzka models are shown in figure 3 with adashed and solid curve, respectively. While both models reproduce the visibilites measured at 2 µm [45],only the Ratzka model can account for the 10 µm emission. Thus, TW Hya illustrates both the importanceof having multi-wavelength observations, as well as the need for spatially resolved observations to raisedegeneracies that may occur when the disk structure is derived solely from the SED.
While the MIDI observations convincingly place the ”transition region” to the optically thick diskregion at .1 AU, the central ”gap” in the mm emission is clearly larger [48]. These observations probethe bulk of the dust mass, located close to the disk mid-plane. Possibly, most of the dusty material in the1-4 AU region has already been removed (or trapped in larger bodies that are not seen), while there is stillenough dust present to make the region optically thick at 10 µm; this would require only a tiny fractionof the material needed to make the disk optically thick at mm wavelengths. If true, this may argue fora dissipation mechanism ”from within the disk” such as accretion or planet formation, as opposed to amechanism acting ”from outside” (i.e. photo-evaporation).
3. Dust mineralogy on 1-10 AU scales3.1. IntroductionDust is a fundamental constituent of circumstellar disks. Even though it contains only ∼1% of the diskmass, it is the dominant source of opacity in the disk. Therefore, both radiative heating and coolingof disk material, and thereby the disk temperature, are goverened by the dust properties - except veryclose to the central star where it is too hot for dust to survive (T&1500 K). The disk temperature in turngoverns intra-disk chemistry, the location where important species such as H2O and CO freeze out, andthe (vertical) structure of the disk in a balance between gas pressure and the gravitational field [see e.g.7, and references therein]. Moreover, dust grains may collide with other dust grains and stick, initiatinga chain of growth that eventually leads to kilometer sized seeds of terrestrial planets, and of the rockycores of giant gas planets [see 49; 50, and references therein]. Dust, in short, is important stuff. SeeNatta et al. [51] for an overview of dust properties in disks around young stars.
The dust in molecular clouds and circumstellar disks consists mainly of carbon and silicates of variousstoichiometries and lattice structures. Whereas the opacity of carbon does not show much spectralstructure in the infrared, silicate grains have strong resonances that can be used to derive the composition,size, and lattice structure of the dust grains. Dust in the ISM consists of small grains in which themolecular building blocks are randomnly ordered, i.e. the material is amorphous [52]. In circumstellardisks, as well as in solar system comets which are thought to be frozen records of the disk that oncesurrounded the young sun, the dust is distinctly different in two respects. First, the dust grains are oftenlarger than the typical ISM value of ∼0.1 µm [e.g. 53; 54]. Second, a significant fraction of disk and
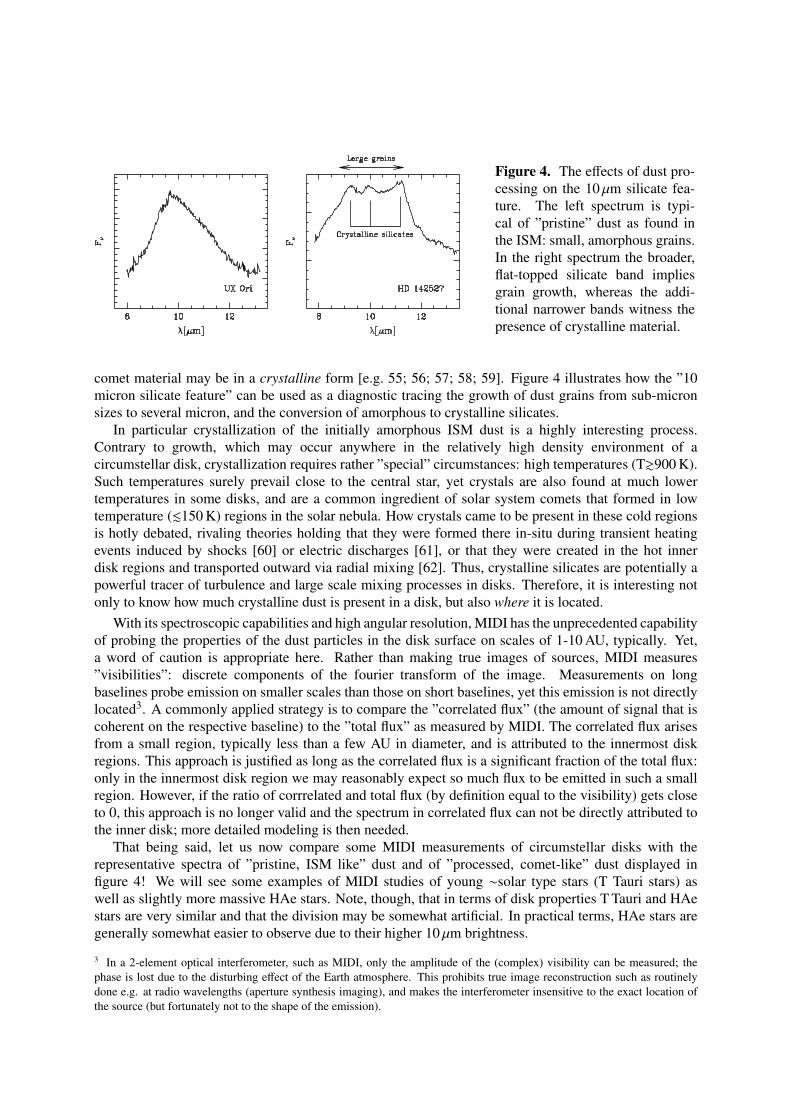
Figure 4. The effects of dust pro-cessing on the 10 µm silicate fea-ture. The left spectrum is typi-cal of ”pristine” dust as found inthe ISM: small, amorphous grains.In the right spectrum the broader,flat-topped silicate band impliesgrain growth, whereas the addi-tional narrower bands witness thepresence of crystalline material.
comet material may be in a crystalline form [e.g. 55; 56; 57; 58; 59]. Figure 4 illustrates how the ”10micron silicate feature” can be used as a diagnostic tracing the growth of dust grains from sub-micronsizes to several micron, and the conversion of amorphous to crystalline silicates.
In particular crystallization of the initially amorphous ISM dust is a highly interesting process.Contrary to growth, which may occur anywhere in the relatively high density environment of acircumstellar disk, crystallization requires rather ”special” circumstances: high temperatures (T&900 K).Such temperatures surely prevail close to the central star, yet crystals are also found at much lowertemperatures in some disks, and are a common ingredient of solar system comets that formed in lowtemperature (.150 K) regions in the solar nebula. How crystals came to be present in these cold regionsis hotly debated, rivaling theories holding that they were formed there in-situ during transient heatingevents induced by shocks [60] or electric discharges [61], or that they were created in the hot innerdisk regions and transported outward via radial mixing [62]. Thus, crystalline silicates are potentially apowerful tracer of turbulence and large scale mixing processes in disks. Therefore, it is interesting notonly to know how much crystalline dust is present in a disk, but also where it is located.
With its spectroscopic capabilities and high angular resolution, MIDI has the unprecedented capabilityof probing the properties of the dust particles in the disk surface on scales of 1-10 AU, typically. Yet,a word of caution is appropriate here. Rather than making true images of sources, MIDI measures”visibilities”: discrete components of the fourier transform of the image. Measurements on longbaselines probe emission on smaller scales than those on short baselines, yet this emission is not directlylocated3. A commonly applied strategy is to compare the ”correlated flux” (the amount of signal that iscoherent on the respective baseline) to the ”total flux” as measured by MIDI. The correlated flux arisesfrom a small region, typically less than a few AU in diameter, and is attributed to the innermost diskregions. This approach is justified as long as the correlated flux is a significant fraction of the total flux:only in the innermost disk region we may reasonably expect so much flux to be emitted in such a smallregion. However, if the ratio of corrrelated and total flux (by definition equal to the visibility) gets closeto 0, this approach is no longer valid and the spectrum in correlated flux can not be directly attributed tothe inner disk; more detailed modeling is then needed.
That being said, let us now compare some MIDI measurements of circumstellar disks with therepresentative spectra of ”pristine, ISM like” dust and of ”processed, comet-like” dust displayed infigure 4! We will see some examples of MIDI studies of young ∼solar type stars (T Tauri stars) aswell as slightly more massive HAe stars. Note, though, that in terms of disk properties T Tauri and HAestars are very similar and that the division may be somewhat artificial. In practical terms, HAe stars aregenerally somewhat easier to observe due to their higher 10 µm brightness.
3 In a 2-element optical interferometer, such as MIDI, only the amplitude of the (complex) visibility can be measured; thephase is lost due to the disturbing effect of the Earth atmosphere. This prohibits true image reconstruction such as routinelydone e.g. at radio wavelengths (aperture synthesis imaging), and makes the interferometer insensitive to the exact location ofthe source (but fortunately not to the shape of the emission).
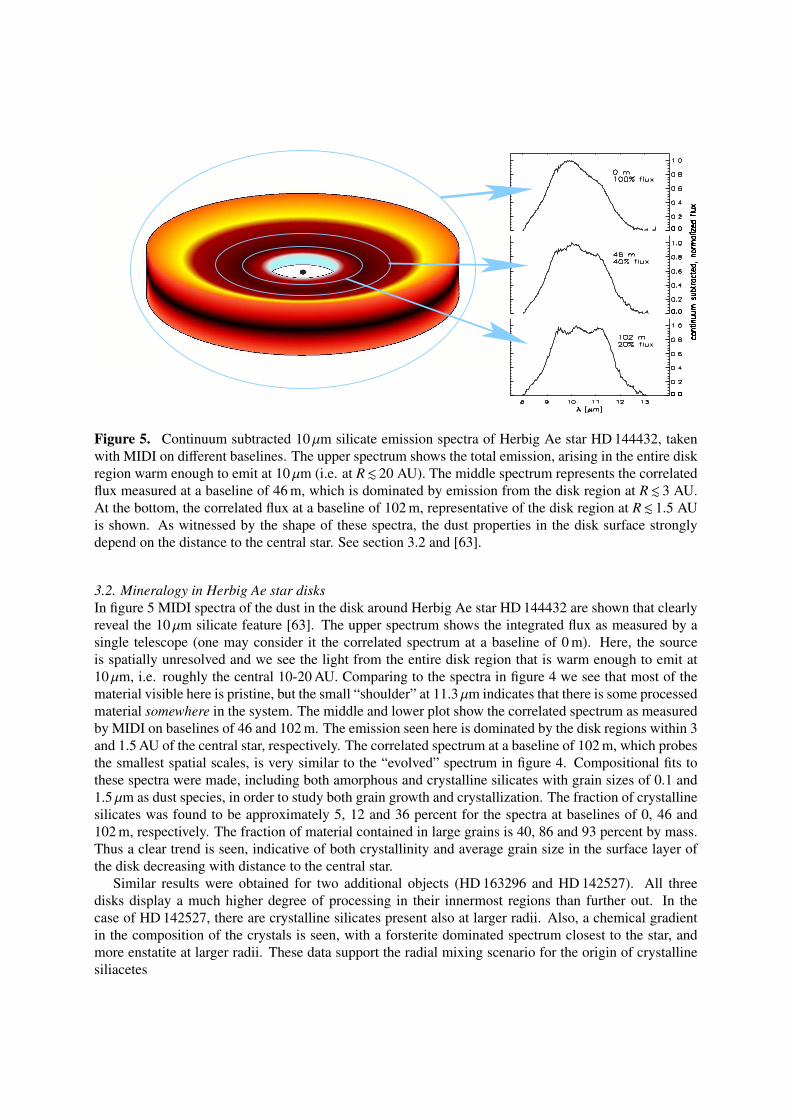
Figure 5. Continuum subtracted 10 µm silicate emission spectra of Herbig Ae star HD 144432, takenwith MIDI on different baselines. The upper spectrum shows the total emission, arising in the entire diskregion warm enough to emit at 10 µm (i.e. at R. 20 AU). The middle spectrum represents the correlatedflux measured at a baseline of 46 m, which is dominated by emission from the disk region at R. 3 AU.At the bottom, the correlated flux at a baseline of 102 m, representative of the disk region at R. 1.5 AUis shown. As witnessed by the shape of these spectra, the dust properties in the disk surface stronglydepend on the distance to the central star. See section 3.2 and [63].
3.2. Mineralogy in Herbig Ae star disksIn figure 5 MIDI spectra of the dust in the disk around Herbig Ae star HD 144432 are shown that clearlyreveal the 10 µm silicate feature [63]. The upper spectrum shows the integrated flux as measured by asingle telescope (one may consider it the correlated spectrum at a baseline of 0 m). Here, the sourceis spatially unresolved and we see the light from the entire disk region that is warm enough to emit at10 µm, i.e. roughly the central 10-20 AU. Comparing to the spectra in figure 4 we see that most of thematerial visible here is pristine, but the small “shoulder” at 11.3 µm indicates that there is some processedmaterial somewhere in the system. The middle and lower plot show the correlated spectrum as measuredby MIDI on baselines of 46 and 102 m. The emission seen here is dominated by the disk regions within 3and 1.5 AU of the central star, respectively. The correlated spectrum at a baseline of 102 m, which probesthe smallest spatial scales, is very similar to the “evolved” spectrum in figure 4. Compositional fits tothese spectra were made, including both amorphous and crystalline silicates with grain sizes of 0.1 and1.5 µm as dust species, in order to study both grain growth and crystallization. The fraction of crystallinesilicates was found to be approximately 5, 12 and 36 percent for the spectra at baselines of 0, 46 and102 m, respectively. The fraction of material contained in large grains is 40, 86 and 93 percent by mass.Thus a clear trend is seen, indicative of both crystallinity and average grain size in the surface layer ofthe disk decreasing with distance to the central star.
Similar results were obtained for two additional objects (HD 163296 and HD 142527). All threedisks display a much higher degree of processing in their innermost regions than further out. In thecase of HD 142527, there are crystalline silicates present also at larger radii. Also, a chemical gradientin the composition of the crystals is seen, with a forsterite dominated spectrum closest to the star, andmore enstatite at larger radii. These data support the radial mixing scenario for the origin of crystallinesiliacetes
Small grains
Crystals
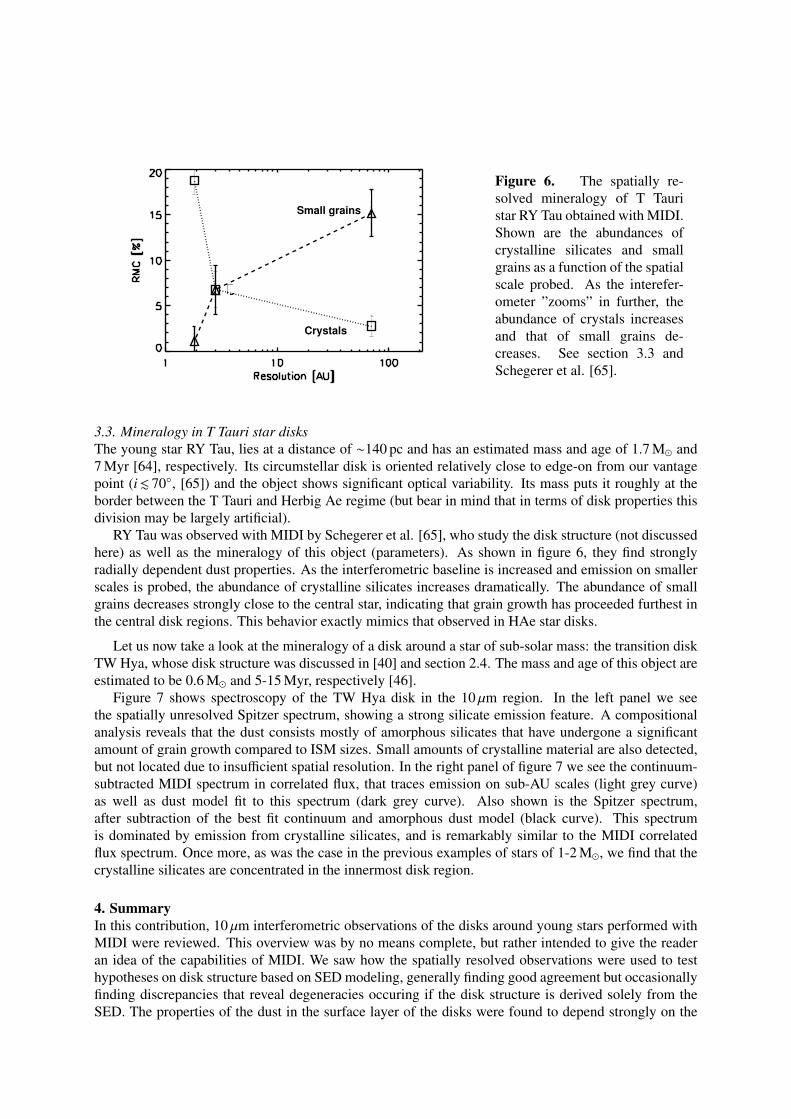
Figure 6. The spatially re-solved mineralogy of T Tauristar RY Tau obtained with MIDI.Shown are the abundances ofcrystalline silicates and smallgrains as a function of the spatialscale probed. As the interefer-ometer ”zooms” in further, theabundance of crystals increasesand that of small grains de-creases. See section 3.3 andSchegerer et al. [65].
3.3. Mineralogy in T Tauri star disksThe young star RY Tau, lies at a distance of ∼140 pc and has an estimated mass and age of 1.7 M� and7 Myr [64], respectively. Its circumstellar disk is oriented relatively close to edge-on from our vantagepoint (i. 70◦, [65]) and the object shows significant optical variability. Its mass puts it roughly at theborder between the T Tauri and Herbig Ae regime (but bear in mind that in terms of disk properties thisdivision may be largely artificial).
RY Tau was observed with MIDI by Schegerer et al. [65], who study the disk structure (not discussedhere) as well as the mineralogy of this object (parameters). As shown in figure 6, they find stronglyradially dependent dust properties. As the interferometric baseline is increased and emission on smallerscales is probed, the abundance of crystalline silicates increases dramatically. The abundance of smallgrains decreases strongly close to the central star, indicating that grain growth has proceeded furthest inthe central disk regions. This behavior exactly mimics that observed in HAe star disks.
Let us now take a look at the mineralogy of a disk around a star of sub-solar mass: the transition diskTW Hya, whose disk structure was discussed in [40] and section 2.4. The mass and age of this object areestimated to be 0.6 M� and 5-15 Myr, respectively [46].
Figure 7 shows spectroscopy of the TW Hya disk in the 10 µm region. In the left panel we seethe spatially unresolved Spitzer spectrum, showing a strong silicate emission feature. A compositionalanalysis reveals that the dust consists mostly of amorphous silicates that have undergone a significantamount of grain growth compared to ISM sizes. Small amounts of crystalline material are also detected,but not located due to insufficient spatial resolution. In the right panel of figure 7 we see the continuum-subtracted MIDI spectrum in correlated flux, that traces emission on sub-AU scales (light grey curve)as well as dust model fit to this spectrum (dark grey curve). Also shown is the Spitzer spectrum,after subtraction of the best fit continuum and amorphous dust model (black curve). This spectrumis dominated by emission from crystalline silicates, and is remarkably similar to the MIDI correlatedflux spectrum. Once more, as was the case in the previous examples of stars of 1-2 M�, we find that thecrystalline silicates are concentrated in the innermost disk region.
4. SummaryIn this contribution, 10 µm interferometric observations of the disks around young stars performed withMIDI were reviewed. This overview was by no means complete, but rather intended to give the readeran idea of the capabilities of MIDI. We saw how the spatially resolved observations were used to testhypotheses on disk structure based on SED modeling, generally finding good agreement but occasionallyfinding discrepancies that reveal degeneracies occuring if the disk structure is derived solely from theSED. The properties of the dust in the surface layer of the disks were found to depend strongly on the
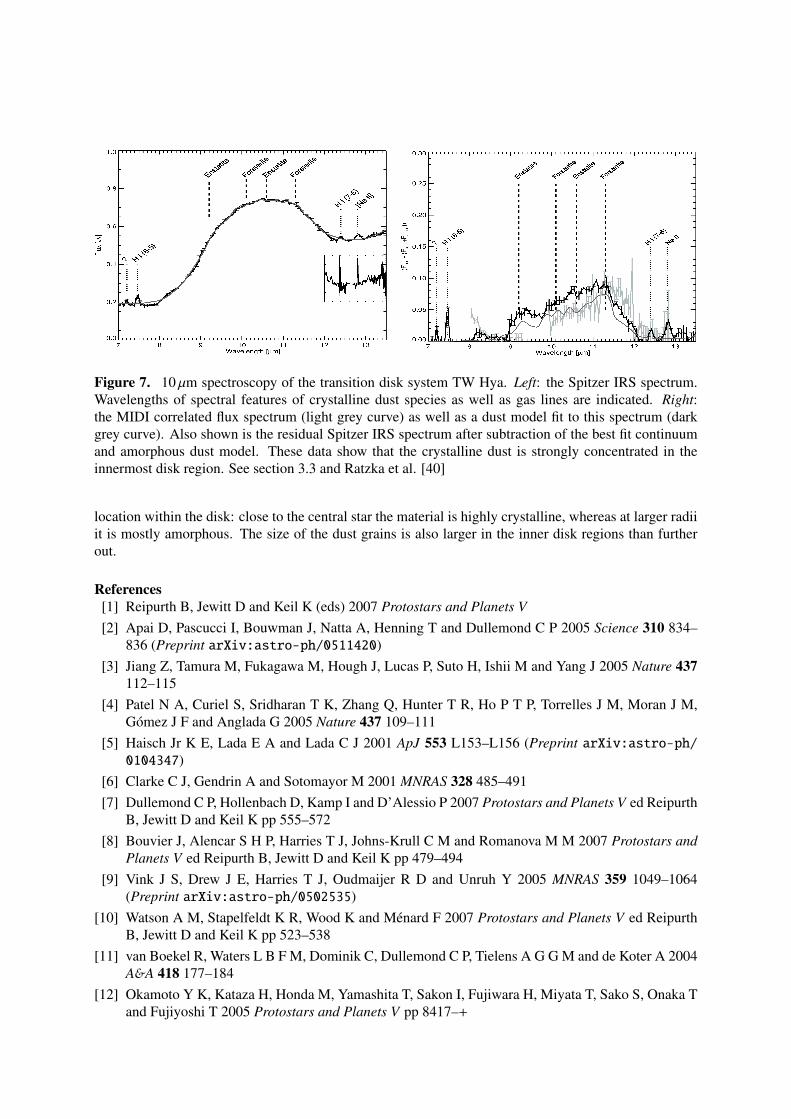
Figure 7. 10 µm spectroscopy of the transition disk system TW Hya. Left: the Spitzer IRS spectrum.Wavelengths of spectral features of crystalline dust species as well as gas lines are indicated. Right:the MIDI correlated flux spectrum (light grey curve) as well as a dust model fit to this spectrum (darkgrey curve). Also shown is the residual Spitzer IRS spectrum after subtraction of the best fit continuumand amorphous dust model. These data show that the crystalline dust is strongly concentrated in theinnermost disk region. See section 3.3 and Ratzka et al. [40]
location within the disk: close to the central star the material is highly crystalline, whereas at larger radiiit is mostly amorphous. The size of the dust grains is also larger in the inner disk regions than furtherout.
References[1] Reipurth B, Jewitt D and Keil K (eds) 2007 Protostars and Planets V[2] Apai D, Pascucci I, Bouwman J, Natta A, Henning T and Dullemond C P 2005 Science 310 834–
836 (Preprint arXiv:astro-ph/0511420)[3] Jiang Z, Tamura M, Fukagawa M, Hough J, Lucas P, Suto H, Ishii M and Yang J 2005 Nature 437
112–115[4] Patel N A, Curiel S, Sridharan T K, Zhang Q, Hunter T R, Ho P T P, Torrelles J M, Moran J M,
Gomez J F and Anglada G 2005 Nature 437 109–111[5] Haisch Jr K E, Lada E A and Lada C J 2001 ApJ 553 L153–L156 (Preprint arXiv:astro-ph/0104347)
[6] Clarke C J, Gendrin A and Sotomayor M 2001 MNRAS 328 485–491[7] Dullemond C P, Hollenbach D, Kamp I and D’Alessio P 2007 Protostars and Planets V ed Reipurth
B, Jewitt D and Keil K pp 555–572[8] Bouvier J, Alencar S H P, Harries T J, Johns-Krull C M and Romanova M M 2007 Protostars and
Planets V ed Reipurth B, Jewitt D and Keil K pp 479–494[9] Vink J S, Drew J E, Harries T J, Oudmaijer R D and Unruh Y 2005 MNRAS 359 1049–1064
(Preprint arXiv:astro-ph/0502535)[10] Watson A M, Stapelfeldt K R, Wood K and Menard F 2007 Protostars and Planets V ed Reipurth
B, Jewitt D and Keil K pp 523–538[11] van Boekel R, Waters L B F M, Dominik C, Dullemond C P, Tielens A G G M and de Koter A 2004
A&A 418 177–184[12] Okamoto Y K, Kataza H, Honda M, Yamashita T, Sakon I, Fujiwara H, Miyata T, Sako S, Onaka T
and Fujiyoshi T 2005 Protostars and Planets V pp 8417–+
[13] Doucet C, Habart E, Pantin E, Dullemond C, Lagage P O, Pinte C, Duchene G and Menard F 2007A&A 470 625–631
[14] Henning T, Launhardt R, Steinacker J and Thamm E 1994 A&A 291 546–556[15] Natta A, Testi L, Neri R, Shepherd D S and Wilner D J 2004 A&A 416 179–186 (Preprint
arXiv:astro-ph/0311624)[16] Mannings V and Sargent A I 1997 ApJ 490 792–+
[17] Millan-Gabet R, Schloerb F P and Traub W A 2001 ApJ 546 358–381 (Preprint arXiv:astro-ph/0008072)
[18] Millan-Gabet R, Monnier J D, Berger J P, Traub W A, Schloerb F P, Pedretti E, Benisty M, CarletonN P, Haguenauer P, Kern P, Labeye P, Lacasse M G, Malbet F, Perraut K, Pearlman M and ThureauN 2006 ApJ 645 L77–L80 (Preprint arXiv:astro-ph/0606059)
[19] Akeson R L, Walker C H, Wood K, Eisner J A, Scire E, Penprase B, Ciardi D R, van Belle G T,Whitney B and Bjorkman J E 2005 ApJ 622 440–450 (Preprint arXiv:astro-ph/0412438)
[20] Akeson R L, Boden A F, Monnier J D, Millan-Gabet R, Beichman C, Beletic J, Calvet N, HartmannL, Hillenbrand L, Koresko C, Sargent A and Tannirkulam A 2005 ApJ 635 1173–1181 (PreprintarXiv:astro-ph/0508561)
[21] Monnier J D and Millan-Gabet R 2002 ApJ 579 694–698 (Preprint arXiv:astro-ph/0207292)[22] Monnier J D, Millan-Gabet R, Billmeier R, Akeson R L, Wallace D, Berger J P, Calvet N,
D’Alessio P, Danchi W C, Hartmann L, Hillenbrand L A, Kuchner M, Rajagopal J, Traub W A,Tuthill P G, Boden A, Booth A, Colavita M, Gathright J, Hrynevych M, Le Mignant D, LigonR, Neyman C, Swain M, Thompson R, Vasisht G, Wizinowich P, Beichman C, Beletic J, Creech-Eakman M, Koresko C, Sargent A, Shao M and van Belle G 2005 ApJ 624 832–840 (PreprintarXiv:astro-ph/0502252)
[23] Monnier J D, Berger J P, Millan-Gabet R, Traub W A, Schloerb F P, Pedretti E, Benisty M, CarletonN P, Haguenauer P, Kern P, Labeye P, Lacasse M G, Malbet F, Perraut K, Pearlman M and Zhao M2006 ApJ 647 444–463 (Preprint arXiv:astro-ph/0606052)
[24] Eisner J A, Lane B F, Akeson R L, Hillenbrand L A and Sargent A I 2003 ApJ 588 360–372(Preprint arXiv:astro-ph/0301269)
[25] Eisner J A, Hillenbrand L A, White R J, Akeson R L and Sargent A I 2005 ApJ 623 952–966(Preprint arXiv:astro-ph/0501308)
[26] Isella A, Testi L and Natta A 2006 A&A 451 951–959 (Preprint arXiv:astro-ph/0601438)[27] Dullemond C P, Dominik C and Natta A 2001 ApJ 560 957–969 (Preprint arXiv:astro-ph/
0106470)[28] Eisner J A, Chiang E I, Lane B F and Akeson R L 2007 ApJ 657 347–358 (Preprint arXiv:
astro-ph/0611447)[29] Eisner J A 2007 Nature 447 562–564 (Preprint arXiv:0706.1239)[30] Leinert C, Graser U, Waters L B F M, Perrin G S, Jaffe W, Lopez B, Przygodda F, Chesneau
O, Schuller P A, Glazenborg-Kluttig A W, Laun W, Ligori S, Meisner J A, Wagner K, Bakker E J,Cotton B, de Jong J, Mathar R, Neumann U and Storz C 2003 Interferometry for Optical AstronomyII. Edited by Wesley A. Traub . Proceedings of the SPIE, Volume 4838, pp. 893-904 (2003). ed TraubW A pp 893–904
[31] Glindemann A, Abuter R, Carbognani F, Delplancke F, Derie F, Gennai A, Gitton P B, KervellaP, Koehler B, Leveque S A, Menardi S, Michel A, Paresce F, Duc T P, Richichi A, Schoeller M,Tarenghi M, Wallander A and Wilhelm R 2000 Proc. SPIE Vol. 4006, p. 2-12, Interferometry inOptical Astronomy, Pierre J. Lena; Andreas Quirrenbach; Eds. (Presented at the Society of Photo-Optical Instrumentation Engineers (SPIE) Conference vol 4006) ed Lena P J and Quirrenbach App 2–12
[32] Quanz S P, Henning T, Bouwman J, Ratzka T and Leinert C 2006 ApJ 648 472–483 (PreprintarXiv:astro-ph/0605382)
[33] Kenyon S J and Hartmann L 1987 ApJ 323 714–733[34] Chiang E I and Goldreich P 1997 ApJ 490 368–+ (Preprint arXiv:astro-ph/9706042)[35] Dullemond C P and Dominik C 2004 A&A 417 159–168 (Preprint arXiv:astro-ph/0401495)[36] Meeus G, Waters L B F M, Bouwman J, van den Ancker M E, Waelkens C and Malfait K 2001
A&A 365 476–490 (Preprint arXiv:astro-ph/0012295)[37] Hartmann L and Kenyon S J 1996 ARA&A 34 207–240[38] Leinert C, van Boekel R, Waters L B F M, Chesneau O, Malbet F, Kohler R, Jaffe W, Ratzka T,
Dutrey A, Preibisch T, Graser U, Bakker E, Chagnon G, Cotton W D, Dominik C, Dullemond C P,Glazenborg-Kluttig A W, Glindemann A, Henning T, Hofmann K H, de Jong J, Lenzen R, LigoriS, Lopez B, Meisner J, Morel S, Paresce F, Pel J W, Percheron I, Perrin G, Przygodda F, RichichiA, Scholler M, Schuller P, Stecklum B, van den Ancker M E, von der Luhe O and Weigelt G 2004A&A 423 537–548
[39] van Boekel R, Dullemond C P and Dominik C 2005 A&A 441 563–571 (Preprint arXiv:astro-ph/0506759)
[40] Ratzka T, Leinert C, Henning T, Bouwman J, Dullemond C P and Jaffe W 2007 A&A 471 173–185(Preprint arXiv:0707.0193)
[41] Hartmann L, Megeath S T, Allen L, Luhman K, Calvet N, D’Alessio P, Franco-Hernandez R andFazio G 2005 ApJ 629 881–896 (Preprint arXiv:astro-ph/0505323)
[42] Espaillat C, Calvet N, D’Alessio P, Hernandez J, Qi C, Hartmann L, Furlan E and Watson D M2007 ApJ 670 L135–L138 (Preprint arXiv:0710.2892)
[43] Sicilia-Aguilar A, Hartmann L W, Furesz G, Henning T, Dullemond C and Brandner W 2006 AJ132 2135–2155 (Preprint arXiv:astro-ph/0607534)
[44] Setiawan J, Henning T, Launhardt R, Muller A, Weise P and Kurster M 2008 Nature 451 38–41[45] Eisner J A, Chiang E I and Hillenbrand L A 2006 ApJ 637 L133–L136 (Preprint arXiv:
astro-ph/0601034)[46] Webb R A, Zuckerman B, Platais I, Patience J, White R J, Schwartz M J and McCarthy C 1999 ApJ
512 L63–L67 (Preprint arXiv:astro-ph/9812189)[47] Calvet N, D’Alessio P, Hartmann L, Wilner D, Walsh A and Sitko M 2002 ApJ 568 1008–1016
(Preprint arXiv:astro-ph/0201425)[48] Hughes A M, Wilner D J, Calvet N, D’Alessio P, Claussen M J and Hogerheijde M R 2007 ApJ
664 536–542 (Preprint arXiv:0704.2422)[49] Dominik C, Blum J, Cuzzi J N and Wurm G 2007 Protostars and Planets V ed Reipurth B, Jewitt
D and Keil K pp 783–800[50] Johansen A, Oishi J S, Low M M M, Klahr H, Henning T and Youdin A 2007 Nature 448 1022–
1025[51] Natta A, Testi L, Calvet N, Henning T, Waters R and Wilner D 2007 Protostars and Planets V ed
Reipurth B, Jewitt D and Keil K pp 767–781[52] Kemper F, Vriend W J and Tielens A G G M 2004 ApJ 609 826–837 (Preprint arXiv:astro-ph/
0403609)[53] van Boekel R, Waters L B F M, Dominik C, Bouwman J, de Koter A, Dullemond C P and Paresce
F 2003 A&A 400 L21–L24[54] Sicilia-Aguilar A, Hartmann L W, Watson D, Bohac C, Henning T and Bouwman J 2007 ApJ 659
1637–1660 (Preprint arXiv:astro-ph/0701321)
[55] Waelkens C, Malfait K and Waters L B F M 1997 Earth Moon and Planets 79 265–274[56] Hanner M S, Gehrz R D, Harker D E, Hayward T L, Lynch D K, Mason C C, Russell R W, Williams
D M, Wooden D H and Woodward C E 1997 Earth Moon and Planets 79 247–264[57] Bouwman J, Meeus G, de Koter A, Hony S, Dominik C and Waters L B F M 2001 A&A 375
950–962[58] van Boekel R, Min M, Waters L B F M, de Koter A, Dominik C, van den Ancker M E and Bouwman
J 2005 A&A 437 189–208 (Preprint arXiv:astro-ph/0503507)[59] Kessler-Silacci J E, Hillenbrand L A, Blake G A and Meyer M R 2005 ApJ 622 404–429 (Preprint
arXiv:astro-ph/0412033)[60] Harker D E and Desch S J 2002 ApJ 565 L109–L112 (Preprint arXiv:astro-ph/0112494)[61] Pilipp W, Hartquist T W, Morfill G E and Levy E H 1998 A&A 331 121–146[62] Gail H P 2004 A&A 413 571–591[63] van Boekel R, Min M, Leinert C, Waters L B F M, Richichi A, Chesneau O, Dominik C, Jaffe
W, Dutrey A, Graser U, Henning T, de Jong J, Kohler R, de Koter A, Lopez B, Malbet F, MorelS, Paresce F, Perrin G, Preibisch T, Przygodda F, Scholler M and Wittkowski M 2004 Nature 432479–482
[64] Siess L, Forestini M and Bertout C 1999 A&A 342 480–491[65] Schegerer A A, Wolf S, Ratzka T and Leinert C 2008 A&A 478 779–793 (Preprint arXiv:
0712.0696)