10. indirect assessments of the child in the …nces.ed.gov/pubs2007/2007084_c10.pdf · 10....
TRANSCRIPT

10-1
10. INDIRECT ASSESSMENTS OF THE CHILD IN THE PARENT INTERVIEW
The Early Childhood Longitudinal Study, Birth Cohort (ECLS-B) 2-year parent interview also included three sets of questions that obtained indirect assessments of the child’s behavior from the parent respondent: a set of questions about the age at which the child reached certain developmental milestones, a set of questions about the child’s self-regulation ability and sensory integration, and a set of questions about the child’s vocabulary and language ability. The following sections discuss the rationale for these sets of questions, summarize the items, and present descriptive statistics for key demographic groups.
10.1 Developmental Milestones
The first indirect assessment was a set of six questions that asked the parent respondent about the age at which the child first reached developmental milestones common to the 2-year age range. A developmental milestone is a set of functional skills, or age-specific abilities, that most children can do by a certain age, for example, taking first steps on own, saying first word. Although each developmental milestone has an age level at which it is typically reached, the actual age at which a normally developing child reaches that milestone can vary quite a bit. Developmental milestones serve as reference points or benchmarks that parents, health care professionals, psychologists, and teachers can use to help check how a child is developing.
It is commonly presumed that early attainment of milestones is associated with positive
outcomes and that later achievement of developmental milestones is associated with poorer developmental status and child outcomes in later years. However, until the ECLS-B, no national norms had been available to support the association of early milestone achievement with subsequent positive outcomes. Nor is there any accessible empirical evidence to suggest that early or timely achievement of developmental milestones has any bearing on future developmental status, although ample evidence supports the association between late achievement of milestones (e.g., as is common in children with Down syndrome) and poorer developmental status in later years.
To identify key developmental milestones for the 23- to 25-month age range, the Minnesota
Child Development Inventory (MN-CDI) (Ireton 1997) was reviewed as a source for items, as it had been

10-2
for the 9-month data collection. For further information about the five developmental milestone items in the 9-month data collection, please refer to the ECLS-B Methodology Report for the Nine-Month Data Collection (2001–02), Volume 1: Psychometric Characteristics (NCES 2005–100) (Andreassen and Fletcher 2005). For obvious reasons, the milestones selected for 9 months are not appropriate at 2 years. Therefore, the age ranges in the MN-CDI manual were reviewed and key milestones that were age appropriate, easily understood, and salient to parents were selected for inclusion in the ECLS-B at 2 years. It was important that the milestones selected be particularly salient for parents who would be formulating their answers retrospectively. In addition, it was important that the response options be straightforward and not lead to embarrassment if the child had not yet reached certain milestones.
The results of field testing and supplementary review of the MN-CDI for redesign of the
parent interview for 2 years determined that the following items most successfully obtained information about the age at which the child first performed the milestone:
P2WLKSTR: How old was child in months when he/she started walking up stairs
alone?
P2FRSTWD: How old was child in months when he/she started saying words?
P2TRNPGS: How old was child in months when he/she started turning the pages of a picture book, one at a time?
P2DRKNB: How old was child in months when he/she started opening a door by turning the knob and pulling?
P2PLYOH: How old was child in months when he/she started playing with other children, doing things with them (e.g., cars, dolls, building)?
P2PLYOB: How old was child in months when he/she starting using an object as if it were something else (e.g., using a block for a phone, using a cardboard box for a car or a doll bed, using a napkin for a doll blanket)?
Table 10-1 presents the percentages of sample children who had reached each milestone at the time of the child assessment, as well as the percentages who had not yet reached each milestone. To obtain these weighted percentages, all cases with missing data were omitted. This information is presented in this table to highlight that not all children in the ECLS-B had reached all the milestones by the time of the home visit. Information about the ages at which children passed each milestone is presented in table 10-2. No comparable national norms are available for these milestones.

10-3
Table 10-1. Weighted percentages of children who have reached and have not yet reached developmental milestones by the time of assessment in the 2-year data collection, with item names and descriptions, 2-year data collection: 2003–04
Reached milestone Not yet reached
milestone Developmentalmilestone
Description of milestone NumberWeighted
percent Number Weighted
percentP2WLKSTR First started walking upstairs alone 9,000 93.89 800 6.11P2FRSTWD Started saying first words 9,650 99.46 100 0.54P2TRNPGS Started turning pages of book one at a time 9,250 96.02 450 3.98P2DRKNB Started opening door by turning knob 7,550 80.22 2,250 19.78P2PLYOH Started playing with other children 9,400 96.83 400 3.17P2PLYOB Started using as object as if it were
something else 9,100 94.31 650 5.69NOTE: The parent weight, W2R0, was used to obtain these statistics. Cell counts are unweighted to show the distribution in the ECLS-B 2-year data collection. Detail may not sum to total due to rounding. Sample sizes have been rounded to the nearest 50. SOURCE: U.S. Department of Education, National Center for Education Statistics, Early Childhood Longitudinal Study, Birth Cohort (ECLS-B), 2-year data collection, 2003–04.
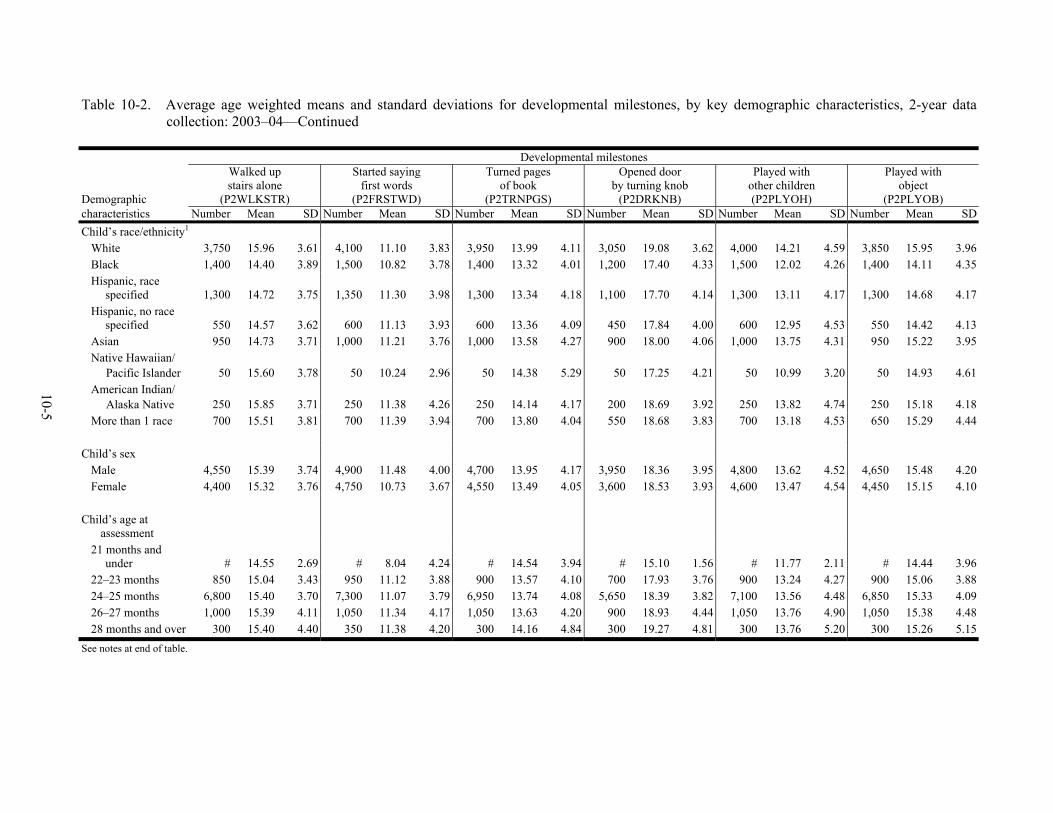
Table 10-2 presents the average ages (weighted means and standard deviations) at which children reached each developmental milestone by the time of the home visit for the total sample and by demographic grouping variables. To obtain these statistics, all cases with missing data were omitted. The weighted means suggest that, for example, girls tend to start walking up stairs at slightly younger ages than boys, at 15.32 months of age for girls and 15.39 months of age for boys. Black children start to play with other children at an average of 12.02 months of age, whereas White children start to play with other children at an average of 14.20 months of age.

10-4
Table 10-2. Average age weighted means and standard deviations for developmental milestones, by key demographic characteristics, 2-year data collection: 2003–04
Developmental milestones
Demographic
Walked up stairs alone
(P2WLKSTR)
Started saying first words
(P2FRSTWD)
Turned pages of book
(P2TRNPGS)
Opened door by turning knob
(P2DRKNB)
Played with other children (P2PLYOH)
Played with object
(P2PLYOB) characteristics Number Mean SD Number Mean SD Number Mean SD Number Mean SD Number Mean SD Number Mean SD Total score 9,000 15.36 3.75 9,650 11.11 3.86 9,250 13.72 4.12 7,550 18.44 3.94 9,400 13.55 4.53 9,100 15.30 4.15
Mother’s
race/ethnicity1 White 4,100 15.95 3.62 4,500 11.09 3.81 4,350 14.01 4.10 3,400 19.07 3.61 4,350 14.14 4.55 4,250 15.92 3.97Black 1,400 14.29 3.84 1,550 10.82 3.77 1,450 13.30 4.02 1,200 17.35 4.33 1,500 11.97 4.20 1,450 14.09 4.35Hispanic, race
specified 1,550 14.57 3.72 1,650 11.26 4.00 1,600 13.28 4.16 1,300 17.64 4.10 1,600 13.07 4.36 1,550 14.56 4.21Hispanic, no race
specified 50 13.77 2.88 50 12.30 4.95 50 12.77 4.08 50 16.65 4.22 50 12.33 3.95 50 13.02 2.38Asian 1,150 14.86 3.74 1,200 11.43 3.81 1,150 13.70 4.23 1,050 18.11 4.00 1,150 14.05 4.35 1,150 15.36 3.96Native Hawaiian/ Pacific Islander 50 15.48 3.87 50 10.82 3.04 50 12.79 4.18 50 18.07 3.91 50 13.29 4.89 50 14.76 4.16American Indian/ Alaska Native 350 15.65 3.52 350 11.12 3.89 350 13.77 3.97 250 18.93 3.80 350 13.37 4.67 350 15.26 4.33More than 1 race 250 16.06 3.81 250 11.55 4.09 250 13.87 4.21 200 19.10 4.22 250 12.73 5.24 250 15.24 4.55
Poverty status
Below poverty threshold 2,000 14.54 3.70 2,150 10.89 4.10 2,000 13.71 4.20 1,650 17.92 4.28 2,100 12.78 4.49 2,050 14.50 4.28
At or above poverty threshold 7,000 15.58 3.73 7,500 11.18 3.79 7,250 13.73 4.10 5,900 18.58 3.83 7,300 13.76 4.52 7,100 15.53 4.09
See notes at end of table.
10-5
Table 10-2. Average age weighted means and standard deviations for developmental milestones, by key demographic characteristics, 2-year data collection: 2003–04—Continued
Developmental milestones
Demographic
Walked up stairs alone
(P2WLKSTR)
Started saying first words
(P2FRSTWD)
Turned pages of book
(P2TRNPGS)
Opened door by turning knob
(P2DRKNB)
Played with other children (P2PLYOH)
Played with object
(P2PLYOB) characteristics Number Mean SD Number Mean SD Number Mean SD Number Mean SD Number Mean SD Number Mean SDChild’s race/ethnicity1
White 3,750 15.96 3.61 4,100 11.10 3.83 3,950 13.99 4.11 3,050 19.08 3.62 4,000 14.21 4.59 3,850 15.95 3.96Black 1,400 14.40 3.89 1,500 10.82 3.78 1,400 13.32 4.01 1,200 17.40 4.33 1,500 12.02 4.26 1,400 14.11 4.35Hispanic, race
specified 1,300 14.72 3.75 1,350 11.30 3.98 1,300 13.34 4.18 1,100 17.70 4.14 1,300 13.11 4.17 1,300 14.68 4.17Hispanic, no race
specified 550 14.57 3.62 600 11.13 3.93 600 13.36 4.09 450 17.84 4.00 600 12.95 4.53 550 14.42 4.13Asian 950 14.73 3.71 1,000 11.21 3.76 1,000 13.58 4.27 900 18.00 4.06 1,000 13.75 4.31 950 15.22 3.95Native Hawaiian/ Pacific Islander 50 15.60 3.78 50 10.24 2.96 50 14.38 5.29 50 17.25 4.21 50 10.99 3.20 50 14.93 4.61American Indian/ Alaska Native 250 15.85 3.71 250 11.38 4.26 250 14.14 4.17 200 18.69 3.92 250 13.82 4.74 250 15.18 4.18More than 1 race 700 15.51 3.81 700 11.39 3.94 700 13.80 4.04 550 18.68 3.83 700 13.18 4.53 650 15.29 4.44
Child’s sex
Male 4,550 15.39 3.74 4,900 11.48 4.00 4,700 13.95 4.17 3,950 18.36 3.95 4,800 13.62 4.52 4,650 15.48 4.20Female 4,400 15.32 3.76 4,750 10.73 3.67 4,550 13.49 4.05 3,600 18.53 3.93 4,600 13.47 4.54 4,450 15.15 4.10
Child’s age at
assessment 21 months and
under # 14.55 2.69 # 8.04 4.24 # 14.54 3.94 # 15.10 1.56 # 11.77 2.11 # 14.44 3.9622–23 months 850 15.04 3.43 950 11.12 3.88 900 13.57 4.10 700 17.93 3.76 900 13.24 4.27 900 15.06 3.8824–25 months 6,800 15.40 3.70 7,300 11.07 3.79 6,950 13.74 4.08 5,650 18.39 3.82 7,100 13.56 4.48 6,850 15.33 4.0926–27 months 1,000 15.39 4.11 1,050 11.34 4.17 1,050 13.63 4.20 900 18.93 4.44 1,050 13.76 4.90 1,050 15.38 4.4828 months and over 300 15.40 4.40 350 11.38 4.20 300 14.16 4.84 300 19.27 4.81 300 13.76 5.20 300 15.26 5.15
See notes at end of table.

10-6
Table 10-2. Average age weighted means and standard deviations for developmental milestones, by key demographic characteristics, 2-year data collection: 2003–04—Continued
Developmental milestones
Demographic
Walked up stairs alone
(P2WLKSTR)
Started saying first words
(P2FRSTWD)
Turned pages of book
(P2TRNPGS)
Opened door by turning knob
(P2DRKNB)
Played with other children (P2PLYOH)
Played with object
(P2PLYOB) characteristics Number Mean SD Number Mean SD Number Mean SD Number Mean SD Number Mean SD Number Mean SDChild’s birth weight
Normal 6,750 15.32 3.74 7,100 11.06 3.83 6,850 13.70 4.11 5,850 18.41 3.94 6,950 13.55 4.53 6,750 15.30 4.14Moderately low 1,400 15.56 3.74 1,500 11.45 4.04 1,400 13.87 4.15 1,100 18.76 3.94 1,450 13.34 4.53 1,400 15.17 4.26Very low 800 17.25 3.90 1,000 13.09 4.27 950 14.86 4.26 600 19.19 3.94 950 14.55 4.79 900 16.34 4.22
Mother’s age (in years)
19 and under 300 14.41 3.56 350 10.25 3.84 300 13.56 4.34 250 18.30 4.25 300 12.83 4.29 300 14.61 4.3820–29 4,050 15.20 3.76 4,300 10.78 3.79 4,100 13.60 4.02 3,350 18.40 4.00 4,200 13.18 4.38 4,050 14.99 4.1430–39 3,900 15.57 3.75 4,250 11.45 3.89 4,100 13.84 4.19 3,350 18.51 3.88 4,100 14.03 4.69 4,000 15.70 4.1340 and over 650 15.63 3.73 750 11.77 3.90 700 13.90 4.25 600 18.37 3.68 700 13.54 4.42 650 15.37 4.07
Mother’s education
8th grade or below 400 14.14 3.74 450 11.30 4.24 450 13.40 4.50 350 17.41 4.28 450 13.15 4.27 400 14.29 4.379–12th grades 1,800 14.58 3.77 1,950 10.62 3.91 1,850 13.30 4.08 1,500 17.84 4.27 1,900 12.68 4.33 1,850 14.59 4.27High school diploma 1,900 14.98 3.75 2,050 11.01 3.80 1,950 13.70 4.06 1,550 18.36 4.15 2,050 12.92 4.37 1,950 14.84 4.18Vocational/technical 150 15.80 3.11 200 11.39 3.76 200 14.48 4.20 150 19.27 3.49 200 13.84 4.27 200 15.52 3.70Some college 2,150 15.70 3.67 2,350 11.14 3.91 2,250 13.93 4.02 1,850 18.68 3.66 2,300 13.49 4.53 2,200 15.44 4.01Bachelor’s degree 1,450 16.21 3.63 1,550 11.63 3.76 1,550 13.96 4.22 1,250 18.96 3.64 1,500 14.86 4.63 1,500 16.36 3.99Graduate school (no
degree) 150 16.24 3.56 150 10.85 3.43 150 14.02 3.98 150 18.62 3.45 150 15.16 4.81 150 17.05 3.71Master’s degree 650 16.30 3.62 650 11.46 3.65 650 13.57 4.10 550 19.25 3.34 650 15.15 4.60 650 16.38 3.82Doctoral/professional
degree 200 16.62 3.47 250 11.65 3.27 250 14.39 4.16 200 18.29 3.25 200 15.78 3.95 200 16.18 3.69# Rounds to zero. 1 Race categories exclude Hispanic origin unless specified. NOTE: The parent weight, W2R0, was used to obtain these statistics. Cell counts are unweighted to show the distribution in the ECLS-B 2-year data collection. Detail may not sum to total due to rounding. Sample sizes have been rounded to the nearest 50. SOURCE: U.S. Department of Education, National Center for Education Statistics, Early Childhood Longitudinal Study, Birth Cohort (ECLS-B), 2-year data collection, 2003–04.
10-7
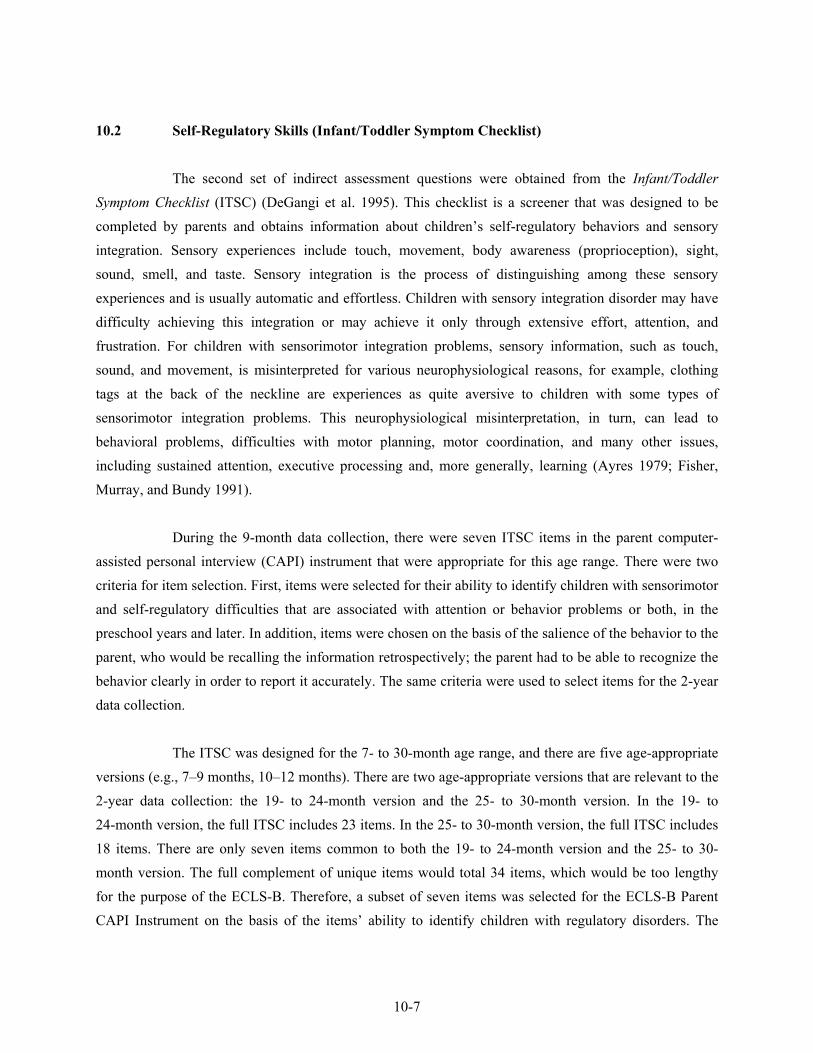
10.2 Self-Regulatory Skills (Infant/Toddler Symptom Checklist)
The second set of indirect assessment questions were obtained from the Infant/Toddler Symptom Checklist (ITSC) (DeGangi et al. 1995). This checklist is a screener that was designed to be completed by parents and obtains information about children’s self-regulatory behaviors and sensory integration. Sensory experiences include touch, movement, body awareness (proprioception), sight, sound, smell, and taste. Sensory integration is the process of distinguishing among these sensory experiences and is usually automatic and effortless. Children with sensory integration disorder may have difficulty achieving this integration or may achieve it only through extensive effort, attention, and frustration. For children with sensorimotor integration problems, sensory information, such as touch, sound, and movement, is misinterpreted for various neurophysiological reasons, for example, clothing tags at the back of the neckline are experiences as quite aversive to children with some types of sensorimotor integration problems. This neurophysiological misinterpretation, in turn, can lead to behavioral problems, difficulties with motor planning, motor coordination, and many other issues, including sustained attention, executive processing and, more generally, learning (Ayres 1979; Fisher, Murray, and Bundy 1991).
During the 9-month data collection, there were seven ITSC items in the parent computer-
assisted personal interview (CAPI) instrument that were appropriate for this age range. There were two criteria for item selection. First, items were selected for their ability to identify children with sensorimotor and self-regulatory difficulties that are associated with attention or behavior problems or both, in the preschool years and later. In addition, items were chosen on the basis of the salience of the behavior to the parent, who would be recalling the information retrospectively; the parent had to be able to recognize the behavior clearly in order to report it accurately. The same criteria were used to select items for the 2-year data collection.
The ITSC was designed for the 7- to 30-month age range, and there are five age-appropriate
versions (e.g., 7–9 months, 10–12 months). There are two age-appropriate versions that are relevant to the 2-year data collection: the 19- to 24-month version and the 25- to 30-month version. In the 19- to 24-month version, the full ITSC includes 23 items. In the 25- to 30-month version, the full ITSC includes 18 items. There are only seven items common to both the 19- to 24-month version and the 25- to 30-month version. The full complement of unique items would total 34 items, which would be too lengthy for the purpose of the ECLS-B. Therefore, a subset of seven items was selected for the ECLS-B Parent CAPI Instrument on the basis of the items’ ability to identify children with regulatory disorders. The

10-8
items selected for the 2-year data collection cover the domains of self-regulation, irritability, sleep difficulty, distractibility, and attending. Parents were asked how often their children were like the descriptions in each item. They indicated whether the child is “never” like this (0), “used to be” like this but is no longer (1), is “sometimes” like this (2), or is like this “most times” (3). The ECLS-B rating for these items could, therefore, range from 0 to 3. The items chosen include the following:
P2FUSSY: Child is frequently irritable or fussy.
P2WHMPR: Child goes easily from a whimper to an intense cry.
P2UNBWT: Child is unable to wait for food or toys without crying or whining/falling apart.
P2DSTRCT: Child is easily distractible or has fleeting attention.
P2HLPSLP: Child needs a lot of help to fall asleep (e.g., rocking, long walks, stroking hair, car rides, etc.).
P2TUNOUT: Child tunes out from activity and is difficult to re-engage.
P2SFTFOC: Child can’t shift focus easily from one project or activity to another.
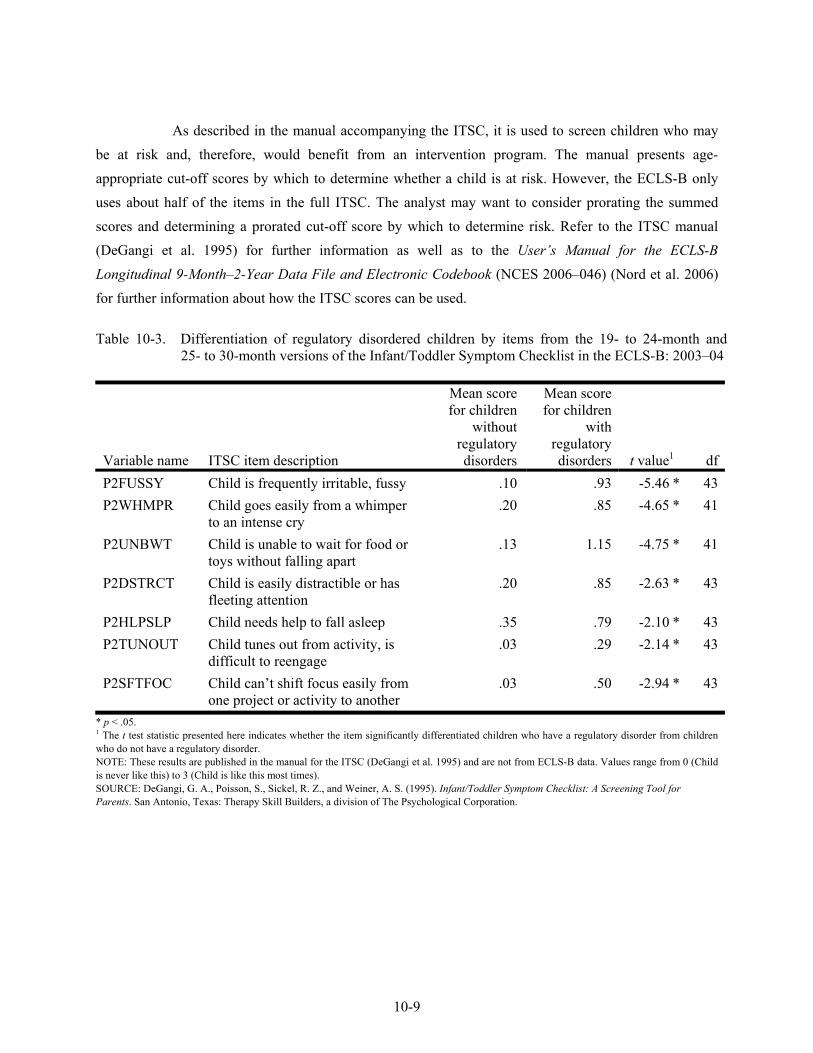
These items were selected because they were identified in the ITSC manual as among those that are most successful at differentiating children with regulatory disorders from children without such disorders at this age. In addition, they were selected because these behaviors are salient to parents and easily reportable. The ITSC manual (DeGangi et al. 1995) presents age-specific summary tables for each item’s ability to differentiate children who have regulatory disorders from children who do not have regulatory disorders. The tables for the 19- to 24-month version and the 25- to 30-month version were consulted because they were age appropriate. Table 10-3 presents a summary of the ITSC items selected from the two age-specific versions that were most successful at differentiating children with regulatory disorders from children without regulatory disorders. The column titled t value refers to the value of t that was obtained on a t test. Items were chosen that had a significant difference on the t test and that would be likely to be observed and reported by parents.
The analyst may want to conduct a factor analysis to explore the possibility of combining
items to represent a particular construct in the 2-year ITSC data. Table 10-4 presents the 2-year ITSC item frequency distributions for the sample as a whole.
10-9
As described in the manual accompanying the ITSC, it is used to screen children who may be at risk and, therefore, would benefit from an intervention program. The manual presents age-appropriate cut-off scores by which to determine whether a child is at risk. However, the ECLS-B only uses about half of the items in the full ITSC. The analyst may want to consider prorating the summed scores and determining a prorated cut-off score by which to determine risk. Refer to the ITSC manual (DeGangi et al. 1995) for further information as well as to the User’s Manual for the ECLS-B Longitudinal 9-Month–2-Year Data File and Electronic Codebook (NCES 2006–046) (Nord et al. 2006) for further information about how the ITSC scores can be used.
Table 10-3. Differentiation of regulatory disordered children by items from the 19- to 24-month and
25- to 30-month versions of the Infant/Toddler Symptom Checklist in the ECLS-B: 2003–04
Variable name ITSC item description
Mean score for children
without regulatory disorders
Mean score for children
with regulatory disorders t value1 df
P2FUSSY Child is frequently irritable, fussy .10 .93 -5.46 * 43P2WHMPR Child goes easily from a whimper
to an intense cry .20 .85 -4.65 * 41
P2UNBWT Child is unable to wait for food or toys without falling apart
.13 1.15 -4.75 * 41
P2DSTRCT Child is easily distractible or has fleeting attention
.20 .85 -2.63 * 43
P2HLPSLP Child needs help to fall asleep .35 .79 -2.10 * 43P2TUNOUT Child tunes out from activity, is
difficult to reengage .03 .29 -2.14 * 43
P2SFTFOC Child can’t shift focus easily from one project or activity to another
.03 .50 -2.94 * 43
* p < .05. 1 The t test statistic presented here indicates whether the item significantly differentiated children who have a regulatory disorder from children who do not have a regulatory disorder. NOTE: These results are published in the manual for the ITSC (DeGangi et al. 1995) and are not from ECLS-B data. Values range from 0 (Child is never like this) to 3 (Child is like this most times). SOURCE: DeGangi, G. A., Poisson, S., Sickel, R. Z., and Weiner, A. S. (1995). Infant/Toddler Symptom Checklist: A Screening Tool for Parents. San Antonio, Texas: Therapy Skill Builders, a division of The Psychological Corporation.

10-10
Table 10-4. Self-regulatory item frequency distributions for the total sample, 2-year data collection: 2003–04
Variable name Response option Number Weighted percentP2FUSSY (0) Never 2,250 23.83 (1) Used to be 600 5.44 (2) Sometimes 6,200 63.06 (3) Most times 800 7.68 P2WHMPR (0) Never 3,800 41.76 (1) Used to be 750 7.06 (2) Sometimes 4,200 40.54 (3) Most times 1,100 10.63 P2UNBWT (0) Never 2,550 27.46 (1) Used to be 700 7.02 (2) Sometimes 4,850 49.60 (3) Most times 1,700 15.92 P2DSTRCT (0) Never 2,500 25.87 (1) Used to be 550 5.44 (2) Sometimes 4,950 50.41 (3) Most times 1,800 18.28 P2HLPSLP (0) Never 5,650 58.11 (1) Used to be 950 9.45 (2) Sometimes 1,900 19.31 (3) Most times 1,350 13.13 P2TUNOUT (0) Never 4,750 50.12 (1) Used to be 450 4.47 (2) Sometimes 3,950 39.31 (3) Most times 650 5.89 P2SFTFOC (0) Never 4,900 52.96 (1) Used to be 450 4.89 (2) Sometimes 3,700 35.46 (3) Most times 750 6.70
NOTE: The parent weight, W2R0, was used to obtain these statistics. Cell counts are unweighted to show the distribution in the ECLS-B 2-year data collection. Detail may not sum to total due to rounding. Sample sizes have been rounded to the nearest 50. SOURCE: U.S. Department of Education, National Center for Education Statistics, Early Childhood Longitudinal Study, Birth Cohort (ECLS-B), 2-year data collection, 2003–04.

10-11
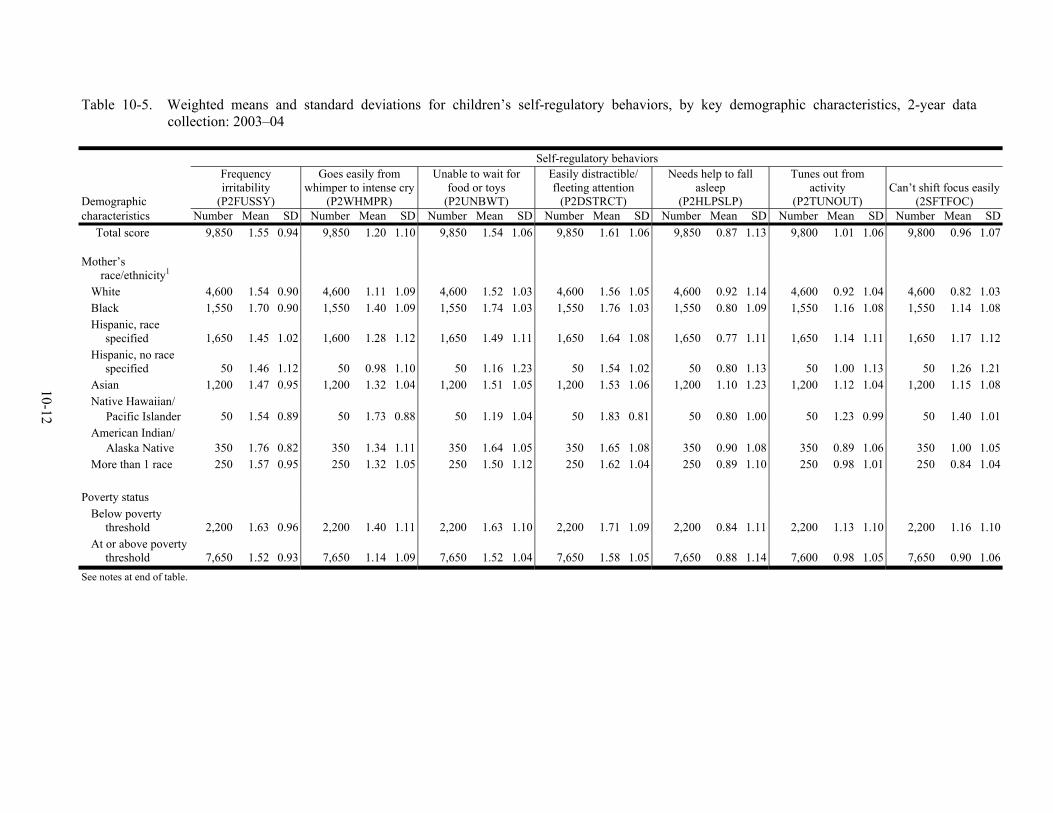
To examine how the items evaluating children’s self-regulatory skills performed during the 2-year national data collection, the weighted means and standard deviations of each item were obtained for the total sample and for the key demographic variables. To obtain these statistics, the parent weight, W2R0, was applied and all cases with missing data were omitted. These statistics are presented in table 10-5. The weighted means demonstrate that there is variability across the items as well as across different demographic variables. For example, children born with very low birth weight (less than or equal to 1,500 grams) are more easily distractible (P2DSTRCT) than children born at greater than 1,500 grams, with an average of 1.80 versus 1.60 for children born at normal birth weight. In addition, children living below poverty level tend have higher average scores on all but one (P2HLPSLP) of the self-regulation items than those at or above poverty threshold.
10.3 Toddler Vocabulary
The acquisition of language is such an important developmental milestone that it deserves a measurement tool of its own. In fact, the transition from preverbal to verbal communication is so important that it marks the boundary between (preverbal) infancy and (verbal) toddlerhood. Children learn language at different rates, some early and quickly, some later and more slowly, so that the range of words acquired by a certain age is broad, with estimates ranging from 10 words acquired by 13 to 15 months and 50 words acquired by 10 to 24 months (Nelson 1973; Fenson et al. 1994). As reported on the Child Language Data Exchange System website (http://childes.psy.cmu.edu/), from 24 to 36 months language acquisition is rapid and accelerates steeply, so that a plausible estimate would be an average of 10 new words a day during the preschool and early school years.
Children learn language at different rates. Diary studies (e.g., Nelson 1973) and studies of
the language environment in the home (e.g., dinner conversation studies, Beals and Snow 1994) have shown that language acquisition can be influenced by social factors. Therefore, the 2-year data collection of the ECLS-B is well served by the inclusion of a measure of the child’s language acquisition and word use. A measure of children’s language acquisition enables analysts to examine the variables in children’s environments that contribute to higher rates of word learning, which, in turn, is presumed to be related to children’s subsequent adjustment to and achievement in the early school years.
10-12
Table 10-5. Weighted means and standard deviations for children’s self-regulatory behaviors, by key demographic characteristics, 2-year data collection: 2003–04
Self-regulatory behaviors
Demographic
Frequency irritability
(P2FUSSY)
Goes easily from whimper to intense cry
(P2WHMPR)
Unable to wait for food or toys
(P2UNBWT)
Easily distractible/ fleeting attention
(P2DSTRCT)
Needs help to fall asleep
(P2HLPSLP)
Tunes out from activity
(P2TUNOUT) Can’t shift focus easily
(2SFTFOC) characteristics Number Mean SD Number Mean SD Number Mean SD Number Mean SD Number Mean SD Number Mean SD Number Mean SD Total score 9,850 1.55 0.94 9,850 1.20 1.10 9,850 1.54 1.06 9,850 1.61 1.06 9,850 0.87 1.13 9,800 1.01 1.06 9,800 0.96 1.07
Mother’s
race/ethnicity1 White 4,600 1.54 0.90 4,600 1.11 1.09 4,600 1.52 1.03 4,600 1.56 1.05 4,600 0.92 1.14 4,600 0.92 1.04 4,600 0.82 1.03 Black 1,550 1.70 0.90 1,550 1.40 1.09 1,550 1.74 1.03 1,550 1.76 1.03 1,550 0.80 1.09 1,550 1.16 1.08 1,550 1.14 1.08 Hispanic, race
specified 1,650 1.45 1.02 1,600 1.28 1.12 1,650 1.49 1.11 1,650 1.64 1.08 1,650 0.77 1.11 1,650 1.14 1.11 1,650 1.17 1.12 Hispanic, no race
specified 50 1.46 1.12 50 0.98 1.10 50 1.16 1.23 50 1.54 1.02 50 0.80 1.13 50 1.00 1.13 50 1.26 1.21 Asian 1,200 1.47 0.95 1,200 1.32 1.04 1,200 1.51 1.05 1,200 1.53 1.06 1,200 1.10 1.23 1,200 1.12 1.04 1,200 1.15 1.08 Native Hawaiian/ Pacific Islander 50 1.54 0.89 50 1.73 0.88 50 1.19 1.04 50 1.83 0.81 50 0.80 1.00 50 1.23 0.99 50 1.40 1.01 American Indian/ Alaska Native 350 1.76 0.82 350 1.34 1.11 350 1.64 1.05 350 1.65 1.08 350 0.90 1.08 350 0.89 1.06 350 1.00 1.05 More than 1 race 250 1.57 0.95 250 1.32 1.05 250 1.50 1.12 250 1.62 1.04 250 0.89 1.10 250 0.98 1.01 250 0.84 1.04
Poverty status
Below poverty threshold 2,200 1.63 0.96 2,200 1.40 1.11 2,200 1.63 1.10 2,200 1.71 1.09 2,200 0.84 1.11 2,200 1.13 1.10 2,200 1.16 1.10
At or above poverty threshold 7,650 1.52 0.93 7,650 1.14 1.09 7,650 1.52 1.04 7,650 1.58 1.05 7,650 0.88 1.14 7,600 0.98 1.05 7,650 0.90 1.06
See notes at end of table.

10-13
Table 10-5. Weighted means and standard deviations for children’s self-regulatory behaviors, by key demographic characteristics, 2-year data collection: 2003–04—Continued
Self-regulatory behaviors
Demographic
Frequency irritability
(P2FUSSY)
Goes easily from whimper to intense cry
(P2WHMPR)
Unable to wait for food or toys
(P2UNBWT)
Easily distractible/ fleeting attention
(P2DSTRCT)
Needs help to fall asleep
(P2HLPSLP)
Tunes out from activity
(P2TUNOUT)
Can’t shift focus easily
(2SFTFOC) characteristics Number Mean SD Number Mean SD Number Mean SD Number Mean SD Number Mean SD Number Mean SD Number Mean SD Child’s race/ethnicity1
White 4,200 1.54 0.90 4,200 1.10 1.09 4,200 1.52 1.03 4,200 1.56 1.05 4,200 0.91 1.14 4,200 0.91 1.03 4,200 0.81 1.03 Black 1,550 1.70 0.91 1,550 1.40 1.09 1,550 1.73 1.04 1,550 1.75 1.03 1,550 0.81 1.10 1,550 1.17 1.08 1,550 1.14 1.08 Hispanic, race
specified 1,350 1.45 0.99 1,350 1.25 1.11 1,350 1.47 1.10 1,350 1.65 1.07 1,350 0.81 1.11 1,350 1.08 1.09 1,350 1.12 1.10 Hispanic, no race
specified 600 1.53 1.04 600 1.28 1.13 600 1.48 1.13 600 1.65 1.09 600 0.79 1.14 600 1.22 1.12 600 1.21 1.14 Asian 1,050 1.45 0.95 1,050 1.37 1.03 1,050 1.49 1.07 1,050 1.51 1.07 1,050 1.08 1.23 1,050 1.14 1.04 1,050 1.19 1.08 Native Hawaiian/
Pacific Islander 50 1.67 0.88 50 1.36 1.11 50 1.26 1.19 50 1.65 0.96 50 1.02 1.23 50 1.67 0.98 50 1.22 1.04 American Indian/
Alaska Native 250 1.73 0.86 250 1.51 1.04 250 1.57 1.12 250 1.73 1.10 250 0.84 1.07 250 1.07 1.12 250 0.98 1.04 More than 1 race 750 1.56 0.94 750 1.25 1.07 750 1.59 1.06 750 1.59 1.06 750 0.90 1.16 750 0.98 1.04 750 0.92 1.04
Child’s sex
Male 5,050 1.56 0.93 5,050 1.19 1.10 5,050 1.59 1.05 5,000 1.68 1.05 5,000 0.87 1.13 5,000 1.06 1.07 5,000 0.99 1.08 Female 4,800 1.53 0.94 4,800 1.21 1.10 4,800 1.49 1.06 4,800 1.54 1.06 4,800 0.88 1.13 4,800 0.96 1.05 4,800 0.92 1.06
Child’s age at
assessment 21 months and under # 2.04 0.62 # 1.54 0.97 # 2.31 0.63 # 2.10 0.30 # 1.73 1.18 # 1.47 0.93 # 1.78 1.11 22–23 months 950 1.49 0.96 950 1.21 1.10 950 1.61 1.06 950 1.62 1.06 950 0.83 1.12 950 1.09 1.07 950 1.03 1.08 24–25 months 7,400 1.57 0.92 7,400 1.20 1.09 7,400 1.54 1.05 7,400 1.63 1.05 7,400 0.89 1.14 7,400 1.00 1.06 7,400 0.95 1.07 26–27 months 1,100 1.47 0.98 1,100 1.22 1.13 1,100 1.50 1.10 1,100 1.48 1.10 1,100 0.82 1.09 1,100 1.00 1.06 1,100 0.94 1.05 28 months and over 350 1.45 0.99 350 1.15 1.08 350 1.40 1.04 350 1.48 1.06 350 0.84 1.12 350 0.98 1.06 350 0.90 1.04
See notes at end of table.

10-14
Table 10-5. Weighted means and standard deviations for children’s self-regulatory behaviors, by key demographic characteristics, 2-year data collection: 2003–04—Continued
Self-regulatory behaviors
Demographic
Frequency irritability
(P2FUSSY)
Goes easily from whimper to intense cry
(P2WHMPR)
Unable to wait for food or toys
(P2UNBWT)
Easily distractible/ fleeting attention
(P2DSTRCT)
Needs help to fall asleep
(P2HLPSLP)
Tunes out from activity
(P2TUNOUT) Can’t shift focus easily
(2SFTFOC) characteristics Number Mean SD Number Mean SD Number Mean SD Number Mean SD Number Mean SD Number Mean SD Number Mean SD Child’s birth weight
Normal 7,200 1.54 0.94 7,200 1.19 1.10 7,200 1.53 1.05 7,200 1.60 1.06 7,200 0.87 1.13 7,200 1.00 1.06 7,200 0.95 1.07 Moderately low 1,500 1.62 0.92 1,500 1.40 1.10 1,500 1.63 1.08 1,500 1.69 1.05 1,500 0.89 1.14 1,500 1.15 1.09 1,500 1.10 1.10 Very low 1,050 1.58 0.97 1,050 1.30 1.12 1,050 1.67 1.07 1,050 1.80 1.07 1,050 0.89 1.14 1,050 1.18 1.13 1,050 1.20 1.14
Mother’s age (in
years) 19 and under 350 1.62 0.92 350 1.41 1.09 350 1.66 1.05 350 1.96 1.01 350 0.95 1.17 350 1.15 1.10 350 1.02 1.13 20–29 4,400 1.62 0.93 4,400 1.26 1.10 4,400 1.62 1.05 4,400 1.70 1.05 4,400 0.84 1.12 4,400 1.09 1.08 4,400 1.02 1.08 30–39 4,300 1.47 0.94 4,300 1.13 1.09 4,300 1.47 1.06 4,300 1.51 1.06 4,300 0.87 1.13 4,300 0.92 1.04 4,300 0.89 1.06 40 and over 750 1.51 0.93 750 1.12 1.09 750 1.39 1.04 750 1.48 1.05 750 1.09 1.22 750 0.99 1.06 750 0.96 1.08
Mother’s education
8th grade or below 450 1.40 1.09 450 1.43 1.12 450 1.49 1.15 450 1.73 1.08 450 0.73 1.11 450 1.25 1.13 450 1.19 1.14 9–12th grades 2,000 1.68 0.94 2,000 1.40 1.12 2,000 1.65 1.10 2,000 1.72 1.09 2,000 0.84 1.13 2,000 1.15 1.10 2,000 1.15 1.12 High school
diploma 2,100 1.61 0.91 2,100 1.25 1.09 2,100 1.60 1.04 2,100 1.67 1.04 2,100 0.82 1.11 2,100 1.08 1.07 2,100 1.04 1.07 Voc./technical 200 1.57 0.87 200 1.04 1.07 200 1.43 1.07 200 1.69 0.93 200 0.93 1.19 200 1.11 1.07 200 0.81 1.03 Some college 2,350 1.47 0.94 2,350 1.11 1.09 2,350 1.51 1.05 2,350 1.57 1.06 2,350 0.91 1.15 2,350 0.94 1.04 2,350 0.86 1.03 Bachelor’s degree 1,600 1.49 0.91 1,600 1.09 1.06 1,600 1.51 0.99 1,600 1.55 1.02 1,600 0.93 1.14 1,600 0.91 1.03 1,600 0.83 1.03 Graduate school
(no degree) 150 1.57 0.85 150 1.13 1.04 150 1.43 0.98 150 1.51 1.07 150 0.93 1.10 150 0.88 1.01 150 0.84 1.00 Master’s degree 700 1.41 0.90 700 0.86 1.03 700 1.33 1.00 700 1.30 1.04 700 1.03 1.13 700 0.73 0.95 700 0.69 0.99 Doctoral/prof.
degree 250 1.41 0.90 250 1.10 1.00 250 1.34 0.99 250 1.34 1.06 250 0.83 1.10 250 0.68 0.98 250 0.55 0.94 # Rounds to zero. 1 Race categories exclude Hispanic origin unless specified. NOTE: The parent weight, W2R0, was used to obtain these statistics. Cell counts are unweighted to show the distribution in the ECLS-B 2-year data collection. Detail may not sum to total due to rounding. Sample sizes have been rounded to the nearest 50. SOURCE: U.S. Department of Education, National Center for Education Statistics, Early Childhood Longitudinal Study, Birth Cohort (ECLS-B), 2-year data collection, 2003–04.

10-15
There are a few items in the 2-year Bayley Short Form–Research Edition (BSF-R) that assess children’s language use, and scores for these items are represented in children’s BSF-R mental scale scores. To supplement information about children’s language acquisition, a parent report of children’s word use and grammatical constructions is included in the Parent CAPI Instrument. Ideally, the MacArthur Communicative Development Inventory (M-CDI) (Fenson et al. 1994) would have been the best available parent report measure. However, the M-CDI checklist contains well over 400 words, which would be too burdensome and time consuming to incorporate into the ECLS-B home visit.
For this reason, one of the co-authors of the M-CDI, Dr. Philip Dale of the University of
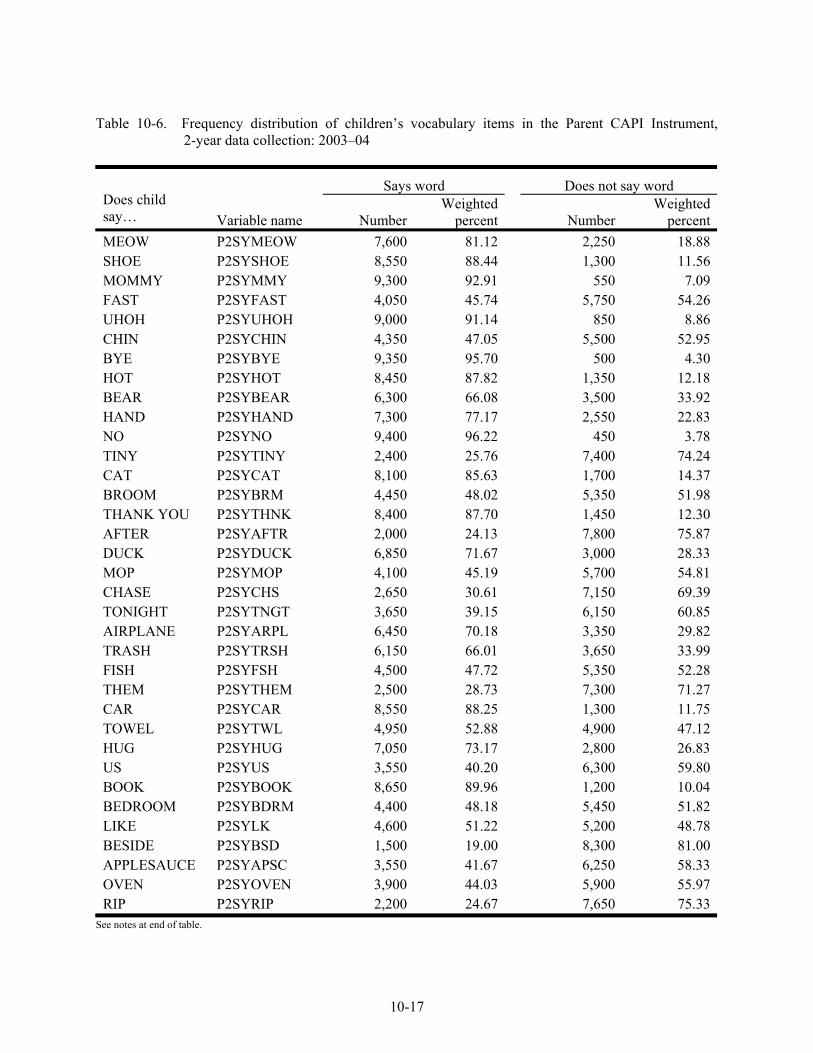
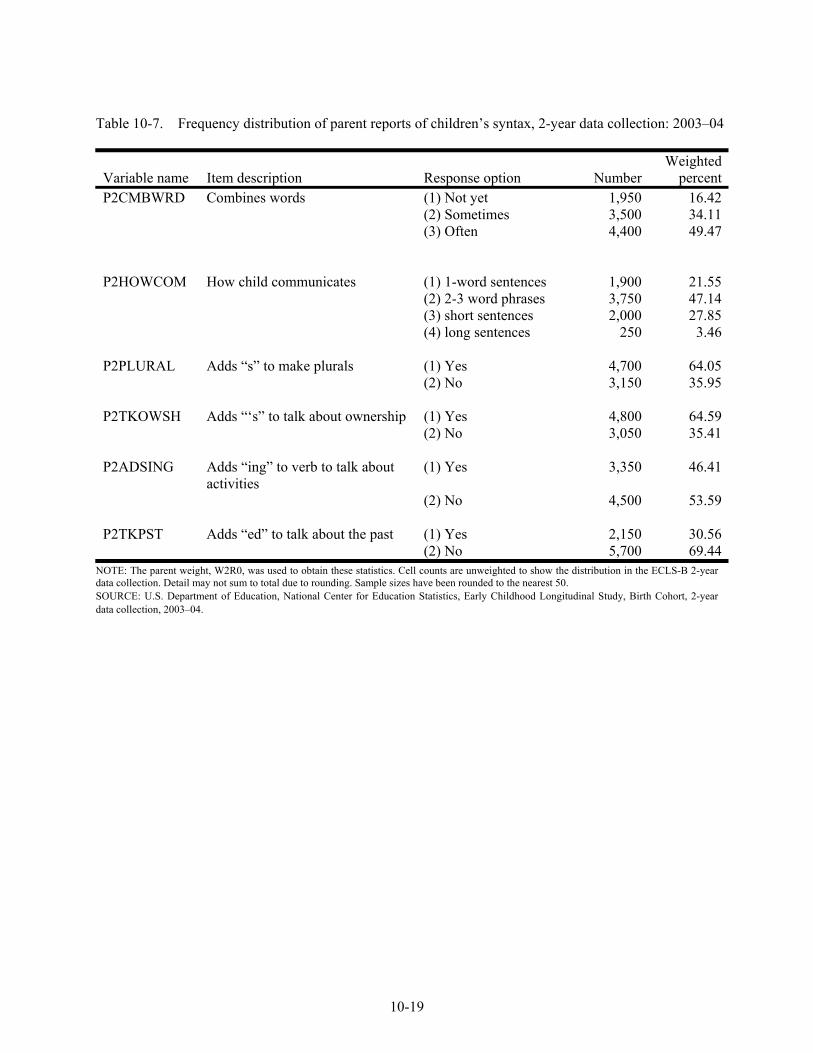
Missouri, was contacted and agreed to develop a list of 50 words typically known and said by children in the target age range, as well as a set of items that obtain information about children’s syntax use. These 50 words were then incorporated into the Parent CAPI Instrument to be read to the parent by the interviewer. This eliminated any difficulties filling out a checklist by respondents for whom English is not the primary language. Dr. Dale also recommended the set of supplementary items about children’s language use, such as the use of irregular plurals and the use of irregular past tense. Therefore, the parent was asked whether the child: (1) could say the target words; (2) could combine words to make phrases or sentences; (3) could add “s” to make nouns plural; (4) could add “ ’s” to denote ownership; (5) could add “ing” to talk about activities in the present tense; and, (5) could add “ed” to words to talk about the past. In addition, Dr. Dale also provided an equivalent Spanish checklist, which included Spanish words that were appropriate for this age range and that were of approximately the equivalent level of difficulty as the English checklist. For further information about the variable names for these word checklist items and the supplementary syntax items, please refer to the User’s Manual for the ECLS-B Longitudinal 9-Month–2-Year Data File and Electronic Codebook (NCES 2006–046) (Nord et al. 2006). The frequency distribution and percentages of sample children who had these words and did not have these words in their vocabulary are summarized in table 10-6. Table 10-7 summarizes children’s syntax items.
There are no norms based on a nationally representative sample against which to compare
the ECLS-B sample children. The best available measure that obtains comparable information is the M-CDI (Fenson et al. 1994), which includes a parent report checklist of the words children can say and the words children can understand. Interested analysts may want to refer to the monograph that describes the development of the M-CDI (Fenson et al. 1994) to see how scores were obtained on this measure. The results from the ECLS-B cannot be compared directly with the norms obtained for the M-CDI because the ECLS-B included only 50 words, whereas the age-appropriate toddler version of the M-CDI includes approximately 400 words from 19 categories.

10-16
Table 10-6 presents the (weighted) frequency distribution of children who said each word and did not say each word, as reported by the parent respondent. These distributions show that there is variability in children’s vocabularies, ranging from a high of 96.22 percent of children who say “no” (only 3.78 percent do not yet say “no”) and a low of 19.00 percent who can say “beside.” To obtain these statistics, all cases with missing data were omitted and the parent weight, W2R0, was used.
Table 10-7 presents the frequency distribution of parents’ reports of children’s use of
language rules (syntax) for the total sample. To obtain these statistics, the parent weight, W2R0, was used and all cases with missing data were omitted. However, the cell counts are unweighted in order to demonstrate the distribution in the ECLS-B 2-year data collection.
To examine how the items evaluating the child’s vocabulary performed during the 2-year
national data collection, the total score for this set of items was obtained by simply summing the number of words the child was able to say. The weighted means and standard deviations for children’s total vocabulary score were obtained for the total sample and for the key demographic variables. These results are presented in table 10-8. To obtain these statistics, the parent weight, W2R0, was applied and all cases with missing data were omitted.
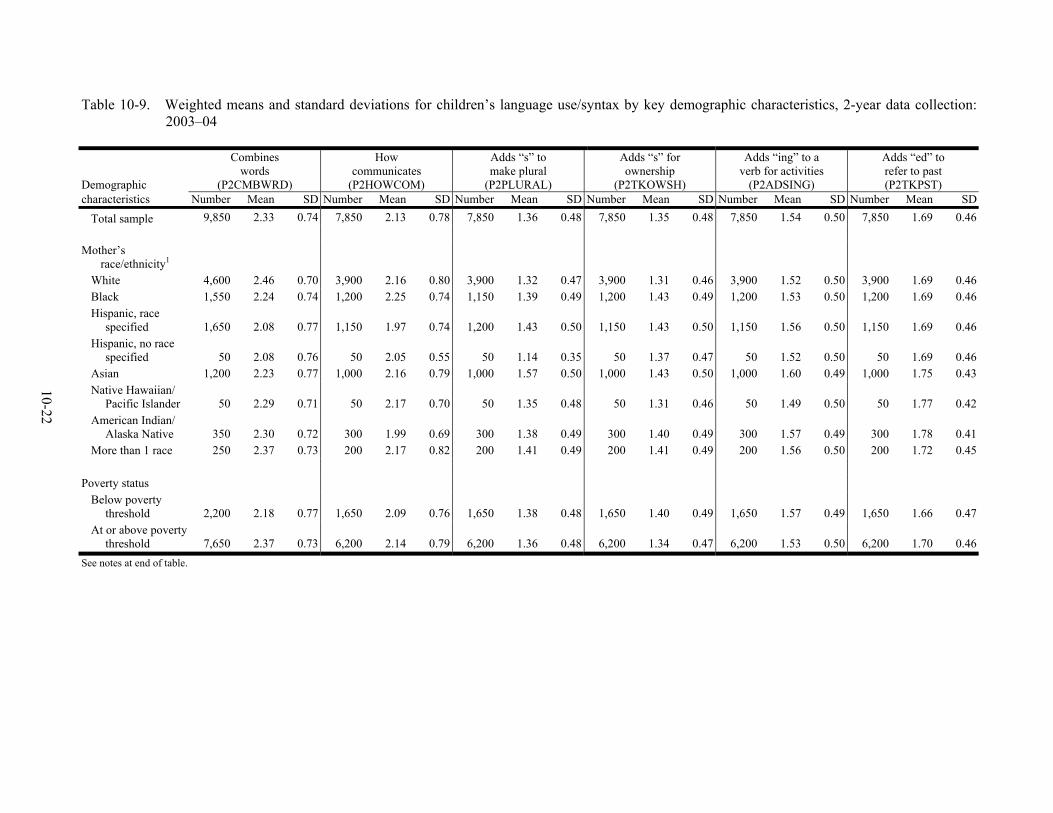
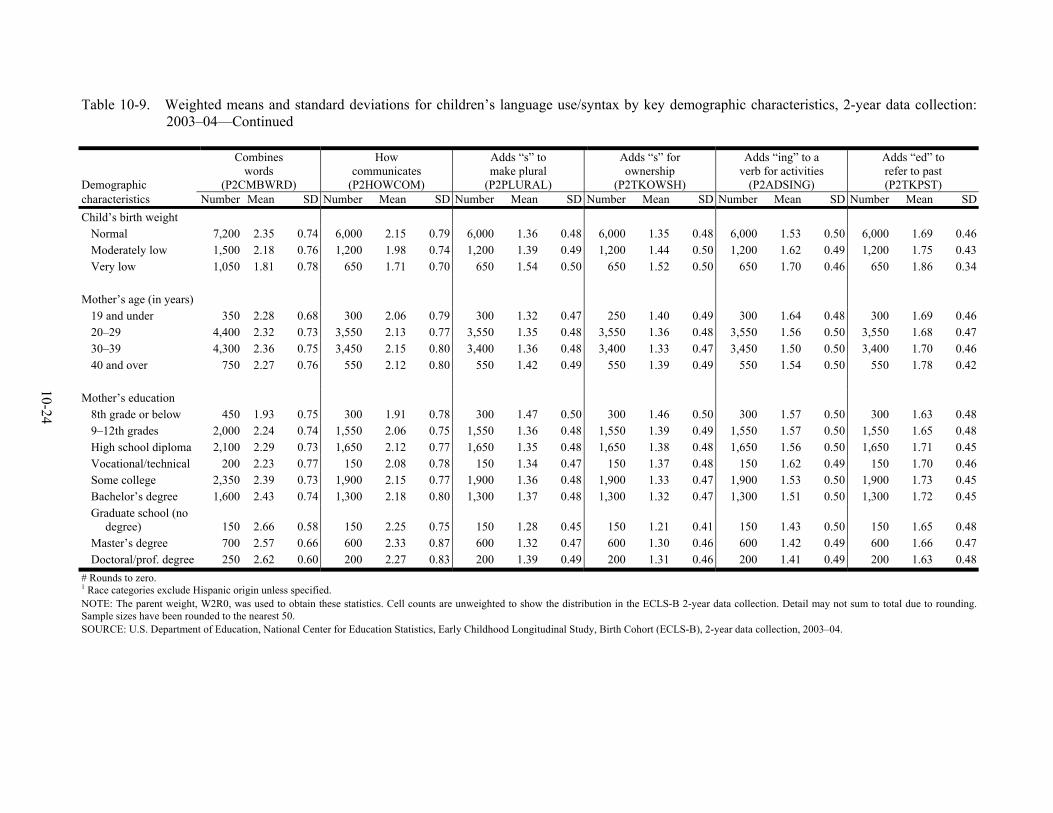
Table 10-9 shows the weighted means for the items that assess children’s use of language
rules (syntax) for the total sample and by demographic variables. To obtain these statistics, the parent weight, W2R0, was used and all cases with missing data were omitted. The cell counts, however, are unweighted in order to demonstrate the distribution in the ECLS-B 2-year data collection. For example, child age at the time of the assessment is associated with use of language rules: children 28 months of age and older score higher on many of these variables than do children who were assessed at 24 to 25 months.
10-17
Table 10-6. Frequency distribution of children’s vocabulary items in the Parent CAPI Instrument, 2-year data collection: 2003–04
Says word Does not say word Does child say… Variable name Number
Weighted percent Number
Weighted percent
MEOW P2SYMEOW 7,600 81.12 2,250 18.88SHOE P2SYSHOE 8,550 88.44 1,300 11.56MOMMY P2SYMMY 9,300 92.91 550 7.09FAST P2SYFAST 4,050 45.74 5,750 54.26UHOH P2SYUHOH 9,000 91.14 850 8.86CHIN P2SYCHIN 4,350 47.05 5,500 52.95BYE P2SYBYE 9,350 95.70 500 4.30HOT P2SYHOT 8,450 87.82 1,350 12.18BEAR P2SYBEAR 6,300 66.08 3,500 33.92HAND P2SYHAND 7,300 77.17 2,550 22.83NO P2SYNO 9,400 96.22 450 3.78TINY P2SYTINY 2,400 25.76 7,400 74.24CAT P2SYCAT 8,100 85.63 1,700 14.37BROOM P2SYBRM 4,450 48.02 5,350 51.98THANK YOU P2SYTHNK 8,400 87.70 1,450 12.30AFTER P2SYAFTR 2,000 24.13 7,800 75.87DUCK P2SYDUCK 6,850 71.67 3,000 28.33MOP P2SYMOP 4,100 45.19 5,700 54.81CHASE P2SYCHS 2,650 30.61 7,150 69.39TONIGHT P2SYTNGT 3,650 39.15 6,150 60.85AIRPLANE P2SYARPL 6,450 70.18 3,350 29.82TRASH P2SYTRSH 6,150 66.01 3,650 33.99FISH P2SYFSH 4,500 47.72 5,350 52.28THEM P2SYTHEM 2,500 28.73 7,300 71.27CAR P2SYCAR 8,550 88.25 1,300 11.75TOWEL P2SYTWL 4,950 52.88 4,900 47.12HUG P2SYHUG 7,050 73.17 2,800 26.83US P2SYUS 3,550 40.20 6,300 59.80BOOK P2SYBOOK 8,650 89.96 1,200 10.04BEDROOM P2SYBDRM 4,400 48.18 5,450 51.82LIKE P2SYLK 4,600 51.22 5,200 48.78BESIDE P2SYBSD 1,500 19.00 8,300 81.00APPLESAUCE P2SYAPSC 3,550 41.67 6,250 58.33OVEN P2SYOVEN 3,900 44.03 5,900 55.97RIP P2SYRIP 2,200 24.67 7,650 75.33
See notes at end of table.

10-18
Table 10-6. Frequency distribution of children’s vocabulary items in the Parent CAPI Instrument, 2-year data collection: 2003–04—Continued
Says word Does not say word Does child say… Variable name Number
Weighted percent Number
Weighted percent
UNDER P2SYUNDR 3,800 43.51 6,000 56.49COKE P2SYCOKE 4,700 52.47 5,100 47.53FLAG P2SYFLAG 3,400 38.53 6,450 61.47TASTE P2SYTST 3,650 41.14 6,150 58.86MUCH P2SYMUCH 3,100 34.20 6,750 65.80JUICE P2SYJUCE 8,400 85.28 1,450 14.72STAR P2SYSTAR 5,750 62.71 4,050 37.29THINK P2SYTHIK 1,950 21.91 7,850 78.09NEED P2SYND 3,700 42.33 6,150 57.67MILK P2SYMLK 8,250 84.59 1,600 15.41SCHOOL P2SYSCHL 5,150 56.67 4,700 43.33ALL GONE P2SYALGN 7,650 80.63 2,200 19.37IF P2SYIF 2,150 26.19 7,700 73.81HAT P2SYHAT 7,600 80.56 2,250 19.44PARTY P2SYPRTY 3,850 43.68 6,000 56.32
NOTE: The parent weight, W2R0, was used to obtain these statistics. Cell counts are unweighted to show the distribution in the ECLS-B 2-year data collection. Detail may not sum to total due to rounding. Sample sizes have been rounded to the nearest 50. SOURCE: U.S. Department of Education, National Center for Education Statistics, Early Childhood Longitudinal Study, Birth Cohort, 2-year data collection, 2003–04.
10-19
Table 10-7. Frequency distribution of parent reports of children’s syntax, 2-year data collection: 2003–04
Variable name Item description Response option Number Weighted
percentP2CMBWRD Combines words (1) Not yet 1,950 16.42 (2) Sometimes 3,500 34.11 (3) Often 4,400 49.47 P2HOWCOM How child communicates (1) 1-word sentences 1,900 21.55 (2) 2-3 word phrases 3,750 47.14 (3) short sentences 2,000 27.85 (4) long sentences 250 3.46 P2PLURAL Adds “s” to make plurals (1) Yes 4,700 64.05 (2) No 3,150 35.95 P2TKOWSH Adds “‘s” to talk about ownership (1) Yes 4,800 64.59 (2) No 3,050 35.41 P2ADSING Adds “ing” to verb to talk about
activities (1) Yes 3,350 46.41
(2) No 4,500 53.59 P2TKPST Adds “ed” to talk about the past (1) Yes 2,150 30.56 (2) No 5,700 69.44
NOTE: The parent weight, W2R0, was used to obtain these statistics. Cell counts are unweighted to show the distribution in the ECLS-B 2-year data collection. Detail may not sum to total due to rounding. Sample sizes have been rounded to the nearest 50. SOURCE: U.S. Department of Education, National Center for Education Statistics, Early Childhood Longitudinal Study, Birth Cohort, 2-year data collection, 2003–04.

10-20
Table 10-8. Weighted means and standard deviations of children’s total vocabulary scores for total sample and by key demographic variables, 2-year data collection: 2003–04
Average total vocabulary score Characteristic Number Weighted mean Standard deviation
Total sample 9,850 20.06 11.87 Child’s race/ethnicity1
White 4,150 30.14 11.82Black 1,500 28.66 11.33Hispanic, race specified 1,350 27.78 11.46Hispanic, no race specified 600 26.19 11.74Asian 1,050 29.57 12.33Native Hawaiian/Pacific Islander 50 29.44 14.03American Indian/Alaska Native 250 26.73 11.16More than 1 race 750 29.05 12.54
Poverty status Below poverty threshold 2,200 27.16 11.61At or above poverty threshold 7,600 29.67 11.79
Child’s sex Male 5,000 26.92 12.10Female 4,800 31.44 11.00
Child’s age at assessment 21 months and under # 21.58 6.8122–23 months 950 26.03 11.2524–25 months 7,350 28.90 11.7926–27 months 1,100 32.01 11.4828 months and over 350 35.34 10.60
Birth weight Normal 7,200 29.44 11.74Moderately low 1,500 26.29 11.67Very low 1,050 19.84 11.37
Mother’s age (in years) 19 and under 350 26.95 10.5720–29 4,350 28.76 11.6230–39 4,300 29.86 12.0440 and over 750 28.47 11.74
See notes at end of table.

10-21
Table 10-8. Weighted means and standard deviations of children’s total vocabulary scores for total sample and by key demographic variables, 2-year data collection: 2003–04—Continued
Average total vocabulary score Characteristic Number Weighted mean Standard deviationMother’s race/ethnicity1
White 4,550 30.08 11.80Black 1,550 28.84 11.33Hispanic, race specified 1,650 27.06 11.73Hispanic, no race specified 50 26.83 12.19Asian 1,200 29.20 12.34Native Hawaiian/Pacific Islander 50 31.14 12.40American Indian/Alaska Native 350 27.40 10.67More than 1 race 250 28.35 11.88
Mother’s education 8th grade or below 450 26.07 12.069–12th grades 2,000 27.61 11.77High school diploma 2,100 28.19 11.31Vocational/technical 200 28.25 12.19Some college 2,350 29.96 11.68Bachelor’s degree 1,600 30.26 11.97Graduate school (no degree) 150 32.57 10.94Master’s degree 650 32.81 11.89Doctoral/professional degree 250 33.94 10.02
# Rounds to zero. 1 Race categories exclude Hispanic origin unless specified. NOTE: The parent weight, W2R0, was used to obtain these statistics. Cell counts are unweighted to show the distribution in the ECLS-B 2-year data collection. Detail may not sum to total due to rounding. Sample sizes have been rounded to the nearest 50. SOURCE: U.S. Department of Education, National Center for Education Statistics, Early Childhood Longitudinal Study, Birth Cohort (ECLS-B), 2-year data collection, 2003–04.
10-22
Table 10-9. Weighted means and standard deviations for children’s language use/syntax by key demographic characteristics, 2-year data collection: 2003–04
Demographic
Combines words
(P2CMBWRD)
How communicates
(P2HOWCOM)
Adds “s” to make plural
(P2PLURAL)
Adds “s” for ownership
(P2TKOWSH)
Adds “ing” to a verb for activities
(P2ADSING)
Adds “ed” to refer to past (P2TKPST)
characteristics Number Mean SD Number Mean SD Number Mean SD Number Mean SD Number Mean SD Number Mean SDTotal sample 9,850 2.33 0.74 7,850 2.13 0.78 7,850 1.36 0.48 7,850 1.35 0.48 7,850 1.54 0.50 7,850 1.69 0.46
Mother’s race/ethnicity1
White 4,600 2.46 0.70 3,900 2.16 0.80 3,900 1.32 0.47 3,900 1.31 0.46 3,900 1.52 0.50 3,900 1.69 0.46Black 1,550 2.24 0.74 1,200 2.25 0.74 1,150 1.39 0.49 1,200 1.43 0.49 1,200 1.53 0.50 1,200 1.69 0.46Hispanic, race
specified 1,650 2.08 0.77 1,150 1.97 0.74 1,200 1.43 0.50 1,150 1.43 0.50 1,150 1.56 0.50 1,150 1.69 0.46Hispanic, no race
specified 50 2.08 0.76 50 2.05 0.55 50 1.14 0.35 50 1.37 0.47 50 1.52 0.50 50 1.69 0.46Asian 1,200 2.23 0.77 1,000 2.16 0.79 1,000 1.57 0.50 1,000 1.43 0.50 1,000 1.60 0.49 1,000 1.75 0.43Native Hawaiian/
Pacific Islander 50 2.29 0.71 50 2.17 0.70 50 1.35 0.48 50 1.31 0.46 50 1.49 0.50 50 1.77 0.42American Indian/
Alaska Native 350 2.30 0.72 300 1.99 0.69 300 1.38 0.49 300 1.40 0.49 300 1.57 0.49 300 1.78 0.41More than 1 race 250 2.37 0.73 200 2.17 0.82 200 1.41 0.49 200 1.41 0.49 200 1.56 0.50 200 1.72 0.45
Poverty status
Below poverty threshold 2,200 2.18 0.77 1,650 2.09 0.76 1,650 1.38 0.48 1,650 1.40 0.49 1,650 1.57 0.49 1,650 1.66 0.47
At or above poverty threshold 7,650 2.37 0.73 6,200 2.14 0.79 6,200 1.36 0.48 6,200 1.34 0.47 6,200 1.53 0.50 6,200 1.70 0.46
See notes at end of table.

10-23
Table 10-9. Weighted means and standard deviations for children’s language use/syntax by key demographic characteristics, 2-year data collection: 2003–04—Continued
Demographic
Combines words
(P2CMBWRD)
How communicates
(P2HOWCOM)
Adds “s” to make plural
(P2PLURAL)
Adds “s” for ownership
(P2TKOWSH)
Adds “ing” to a verb for activities
(P2ADSING)
Adds “ed” to refer to past (P2TKPST)
characteristics Number Mean SD Number Mean SD Number Mean SD Number Mean SD Number Mean SD Number Mean SDChild’s race/
ethnicity1 White 4,200 2.46 0.70 3,500 2.17 0.80 3,500 1.32 0.46 3,500 1.30 0.46 3,500 1.53 0.50 3,500 1.69 0.46Black 1,550 2.23 0.74 1,150 2.23 0.73 1,150 1.39 0.49 1,150 1.43 0.50 1,150 1.54 0.50 1,150 1.69 0.46Hispanic, race
specified 1,350 2.14 0.77 1,000 1.98 0.73 1,000 1.40 0.49 1,000 1.41 0.49 1,000 1.56 0.50 1,000 1.68 0.47Hispanic, no race
specified 600 2.06 0.77 400 1.98 0.79 400 1.43 0.50 400 1.44 0.50 400 1.54 0.50 400 1.71 0.45Asian 1,050 2.23 0.76 850 2.19 0.81 850 1.58 0.49 850 1.44 0.50 850 1.61 0.49 850 1.73 0.44Native Hawaiian/ Pacific Islander 50 2.49 0.70 50 2.19 0.58 50 1.30 0.46 50 1.38 0.49 50 1.63 0.48 50 1.72 0.45American Indian/ Alaska Native 250 2.30 0.73 200 1.92 0.74 200 1.37 0.48 200 1.44 0.50 200 1.63 0.48 200 1.74 0.44More than 1 race 750 2.39 0.74 600 2.16 0.77 600 1.43 0.50 600 1.36 0.48 600 1.51 0.50 600 1.74 0.44
Child’s sex
Male 5,050 2.22 0.76 3,800 2.00 0.78 3,800 1.39 0.49 3,800 1.40 0.49 3,800 1.61 0.49 3,800 1.74 0.44Female 4,800 2.44 0.70 4,050 2.26 0.76 4,050 1.33 0.47 4,050 1.31 0.46 4,050 1.47 0.50 4,050 1.65 0.48
Child’s age at
assessment 21 months and
under # 1.88 0.32 # 1.87 0.83 # 1.37 0.48 # 1.08 0.27 # 1.72 0.45 # 1.97 0.1822–23 months 950 2.25 0.76 750 1.97 0.75 750 1.42 0.49 750 1.43 0.49 750 1.61 0.49 750 1.76 0.4324–25 months 7,400 2.32 0.74 5,900 2.11 0.77 5,900 1.36 0.48 5,900 1.35 0.48 5,900 1.54 0.50 5,900 1.71 0.4626–27 months 1,100 2.41 0.71 950 2.29 0.82 900 1.33 0.47 900 1.32 0.47 900 1.51 0.50 900 1.61 0.4928 months and over 350 2.55 0.67 300 2.62 0.77 300 1.26 0.44 300 1.23 0.42 300 1.38 0.49 300 1.53 0.50
See notes at end of table.
10-24
Table 10-9. Weighted means and standard deviations for children’s language use/syntax by key demographic characteristics, 2-year data collection: 2003–04—Continued
Demographic
Combines words
(P2CMBWRD)
How communicates
(P2HOWCOM)
Adds “s” to make plural
(P2PLURAL)
Adds “s” for ownership
(P2TKOWSH)
Adds “ing” to a verb for activities
(P2ADSING)
Adds “ed” to refer to past (P2TKPST)
characteristics Number Mean SD Number Mean SD Number Mean SD Number Mean SD Number Mean SD Number Mean SDChild’s birth weight
Normal 7,200 2.35 0.74 6,000 2.15 0.79 6,000 1.36 0.48 6,000 1.35 0.48 6,000 1.53 0.50 6,000 1.69 0.46Moderately low 1,500 2.18 0.76 1,200 1.98 0.74 1,200 1.39 0.49 1,200 1.44 0.50 1,200 1.62 0.49 1,200 1.75 0.43Very low 1,050 1.81 0.78 650 1.71 0.70 650 1.54 0.50 650 1.52 0.50 650 1.70 0.46 650 1.86 0.34
Mother’s age (in years)
19 and under 350 2.28 0.68 300 2.06 0.79 300 1.32 0.47 250 1.40 0.49 300 1.64 0.48 300 1.69 0.4620–29 4,400 2.32 0.73 3,550 2.13 0.77 3,550 1.35 0.48 3,550 1.36 0.48 3,550 1.56 0.50 3,550 1.68 0.4730–39 4,300 2.36 0.75 3,450 2.15 0.80 3,400 1.36 0.48 3,400 1.33 0.47 3,450 1.50 0.50 3,400 1.70 0.4640 and over 750 2.27 0.76 550 2.12 0.80 550 1.42 0.49 550 1.39 0.49 550 1.54 0.50 550 1.78 0.42
Mother’s education
8th grade or below 450 1.93 0.75 300 1.91 0.78 300 1.47 0.50 300 1.46 0.50 300 1.57 0.50 300 1.63 0.489–12th grades 2,000 2.24 0.74 1,550 2.06 0.75 1,550 1.36 0.48 1,550 1.39 0.49 1,550 1.57 0.50 1,550 1.65 0.48High school diploma 2,100 2.29 0.73 1,650 2.12 0.77 1,650 1.35 0.48 1,650 1.38 0.48 1,650 1.56 0.50 1,650 1.71 0.45Vocational/technical 200 2.23 0.77 150 2.08 0.78 150 1.34 0.47 150 1.37 0.48 150 1.62 0.49 150 1.70 0.46Some college 2,350 2.39 0.73 1,900 2.15 0.77 1,900 1.36 0.48 1,900 1.33 0.47 1,900 1.53 0.50 1,900 1.73 0.45Bachelor’s degree 1,600 2.43 0.74 1,300 2.18 0.80 1,300 1.37 0.48 1,300 1.32 0.47 1,300 1.51 0.50 1,300 1.72 0.45Graduate school (no
degree) 150 2.66 0.58 150 2.25 0.75 150 1.28 0.45 150 1.21 0.41 150 1.43 0.50 150 1.65 0.48Master’s degree 700 2.57 0.66 600 2.33 0.87 600 1.32 0.47 600 1.30 0.46 600 1.42 0.49 600 1.66 0.47Doctoral/prof. degree 250 2.62 0.60 200 2.27 0.83 200 1.39 0.49 200 1.31 0.46 200 1.41 0.49 200 1.63 0.48
# Rounds to zero. 1 Race categories exclude Hispanic origin unless specified. NOTE: The parent weight, W2R0, was used to obtain these statistics. Cell counts are unweighted to show the distribution in the ECLS-B 2-year data collection. Detail may not sum to total due to rounding. Sample sizes have been rounded to the nearest 50. SOURCE: U.S. Department of Education, National Center for Education Statistics, Early Childhood Longitudinal Study, Birth Cohort (ECLS-B), 2-year data collection, 2003–04.