10 chapter 3shodhganga.inflibnet.ac.in/bitstream/10603/10192/10/10_chapter 3.pdf · 1 marathi 66.7...
TRANSCRIPT

Chapter 3
Spatial Distribution, Growth, Medium of Instruction , Infrastructure and Physical Facilities in Primary Schools by Type of Management - A
Comparative Analysis
3.1 Introduction
This section presents spatial distribution and characteristics of schools in terms of year of
establishment of school, growth and medium of instruction. A comparative analysis of
infrastructure and physical facilities by type of school management has been analysed by two
methods, namely, by the method of composite index and by the method of multivariate statistical
graphics—to be specific by Chernoff Faces – a statistical technique to represent k-dimensional
data graphically.). Further this section provides classification of primary schools by similarity of
infrastructure and physical facilities in each type of school management and to find schools
which were different in infrastructure and physical facilities, if any. That is to identify through
faces the schools which showed phenomenal differences -- (i.e. outliers) in each type of school
management. The secondary data is based on enumeration of all the 121 schools1. in Navi
Mumbai.
3.2 Types of Schools in Navi Mumbai - Spread and Clientele
There are three types of primary schools in Navi Mumbai, namely, ZP, NMMC and Private. The
ZP schools are the oldest schools; majority of NMMC schools came into existence in late
nineties and bulk of private schools was established after 1970. The NMMC schools are located
in Thane Taluka; ZP schools are situated in villages in Raigadh area of Navi Mumbai; whereas
private schools are located in all over the city. A few of the private schools are aided or partly
aided and follow the state government educational norms such as curricula, examination system
to maintain the uniformity in the educational standards.
The Private schools are both owned and run by private management. These schools may be run
by religious institutions, charitable trusts, private societies, education foundations etc.
1 Out of the total 243 primary schools in Navi Mumbai, there were only 121 primary schools which had classes from
1st to 7th standard..

Private schools follow state and central board syllabus. Table 3.1 provides percent of schools
(primary + secondary) functioning by type of management and students’ enrolment in each type
of the school.
As may be seen from the Table 3.1, the largest number (64%) of schools and also bulk (85.4%)
of students’ enrolments belonged to the private schools. ZP schools are primary schools. NMMC
and ZP schools together accounted for about one third (36%) of the total number of schools in
the city. Curiously enough, students’ enrolment (14.6%) in both the public schools, i.e., NMMC
and ZP, was too low as compared to students enrolled in private schools. Data clearly showed
preference of parents for private schools in Navi Mumbai.
Table 3.1 Distributions of Schools and Students’ Enrolments by Type of Management
ZP NMMC Private Total School 22% 14% 64% 100%
Enrolment 5.20% 9.40% 85.40% 100% Source: CIDCO (2010), Primary and Secondary Schools in Navi Mumbai
3.3 Spatial Distribution of Schools by Type of Management
3.3.1 Number and Location of Schools by Node/Area and Type of Management
The schools are located in 14 self-contained nodes including 95 villages, two Municipal
Councils and MIDC area2. Figure 3.1 showed that among the planned nodes, Nerul had the
largest percent ( 12.5%) of schools followed by Uran Taluka (11.6%), Vashi (9.7%) and
Airoli (7.2%). NMMC schools are located in first seven nodes and in MIDC area; whereas,
Zilha Parishad schools are found only in Panvel and Uran Talukas. Among the Private
Schools, again the largest number of schools was in Nerul followed by Vashi. These
observations suggest that by and large, the number of schools conform to the pace of
2 Panvel and Uran Talukas include villages, non-nodal areas and two Municipal Councils of Navi Mumbai. The
schools in the villages of respective nodes were included in that node

development of nodes/areas in time domain. For example, the Panvel Taluka was the oldest
area and thus have the highest number of schools.
Figure 3.1: Number of Schools by Location and Type of Management
3.3.2 Households by Mother Tongue
Mother tongue is a person's native language that is, a language learned from birth. Medium
of instruction is a language used in teaching. It may or may not be the official language of the
country or territory. Where the mother tongue or first language of s
the official language, it may be used as the medium of instruction for part or all of schooling.
Bilingual or multilingual education may involve the use of more than one language of
instruction.
Sanpada
Jui-Kamothe
Kalamboli
CBD-Belapur
Kharghar
New Panvel
Ghansoli
Koperkhairne
MIDC
Airoli
Vashi
Uran Taluka
Nerul
Panvel Taluka
development of nodes/areas in time domain. For example, the Panvel Taluka was the oldest
thus have the highest number of schools.
Figure 3.1: Number of Schools by Location and Type of Management
3.3.2 Households by Mother Tongue
Mother tongue is a person's native language that is, a language learned from birth. Medium
of instruction is a language used in teaching. It may or may not be the official language of the
country or territory. Where the mother tongue or first language of students is different from
the official language, it may be used as the medium of instruction for part or all of schooling.
Bilingual or multilingual education may involve the use of more than one language of
1.9%
2.3%
3.0%
3.2%
3.5%
3.7%
5.6%
6.3%
6.3%
7.2%
9.7%
11.6%
12.5%
development of nodes/areas in time domain. For example, the Panvel Taluka was the oldest
Figure 3.1: Number of Schools by Location and Type of Management
Mother tongue is a person's native language that is, a language learned from birth. Medium
of instruction is a language used in teaching. It may or may not be the official language of the
tudents is different from
the official language, it may be used as the medium of instruction for part or all of schooling.
Bilingual or multilingual education may involve the use of more than one language of
23.2%

Perhaps, only very few cities in the world offer education in as many medium of instructions
as Navi Mumbai does. Schools in Navi Mumbai offer primary education in five different
medium of instructions. This is because Navi Mumbai is mainly composed of migratory
populations from Mumbai, neighbouring states and other parts of the country. More than 14
languages were spoken by residents of Navi Mumbai (Table 3.2). However 67% of residents
speak Marathi, 15% Hindi and rest, few significant categories were, Gujarati
(3.3%),Malayalam and Tamil (2%) each speaking.
Table 3.2 Percent of Households by Mother Tongue in Navi Mumbai
Sr. No. Mother Tongue Percent Sr. No. Mother Tongue Percent
1 Marathi 66.7 8 Malayalam 2.4
2 Hindi 14.4 9 Kannada 1.2
3 Gujarati 3.4 10 Telgu 1.3
4 Punjabi 1.7 11 Oriya 0.5
5 Sindhi 0.5 12 Bengali 1.8
6 Urdu 0.9 13 English 0.6
7 Tamil 2.4 14 Any Other 2.2
Source: CIDCO (2011), Socio Economic Profile of Households in Planned Nodes in Navi Mumbai
3.3.3 Medium of Education by Mother Tongue
Table 3.3 reveals that more than 70% students in Navi Mumbai study in English medium
irrespective of their mother tongue. About 72% of Marathi speaking households prefers to
send their children in English medium schools and 27% households in Marathi medium.
Surprisingly north Indians (5%), south Indians(5%), Guajarati (7%) and other households
send their ward to Marathi medium schools, though their mother tongue may be other than
Marathi , they may be born and brought up in Maharashtra and may be staying from
generations. Many of them may be staying for more than 15 years, hence domicile of
Maharashtra state.

Table 3.3 Medium of Instruction of Students by Mother Tongue
Medium of Education (%)
S. No. Mother tongue Marathi English Others
1 Marathi 27 72 1
2 Hindi 8 82 10
3 South Indian Languages 5 93 2
4 North Indian Language 5 94 1
5 Gujarati 7 91 2
6 East Indian Language 3 95 2
7 English 0 100 0
8 Others 9 87 4 Source: CIDCO (2011), Socio Economic Profile of Households in Planned Nodes in Navi Mumbai
Figure 3.2 presented distribution of schools by medium of instruction. To meet the local
demand, the largest number (58%) schools offered Marathi as medium of instruction. All the
ZP and NMMC schools and few of the private schools had Marathi as medium of Instruction.
One third (33%) schools offered English as medium of instruction. Other medium of
instructions were Hindi (5%), Urdu (4.2%), and Gujarati (0.5%) in the schools of Navi
Mumbai.
Figure 3.2: Distribution of Schools by Medium of Instruction

3.3.4 Year of Establishment of Schools
The information available on the year of establishment of the schools suggested
of schools in Navi Mumbai were set
established only after 1970. Setting
decade, 60 new schools were established in different nodes
new schools from previous decade 1970
21.7% growth of schools was recorded. The period 2000
of new schools. In 9 year the number of
2000-2008. The increase in the number of schools in this period was maximum growth rate ever
recorded during the observation period (Figure 3.3).
Year of Establishment of Schools
The information available on the year of establishment of the schools suggested
of schools in Navi Mumbai were set-up before 1950. The schools in planned nodes were
established only after 1970. Setting-up of new schools got accelerated during 1980
decade, 60 new schools were established in different nodes/area registering 14.3% growth of
new schools from previous decade 1970-79. During the next 10 year period i.e. 1990
21.7% growth of schools was recorded. The period 2000 -2008 witnessed a boom in the increase
of new schools. In 9 year the number of schools rose from 21.7% in 1990
2008. The increase in the number of schools in this period was maximum growth rate ever
recorded during the observation period (Figure 3.3).
Marathi
58%
English
33%
Hindi
5%
Gujarati
0.5%
The information available on the year of establishment of the schools suggested that nearly 9%
up before 1950. The schools in planned nodes were
up of new schools got accelerated during 1980-1989. In this
/area registering 14.3% growth of
79. During the next 10 year period i.e. 1990-1999,
2008 witnessed a boom in the increase
schools rose from 21.7% in 1990-1999 to 32.2% by
2008. The increase in the number of schools in this period was maximum growth rate ever
Urdu
4%
Gujarati
0.5%

Figure 3.3: Year of Establishment of Schools
3.4 Construction of Composite Index for Measuring Infrastructure and Physical Facilities
at Primary Schools
An index for measuring quality of school by taking infrastructure and physical facilities was
formulated with a basic idea to identify the inputs which
level in terms of quality of education. The methodology used for the purpose was that of Morris
(1982), who used this method in finding the quality of life of the people in different states of
India and the same was employ
has been adopted here to construct the composite index for measuring the overall quality of
schools as measured through the infrastructure and physical facilities available in primary
schools of Navi Mumbai.
The present study was based on the primary schools from class 1 to class 7
1-7th standard were considered for infrastructure and physical facilities to maintain the
3Navi Mumbai is planned city and developed to attract the migrated population in Navi Mumbai instead of main city Mumbai. The schools are comparatively new and school authorities add one or more standard to their schools each year depending on the requirement. This is the reason primary to 2nd standard, pre primary to 4
0.0
5.0
10.0
15.0
20.0
25.0
30.0
35.0
Before
1950
1950-1959
9.1%6.9%
Figure 3.3: Year of Establishment of Schools
Construction of Composite Index for Measuring Infrastructure and Physical Facilities
An index for measuring quality of school by taking infrastructure and physical facilities was
formulated with a basic idea to identify the inputs which may maximize the output at school
level in terms of quality of education. The methodology used for the purpose was that of Morris
(1982), who used this method in finding the quality of life of the people in different states of
India and the same was employed to calculate the human development index. The same approach
has been adopted here to construct the composite index for measuring the overall quality of
schools as measured through the infrastructure and physical facilities available in primary
The present study was based on the primary schools from class 1 to class 7
standard were considered for infrastructure and physical facilities to maintain the
Navi Mumbai is planned city and developed to attract the migrated population in Navi Mumbai instead of main city Mumbai. The schools are comparatively new and school authorities add one or more standard to their schools each
nt. This is the reason schools in Navi Mumbai have different classes such as pre standard, pre primary to 4th standard, 2-4, 3-10, 1-4, 1-7, 1-6, 5-6, 5-9, 5-10, 5
1959 1960-1969 1970-1979 1980-1989 1990-1999
6.9%
11.7%
4.1%
14.3%
21.7%
Construction of Composite Index for Measuring Infrastructure and Physical Facilities
An index for measuring quality of school by taking infrastructure and physical facilities was
may maximize the output at school
level in terms of quality of education. The methodology used for the purpose was that of Morris
(1982), who used this method in finding the quality of life of the people in different states of
ed to calculate the human development index. The same approach
has been adopted here to construct the composite index for measuring the overall quality of
schools as measured through the infrastructure and physical facilities available in primary
The present study was based on the primary schools from class 1 to class 73. The schools having
standard were considered for infrastructure and physical facilities to maintain the
Navi Mumbai is planned city and developed to attract the migrated population in Navi Mumbai instead of main city Mumbai. The schools are comparatively new and school authorities add one or more standard to their schools each
schools in Navi Mumbai have different classes such as pre 10, 5-12.
1999 2000 &
after
21.7%
32.2%

uniformity. As stated earlier out of 243 schools, there were 121 schools having classes from
standard 1 to standard 7 in three types of management. The ZP school management had 50
schools; NMMC management had 34 schools and private management had 37 schools having
standards from 1st to 7th.
For compilation of the composite index, all infrastructure and physical facilities considered in the
study have been listed along with appropriate weights given against them in Table 3.4. The
overall facilities have been classified under four heads, namely infrastructure, health, sports
facilities and extra- curricular activities. The infrastructure and physical facilities such as library,
common room, fire fighting equipment, play ground etc were considered for constructing the
composite index. The detail of computation of the index is given below.
Let Xij represent the size or value of the ith indicator in jth school
Where ( i=1,2,……n, j=1,2,…….m).
Y ij = X ij- Min j X ij / Maxj X ij - Min j X ij ;
Where Min j X ij and Maxj X ij are respectively the minimum and maximum of
(X ij = X11, X12, ……………… X1m ).
The scale value Yij varies from zero to one.
From the values of Y [(Yij)], the index of the infrastructure and physical facilities of the jth school
has been computed as Mean Yij = W1 Y1j + W2 Y2j + …………… + Wn Ynj
Where W’s ( 0 < Wi <1 and ∑Wi =1) are arbitrary weights reflecting the relative importance of
the individual variable.
However, a more rational view would be to assume that the weights vary inversely as the
variation in the respective variable of infrastructure and physical facilities i.e. Wi = 1/ s. d. * (1/∑
s. d.), Where s.d. is standard deviation of the ith variable. If data fluctuates much than the
reliability of that indicator becomes less and the importance of that variable decreases
proportionately.

For classification purpose, let (0.0, 0.2), (0.21, 0.4), (0.41, 0.6), (0.61, 0.8), (0.81, 1.0) be linear
intervals such that each interval is to characterize the various types of schools by quality of
infrastructure and physical facilities. The index values have been computed by this method for
each of the school. Also on the basis of the values of the index the overall quality of schools was
measured and schools wre classified into five categories of quality, namely, ‘Very Poor’, ‘Poor’,
‘Moderate’, ‘Good’, ‘Very Good’.
The percentage of classification of schools using composite index was computed which was
given in Table 3.5. It can be revealed from the table that 90% of ZP schools and 41% of NMMC
schools were in the category of ‘very poor’. None of the Private schools were in the category of
‘very poor’ or ‘poor’. About one tenth of ZP schools and 47% of NMMC schools were
classified in ‘poor’ category. Nearly 8% of private school and 12% of NMMC schools were
classified into ‘moderate’ category. Only private schools found into ‘good’ (48%) and ‘very
good’ (44%) categories in terms of the quality of school measured by using various infrastructure
and physical facilities available in schools.
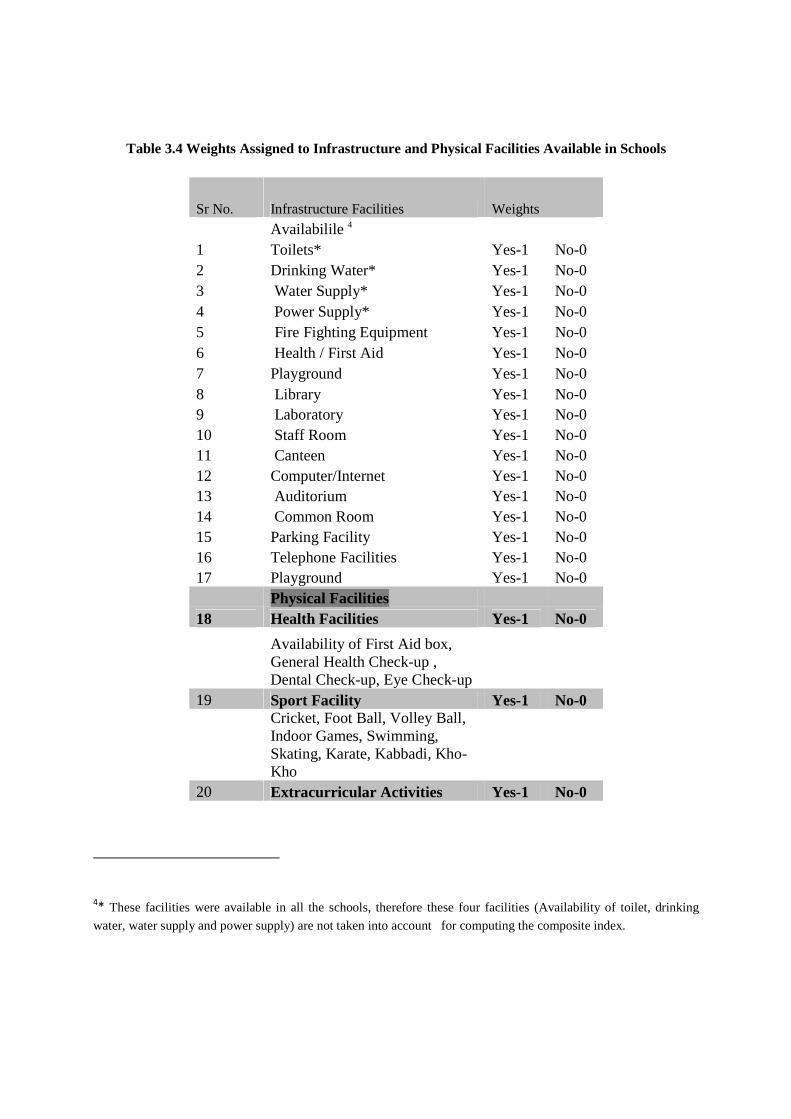
Table 3.4 Weights Assigned to Infrastructure and Physical Facilities Available in Schools
Sr No. Infrastructure Facilities Weights
Availabilile 4
1 Toilets* Yes-1 No-0 2 Drinking Water* Yes-1 No-0 3 Water Supply* Yes-1 No-0 4 Power Supply* Yes-1 No-0 5 Fire Fighting Equipment Yes-1 No-0 6 Health / First Aid Yes-1 No-0 7 Playground Yes-1 No-0 8 Library Yes-1 No-0 9 Laboratory Yes-1 No-0 10 Staff Room Yes-1 No-0 11 Canteen Yes-1 No-0 12 Computer/Internet Yes-1 No-0 13 Auditorium Yes-1 No-0 14 Common Room Yes-1 No-0 15 Parking Facility Yes-1 No-0 16 Telephone Facilities Yes-1 No-0 17 Playground Yes-1 No-0
Physical Facilities
18 Health Facilities Yes-1 No-0
Availability of First Aid box, General Health Check-up , Dental Check-up, Eye Check-up
19 Sport Facility Yes-1 No-0
Cricket, Foot Ball, Volley Ball, Indoor Games, Swimming, Skating, Karate, Kabbadi, Kho- Kho
20 Extracurricular Activities Yes-1 No-0
4* These facilities were available in all the schools, therefore these four facilities (Availability of toilet, drinking
water, water supply and power supply) are not taken into account for computing the composite index.

Drama / Acting, Photography, Elocution/Debate, Community Service and others
Table 3.5 Composite Index of Schools by Type of Management
Score Range of Composite Index
ZP
Schools
NMMC
Schools
PRIVATE
Schools
(Min, Max) N % N % N %
Very Poor-1 (0.00,0.2) 45 90 14 41 0 0
Poor-2 (0.21,0.4) 5 10 16 47 0 0
Moderate-3 (0.41,0.6) 0 0 4 12 3 8
Good-4 (0.61,0.8) 0 0 0 0 18 48
Very Good-5 (0.81,1.0) 0 0 0 0 16 44
Total 50 100 34 100 37 100
Table 3.6 showed average rank given to the index values. The first position was occupied by
private schools and second position was occupied by NMMC management. The last position
was assigned to ZP school management. It was concluded that ZP schools had less number of
infrastructure and physical facilities than that of other two school managements. The private
schools had most of the facilities, may be because these school charge high fees to the students.
Hence they could provide infrastructure and physical facilities required for overall development
of students.
Table 3.6 Average Rank based on Composite Index for Infrastructure and Physical Facilities of
Schools by Type of Management
Type of Management No of schools Sum of Rank Average rank Score
ZP 50 55 1.1 Third

NMMC 34 58 1.71 Second
Private 37 161 4.35 First
3.5 Assessment of Infrastructure and Physical Facilities through Chernoff Faces
3.5.1 Introduction
Graphical methods are well-known for data analysis because of effective means of depiction,
exploration, summarization and communication of data. Graphical methods are helpful in
suggesting suitable analytical procedures, and in explaining conclusions founded upon them.
Chernoff faces, invented by Herman Chernoff in 1972, display multivariate data graphically in the
shape of a human face. The individual parts, called face parameters, such as eyes, ears, mouth
and nose represent values of the variables by their shape, size, placement and orientation all
controlled by well defined mathematical functions. The idea behind using faces is that humans
easily recognize faces and notice small changes without difficulty. Chernoff faces handle each
variable differently. Because the features of the faces vary in perceived importance, the way in
which variables are mapped to the features should therefore be carefully chosen (e.g. eye size
and eyebrow - slant have been found to carry significant weight).
The method consists of vector value data point into geometrically constructed face, features of
which are controlled by the values taken for particular variable. The program variables are X1,
X2 …….. X20, for example X6 , variable may be assigned to the curvature of mouth, the X8 to the
length of the nose and so on. Thus the facial representation has an advantage over techniques of
other graphical methods such a Profile, Stars, Glyphs, Trees and Andrew’s Plots (See Saxena,
1983 and 1985). In Chernoff face programme, it is possible to map paired multivariate
measurements. X1=(x11, x12, …… x1k) and X2=(x21, x22, …… x2k) separately to right hand and left
hand side of the face. A face half which contains 20 parameters is constructed by an array Z= (z1,
z 2, … z20) belongs to (0,1), z1 values are used as construction of face part. The face program
allows the user to define for each variable xi an interval (ai , bi) may either be fixed by user or by
programme as multiples of standard deviations.

To asses overall quality of primary schools by type of management in Navi Mumbai, Chernoff
faces were constructed using software package called ‘STATISTICA’ version 10. This has
enabled us in characterizing quality of schools measured in terms of infrastructure and physical
facilities of different administrative system of primary education. For illustrative purpose, data
on infrastructure and physical facilities of 121 schools of different types of management have
been used. The infrastructure and physical facilities available in the schools were arranged based
on their importance in the respective schools. The vital facilities like drinking water, power
supply, availability of toilet and water supply were available in all the schools, therefore these
facilities were not taken into account while drawing the Chenoff faces. The other important
facilities were used for construction of faces such as library, canteen, computer, staff room, fire
fighting, common room for students, first aid/health, playground, telephone/P.C.O., parking
facility and extracurricular activities. The three types of management were represented by
development in their schools through important infrastructure and physical facilities.
The rationale of using Chernoff face – a technique to represent k-dimensional data graphically is
that simply by seeing the faces it is possible to place similar faces in a group and place altogether
different faces separately i.e. it is easily possible to identify multivariate outliers present in the
data. Saxena and Navneetham (1993) have shown that by seeing the gestalt of the faces,
hierarchical cluster structure of subjects (here primary schools) can be obtained through Chernoff
faces which may make possible to assess and compare the overall quality of schools by type of
management. From the gestalt of the faces, schools were classified according to availability of
infrastructure and physical facilities in each of the three types of management namely ZP,
NMMC and private. This technique has been used to place schools in the hierarchy of
development with respect to availability of infrastructure and physical facilities. The authors
observed that hierarchical cluster structure obtained through Chernoff faces can help in
identifying the variables which put faces at a different level within a group. From this
hierarchical order of the faces, the variation in the characteristics (variables) within a group can
also be studied. Simply, by looking at the faces, all those variables, which have been responsible
to place the faces within a group at different hierarchical levels, can easily be identified. This is
perhaps a unique feature which only faces or some other graphical techniques may reveal (see
Saxena and Navaneetham, 1993).

3.5.2 Faces with Extreme Values
Figure 3.4 illustrates the minimum value of the variables with 0 and maximum value of the
variables with 1 of all the 20 face parameters, which shows a profound effect on the appearance
of face features. The faces we propose contain 20 parameters for each side of the face.
The major difference in the face parameter were size of the face, eye pupils, nose, curvature of
mouth, eyebrows, size or radius of ear etc. We have assigned this variable to face features, the
face with the values 0 looks frown\saddest" and the face with the value 1 looks
smiling\happiest."
Figure 3.4: Chernoff Faces with Extreme Values
3.5.3 Construction of Chernoff Faces

Table 3.7 shows the variables and their assignment to face parameters. All the selected variables
were assigned to face parameters in the order given in Table 3.7. Assignment of the
infrastructure variable was in the same sequence for ZP, NMMC and private school management
to make the comparisons possible.
Table 3.7 : Chernoff Face Parameters and Variables
Sr. no. Facial Features Variables
1 Face width Library
2 Ear level Canteen
3 Half face height Sports Facilities
4 Eccentricity of upper face Play ground
5 Eccentricity of lower face Common room
6 Length of nose Computer
7 Position of center of mouth Fire fighting
8 Curvature of mouth Fire fighting
9 Length of mouth Fire fighting
10 Height of center of eyes Fire fighting
11 Separations of eyes Parking
12 Slant of eyes Telephone
13 Eccentricity of eyes Telephone
14 Half length of eyes Parking
15 Position of pupils Health facilities
16 Height of eyebrows Staff room
17 Angle of eyebrow Parking
18 length of eyebrow Staff room

19 Radius of ear Extra- curricular Activities
20 Nose width Computer
The assignments were chosen according to following considerations: the availability of fire
fighting facilities in the school was depicted by mouth, i.e. the variables number 7- 10 which
represented contour of face, span of mouth, position of centre of mouth and height of the centre
of eyes from mouth respectively. The face width corresponds to the availability of library and
face height corresponds to existence of sports facilities. The eccentricity of upper face was
represented by playground and eccentricity of lower face was controlled by availability of
common room for students. The nose related variables were shown by the facilities related to
computer in the primary schools. Level of ears and radius of ear represented the availability of
canteen facilities and extracurricular activities in the school. Variable 11 to 15 were related to
eyes. The separations or distance between eyes, length of eyebrows and angle of eye brows were
characterized by the availability of parking facility in the school. Eccentricity and slant of eyes
were controlled by the availability of telephone facility in the school. Position of pupils reflected
the availability of first aid or health facility. The height of eyebrows and length of eyebrows
were controlled by the availability of staff room.
3.6 Placement of Schools in the Hierarchy of Development by Type of School Management
using Chernoff Faces
The faces of three types of school management were shown to 21 respondents to identify the
cluster of faces which looked alike and which were unique or present outliers. Based on the
response of respondents the schools were arranged in hierarchy of development by type of school
management. Table 3.8 and Table 3.9 provided the details of availability of infrastructure and
physical facilities in public schools and Table 3.10 gave the details of non-availability of
infrastructure and physical facilities in private schools. The numbers of infrastructure and
physical facilities were listed in ascending order.
ZP School Management
The faces, which look alike in ZP school management (Figure 3.5), were school 13, 15, 22, 36,
38, 41, 48, 49. These schools did not have any infrastructure and physical facilities therefore, the

faces of these schools gave saddest look. Another cluster of schools, which looked similar,
consisted of school numbers 9, 10, 12, 18, 19, 20, 21, 23, 25, 27, 33, 35, 39, 40, 42, 44, 45, 47.
These schools had only playground and were lacking in other facilities. This could be seen from
eccentricity of upper face. A set of school numbers 34 and 37 had only extracurricular activities,
which could be identified from radius of ear. Another set of schools with numbers 30 and 46 had
better face because they had playground (eccentricity of upper face) and extracurricular activities
(radius of ear). School numbers 32 and 43 revealed the impression of having playground
(eccentricity of upper face) and staff room (height and length of eyebrows). The set of schools
with numbers 17 and 24 had playground and parking facilities. These faces looked somewhat
better because of eccentricity of upper face (playground), separations (distance) of eyes, length
of eyes and angle of eyebrow which represented the availability of parking facility. Another set
of school with numbers 4, 16, 28, 31 were identical because all of them had playground, staff
room, extracurricular activities. Schools with numbers 1, 2, 3, 5, 6, 7, 8, 11, 14, 29, 26 and 50
appeared to be unique, because these schools had the combination of facilities, which other ZP
schools did not have.
For example, school no. 26 had only library and school number 5 had playground, parking
facility, extracurricular activities and staff room.
Appendix III showed the data of ZP School Management for construction of Chernoff faces.


Figure 3.5 Chernoff Faces of ZP Schools
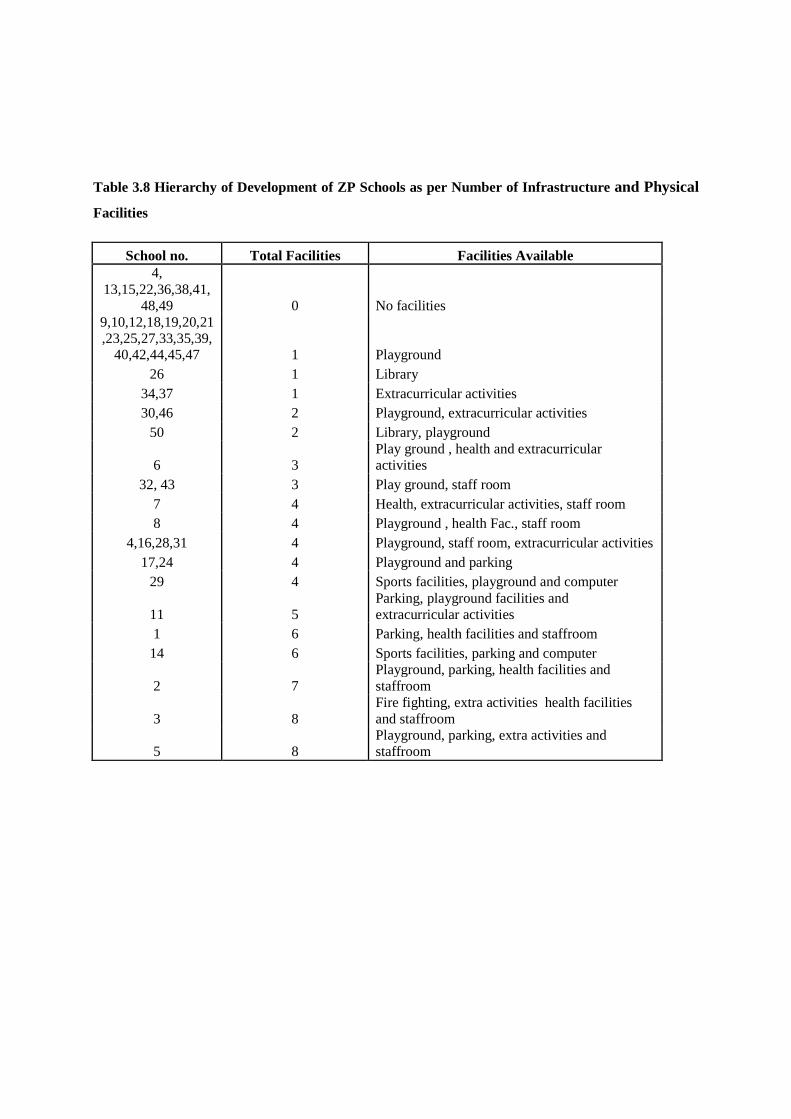
Table 3.8 Hierarchy of Development of ZP Schools as per Number of Infrastructure and Physical
Facilities
School no. Total Facilities Facilities Available 4,
13,15,22,36,38,41, 48,49 0 No facilities
9,10,12,18,19,20,21,23,25,27,33,35,39,
40,42,44,45,47 1 Playground 26 1 Library
34,37 1 Extracurricular activities 30,46 2 Playground, extracurricular activities
50 2 Library, playground
6 3 Play ground , health and extracurricular activities
32, 43 3 Play ground, staff room 7 4 Health, extracurricular activities, staff room 8 4 Playground , health Fac., staff room
4,16,28,31 4 Playground, staff room, extracurricular activities 17,24 4 Playground and parking
29 4 Sports facilities, playground and computer
11 5 Parking, playground facilities and extracurricular activities
1 6 Parking, health facilities and staffroom 14 6 Sports facilities, parking and computer
2 7 Playground, parking, health facilities and staffroom
3 8 Fire fighting, extra activities health facilities and staffroom
5 8 Playground, parking, extra activities and staffroom

Figure 3.6 Chernoff Face of NMMC Schools

Table 3.9 Hierarchy of Development of NMMC Schools as per Number of Infrastructure and
Physical Facilities
School no. Total
Facilities Facilities Available 16 2 Library and playground
25,26 2 Playground and extracurricular activities 30 2 Library and sport facilities 14 3 Library and staff room 24 3 Common room and staff room 19 4 Playground, computer and extra activities
21,27 4 Playground and parking 28 4 Library, sports facility and staff room
22, 23,31 5 Playground and fire fighting equipment
1 6 Common room, staff room and sport facilities, health and extra activities
9 6 Library, staff room, computer and playground 13 6 Fire fighting equipment & staff room 17 6 Library, fire fighting and extra activities
32 6 Playground, fire fighting equipment, extracurricular activities
10, 29, 34 7 Playground, staff room and fire fighting equipment
12,20 7 Library, sports facilities and fire fighting equipment
15 7 Library, playground, computer, staff room and extracurricular activities
18 8 Playground and fire fighting equipment, parking 33 8 Library, fire fighting, staffroom
4,8 9 Library, playground, sports facilities, parking health facilities, staff room
11 9 Library, sports facilities, fire fighting, playground, staff room
6 12 sports, common room, fire fighting, staff room, parking, health
2 13 Library, sports, common room, fire fighting, staff room, parking, health
3 13 Computer, sports, common room, fire fighting, staff room, parking, health
7 14 Sports, computer, fire fighting, staff room, parking, health, extracurricular activities

NMMC School Management
From the 34 Chernoff faces of NMMC schools (Figure 3.6), it was found that a set of school
numbers 25 and 26 had playground and extracurricular activities, which could be seen from
peculiarity of upper face and radius of ear. School numbers 21 and 27 of NMMC were at par
with ZP schools of numbers 30 and 46 because they had only playground (eccentricity of upper
face), extracurricular activities (radius of ear). School numbers 1, 2, 3, 5, 6, 7, 9, 13, 14, 15, 16,
17, 18, 19, 24, 30, 32, 33 were distinctive in the sense that each of them had disjoint set
(combination ) of infrastructure and physical facilities. Among these schools, school numbers 14,
16, and 19 had two to four facilities, school numbers 1, 9, 11, 13, 15,17,24, 30, 32, and 33 had
combination of facilities ranging from five to nine and remaining schools with numbers 2,3,7,
and 6 had maximum facilities ranging between 12 to 14. NMMC Schools with numbers 25 and
26 had playground which could be seen from eccentricity of upper face and extracurricular
activities (radius of ear). The set of schools 21 and 27 were looked somewhat better because of
eccentricity of upper face ( playground), separations (distance) of eyes, length of eyes and angle
of eyebrow which represented the availability of parking facility. Schools with number 28 had
library, sports facilities and staff room which could be observed from face width, ear level and
height of eyebrow. Another set of schools with numbers 22, 23 and 31 had playground and fire
fighting facilities. Similarly, school numbers 10, 29 and 34 had playground, staff room and fire
fighting equipment and set of schools with numbers 12 and 20 had library, sports facilities and
fire fighting equipment (Table 3.9).
Appendix IV showed the data of NMMC School Management for construction of Chernoff
faces.

Figure 3.7 Chernoff Face of Private Schools

Table 3.10 Hierarchy of Development of Private Schools as per Number of Infrastructure
and Physical Facilities
School no. Total of Facilities Facilities Lacking (not available) /26 12 Canteen, parking and fire fighting equipment 36 13 Library, canteen, parking, telephone 5 14 Common room, computer and parking 6 14 Fire fighting, computer
27,28,30 14 Canteen, common room and fire fighting equipment
32 14 Canteen, parking, telephone
20 14 Library, common room and fire fighting equipment
9 15 Computer and parking 1,15 15 Common room and fire fighting equipment 18,29 15 Canteen and fire fighting equipment
17 16 Canteen and fire fighting equipment 19 16 Library, parking, health
10,11,23 17 Canteen ,computer 4 17 Sports facilities, computer 14 17 Library, sports, common room
7,8, 16,21 18 Computer 31 18 Canteen and common room
33,37 18 Library and common room 22 19 Common room
24,25 19 Canteen 34,35 19 Library
2,3,12,13 20 -
Private School Management
The faces, which look alike in private school management, were schools with numbers 1 and 15.
These schools required the facilities of common room and fire fighting equipment. This could be
seen from eccentricity of lower face and length, curvature, position of mouth. Similarly, school
with numbers 18 and 29 were identical. These schools were lacking in providing canteen and fire

fighting facilities, which could be seen from the ear level and expression of mouth. School with
numbers 10, 11 and 13 were similar; these schools had all the facilities except canteen and
computer which were represented by ear level and nose (length + width). The schools 33 and 37
look similar; revealing a longish face with other similar facial parameters. In these schools
library and common room were required which could be seen by shape of face, by face width
and eccentricity of lower face. School numbers 27, 28 and 30 look similar. The year level, shape
of mouth and face were different from normal level because these schools needed canteen,
common room and fire fighting equipment. Figure 3.7 revealed that schools with numbers 4, 5,
6, 9, 14, 17, 19, 20, 22, 26, 31, 32, and 36 had different combination of facilities which were not
matching with other schools (due to different faces). For example, school number 4 did not have
sports facilities and canteen; there may not be any school which was lacking only in these two
facilities. A set of schools with numbers 7, 8, 16, 21 were in shortage of computers; whereas the
school with numbers 24 and 25 be deficient in canteen facilities. Similarly, schools with numbers
34 and 35 did not have library. There were 4 schools with numbers 2, 3, 12, and 13 which had all
the infrastructure and physical facilities which could be seen from gestalt of their faces (Table
3.10). Appendix V showed the data of Private School Management for construction of Chernoff
faces.
It could be evident from the facial expressions of the Chernoff faces that private school
management had smiling faces while majority of ZP and NMMC schools gave a frown look.
This implied that the majority of private schools had most of the infrastructure and physical
facilities; whereas public schools were lacking in the infrastructure and physical facilities. The
school faces were placed according to hierarchy of development in each of the three types of
school management. It was found that Chernoff face was easy method to recognise availability
of infrastructure and physical facilities. Since, by simply looking at faces, one can easily
recognise even small change, if any. From the facial expression of the ZP schools, it was found
that fire fighting facility, staff room and common room facilities were not available in any of
these schools. These facilities were represented by seven face parameters namely, contour of
face, span of mouth, position of center of mouth, height of center of eyes, height of eyebrows,
length of eyebrows and eccentricity of lower face. The happy faces of private school revealed

that majority of facilities were available in private management. These schools had funds
available for these facilities since these schools charge high fees; hence the management of
private schools may be able to provide more infrastructure and physical facilities. On the
contrary, the public schools suffer from financial crunch since they provide free education to
primary students and they are depending on government funds.
3.7 Comparison of Classification of Schools through Chernoff Faces Method and
Composite Index Method
Navaneetham (1994) observed that the inherent difficulty with the use of composite index is that
a particular score (value of index) can be obtained by a number combinations of the values of the
variables selected to construct the index. Further, the composite score (index) conceals much
more what it reveals about the data. Chernoff Face method overcomes this problem and helps in
studying in totality the data structure.
From the analysis it was observed that the use of Chernoff faces not only characterize the
availability of infrastructure and physical facilities of schools but also facilitates to find out
which variable(s) is/are responsible for classifying them into various stages of infrastructure and
physical facilities of schools. Such finer analysis may not be possible from the composite index
constructed by formal statistical procedures. Although, the composite index is useful to rank the
type of school management according to the level of infrastructure and physical facilities of
schools, the analysis using Chernoff faces may help to understand the differences with respect to
infrastructure and physical facilities within the management. This section has demonstrated the
efficacy of face analysis to confirm or contrast the findings observed from the composite index.
Further, if there were outliers present in the data, Chernoff faces technique had brought out this
fact in the analysis. Though the development index constructed by using formal statistical
procedures may be used for studying the overall infrastructure and physical facilities available in
the schools, but it may not be sufficient to contemplate the schools by level of infrastructure and
physical facilities of schools. Thus, the use of Chernoff faces along with the composite index
may supplement the information and may ameliorate the researcher’s ability to interpret the data
in a way that may be much more meaningful.