1.0 al:i 2 - eric · provide tests of statistical significance which are necessary to interpret ......
TRANSCRIPT

1.0 it 1124al: 2.2
IL-I111: IIIII 2 0
1.1
2.
11111
.25 111 1.4 11.6
MICROCOPY Pi 4,11IInN WIT CHAR I
DOCONENT BEMIRE
ID 174 644TM 009 464
TITLE The Effects of Coaching on Standardized AdmissionExaminations. Staff Memorandum cf the Boston RegionalOffice of the Federal Trade Commission.
INSTITUTION Federal Trade Commission, Washington, D.C. Bureau of
Consumer Protection.PUB DATE Sep 78NOTE 192p.; Data tables may not reproduce legibly because
of the poor print quality of the original document;The technical appendices were nct publicallyavailable as of August, 1979; Fcr related document,see TN 009 465
AVAILAFLE FROM Public Reference Branch, Room 130, Federal TradeCommission, Washington, D.C. 20580 (no charge)
EDES PRICE MF01 Plus Postage. FC Not Available from EDRS.
DESCRIPTORS Achievement Gains; *College Ent-.ance Examinations;Graduate Study; Higher Education; ImprovementPrograAs; Legal Education; Predictive Validity;
*Program Effectiveness; Racial Eifferences; *Scores;Senior High Schools; Testing Problems; *TestWiseness; *Tutorial Programs
IDENTIFIERS Coaching Schools; Law School Admission Test;*Schold:=tio Aptitude Test; *Test Coaching
ABSTRACTA non-experimental design was used to determine if
scores of students enrolled in specified major coaching schools were
significantly higher than scores of comparable uncoached groups.
Score increases at two Scholastic Aptitude Test (SAT) coaching
schools and Law School Admission Test (LSAT) schools were compared.
Over 1,400 SAT examinees and 31,000 LSAT examinees, administered
these tests between 1974 and 1977, were involved. Comparisons were
reported by study subgroup: uncoached first-time examinees; coached
first-time examinees; uncoached second-time examinees; second-time
examinees coached berore +he first test; and second-time examinees
coached between test adrinistrations. Results indicated that coaching
was significantly effective in raising SAT scores. LSAT coaching was
marginally effective, possibly because of the abnormally large-
control group increases and the relatively low co-,:relation between
grade point average and LSAT scorns. However, the Federal TradeCommission acknowledges that there are "several major flaws in the
data analysis, making the results unreliable." (The history of both
tests, an analysis of coaching research; a description of the sales,
tuition costs, and claims of major coaching schools; extensive graphs
of test score data; and case histories nt 17 coached LSAT examinees
are included). (CP)
***********************************************************************Reproductions supplied by EDAS are the best that can be made
from the original document.***********************************************************************

MCTICE TO RECIPIENTS OF THEBOSTON REGIONAL OFFICE REPORT ON THE
EFFECTS OF COACHING ON STANDARDIZED ADMISSION EXAM.
U S DEPARTMENT OF HEALTH.EDUCATION S. WELFARENATIONAL INSTITUTE OF
EDUCATION
THIS DOCUMENT 1145 BEEN REPRO.DUCED EXACTLY A5 RECEIVED FROMTHE PERSON OR ORGANIZATION ORIGIN.ATING IT POINTS OF VrEev DR OPINIONSSTATED DO NOT NECESSARILY REPRE.SENT OFFICIAL NATIONAL INSTITUTE OFEDUCATION POSITION OR POLICY
The attacheC "Staff Memorandum on the Effects of Coaching on
Standardized Admission Examinations," prepared by the Boston Regional
Office of the Federal Trade Commission, has several major flaws in the
data analysis, making the results unreliable. Brief explanations of
each of the major flaws are described below.
In this report standardized exam scores (Scholastic Aptitutde Test,
or SAT, and Law School Admission Test, or LSAT) are compared for groups
of coached and uncoached students without controlling for differences
which may exist in personal and demographic characteristics of the
students in the two groups. Subsequent analysis has determined that there
are important differences between the coached and uncoached groups, making
it impossible to attribute any observed differences in SAT scores to
coaching.
To illustrate, students who are coached for the SAT have, on average,
higher grades than students who are not coached. It is not possible to
know, without controlling for grad,-s, if SAT score differences between
the two groups are due to coaching or to the differences in ability
reflected in such factors as past school performance.
In addition to failing to use the data available to control for
differences in personal and demographic characteristics of the students,
the results reported cannot 1.2 evaluated because the report fails to
provide tests of statistical significance which are necessary to interpret
the results. Because the report fails to provide these important statistic:,
one cannot determine if the results reported are meaningful or are
merely due to chance.
411S141111/1110
Another defect in the report concerns the method used to present
the findings from the data analysis. This is especially true for the
cribanalysis of the LSAT performance. In that section of the report, the
analytical technique employed is misused, causing flaws in the presentation
111121
of the results. For example, in a number of places, findings are presented
for students who have a grade point average of 1.0 (a D average).
Because there are no such students in the sample, it is not legitimate
is predict the behavior of this class of students. Moreover, because
virtually no students with a D average would ever take the LSAT exam, it
is inappropriate to discuss the findings interms of this group instead
of in terms of students with more typical grade point averages.
Finally, this study utilized a nonexperimental design, Therefore
all the limitations associatedwith this type of study apply to this
/ report.
Bureau of Consumer Protection
0, May 1379

DATE:
REPLY TOATTN OP:
September 11, 1978
Arthur E. Levine, AttorneyBoston Regional Office
UNITED STATES GOVERNMENT
memorandumProgram Code 116
OBJECT: Unnamed Test Preparation Services, Pile 772 3000Stanley H. Kaplan Educational Center, Ltd., File 762 3033Educational Testing Service, File DB8 0013
TO: Federal Trade Commission
VIA: Bureau of Consumer Protection
I am transmitting herewith the staff memorandum of theBoston Regional Office on The Effects of Coaching on StandardizedAdmission Examinations. This memorandum encompasses thethree above-captioned cases.
Buy U.S. Savings Bonds Regularly on the Payroll Savings Plan OPTIONAL roRm NO. 10
4(REV. 7-70)OSA VPMN (tt GM) 1014t.010104 IS

ACKNOWLEDGEMENT
Dr. Conrad Strack, of C.A.C.I., who gave invaluable assistance
in the preparation of some of the technical aspects of this
memorandum deserves special acknowledgement, as do lay col-
leagues in the Boston Regional Office, especially E-ancis
X. McDonough.
ii
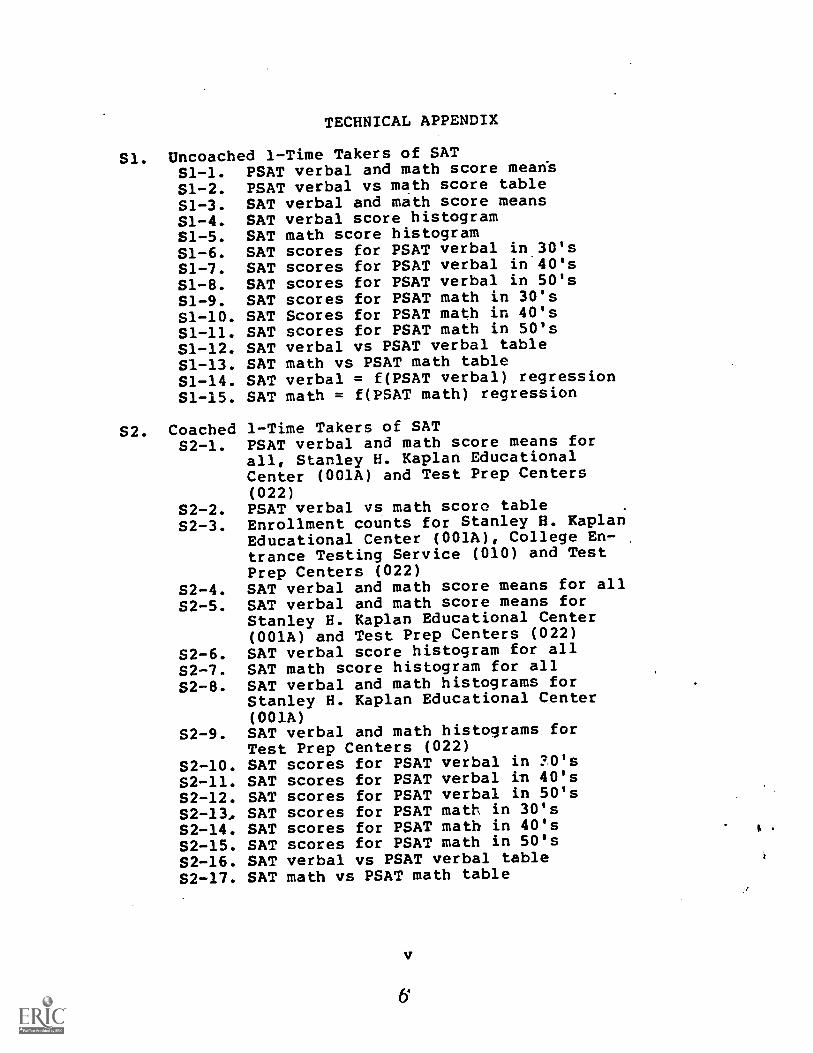
TECHNICAL APPENDIX
Si. Uncoached 1-Time Takers of SAT
S1-1. PSAT verbal and math score means
S1-2. PSAT verbal vs math score table
S1-3. SAT verbal and math score meansS1-4. SAT verbal score histogram51-5. SAT math score histogramS1-6. SAT scores for PSAT verbal in 30's
S1-7. SAT scores for PSAT verbal in 40's
S1-8. SAT scores for PSAT verbal in 50's
S1-9. SAT scores for PSAT math in 30'sS1-10. SAT Scores for PSAT math in 40'sS1-11. SAT scores for PSAT math in 50'sS1-12. SAT verbal vs PSAT verbal tableS1-13. SAT math vs PSAT math tableS1-14. SAT verbal = f(PSAT verbal) regressionS1-15. SAT math = f(PSAT math) regression
S2. Coached 1-Time Takers of SATS2-1. PSAT verbal and math score means for
all, Stanley H. Kaplan EducationalCenter (OO1A) and Test Prep Centers(022)
S2-2. PSAT verbal vs math score table
S2-3. Enrollment counts for Stanley H. KaplanEducational Center (OO1A), College En-trance Testing Service (010) and TestPrep Centers (022)
S2-4. SAT verbal and math score means for all
S2-5. SAT verbal and math score means for
Stanley H. Kaplan Educational Center(OO1A) and Test Prep Centers (022)
S2-6. SAT verbal score histogram for all
S2-7. SAT math score histogram for all
S2-8. SAT verbal and math histograms forStanley H. Kaplan Educational Center(001A)
S2-9. SAT verbal and math histograms forTest Prep Centers (022)
S2-10. SAT scores for PSAT verbal in ?O'sS2-11. SAT scores for PSAT verbal in 40'sS2-12. SAT scores for PSAT verbal in 50'sS2-13, SAT scores for PSAT math in 30'sS2-14. SAT scores for PSAT math in 40'sS2-15. SAT scores for PSAT math in 50'sS2-16. SAT verbal vs PSAT verbal tableS2-17. SAT math vs PSAT math table

S2. . Coached 1-Time Takers of SAT (cont'd)
S2-18. SAT verbal = f(PSAT verbal) regressions
for all, Stanley H. Kaplan EducationalCenter (001A) and Test Prep Centers (022)
S2-19. SAT math = f(PSAT math) regressions for
all, Stanley H..Kaplan Educational Center(OO1A) and Test Prep Centers (022)
S3. Uncoached 2-Time Takers of. SAT
S3-1. PSAT verbal and math score means
S3-2. SAT first score, second score, andscore gain means
S3-3. First SAT verbal score histogram
S3-4. First SAT math score histogram
S3-5. Second SAT verbal score histogram
S3-6. Second SAT math score histogram
S3-7. SAT score gain histograms
S3-8. PSAT verbal vs math table
S3-9. First SAT verbal vs PSAT verbal table
S3-10. First SAT math vs PSAT math table
S3-11. First SAT verbal = f(PSAT verbal) re-
gressionS3-12. First SAT math = f(PSAT math) regres-
sionS3-13. Second SAT verbal = f(first SAT verbal)
regressionS3-14. Second SAT math = f(first SAT math)
regressionS3-15. Second SAT verbal = f(PSAT verbal)
regressionS3-16. Second SAT math = f(PSAT math) regression
S4. 2-Time Takers of SAT Coached Before First Attempt
S4-1. PSAT verbal and math score means
S4-2. SAT first score, second score, and score
gain meansS4-3. First SAT verbal score histogram
S4-4. First SAT math score histogram
S4-5. Second SAT verbal score histogram
S4-6. Second SAT math score histogram
S4-7. SAT score gain histograms
S4-8. Enrollment counts for Stanley H. Kaplan
Educational Center (OO1A), College En-
trance Testing Service (010), and Test
Prep Centers (022)'
S4-9. PSAT verbal and math score means for
Stanley H. Kaplan Educational Center(001A) and Test Prep Centers (022)
S4-10. SAT first score, second score, and
score gain means
vi

S4. 2-Time Takers of SAT Coached Before First Attempt (cont'd)S4-11. SAT first score, second score, and
score gain histograms for Stanley H.Kaplan Educational Center (OO1A) andTest Prep Centers (022)
S4-12. PSAT verbal vs math score tableS4-13. First SAT verbal vs PSAT verbal tableS4-14. First SAT math vs PSAT math tableS4-15. First SAT verbal = f(PSAT verbal) re-
gressions for Stanley H. Kaplan Educa-tional Center (OOlA) and Test PrepCenters (022)
S4-16. First SAT math = f(PSAT math) regres-sions for Stanley H. Kaplan EducationalCenter (OO1A) and Test Prep Centers (022)
S4-17. Second SAT verbal = f(first SAT verbal)for Stanley H. Kaplan Educational Center(001A) and Test Prep Centers (022)
S4-18. Second SAT math = f(PSAT math) forStanley H. Kaplan Educational Center(OO1A) and Test Prep Centers (022)
S4-19. Second SAT verbal = f(PSAT verbal)for Stanley H. Kaplan EducationalCenter (OO1A) and Test Prep Centers t022)
S4-20. Second SAT math = f(PSAT math) forStanley H. Kaplan Educational Center(OO1A) and Test Prep Centers (022)
S5. 2-Time Takers of SAT Coached Between AttemptsS5-1. PSAT verbal and math score meansS5-2. SAT first score, second score, and
score gain meansS5-3. First SAT verbal score histogramS5-4. First SAT math score histogramS5-5. Second SAT verbal score histogramS5-6. Second SAT math score histogramS5-7. SAT score gain histogramsS5-8. Enrollment counts for Stanley H.
Kaplan Educational Center (OO1A),Cellege Entrance Testing Service-(010) and Test Prep Centers (022)
S5-9. PSAT verbal and math score meansfor Stanley H. Kaplan EducationalCenter (OOlA) and Test Prep Centers(022)
S5-10. SAT first score, second score, andscore gain means for Stanley H. KaplanEducational Center (OO1A) and TestPrep Centers (022)
vii

S5. 2-Time Takers of SAT Coached Between Attempts (coned)S5-11. SAT first score, second score, aria
score gain histograms for Stanley H.Kaplan Educational Center (OO1A)and Test Prep Centers (022)
S5-12. PSAT verbal vs math score tableS5-13. First SAT verbal vs PSAT verbal tableS5-14. First SAT math vs PSAT math tableS5-15. First SAT verbal = f(PSAT verbal)
regressions for Stanley H. KaplanEducational Center (OO1A) and TestPrep Centers (022)
S5-16. First SAT math = f(PSAT math) regres-sions for Stanley H. Kaplan EducationalCenter (001A) and Test P:ep Center (022)
S5-17. Second SAT verbal = f(first SAT verbal)regressions for Stanley H. Kaplan Educa-tional Center (OO1A) and Test PrepCenters (022)
S5-18. Second SAT math = f(first SAT math)regressions for Stanley H. KaplanEducational Center (OO1A) and TestPrep Centers (022)
S5-19. Second SAT verbal = f(PSAT verbal)regressions for Stanley H. KaplanEducational Center (OO1A) and TestPrep Centers (022)
S5-20. Second SAT math = f(PSAT math) regres-sions for Stanley H. Kaplan EducationalCenter (OO1A) and Test Prep Centers (022)
SW. SAT Window AnalysisSW-1. Coached 2-time takers of SATSW-2. Coached 3-time takers of SATSW-3. Uncoached 2-time and 3-time takers
of SAT
SDQ. SAT SDQ and ZIP ProfilesSDQ -l. Uncoached 1-time takers of SATSDQ-2. Coached 1-time takers of SATSDQ-3. Uncoached 2-time takers of SATSDQ-4. 2-time takers of SAT coached before
first attemptSDQ -5. 2-time takers of SAT coached between
attempts
viii
9
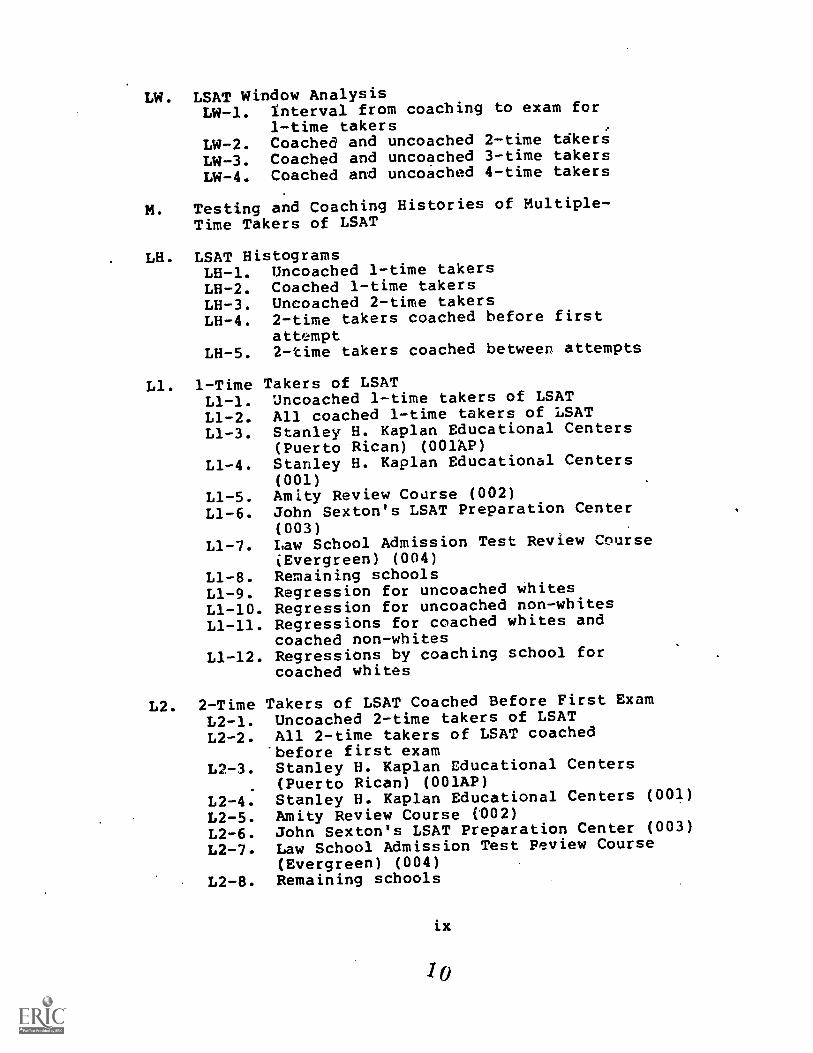
LW. LSAT Window AnalysisLW-1. interval from coaching to exam for
1-time takersLW-2. Coached and uncoached 2-time tdkers
LW-3. Coached and uncoached 3-time takers
LW-4. Coached and uncoached 4-time takers
M. Testing and Coaching Histories of Multiple-Time Takers of LSAT
LH. LSAT HistogramsLH-1. Uncoached 1-time takersLH-2. Coached 1-time takersLH-3. Uncoached 2-time takersLH-4. 2-time takers coached before first
attemptLH-5. 2-time takers coached between attempts
Ll. 1-Time Takers of LSATL1-1. Uncoached 1-time takers of LSATL1-2. All coached 1-time takers of LSAT
L1-3. Stanley H. Kaplan Educational Centers(Puerto Rican) (001AP)
L1-4. Stanley H. Kaplan Educational Centers(001)
L1-5. Amity Review Course (002)L1-6. John Sexton's LSAT Preparation Center
(003)L1-7. Law School Admission Test Review Course
(Evergreen) (004)L1-8. Remaining schoolsL1-9. Regression for uncoached whitesL1-10. Regression for uncoached non-whitesL1-11. Regressions for coached whites and
coached non-whitesL1-12. Regressions by coaching school for
coached whites
L2. 2-Time Takers of LSAT Coached Before First Exam
L2-1. Uncoached 2-time takers of LSATL2-2. All 2-time takers of LSAT coached
'before first examL2-3. Stanley H. Kaplan Educational Centers
(Puerto Rican) (OO1AP)L2-4. Stanley H. Kaplan Educational Centers (001)
L2-5. Amity Review Course (D02)L2-6. John Sexton's LSAT Preparation Center (003)
L2-7. Law School Admission Test Peview Course(Evergreen) (004)
L2-8. Remaining schools
ix
Jo

L2. 2-Time Takers of LSAT Coached Before First Exam (coned)L2-9. Regressions for uncoached whitesL2-10. Regressions for uncoached non-whitesL2-11. Regressions for coached whites-and non-
whitesL2-12. Regressions by coaching school for
coached whites
L3. 2-Time Takers of LSAT Coached Between Exams
L3 -l. All 2-time takers of LSAT coachedbetween exams
L3-2. Stanley H. Kaplan Educational Centers(Puerto Rican) (001AP)
L3-3. Stanley H. Kaplan Educational Centers(001)
L3-4. Amity Review Course (002)L3-5. John Sexton's LSAT Preparation Center
(003)L3-6. Law School Admission Test Review Course
(Evergreen) (004)L3-7. Remaining schoo7sL3-8. Regressions for coached whites and
coached non-whitesL3-9. Regressions by coaching school for
coached whites

I. SUMMARY
It is the established policy of the United States to
provide equal educational opportunities for all citizens.
Rcognizing that the Nation's economic, political, andsocial security require a well-educated citizenry, the
Congress (1) reaffirms, as a matter of high priority,
the Nation's goal of equal educational opportunity, end(2) declares it to be the policy of the United States
of America that every citizen is entitled to an educa-tion to meet his or her full potential without financial
barriers.1/
The present investigation discloses that standardized
examinations which are utilized as important decision making
elements in the admission process to undergraduate and
graduate colleges and universities are susceptible to the
short-term preparation (often called coaching) offered by
numerous commercial entities throughout the United States.
Analysis reveals that there is a statistically signifi-
cant difference between the score increases obtained by
coached and uncoached individuals. (However, the score in-
creases are variable both between and within examinations.)
Even more importantly, score increases resulting from coaching
have a practical, educationally meaningful, effect in that
coaching can be the determining factor in deciding who is
admitted to undergraduate and graduate colleges and univer-
sities. The availability of coaching is positively correlated
1/ General Education Provisions Act, 20 U.S.C.A 51221-1
(1978).
12
1

to the ability to pay the tuition at coaching schools, which
can be as high as $250. Therefore coachable standardized
admission examinations create financial barriers to educa-
tional opportunities in direct conflict with our Congression-
ally declared national education policy.
The commercial test preparation schools do not perform
uniformly. Some are quite beneficial while others appear to
provide marginal benefits. Moreover, the coaching schools
have a universal propensity for engaging in making unsub-
stantiated advertising claims, in some instances making false
and deceptive advertising claims, and engaging in other unfair
and deceptive marketing practices, all in violation of Section
5 of the Federal Trade Commission Act.
Nonethele.s the existence of only one coaching school
(and there is more than one) that can materially increase
individuals' scores on standardized admission examinations
such as the Scholastic Aptitude Test and the Law School Admis-
sion Test reveals the lack of reliability and validity of
these examinations. The test makers themselves tell us that
standardized admission examinations should be used to help
predict the academic performance of an individual in under-
graduate or graduate school. Yet, since short-term prepara-
tion can increase scores, but has a questionable long-term
effect, the true predictive value of the standardized exam-
inations is suspect.
2
13

The standardized admission examinations are discrimina-
. tory in a number of ways. They discriminate against any indi-
vidual who either: (1) can not afford the cost of commercial
preparation or (2) elects not to attend a commercial prepara-
tion course even if he can afford it because of acceptance of
',)e dogma promulgated by the test makers, test administrators,
and test users over the past twenty years that coaching is
valueless.
The examinations appear to discriminate on the basis of
race. Certain sub-populations may receive a lesser benefit
from coaching than others. (However as grade point average
approaches the maximum there is an apparent inverse effect as
minorities show slightly greater score increases due to
coaching.) This result may be attributed to the failure of
coaching schools to develop materials and techniques aimed at
these groups or it may be a manifestation of an inherent bias
in the examinations themselves. Whatever the cause, the
effect is to put minorities with low grade point averages at
a greater disadvantage in the quest for positions in our
schools of higher education by widening the already existing
score abyss.
The economic and social benefits flowing from admission
to undergraduate and graduate colleges and universities
3

(especially the more prestigious) are axiomatic. The suscepti-
bility of standardized examinations to coaching, the unavaila-
bility of coaching to all on an equal basis, the discriminatory
effects befalling some groups who benefit less from coaching
than others, and the failure to rectify this situation, con-
stitute violations of Section 5 of the Federal Trade Commis-
sion Act or are indicia of serious flaws in both the post
secondary school admission process and in our national edu-
cation system.
Accordingly, we propose for Commission consideration
some or all of the following remedial actions to alleviate
or eliminate the unfair and deceptive acts or practices
we have discovered:
(a) Publication of either . staff report or formal
Section 6(f) report to Congress;
(b) Initiation of formal investigations of the Educational
Testing Service, College Entrance Examination Board, Law
School Admission Council, and American Bar Association
(These investigations would seek to ascertain the
extent of our jurisdiction over the investigated parties
and we would simultaneously seek to negotiate consent
agreements. Complaint recommendations, if appropriate
and necessary, would follow these investigations);
(c) Additional studies to supplement the statistical
analysis we have completed and which ultimately would
4
15

lead to an attempt to create uncoachable, more valid
and reliable standardized admission examinations;
(d) Initiation of a trade regulation rule proceeding
regarding the coaching school industry or alternatively
individual litigation against the coaching school with
the most egregious violations of Section 5.
These and other alternatives are explained in greater detail
in the recommendations section, infra.
II. INTRODUCTION
On October 13, 1976, the Federal Trade Commission issued
a resolution authorizing and directing its Boston Regional
Office (BRO) to conduct an investigation:
To determine whether or not various examination and testpreparers, review courses, coaching schools and otherpersons, partnerships, or corporations, may have been,or may now be engaged in unfair or deceptive acts and
practices in or affecting commerce in violation of Sec-tion 5 of the Federal Trade Commission Act, as amended,including but not limited to false, misleading and de-ceptive advertising, non-disclosure of material facts,unfair and deceptive point of sale misrepresentations,and other unfair or deceptive acts and practices inconnection with the advertising, offering for sale, saleand distribution of the services and products of varioustest preparers, review courses, and coaching schools.The investigation is also intended to determine whetherCommission action to obtain consumer redress wou1:1 be
in the public interest.2 /.
2/ See Category I File 772 3000, Vol. I, p. 1.
5

An FTC news release 3/ dated November 2, 1976 publicly
announcing the investigation indicated that the investigation
would be designed to provide insight into such issues as:
. whether test preparation centers have had or now have areasonable basis for claims of score increases at thetime such claims were or are made;
. whether test preparation centers have the capacity toincrease or maximize scores on certain standardizedtests that are often prerequisites to admission toundergraduate or graduate colleges, universities, pro-fessional schools or profession's;
. whether test preparation centers have the capacity toincrease scores on certain standardized tests to thedegree advertised;
. whether test preparation centers are engaged in unfairor deceptive point-of-sale practices; and
.whether Commission action to obtain consumer redresswould be in the public interest.
Prior to commencing the nationwide investigation announced
in the November 2, 1976 press release, staff had been investi-
gating the Stanley H. Kaplan Educational Center, Ltd. (File No.
762-3033).4/ After much cerebration and consult.ation with
experts in the field 5/ staff concluded that a national in-
3/ See Category III File 772 3000, Vol. I, p.88.
4/ The investigation of the Kaplan organization formallycommenced on August 18, 1975. Its original premise wasthat Kaplan could not substantiate certain advertisingclaims at the time they were made and accordingly hadviolated-Pfizer, 81 FTC 23 (1972).
5/ See Category III File 762 3033, Vol. I, p.83-84, 100-101;Category I File 772 3000, Vol. I, p.47-48; Category IFile 772 3000, Vol. II, p.1-2, 14-16, 34-39.
6
17

vestigation of the test preparation industry would be far
more' cost efficient and better serve the public interest
than an investigation of only one coaching school.6/ The
investigation of Stanley H. Kaplan Educational Center,
Ltd., although retaining its own 7-digit number has therefore
been incorporated into the industrywide inquiry.
III. A HISTORY OF THE SCHOLASTIC APTITUDE TEST (Shr), THE LAW
SCHOOL ADMISSION TEST (LSAT), THEIR USES BY COLLEGES,
LAW SCHOOLS, AND OTHERS
The SAT, LSAT and other standardized admission examina-
tions are intermediate predictors. They do not purport to
measure how an individual will perform in a given profession
or field. Instead it is suggested by the administrators
of these examinations that they be used as one criterion in
predicting how well an individual will perform in the first
year of academic study.7/
The need for a universal predictor of first year academic
performance is indicated by:
(1) the variance in meaning of grades from different
schools and curricula;
(2) the inability of admissions offices to cope with
large numbers of applications on a personal basis;
6/ See Category I Fill 772 3000, Vol. I, p.9-10.
7/ Guide To The Admissions Testing Program, p.21, CEEB,
iir(977).
7
8

(3) the inability of graduate scnools (and some under-
graduate schools) to expand their enrollments to meet
demand; and
(4) the desire to minimize the attrition rate;
(a) because of the psychological and economic hard-
ships on students who fail; and
(b) because of the economic disutility of a high
attrition rate to academic institutions.
On November 17, 1900 the College Entrance Examination
Board (CEEB) officially commenced operations. Seven months
later 973 students wrote essay examinations on subjects in-
cluding history, english, mathematics, science, and foreign
languages. The grades received on those examinations were
sent to participating colleges to be used as part of the
admission procedures. By June of 1925 College Board examina-
tions were being taken by approximately 20,000 candidates.
In June of 1926, 8,040 candidates for admission to
college received the first administration of the Scholastic
Aptitude Test (SAT). The SAT had been developed for CEEB
by Carl B. Brigham, a professor of psychology at Princeton.
Its initial purpose was to supplement the regular series
of CEEB examinations.
As the number of applicants for admission to colleges
rapidly rose (excepting a regression during tIe.depression),
the numbers alone made the essay format of the College Boards
8 19
impractical. In 1946 some 46,000 applicants took the College
Boards. Although traditionalists grumbled, the multiple-
choice format of the SAT was a natural substitute.
In 1947 CEEB, in cooperation with the American Council of
Education (the Graduate Record Exam) and the Carnegie Founda-
tion for the Advancement of Teaching (which administered the
National Teachers Exam), founded the Educational Testing
Service (ETS).
ETS' initial client was CEEB, and as a result it
administered and continues to administer the SAT and college
achievement tests. Since its inception ETS has diversified
and now administers, researches, and refines numerous
standardized admission and vocational examinations including
the LSAT, GRE, GMAT as well as the SAT and achievement tests.
Today approximately 1.5 million students per year take
the SAT. The SAT coupled with ETS' other testing activities
accounted for about 87% of ETS' $70 million revenue in
fiscal 1977.
The specific use to which the SAT has been put in the
past decade has varied from college to college and from year
to year. In general the SAT was most important in the
admission process during the post-Sputnik era when competi-
tion for college admission became intense. Most colleges
9
20
responded by raising their standards rather than increasing
enrollment, and test scores therefore became critical.8/
With decreasing applications and enrollment expansion the
SAT today is generally less critical in the admission process
than it was in the 1960's. However it is still crucial for
those seeking admission to "high prestige" schools. It
appears that for schools other than, the highly selective the
SAT is most important at the bottom line. That is, failure
to obtain a certain minimum score will result in rejection.
For example the California State University and Colleges
System requires a minimum combined score of 2500 on the
SAT plus three achievement tests and a B average. If a student
fails to attain a 3.1 high school average (B-) the University
of California/Berkeley requires a minimum combined SAT score of
1100 plus a minimum score of 1650 on three achievement tests.
Oregon State University requires a minimum combined SAT score
of 890 or a high school average of 2.50. Florida State Uni-
versity requires out of state students to obtain a minimum.
score of 500 on both the verbal and mathematical sections of
the SAT while Florida Technological University requires out of
state students to have a combined minimum SAT score of 900.
The University of South Florida requires out of state appli-
8/ See generally, 2 The_Encyclopedia of Education, p.211-213, The Macmillan Co. and The Free Press 1971;Ravitch, The College Boards, The N.Y. Times Magazine,May 4, 1975, p.12-22; Ssiencel-alest, DEaTer 1976,p.39-45; Forbes, November 15, 1976, p.94.
10 21
cants to obtain a combined SAT score of 800 with a minimum
of 400 on the SAT verbal. North Texas State University re-
quires a minimum combined SAT score of 675 and the University
of Mississippi requires a combined minimum SAT score of 680.
Princeton University, Smith College, Stanford University,
Wellesley College, Brown University, University of Chicago,
Yale University, and Massachusetts Institute of Technology,
among others, all accept freshman classes in which over 90% of
the admittees score over 500 on both the SAT verbal and SAT
mathematical sections.9/
As is evidenced by the figures above some universities
prescribe definitive minimum cutoffs and at others the fail-
ure to obtain a certain minimum score means almost certain
rejection.
In some instances where high schools refuse to send
grades to colleges or where a high school is relatively un-
known to a college admissions office the SAT becomes the sole
criterion for admission. Furthermore New York State has
substituted the SAT for its traditional Regent's Exam to
determine scholarship recipients.l0/
9/ The sources for SAT score data are Comparative Guide toAmerican Colleges, Cass & Birnbaum, Harper Row, New York,8th Ed.-, 1§f7; and The College Handbook, CEEB, N.Y. 1977.
10/ See Category III File 772 3000, Vol. I, p.87. This is
an interview report with the Chief of New York State'seducational testing wherein he states that if coaching
is only minimally effective it would distort to someextent who obtained Regent's scholarships.
11
22

Generally while the SAT is not as important a factor
in the admission process as it was several years ago it
is still a very material factor. A reversion to a national
attitude similar to that of the early 1960's would make
the SAT even more critical in the admission process.
It appears that the first law aptitude examination was
offered at Columbia Law School in 1921.11/ Prior to 1948
at least seven specially constructed legal aptitude tests
were used by various institutions as one means of selecting
applicants to their law schools.12/ In 1925 Merton L.
Ferson, Dean of the University of North Carolina Law School,
and George Stoddard, Assistant Professor of Psychology and
Education at the University of Iowa, announced the creation
of the Ferson-Stoddard Law Aptitude Examination.13/ The
Ferson-Stoddard examination was remarkably similar to the
current day LSAT containing sections on: (1) capacity for
accurate recall (memory); (2) reading comprehension; (3)
reasoning by analogy; (4) reasoning by analysis; and (5).
skill in pure logic.14/
11/ Ramsey, Law School Admissions: Science, Art, or Hunch,12 J. L6Tif (960).
12/ Id.
13/ Ferson, Law Aptitude Examinations, 5 Am. L. School Rev.563 (1925).
14/ Stoddard, Person and Stoddard Law Aptitude Examination- Preliminary Report, 6 Am. L. reffool Rev. 71 (1927).
Za12

In 1941 an experimental edition of the la Apti-
tude Test appeared. Apparently dissatisfied with the r.!xamina-
tions available, a group of law schools approached the College
Entrance Examination Board in 1947 regarding the possibility
of producing a national aptitude test for the legal profession.
The result of these negotiations was the birth of the LSAT.15/
The LSAT has grown in importance to the point where as a
prerequisite to accreditation the American Bar Association
(ABA) requires law schools to require their applicants to take
the LSAT.16/ It is not only the demand of the accrediting
authorities that makes the LSAT prominent in the admission
process. Although intensive examination of an applicant's
educational and life record might well yield more satisfactory
admission results 17/ most law schools were and are thinly
15/ See n. 11 at 513, supra.,
16/ "All applicants except those physically incapable oftaking it, should be required to take an acceptabletest for the purpose of determining apparent aptitudefor law study. A law school that is not using the Law
School Admission Test administered by the EducationalTesting Service should establish that it is using an
acceptable test." ABA Standards for Legal Education,
Cha ter V, Section 503. The AmeriFin Assocrit37F---lof Law
Schoo s (AALS) has i-iimilar requirement. In fact there
is no other test that purports to measure aptitude for
the study of law. Goolsby, A Study of the Criteria
for Legal Education and Admission to the Bar, 20 J.
Lega Ed. 175 (1967).
17/ Rosen, Equalizing Access to Legal Education: Special
Programs for Law Students Who Are Not Admissible piTraditional CITEeria, U. of Toledo L. Rev. 321 (1970).
13
21

staffed with admissions personne1.18/ As a result, law
school admission decisions, excluding special admission
programs, are based almost exclusively on the numbers.
Even a vigorous opponent of this conclusion notes:
At some point of course it does become essentially impos-sible for personal factors to compensate for uncompromis-ing objective credentials for the over-all correlation ofLSAT scores and undergraduate grades with law school per-formance can raise questions of survival.19/
While there is a great diversity in approach the most
common method used in selecting applicants for admission to
law school creates an index score by adding the LSAT score to
a number equal to 200 times the grade point average (Index =
LSAT + (GPA X 200]).20/ This procedure attempts to give
the LSAT and the GPA approximately equal weight In the
admission decision making process.
18/ Schmidt, Admission to Law Schools: Not By Computer,
Not a Change, 10 Tulsa L.J.-111 (19717.
19/ Winograd, Law School Admissions, A Different View, 59
A.B.A. J. 862, 865 (1973).
20/ See Category III File 772 3000, Vol. XXXI, p.183.Although this information is obtained from a coachingschool it is highly credible in that the Board ofEditors consists of professors from Harvard, Loyola,Wayne State, University. of Illinois, University ofTexas, and University of Southern California Law Schools.
See also Category III File 772 3000, Vol. I, p. 84-86,Admissions Practices of Temple Law School; and Pre LawGuidebook of Boston College, p. 65, wherein it 1i stated:
Almost every law school will weigh certain variableswithin the structure of a specific formula. Many
law schools multiply their LSAT score times twoadding this result to your Grade Point Average (GPA)and the rating of your undergraduate institution.
14
25
The importance of the LSAT score in the admission pro-
cess can not be underemphasized. Not only does the LSAT
share approximately equal weight with the Grade Point Average
(GPA) but the failure to obtain a minimumn LSAT cutoff score
at some law schools means automatic rejection.21/ While only
a few law schools admit to having absolute minimum LSAT re-
quirements others admit to having a "preferred" minimum LSAT
score.22/ While the official guide to law schools informs
us that "Some schools do follow automatic qualifying or dis-
qualifying credentials such as minimum gradepoint averages
(GPA) and LSAT scores, but most are not wedded to such cutoff
scores and averages," 23/ a review of that publication indicates
that the use of a minimum cutoff score is not infrequent.
For example the following law schools among others did
not admit any students with LSAT scores below 500 for the 1977
graduating class (the number in parentheses is the number of
applicants applying with an 11,SAT score below S00): University
of Denver (196), George Washington University (384), University
of Illinois (199), University of Kentucky (199), Mercer Univer-
sity (227), University of Minnesota (82), University of New
Mexico (187), University of Wisconsin (107). In summary, of
21/ Lunneborg & Radford, The LSAT: A Survey of ActualPractice, 18 J. Legal Ed. 1313 (1966).
22/ Id.
23/ Prelaw Handbook; AALS, LSAC, ETS (1974).
15

the 1581 applications received by these law schools reporting
an LSAT score below 500, none were accepted.
The following law schools also did not accept any appli-
cants with an LSAT score below 500 except for those students
admitted pursuant to a special admission or minority program
(the number in parentheses again reflects the number of appli-
cants to the institution with LSAT scores below 500): University
of California/Berkeley (151), University of Colorado (240),
University of Georgia (272), Marquette University (264),
University of North Carolina (279), and the University of
Oregon (96). In summary, of the 1308 applicants reporting an
LSAT score of below 500, not including those admitted pursuant
to a special admission program, none were admitted to the
above-mentioned law schools.24/
The above survey is not exhaustive. Not all law schools
have furnished data and we could see no benefit at this time in
attempting to acquire admission standards from every law school
in the country. We believe it is clear that minimum cutoff
scores are prevalent.
Even if it is conceded that law schools are not using a
minimum cutoff score, it is evident that the use of a formula
in effect creates a threshold LSAT score that must be sur-
passec to obtain comsideration for acceptance. This becomes
24/ I.
16 27

even more evident when it is recognized that the range of the
grade point averages of applicants is narrow (as a result of
both grade inflation and increased applicant ability) thus
limiting the grade point average component of the formula to.1,
a range of about 400 points rather than its theoretical 800
points.
The LSAT is being used (abused) for purposes other than
admission to law school. We have had personal experiences of
emp_ayers requesting LSAT scores on applications for attorney
positions. In fact until recently the Commission requested a
job applicant's LSAT score on the supplemental attorney's form.
We believe this is a practice that is not uncommon in both the
public and private sectors.
IV. REVIEW OF PRIOR RELATED RESEARCH AND LITERATURE
Considering the imporance of the issue, and the constant
student and parent request for its resolution, there is a pau-
city of prior research and literature concerning the coacha-
bility of standardized admission examinations.25/ In fact we
find virtually no material dealing with the effects of coach-
ing on any standardized admission examination other than the
Scholastic Aptitude Test (SAT) and no material at all concerned
25/ For the most thorough and most up to date review of thisentire area, see Pike, Short-Term Instruction, Testwiseness
and the Scholastic AkAitraiTest: A Literature TieVreC4wiTh--Research Recommendations, Educatioilial Testing siiTriFe,IFTREgi3n, New Jersey, 1978.
17
23.?

with the commercial coaching schools as they presently exist.
We also find no material on the effects of coaching 1-time
test takers, only test repeaters who have been coached
in the interim period between test administrations. There
is however considerable material dealing with the general
topic of test-wiseness. (TW).
Two research reports deal extensively with the current
state of knowledge of test-wiseness.26/ Test-wiseness has
been defined as the ability to manifest test taking skills
which utilize the characteristics and formats of a test and/or
test taking situation in order to receive a score commensurate
with the abilities being measured. Alternatively the term has
been defined as a subject's capacity to utilize the character-.
istics and formats of the test and/or the test taking situa-
tion to receive a high score...and is logically independent of
the examinee's knowledge of the subject matter for which the
items are supposedly measures.
Some aspects of test-wiseness include effects of practice
on tests, familiarization with item types, following instruc-
tions, using time efficiently, knowing when to guess, not
26/ See generally, Fond V., Everything You Wanted To Know
About Test-Wiseness, 1973 (Eric Document ReporneEr5gtTEVia-ifd 093 912); Jongsma, E.A., Wershaver E.,
The Effects of Instruction Test-Making Skill Upon
Student Performance on Standardized Achievement Tests,
99775- (Eric Document Reporduction selirEgigirrICIWT.
18 21)
hesitating to change an answer, and having a planned strategy
for answering examination questions.I
Test-wiseness is recognized by most experts as a source
of variance on educational tests. Moreover it is generally
agreed that test-wiseness is cognitive. It would then not be
surprising to find that coaching schools have the capacity to
increase scores on stnadardized admission examinations, at
least to the extent that test-wiseness is a score component,
especially where they are dealing with test-naive students.
Generally the few prior studies investigating the effects
of coaching on the Scholastic Aptitude Test have concluded
that coaching is ineffective. Based on these studies the
trustees of the College Entrance Examination Board have stated
that "score gains directly attributable to coaching are of
such a small magnitude that it is unreasonable to expect
coaching to affect admissions decisions".27/
However, a 1972 study conducted by two Educational Test-
ing Service psychometricians, which was commissioned by the
College Entrance Examination Board, severely criticizes theie
prior studies.28/
27/ College Entrance Examination Board, Effects of Coachingon Scholastic Aptitude Test Scores, New York, CEEB,1§65.
28/ Pike L. & Evans F., Effects of Special Instruction forThree Kinds of MatheiiigErFrAptitude Items, CEEB, NewYork, Tin:
19
3o

The authors state:
... the particular question of the effects of specialinstruction on different mathematics item formats is notadequately answered by previous research. First, themajority of studies were designed to determine whethercoaching schools gave their clients an unfair advantageon the SAT. The instruction provided in these studieswas, where its nature can be ascertained, rather scanty.There appeared to be little or no systematic attempt toidentify the skills needed to perform well on the testand to develop materials to meet these needs. Sincemost previous research on this question involves sub-jects at the extremes of the ability range, generaliza-tion to the more heterogeneous population of candidatescurrently Reeking admission to higher education becomeshazardous.29/
The authors also stated that:
... many of these studies were conducted in the 1950's
when the SAT candidate population was more homogeneousthan it is today. Consequeatly, much of this researchinvolved subjects enrolled in private prepatory schoolsor in public schools whose student bodies were wellabove the national average in tested ability. One canprobably assume that the subjects in these studieswere therefore less likely to benefit from special in-struction than were students in the more general popula-
tion.3C/
It is also important to note that students were assigned
to experimental and control groups in some instances without
regard to their desires to receive coaching, although in other
instances the assignment was on a voluntary basis.
The major focus on the 1972 study was to determine if
a new mathematical question format (quantitative comparisons),
which the College Board was considering using on the SAT mathe-
matical section, was susceptible to coaching. As a by-product
30/ Id.
20 31

the authors also sought to ascertain if the SAT question types
then in use, regular math and data sufficiency, were suscep-
tible to coaching. The authors concluded that "... each of
the three item formats was susceptible to the special instruc-
tion directed toward it."31/ They further stated that,
"Certainly the gains achieved by the quantitative comparison
and data sufficiency instructed groups on the app-opriate
items are of practical value."32/
As a result of these findings the College Board declined
to use quantitative comparison items on the SAT at that time.33/
Nevertheless these item types are found on the Scholastic
Aptitude Test, Law School Admission Test, Graduate Management
Admission Test, and Graduate Record Examination today. More-
over the Scholastic Aptitude Test still retains data sufficiency
and regular math item formats.34/
In a most recent paper Pike 35/ recognized ten components
of observed SAT test scores:
31/ Id.
32/ Id.
33/ Id.
34/ See generally the bulletins prepared for applicants
for standardized examinations by the administrators
of the examinations. File 772 3000, Physical Exhibits
I, J, K, and L.
35/ See n. 25, appra.
21 32'

A. "True score" components: e.g., verbal aptitude, math
aptitude.
1. A composite of underlying knowledge (e.g., vocabu-
lary, elementary algebra) and reasoning ability,
developed over a long period of time. (Long-term
acquisition, long-term retention.)
2. A state of being well-reviewed, so that the per-
formance to be demonstrated is in line with the
individual's underlying developed competence.
(Short-term acquisition, short or medium-term
retention.)
3. Integrative learning, overlearning, consolidation.
(Short-term acquisition, long-term retention.)
4. Learning criterion relevant, analytic skills (e.g.,
how to identify the main idea of a paragraph; how
to simplify complex quantitative terms before com-
paring their value). (Short-term acquisition,
long-term retention.)
B. Primary test specific components.
1. The match between the domain of developed ability
(including the various score components listed
in A above) and test content. Mismatches may occur
as gaps in such areas as skill in locating infor-
mation in reading passages and ability to work
with the algebra of inequalities.
2. General TW--Test familiarity, pacing, understand-
ing of general directions, general strategies for
using partial information, and so on.
3. Specific TW--Components similar to B2, but in
reference to characteristics of specific item formats
(such as verbal analogies and quantitative-comparisonitems) and other item characteristics.
C. Secondary components influencing test taking.
1. Level of confidence.
2. Level of efficiency--The ability to use avail-
able knowledge and reasoning ability quickly,
with a relatively low rate of errors resulting.
from working rapidly.
22
33

D. 'Error." Fluctuations in attention, sampling error,variations in luck in guessing, etc.36/
Pike concluded that eight of these items (except Al, a
composite of underlying knowledge, and D, error) were, based
on his review of prior research, susceptible in varying
degree and situations to some type of preparation (either
coaching, short-term instruction, or intermediate term in-
struction).37/
This is evidence that test preparation services may
have the capacity to increase scores. Pike stated in considering
the discrepancy between past studies on coaching that
in principle a single study showing substantial positive
gains cannot be countered or refuted by any number of studies
failing to get positive results."38/
V. INVESTIGATIVE METHODOLOGY
Test preparation services are those commercial 39/ enter-
prises that in a relatively short time, by employing a variety
of methods, attempt to aid an individual to increase his/her
scores on standardized examinations that are often pre-
requisites for admission to undergraduate and graduate colleges
36/ Id. at 3-4.
37/ I. at 38-42.
38/ Id. at 35.
39/ See our comments on the non-profit segment, infra.
323

and universities.40/ Their intensive programs are directed
specifically towards the examination that an individual is
preparing to take and any residual long-lasting benefits
that may result are purely secondary. The terms "review
course", "coaching school" and "cram course" are synonymous
with and used interchangeably with the term "test preparation
service". Our initial investigatory tasks were to identify
these organizations and ascertain the nature and structure of
the test preparation industry.
Surv.ys of the Education and Career Development Directory
of the Nw..7 York Times 41/ and the education sections of other
natc.onal Sunday newspapers proved fruitful in identifying in-
dustry members. Once an industry member was identified it was
invariably asked to identify its competitors. We also closely
scrutinised the telephone directory listings under tutoring
and coaching, and visited numerous campuses to view any adver-
tisemeat3 appearing in college newspapers or posters placed on
bulletin boards by coaching schools. Needless to say we
asked students if they had any knowledge of who was offer-
ing coaching courses.
ON..11111Ms.
40/ This definition is similar to that chosen by theCollege Entrance Examination Board (CEEB) to definecoaching. See, Effects of Cooaac_hing on ScholasticAptitude Test Scores, CEEB, N.Y. ( 9Z5) p.4.
41/ See Category III File 772 3000, Physical Exhibit 4,p.50-51.
24 35

Perhaps our most successful technique for identifying
industry members was to mail four hundred thirty-two (432)
questionnaires 42/ to pre-law advisors in universities in the
metropolitan areas of Boston, MA; Chicago, IL; Los Angeles,
CA; and New York, NY.43/ We received 185 responses to
these questionnaires (42.8%) and 69 responses named either
an individual, commercial enterprise, or not-for-profit organi-
zation that was offering or had offered test preparation.
Our previously acquired knowledge of the industry alerted
us at the outset to the impossibility of identifying every
industry member in the United States. Accordingly we decided
to focus on major metropolitan areas that have a large number
of universities, a high student population, and a high number
of coaching schools.
Stanley H. Kaplan Educational Centers, Ltd., the largest
coaching school in the industry in terms of annual revenues as
well as total number of students taught, informed us that its
42/ These questionnaires were mailed after receiving clear-
ance from the General Accounting Office as required by
the Federal Reports Act, 44 U.S.C. SS3501 - 3511. See
Category I File 772 3000, Vol. I, p. 49-59.
43/ The pre-law advisors were selected by reviewing Directo-
ries of Colleges from California, Illinois, Massachusetts,
and New York. These directories are incorporated in
File 772 3000 as Physical Exhibits M, N, 0, and P re-
spectively. The responses to these questionnaires are in-
corporated in Category III File 772 3000, Vols. IV - VI.
25 36

largest. centers were located in the metropolitan areas of
Bostoh, Chicago, Los Angeles, and New York. We also de-
termined that all the national coaching schools operated in
at least one of these cities. We therefore decided to limit
our initial inquiries to these four metropolitan locations. We
have since decided that close scrutiny of other geographical
locations is unnecessary at this time.. The statistical
analysis that we have performed and its conclusions can be
validly used to draw parallel inferences concerning the entire
nation.44/
We also decided to limit our investigation in time to the
period from October 1974 through December .1976 inclusive.
This decision was based on several factors. The number of
students coached in this period gave us large sample sizes
which is beneficial to the accuracy of a statistical inquiry.
The record retention of the coaching schools deteriorates
rapidly prior to that period and identification of now defunct
entities that existed prior to October 1974 is extremely dif-
ficult. Data maintenance for a greater time period and more
44/ In fact, this is what the mathematical discipline of
statistics is all about. Statistics is the science of
inferring generalities from specific observations. Al-
though we never know for sure in any particular case
whether a hypothesis is true or false the procedures of
statistical inference make it possible for us to state
precisely what the probabilities are that we will accept
a false hypothesis or reject a true hypothesis. This
statistical proof is the basic form of proof used in
the investigations of all sciences.
7?26

extensive geographical locations becomes extremely cumbersome
-and costly as time frame or geographical location is increased.
Not only have we limited our specific inquiry to time
and location but we have also limited it, for the purpose of
testing the effectiveness of coaching and the truth or falsity
of coaching school claims, to two standardized examinations:
the Scholastic Aptitude Test (SAT) and the Law School Admission
Test (LSAT). The justification for the limitation of the
specific.inquiry to these two examinations is the same as that
for limiting the specific inquiry to four geographical loca-
tions -- viz. we believe valid inferences about the coacha-
bility of other examinations can be drawn from the specific
results we obtain for the SAT and LSAT, or at the very least
place a strong burden on the parties to whom any inferences
are adverse. Furthermore, the SAT and LSAT are the two most
heavily coached examinations administered by the Educational
Testing Service and therefore we have had less difficulty in
developing a significant data base for their analysis than we
would have for other examinations.
One further limitation on our specific inquiry must be
noted. It came to our attention that there are many high
school teachers and others coaching high school students for
the SAT. For practical reasons (time and resources) it is not
possible to ferret out all these individual entrepreneurs and
we have not attempted to do so. This fact, coupled with the
27 38

extremely extensive and voluminous SAT computer files main-
tained by the Educational Testing Service caused us to de
cide to limit the specific SAT inquiry to major coaching
schools in the metropolitan New York City area. The failure
of some of these organizations to maintain any records,
legible records, or to have taught an appreciable number of
stude0-s during our relevant time frame has reduced our SAT
statistical analysis to two major SAT coaching schools.
This limitation in scope of our statistical analysis has not
affected in any way our industry analysis. Furthermore this
limitation of our statistical analysis, if it is a bias, dis-
favors the coaching schools actually analyzed, in that we can
not be sure that our control groups have been culled of all
coached students. This and other biases are discussed, infra.
The statistical analysis to which we have been referring
was designed to determine the effectiveness of coaching schools.
As a by-product it also determines the truth or falsity of the
coaching school claims as well as the truth or falsity of the
claims of the test makers. It is discussed in more detail,
infra.
In order to develop data for computer analysis, enrollment
foems reflecting coaching school enrollees had to be matched
with the ETS.computer tapes. As individual industry members
were identified they were requested to submit information to
us pertaining to their operations. The most important
28 39

element requested was the student enrollment or registration
forms. Although most test preparation services had this data
in some form their record retention and record legibility was
not always exemplary. Therefore each of the more than 14,000
enrollment forms we obtained was inspected for legibility and
. for any apparent inconsistencies or omissions. If for example
a name was partially illegible we checked the appropriate
telephone book in an attempt to ascertain the correct name
spelling. If a street address was omitted we followed the
same procedure. In literally thousands of instances zip codes
were omitted from addresses on the enrollment forms and these
were manually supplied by employing the National Zip Code
Directory. This procedure resulted in our matching over 80%
of the coaching school enrollees with individuals on ETS'
computer tapes. Part of the unmatched percentage can be
attributed to a failUre by the student to actually take the
SAT or LSAT.
In order to ascertain the completeness of the coaching
schools' enrollee records we determined the expected number of
enrollees by dividing each coaching school's annual income by
its tuition cost. Although this procedure was unavailable
in some instances due to integrated financial statements, and
was approximated in other instances due to tuition fluctuation,
we conclude that we have acquired over 91% of the total LSAT
enrollment forms we sought from the coaching schools involved in
29
40

our statisticalanalysis and in excess of 99 of the SAT
enrollment forms we sought from the coaching schools involved
in our statistical analysis.
Once the enrollment forms had been acquired and any
illegibilities or omissions were rectified, the names, ad-
dresses, and other available identifying information, including
the dates when the student was coached, contained on the enroll-
ment forms were typed onto plain bond paper (only students
attending the same coaching school appeared on the same page
with a code corresponding to the coaching school where the
students had been coached appearing on each page).45/ These
student enrollment lists were then ready for computer matching
with the ETS computer tapes and for statistical analysis.
VI. INDUSTRY STRUCTURE
It is fundamental to recognize that the economics of the
coaching school industry is merely a subsidiary consideration
in ascertaining the public interest of this inquiry. The
social, psychological and economic benefits that may be
gained by indivichials Olo attend a coaching school transcend
the current stature bf the coaching school industry. Not-
withstanding, the following industry analysis is offered.
45/ This procedure was followed to ensure that Only FTC
'--- personnel could determine which results corresponded
to which coaching schools until such time as the data
is publicly released.
30
A. COMMERICAL
In the metropolitan areas of Boston, Chicago, New York,
and Los Angeles from October 1974 through December 1976 a
total of in excess of 15,000 students were commercially
coached for the SAT and LSAT.46/ We estimate that 50,000
individuals are being coached annually nationwide for all
standardized admission examinations.
For 1975 and 1976 combined, the twenty-one commercial
entities that we have identified and included in our analysis
had total annual sales of $9,403,615.47/ We estimate that the
total annual sales volume of al] commercial preparatory courses
nationwide is $10,000,000.
The twenty-one entities considered here expended $400,000 48/
on advertising in 1976. Their tuition ranged in price from a
maximum of $250 (plus a $50 refundable deposit for materials)
46/ We have in our possession the names of 11,906 LSAT coacheesand 2286 SAT coachees that were obtained for use in thisstudy although not all have been used. All SAT coacheesare from the metropolitan New York City area.
47/ This figure includes revenues obtained from all standard-ized admission tests, not only the SAT and LSAT.
48/ Since the coaching schools are advertising in effect toa captured audience they can reach all potential enroll-ees by using low cost techniques such as posters andschool newspapers. The Stanley H. Kaplan Educational Centerestimates 801 of its students attend due to referrals notadvertisements. See, Transcript of Investigational-Hear-ing of Stanley H. Kaplan, dated May 6, 1976, p.40. Al-though many coaching schools advertise in large newspaperssuch as the New York Times, we perceive this is an attemptto reach parents more than students.
31 4 2

to a minimum of $40. Their courses ranged in duration from 40
hours (10 sessions at 4 hours each) of classroom indstruction
plus unlimited use of library tapes and homework to a minimum
of a one-day 8 hour seminar. Not surprisingly, the most ex-
pensive courses had the longest duration, and the least
expensive courses had the shortest duration.
All preparation courses offer written materials as well as
lectures. Their materials consist either of the commercially
available review books 49/ or materials designed by the coaching
schools themselves. By and large the majority of the materials
consists of numerous examples of question types appearing, or
expected to appear, on the various standardized examinations.
One coaching school has an extensive tape library where. over
200 hours of additional preparatory instruction is available.
The larger coaching schools have staffs of researchers
who are constantly updating materials and writing practice
examination questions. One school is so vigilant in its quest
to keep current its materials that it pays individuals to take
a standardized admission examination for the sole purpose of
49/ We have not endeavored to analyze the effects of mere-ly using one of these review books without attending aformal coaching course. Such use by subjects in ourcontrol groups would of course bias our,findings againstthe coaching schools.
32 4:1

*remembering the examination questions.50/ The value of this
practice is questionable. A study was commissioned by the
College Board because it was believed some operators of
coaching programs obtain some items that have been included in
past editions of the SAT. The coaching materials consisted of
actual items that later appeared on the SAT the subjects would
take. The author concluded that "...even if it were possible
to coach with as many as one-tenth of the items that would be
used on a future form of the SAT -- a virtual impossibility
-- the effect on the scores of students coached with these
items would be negligible."51/
There is much variance among the techniques used by
coaching schools. They cover a continuous spectrum. . The
simplest approach is teaching solely test-wiseness which is
devoid of substantive content and mainly concerned with exam
taking techniques. A more elaborate technique is short-term
instruction (STI). This is a relative term which includes
both elements of test-wiseness and substantive content. The
50/ See, Transcript of Investigational Hearing of JohnSexton, February 9, 1977, p. 41-42.
"I wouldn't want ETS to knoW our operation, but letme say that we do have people who take the tests forus which obviously is a way of monitoring."
51/ French, John W., An Answer to Test Coaching, CollegeBoard Review, No.-ITTFin Tg55, p. 5-7.
33
Ii
duration of instruction is short compared to the amount of
time the test administrators would have us believe it takes
to develop the abilities (over a lifetime) that standardized
admission examinations measure. The most elaborate teaching
technique employed by the coaching schools is intermediate-
term instruction (ITI). ITI is of the same nature as STI
although somewhat longer in duration. It is however of
relatively short duration when compared to the amount of
time generally considered necessary for substantial changes
in test scores to occur.52/
Although there is no bright line that serves to determine
where one of these approaches ceases and another begins, both
the nature of the materials used by test preparation services
and the length of instruction leads us to conclude that the
majority employ short -term instruction techniques. Organiza-
tions offering formal instruction for a weekend or less engage
in teaching solely test-wiseness. The Stanley H. Kaplan Educa-
tional Center, Ltd. (provided the 200 hours of library.tape
are used) may be viewed as offering intermediate-term in-
struction.
Almost all teachers at the coaching schools have obtained
or are in the process of obtaining graduate degrees. Another
52/ See, n. 25, at 4-5, supra.
34
almost uniform requirement for teaching at a coaching school
is scoring extremely high (minimum of 650) on one or more
standardized admission examinations.
Although we have confined our initial inquiry to LSAT
preparatory curses in the metropolitan areas of Boston,
New York, Chicago, and Los angeles and our SAT inquiry to
preparatory courses in the metropolitan New York area, we are
aware of commercial coaching schools existing in every state
and in virtually every major city or college campus throughout
the country for all standardized admission examinations.53/
Although the coaching school industry may not be large
in terms of annual sales by some standards, the industry
structure already exists which enables it to reach any of the
approximately 2,500,000 individuals who annually will be
53/ A list of some of the locations of noaching schools
follows;
Brooklyn; Buffalo; Manhattan; Syracuse; Albany; Ann
Arbor; Atlanta; Augusta; Austin; Birmingham; Boston;Champaign; Chicago; Charleston; Cleveland; Columbus;Dallas; Denver; Detroit; Durham; East Brunswick; Gains-ville; Houston; Indianapolis; Jacksonville; KansasCity; Los Angeles; Louisville; New Orleans; Omaha;
Palo Alto; Philadelphia; Pittsvurgh; Portland; SanFrancisco; Seattle; St. Louis; Tallahasee; Tampa;Washington D.C.; Toronto; Lugano, Switzerland; Euclid,Ohio; Clinton, Iowa; Knoxville; Boulder; Fort Worth;Baton Rouge; Baltimore; Montreal; Columbia and Greenville,South Carolina; Miami; Harrisburg; Oxford, Jackson,and Columbus, Mississippi; Orlando; Tuscaloosa, Opelikaand Mobile, Alabama; Lexington, Murray, Maehead, andBowling Green, Kentucky; Fayetteville; Little Rock
and Jonesboro, Arkansas; Phoenix; Tuscon; Milwaukee;Madison; Salt Lake City; and Utica.
35
46

taking a standardized admission examination. It has the
potential to grow quite rapidly 54/ and to exceed annual
sales of one-half billion dollars.55/ Furthermore there
are almost no entry barriers to this industry.56/
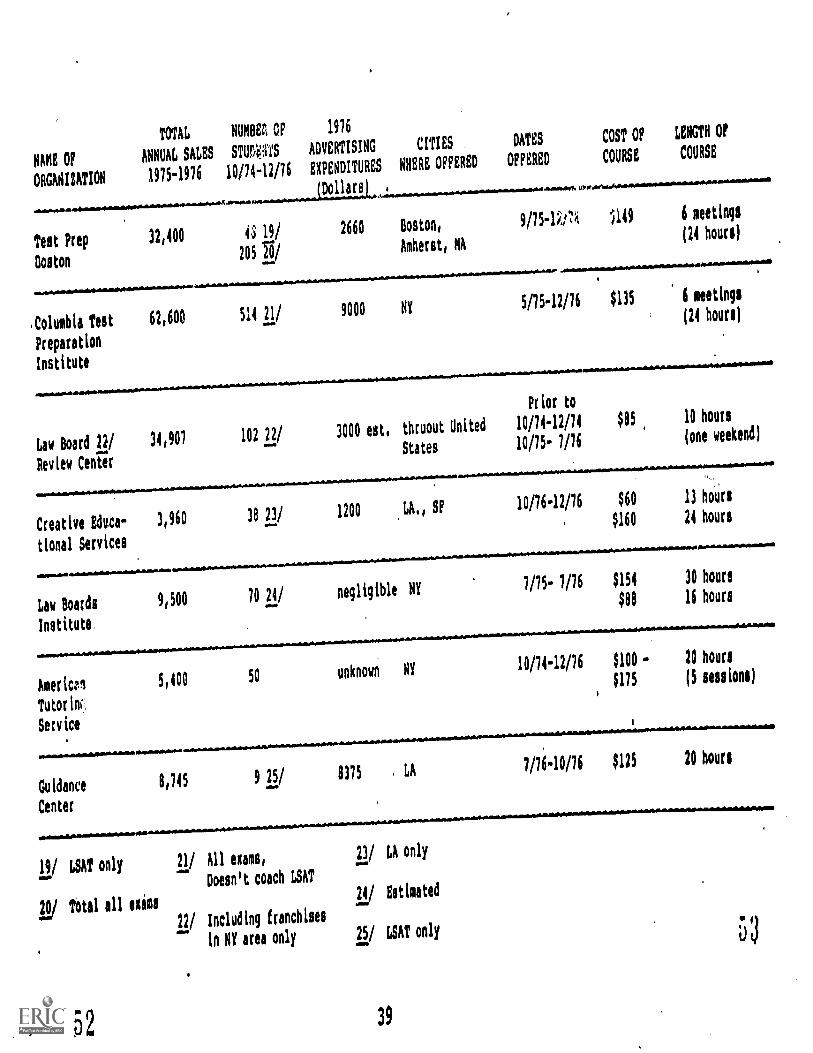
The charts appearing on the following pages represent
for each of the entities we have specifically examined, name
of the coaching school, total annual sales (1975-1976), number
of students enrolled (Oct. 1974 - Dec. 1976), advertising
expenditures (1976), cities where courses are offered, dates
when courses have been offered up to December 1, 1976, costs
of the course, and length of the course.
54/ Harcourt Brace has recently acquired a coaching school
WAT METHOD). This acquisition by a $300 million
conglomerate is further evidence of the potential
for rapid annual sales expansion of this industry.
55/ Assuming each of the 2,500,000 students who takes a
standardized admission examination each year enrolled
in a coaching school at an average cost of $200, the
industry would have annual sales of $500,000,000.
56/ Franchisees of the Evergreen course, for example, must
pay only $200 upon execution of the franchise agreement
and then 33 1/3% of the gross up to $90,000 and 15%
of the gross over $90,000. See, Category III File
772 3000, Vol. XLIX, p.45. In this vein it is of interest
to note that there are numerous high school and college
teachers coaching small groups of students for standard-
ized exams on a part time basis, and we are unaware of
any state imposed licensing restrictions.
436

NW OF
ORGANIZATION
TOTALNUMBER OP
ANNUAL SALES STUDENTS
1975-1976 10/74-12/76
1976
ADVERTISING
EXPENDITURES
Dollars
Stanley R. Kaplan7,834,093 1/ 4915 2/ 209,357
Educational15041/
Centers Ltd.
Amity Review267,000 I/ 677 4/ 26,001
Course
1500 1/
CITIES
WHERE OFFERED
DATESCOST OF LENGTH OF
OFFEREDCOURSE COURSE
over 50 cities Prior to
in U.S. plus10/74 -12/16
Toronto and
Lugano, Swat,
$250-LSAT10 weeks at
$225-SAT4 hrs./wk.
over 20 cities10/75 -1 2/16 $115 or 30 hours
in U.S.$125 or wlekend
John Sexton's511,184 6/ 3020 6/1/'
40;000 8/
LSAT Review
Course
NY, Bos., DC, LA, Prior to $95
Houston, Tampa,10/74. 12/76 $150
and others$250
1111.0~1000161111160.1111101~1111.14.1~1~1..~WIMMIMAMANIM..A
Low School236,547 9/ 1738 12/
Admission Test43,661 IS/ 1216 II/
Review Course9,220 II/ 367 TO
(Evergreen)
187 IT/
30,000
11 hours
28 hours
10 hours
In excess of Prior to $125 30 hours
60 locations in 10/74-12/16$250 40 hours
U.S. and Canada 2/75-12/76 10/
1/ Nationallyfor all exams
1/ Sou, NY, Chi" LA (LSAT)
1/ NY only (SAT)
Oos,, Chi., NY,
LA only (LSAT)
48
2/ Nationally (LSAT)8/ Estimated,
6/ Includes NY, franchisees 9/ Includes $64,270 received
in LA and NJfrom franchisees as commissions,
does not include MCAT revenue
2/ No records Of students
exist prior to 1/75 10/ LA franchisee
37
13/ Due to'poorrecord retention
this representsnumber of
names in our possession.
Approximately 15 are miselog
for 12/76, 75for 2/76, and
538 for 4/15 and 7/75
11/ Chi, francdiee
12/ LSAT for NY/NJ
area only. Does not
include 200 scholar-
ships per year

MANS Of
ORGANIZATION
TOTAL'
ANNUAL SALES
1975.1976
Ad Educational 33,000 14/
Services
NUMBER OP 1976
STUDENTS ADVERTISING CITIES DATES COST Of LENGTH Of
10/74.12/76 EXPENDITURES WHERE OFFERED OFFERED COURSE COURSE
(Dollars)
186 15/ unknown NY/Boston 10/74.12/75 $239 20 hours
$179
ON.MOIMOMPOOM~AMONIPilkilinmiNolaOrs4pomameW00000~60=1MNIMosaliesealNdrINwPiba%mandayilMI001001POIMINO
Rutgers Review 11,941 14/ 126'15/ . 33,000 NY/NJ
Center (ARC) 60,166 11/ . 417 Tglsot,
LSAT
NEMO
10/75.12/76 $85 20 hours
$115 (weekend)
$115, 7 sessions
21 hours,
44 hours
(11 sessions)
aormosofkoamommmoodwomboaftftraftarrieftftearalessalimilWeirMill.
15,000 283 17/ 10,000 LA.,SLISD
oppl, 485 Ti/Salt Lake City 10/15.12/76 $40
OMB 011111011011110111111..wel
1 day
(I hours)
Western States 42,526
Review
Test Prep
Chicago
14/ GSAT only
IS/ LSAT only (also offered
courses for other exams)
43,471
115 17/ 5,000 LA, SF, Seattle
500 IV est, Honolulu
171 unknown Chicago
10/75.12/76 $85 li hours
(2 days)
2/75.12/76 unknown unknown
1
5 0.
16/ All courses total18/ All cities total
17/ LA only
38
NAME OF
ORGANISATION
TOTAL NUNOE4 OF 1976
ANNUAL SALES STUO46 ADVERTISING CITIES
1975-1976 10/74 -12/76 EXPENDITURES WHERE OFFERED
DATES COST OF LENGTH OF
OFFERED COURSE COURSE
.1400.0060,..4.0.1001011411.01.6/{nol..~141~020111C2311. AL 6.040.00~0000baa~dass~ .1.0.6*"
prporAnarokea0asowatmaraartaohowsoraweb~a
Test Prep
Boston
32,400 4 +319/
205
2660 Boston,
Amherst, MA
9/75 -iii 7h 1119
IftolliaaM11Mignalki1110100/110b11.0..4,2~.10*~0,46M1r0~b0~11000.~0.
,Columbia Test 62,600 514 21/ 9000 NY
Preparation
Institute
Law Board 22/ 34,901 102 22/ 3000 est, thruout United
Review Center
States
Mlio,d0601.1111dPIWIMI1011V.011
Creative Educe- 3,960 38 23/ 1200 .LA., SF
tional Services
9,500 10 24/negligible NY
Law Boards
Institute.
6 meetings
(24 hours)
5/75-12/76 $135 6 meetings
(21 hours)
Prior to
forwareplarireiblharromerielrbollaribellalMilill
10/74-12/74 $85
10/75- 7/76
10/76-12/76 $60
$160
10 hours
(one weekend)
7/75- 7/76 $154
$88
13 hoUrs
24 hours
30 hours
16 hours
Americo.)
Tutor Int'
Service
firalftgarmlIMAIWW.12"0
Guidance
Center
5,400 50 unknown NY 10/74-12/76 $100
$175
8,745 9 25/ 8375 LA7/7i.10/76 $125
- 20 hours
(5 sessions)
20 hours
19/ LSAT only
10/ TOW all exams
52
21/ All exams,
Doesn't coach LSAT
22/ Including franchises
in NY area only
23/ LA only
24/ Estimated
25/ LSAT only
39
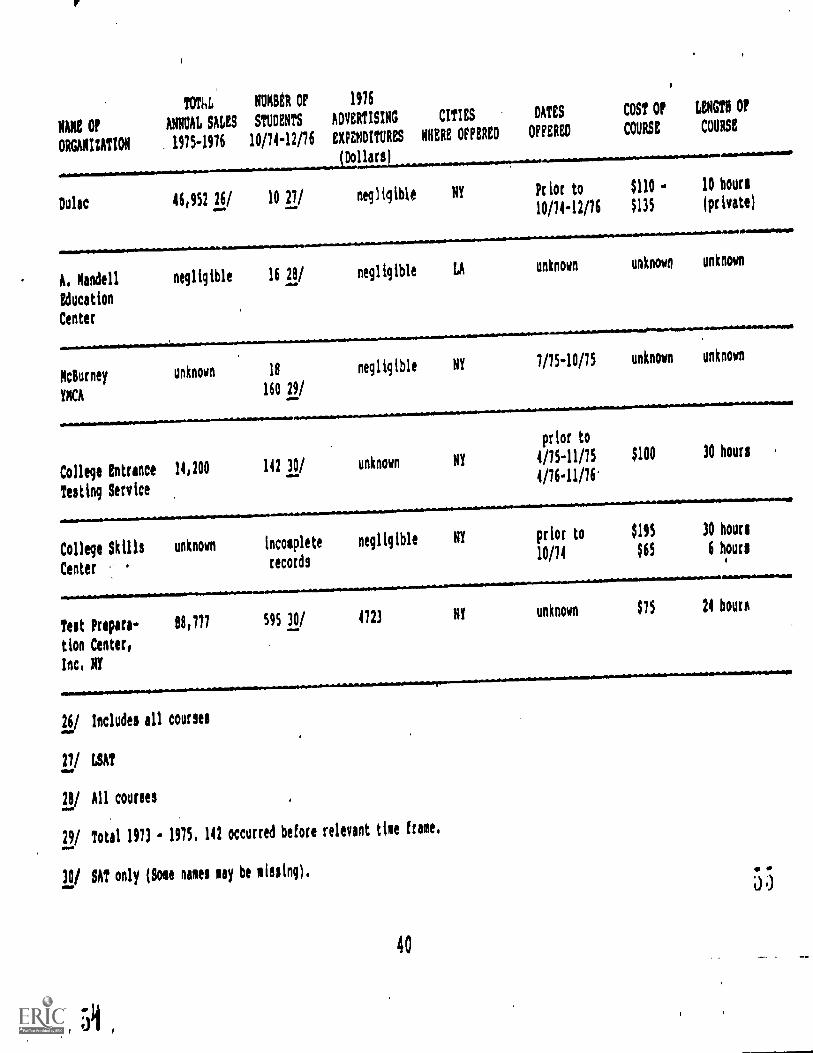
TON. NUMBER OP 1976
NAME Of ANNUAL SAM STUDENTS ADVERTISING CITIES DATES COST OP LENGTH OP
ORGANISATION 1975-1976 10/74-12/76 EXPENDITURES WHERE OFFERED OFFERED COURSE COURSE
Dollars
Dulac 46,952 26/ 10 27/ neg ) iq ible NY
~Iltommlrr.,6.
Prior to $110 - 10 hours
10/74-12/76 $135 (private)
A. Mandell negligible 16 28/ negligible GA
Education
Center
McBurney
YMCA
unknown 18 negligible
160 29/
College Entrance 14,200
Testing Service
142 30/ unknown
.0.1.11.1dlyfteillni....11.0~00limablybspmollmo...16
College Skills unknown incomplete negligible
recordsCenter
Test Prepara-
tion Center,
Inc, NY
88,777 595 30/ 4723
unknown unknown unknown
NY
orIONINOYOMOmmlobaidliftwO"IIIOMMI.0.11....
7/75-10/75 unknown unknown
NY
prior to
4/75-11/75
4/76-11/76.
$100 30 hours
NY prior to
10/74
$195
$65
30 hours
6 hours
NY unknown $75 24 hours
26/ Includes all courses
27/ LSAT
28/ All courses
29/ Total 1973 - 1975, 142 occurred before relevant time frame,
30/ SAT only (Some names may be missing),
40
Ski ,

B. NOT- FOR - PROFIT
We have been aware from the outset that the not-for-
11B
profit segment of this industry was one which required our
attention.57/ There are a large number of undergraduate
colleges and universities that offer preparation for admission
tests to graduate schools.58/ It is ironic that colleges and
universities offer preparatory courses. If they truly believe
that coaching is effective for graduate standardized admission
examinations then it seems logical they would concede coaching
is effective for the SAT. Yet these very schools employ the
57/ See Circulation by Commissioner Dixon, Category I File
762 3033, Vol. I, p. 85, wherein he stated:
I have no objection to this investigation, but I would
urge staff as it seeks to formulate standards for the
advertising of this respondent to ask itsemrhow the
not-for-profit segment of this industry would stack up
against those standards. While two wrongs (if that is
what is involved here) do not make a right, we should
be careful in areas such as this, where the underlying
issues may involve some measure of controversey and
novelty, that the effect of our actions is not merely
to create a double standard, disfavoring the entrepreneur
without eliminating the source of the ailment.
58/ See generally, Category II File 772 3000, Vol. I,
p.27-50. Among those offering such courses are Columbia
University (LSAT), Bentley College (LSAT), Fordham
University (LSAT), California State University (LSAT),
University of Michigan (LSAT), Boston College (LSAT),
American University (LSAT), Cornell University (LSAT),
Puget Sound (LSAT), Monrovian (LSAT), Colby (LSAT),
Adelphi (LSAT), University'of Mass. (LSAT), Amherst
(LSAT), Boston University (LSAT), Scranton (LSAT),
Mt. Holyoke (LSAT), Chatham (LSAT), Washington Uni-
versity (LSAT), Trinity (D.C.) (LSAT), and University
of Houston (GRE).

SAT as a prerequisite for admission and as a predictor of
academic success. Furthermore if these colleges believe the
SAT is coachable then they are employing an unreliable, in-
valid predictor, and they believe it is not coachable then
by analogy the graduate admission examinations are not coach-
able and they are wasting students' time and money.
Tne not-for-profit segment of this industry can attempt
to rationalize its offering of preparation courses for gradu-
ate schools in a number of ways. First, the not-for-profit
courses are usually offered at no charge or at a minimal charge
to cover overhead.59/ Second, some members of the not-for-
profit segment of the industry offer coaching as a means of
diverting students from the commerical courses. They'believe
that coaching (inoluding their own) serves as no benefit but it
is better to serve no benefit gratis than it is for up to
$250.60/ Third, the not-for-profit coachers may believe
59/ See Category III File 772 3000, Vol. I, p.43. Statement
of Fordham University. (no charge).
60/ See File 772 3000, Physical Exhibit Q p.4, and
Category III File 762 3033, p.33-36. See also,
Pre Law Guidebook of Boston College, Chestnut Hill, MA
TT974) p.64e where it is stated you can prepare for
the LSAT "... to the extent of becoming familiar with
the types of questions asked. It has been my experience
that a thorough perparation with the questions that
are offered in the Pre-Law Handbook, the Admissions
Bulletin and the $5 Arco or Barrons preparation book
will eliminate the need for expensive professional
pre-law courses." Yet, Boston College offers an LSAT
preparation course for a fee of five dollars. (The
fee is to cover costs of overhead and printing).
42.

that they are effective. Realizing the importance of stand-
ardized admission examinations in the graduate school process
they may feel that by increasing the scores of their under-
graduate students they increase these students' opportunities
for graduate school admission and therefore enhance their
own undergraduate school's reputation.
Not only does the not-for-profit segment of the industry
charge minimal or no tuition but they also engage in
virtuall} no advertising. Furthermore their enrollments are
rather sma11.61/ The not-for-profit segment of the industry,
although existing at many schools, has a small total en-
rollment 62/, charges de minimus fees, and does not advertise.
There is one notable exception to the general description
of the not-for-profit segment of this industry that we have
discovered. Recently, for a fee of $125.00, St. John's Uni-
versity in New York began advertising for an SAT Prep Course.63/
Not only was this fee comparable to that charged by some of
the commercial entities but the literature distributed was
61/ Columbia U. enrolled 40 students from 1974-1977.
See Category III File 772 3000, Vol. I, p. 28.
62/ Probably not more than 5000 students nationally.
63/ See Category III File 772 3000, Vol. I, p.70.
43
"commercial" in nature.64/ This is the only instance in which
we found a university offering a coaching course for the very
examination it uses in determining, at least in part, who
will gain admission.65/
We have not discussed the not - for -profit coaching that
occurs in public and private high schools across the United
States for the SAT. These are largely unadvertised, voluntary,
non-fee courses and as such would not cause any economic harm
to the student taking one, although they would be a waste of
time if valueless, but would result in social and economic
harm to those who are denied access to them if they are bene-
ficial. Due to the nature of the statistical analysis of the
SAT the inclusion of these entities in our inquiry is not
necessary but we will as a by-product make recommendations
concerning means of offering a gauge of their effectiveness.
64/ Id.
65/ For the full text of an interview with a dear. of
St. john's University regarding its SAT preparation
course and hi.; rationalization for its existence,
See Category III File 772 3C30, Vol. I, p.71.
44
59
VII. STATISTICAL AND COMPUTER METHODOLOGY
The reader who has little interest in the complexities of
statistical and computer methodology may bypass this section
without a loss in. continuity. The following section, "Statis-
tical Findings" details the analytical results of this inquiry.
A. Purpose of Study
The statistical study determines whether commercial coach-
ing courses can significantly increase students' SAT and LSAT
scores. If commercial coaching were found to be effective, a
secondary study purpose was to determine whether various commer-
cial courses vary in effectiveness. Particular study questions
were as follows:
(1) Are SAT and LSAT scores of coached students signifi-cantly higher than the scores of comparable studentswho are not coached?
(2) If coaching is effective, what is the estimated sizeof score increase attributable to coaching?
(3) If coaching is effective, does its impact vary amongdifferent types of students?
To the extent that coaching can improve students', scores
on the SAT and LSAT, questions may arise concerning test de-
sign, interpretation of test results, and perhaps the precise
nature of what such tests are measuring. Although intriguing,
such questions are beyond the scope of this statistical study.
The sole purpose of this study was to'estimate statistically
the impact of commerical coaching upon SAT and LSAT scores.
45
60

B. Alternative Approaches.
Two major alternative approaches exist for estimating
the effects of coaching upon SAT and LSAT scores. The first
approach is to conduct an experiment. The second approach
is to treat an existing situation as if it was an experi-
mental result.
Conducting a coaching experiment requires defining two
comparable groups of students. Members of the experimental
group enroll in coaching courses, while members of the control
group receive no coaching. The purest methods to acquire
these two groups would be to deny access to commercial coach-
ing on a random basis to one-half of the potential coaching
school enrollees, or treat the control groups with a placebo.
If the experimental and control groups are in all other ways
similar, then SAT and LSAT score differences between the groups
would be attributable to coaching.
Analysis of existing circumstances requires identifying
students who voluntarily enroll in coaching courses. Also
identified are students who choose not to enroll in coaching
courses. These two groups correspond, respectively, to the
experimental and control groups of the first approach. As
with the experimentalapproach, if the enrollee and nonenrollee
groups are in all other ways similar, then SAT and LSAT score
differences between the groups are attributable to coaching.
46
61
Both approaches have their benefits and detriments. The
.experimental approach is preferable because it avoids self-
selection of enrollees into coaching schools and because it
assures that the presumably uncoached students are in fact
uncoached. Self-selection can be important if students
attempt the SAT or LSAT under severely competitive conditions.
Under such conditions, aggressive individuals intent upon im-
proving their test scores might be more likely to enroll in a
commercial coaching course than their less competitive or less
affluent counterparts. Also, students whose first SAT or LSAT
attempt produces unexpectedly low scores may be more likely to
elect commercial coaching than students whose first exam score
more closely matches their expectations. If aggressive atti-
tudes lead to better exam scores even without coaching or if
coaching school enrollees are mostly students receiving unex-
pectedly low first scores, then score gains or differences
attributable to coaching may contain a self-selection component.
That is, self-selection may lead to an overestimate of coach-
ing benefits.
Conversely, a nonexperimental control group may lead to
an underestimate of coaching benefits. That is, presumably
uncoached students may in fact receive some form of coaching
other than formal enrollment in'a commercial coaching course.
They may for example attend courses given by the not-for-profit
segment of the industry, engage in extensive self-preparation,
47

or attend a commerciil entity surreptitiously due to a desire'
to receive coaching. These unmonitored efforts, if they occur
and if they are effective, should tend to increase the average
test scores of the allegedly uncoached students. These in-
creased scores, containing a component properly attributable
to coaching, tend to shrink the apparent benefit from commercial
coaching.
On purely theoretical grounds the experimental approach
may be preferable. However, the experimental approach is ex-
pensive, lengthy, and in the real world almost an impossibility
as it would require denying access to commercial coaching to
subjects who want it, or to treat them with a placebo. Also
it would have conflicted with our investigative goals in
that a sufficiently large sample fo: statistical purposes is
unlikely to remain a secret from the coaching schools. Coach-
ing provided in awareness of an experiment may differ from the
coaching normally provided. Since the purpose of this investi-
gation was to evaluate commercial claims made for "normal"
coaching provided in the absence of awareness of an experi-
ment, and because of limited time and study resources, we
used nonexperimental data.
C. Overall-Study Design
Given the practical considerations of time, cost, and
security, this study used a nonexperimental approach to
48
3
estimating the effects of coaching on SAT and LSAT scores.
The major study elements were as f011ows:
(1) definition of a study group of SAT or LSAT-takers;
(2) separation of coaching school enrollees from nonen-
rollees;
(3) establishment of subgroups with similar backgrounds; an'
(4) comparison of coached and uncoached students within
subgroups.
The major study assumptions were and are as follows:
(a) the study group is representative of SAT andLSAT populations;
(b) SAT and LSAT exams are comparable among adminis-
trations;
(c) coaching school performance is consistent duringthe study period; and
(d) the effects of enrollee self-selection, if any,
and of coaching of presumably uncoached studentsoffset one another.
A brief discussion of the study elements follows:
(1) Definition of study group. The study group defini-
tion began with coaching school enrollment lists obtained from
the coaching schools. These enrollments contained student.
names, addresses, and course dates covering the testing years
1974-1975, 1975-1976, and 1976-1977. This 3-year study window
was defined by several factors including:
(a) incomplete, illegible, or missing coaching schoolenrollment records prior to 1974; and
(b) a desire to avoid any confounding influencefrom long-term gradual declines in average SAT
scores.
49
As previously indicated SAT coverage was confined to two
coaching schools in the New York metropolitan area; LSAT
coverage included coaching schools in the Boston, New York,
Chicago, and Los Angeles metropolitan areas. Inspection of
the student addresses allowed definition of the primary mar-
ket areas served by the surveyed coaching schools in these
metropolitan areas. These market areas are compact, contigu-
ous areas which generate most of the coaching schools' en-
rollment. At the 3-digit level of Zip Code geography, the
SAT market area for metropolitan New York was:
. 064-069 Connecticut
. 070-080 New Jersey. 085-089
. 100-127 New York
The LSAT primary market areas were:
.
.
.
.
.
010-029 Massachusetts ) Boston
070-080 New Jersey )
085-089 ) New York City)
100-127 New York )
463-466 Indiana )
)
530-538 Wisconsin ) Chicago)
600-619 Illinois )
900-937 California ) Los Angeles
Given these geographic market areas, CEEB, LSAC, and
ETS then provided the test records for all persons located in
these areas who attempted the SAT or LSAT during the study
50
6.5

windoW. This large group of persons, containing both coached
and uncoached students, constituted the preliminary version
of the study group.
(2) Separation of enrollees from nonenrollees. Separat-
ing enrollees from nonenrollees began with identifying coach-
ing school enrollees within the large group tested during the
study period. Essentially, this task consisted of taking a
coaching school enrollee's name and address and searching the
testing data until that person's testing history was found.
The goal of this task was to establish for each person a com-
pact data set containing the person's testing history, coaching
history if any, and relevant biographical information.
For a variety of reasons, this proved to be a fairly
formidable undertaking. LSAT statistical analysis began with
11,906 coaching school enrollments and 157,982 testing histor-
ies during the 3-year study window. Computer matching using
zip code, surname, and first initial located 9,479 testing
histories for coaching school enrollees. Subsequent manual
matching, for enrollees whose testing histories were no found
by computer search, located an additional 2,869 testing
histories; the manual search was required because of the use
of nicknames, misspellings ,,nd the like.
For the 11,906 coach...n, school enrollments, we had now
located 12,348 testing histories. Clearly, some persons
had participated in more than one LSAT testing year. The
51

resulting search for the same persons in successive testing
years shrank the total LSAT study group from a presumed
157,982 to an actual 132,043. Of these, some 7,981 had taken
all their LSAT tests prior to test year 1974-1975; these per-
sons were dropped from the study.
This left a group of 124,022, of whom 8,660 had a total
of 9,029 coaching school enrollments, implying that the study
contained at least a few people who had been coached more than
once. In addition, scanning sample testing histories indicated
that many people had attempted the LSAT more than twice. To
make sense of this situation, the following table was produced:
Number of times coached for LSAT
0 1 2 3 4 5 totals
number of 1 81,575 3,722 69 0 2 0 85,368
LSATattempts 2 26,660 3,172 113 4 4 2 29,955
3 6,093 1,146 69 7 2 3 7,320
4 785 223 26 3 2 0 1,039
5 190 56 9 0 0 0 .255
6 42 13 3 0 0 0 58
7 13 5 0 0 0 0 18
8 3 3 0 1 0 0 7
9 1 1 0 0 0 0 2
totals 115,362 8,341 289 15 10 5 124,022
Inspection of testing histories suggests thal-,these groups
tend to perform rather differently on the LSAT. This finding
52
67
in turn suggests that comparability of enrollef:s and uncoached
students required some assurance that apparent 1-time takers
are in fact 1-time takers and contained no persons for whom
the presumed single LSAT is really the first of two attempts
or the begining of an extended LSAT taking career.
Because proper analysis of all combinations would have
entailed research design complexity sufficient to overwhelm
available sample sizes, and because 115,129 or 93% of the LSAT
study group had the "normal" LSAT experience of fewer than 3
LSAT attempts arl fewer than 2 coaching school enrollments,
persons coached more than once or with more than 2 LSAT exams
were excluded from the study.
The apparent 1-time takers, 2-time takers, and 3-time
takers were used to conduct a "window analysis". The purpose
of this task was to discover how far to narrow the study win-
dow so that students thought to be 1-time takers were indeed
likely to be 1-time takers, and students thought to be 2-time
takers were also likely to be 2-time takers. The actual
analysis consisted of constructinc' time profiles of 2-time
takers and 3-time takers. The ti profiles indicated how
many intervening LSAT exams passed between successive attempts.
Because the. latest LSAT coaching school enrollments were for
December 1976, and because this group contained a considerable
number of coached persons, we were extremely interc,sted in
53

the effect of using that LSAT as the new boundary for the
study window. The results were as follows:
percentage of LSAT repeaters with 3 or fewer intervening
LSAT exams between successive attempts
2-time takers 3-time takers
1 to 2 1 to 2 2 to 3
uncoached students 75.8 '86.8 55.6
coached before 1st 89.0 96.1 63.0
'coached before 2nd 82.4 86.1 65.6
coached before 3rd88.0 56.0
Assuming that these time profiles of LSAT repeaters are
stable through time, and because three SAT administrations
followed the December 1976 LSAT during the 1976-1977 test year
(the test year commences in October andterminates in July), we
can estimate that about 76% of uncoached 2-time takers whose
first attempt occurred in December 1976 would, if they are
destined to remain uncoached 2-time takers, appear for their
second uncoached LSAT attempt before the end of the test year.
A similar interpretationapplies to the other percentages..
It would have been more comforting to work consistently
at a level of 95%, but this would have required such a narrow-
ing of the study window that all 197('-1977 test year data
would have been discarded. Because the study group was about
to shrink drastically, reasons described infra, it was
decided to leave the LSAT study window at October 1974 through
December 1976 inclusive. in any event, the LSAT study group
54
6,9

was then partitioned into five subgroups based on coaching
experience:
(i) uncoached 1-time takers;
(ii) coached 1-time takers;
(iii) uncoached 2-time takers;
(iv) 2-time takers coached before first exam; and
(v) 2-time takers coached between exams:
A similar adventure marked definition of the SAT coached
and uncoached groups. An additional complication arose be-
cause the SAT testing histories arrived in fragments; that
is, one person's data was likely to be found in several iso-
lated pieces, even within a single testing year. As a result,
the entire SAT data file was sorted alphabetically and a list
of "candidate matches" was generated for each surname in the
coached group. Because of use of nicknames, apparent misspell-
ings, and variations in format of street address, manual search
of these candidate matches was-used to find the SAT testing
histories of coaching school enrollees. Testing histories
were located for 1777 of the 2286 SAT coaching school enroll-
ees. Part of the failure to locate testing histories for all
enrollees in both the SAT and LSAT files is of course attri-
butable to the failure of a coached individual to utlimately
take a standardized admission examination. Because the SAT
data consisted of so many elements and was so scrambled, a
sample of uncoached persons was felt to be the most reasonable
55
70

and efficient way of establishing a control group. The target
sample size of 2500 was chosen to yield a control group com-
parable in number to the coached group. Systematic selection
with random start was used for two reasons:
(i) unknown and apparently unequal fragmentation of
individuals' testing histories removed the equiprobablity
advantages of simple random sampling, which would ordi-
narily be used to allow statistical evaluation of results;
and
(ii) selection of coached students was also nonrandom,
since the coached group contained all students enrolled
at the investigated coaching schools during the study
period.
Choosing an integer between 1 and 150 from a table of
random digits and then selecting that data record plus every
succeeding 150th data record yielded a sample of 2597. The
same type of "window analysis" as used for the LSAT showed that
a December 1976 cutoff allowed working at the 95% level. As
with the LSAT part of this study, the SAT study group was
divided into five subgroups:
(i) uncoached 1-time takers;
(ii) coached 1-time takers;
(iii) uncoached 2-time takers;
(iv) 2-time takers coached before first exam; and
(v) 2-time takers coached between exams.
(3) Establishment of subgroups with similar backgrounds.
The reason for establishing subgroups with similar backgrounds
was to avoid bias either for or against coaching schools. The
56
71

reasoning was that intergroup ethnic, academic, or sex dif-
ferences might lead to corresponding SAT or LSAT differences
and, possibly, to differences in coachability. Therefore, by
an extensive sorting of LSAT test scores we attempted to dis-
cover whether significant LSAT score differences existed,
coaching aside, among groups defined by sex, ethnicity, cumu-
lative grade point average (GPA), and combinations of these
attributes. This sorting revealed that LSAT scores:
(i) vary moderately with GPA;
(ii) are markedley different for different ethnic(and racial) groups; and
(iii) display only slight differences for males versus
females.
Therefore, as described infra, analysis of the effects of
coaching was confined largely to whites.
Restricting attention to persons for whom biographical
information was available further reduced the LSAT study group
size. For instance, using a group whose LSAT exams fit within
the study window of October 1974 through December 1976, whose
GPA was known, and for whom no score irregularities were
recorded produced the following study group.
coached uncoached
1-time takers 2,272 30,459
2-time takers 2,090 10,832
Requiring information on sex and ethnicity shrank the
study group still further. Excluded here were persons whose
57
sex or ethnicity were unknowl or whose records contained
contradictoryinforaiation, such as being black one year and
oriental the next year. The resulting SAT study group thn
appeared as follows:
1-time takers
2-time takers
coached uncoachee,
1,571 22,136
1,259 6,651
Indians and orientals appear to perform differently on
the LSAT when compared to other non-whites. Therefore, and be-
cause these groups comprise only a small part of the uncoached
group and a miniscule portion of the coached group, they were
excluded from further analysis. The resulting final definition
of LSAT study groups is shown below; as used here, non-whites
include blacks, chicanos, and puerto ricans.
white nonwhite11,1T
uncoached 1-time takers 7 2,448
coached 1-time takers
uncoached 2-time takers
1,395 147
5,729 781
2-time takers coached before first exam 672 54
2-time takers coached between exams 1,113 128
Fortuitously, the SAT study subgroups proved to have
very similar socioeconomic profiles, so that no further prun-
ing or subdividing was necessary to assure comparability. The
only qualification for inclusion in the final group, for rea-
sons described infra, was a Pre-Scholastic Aptitude Test
58
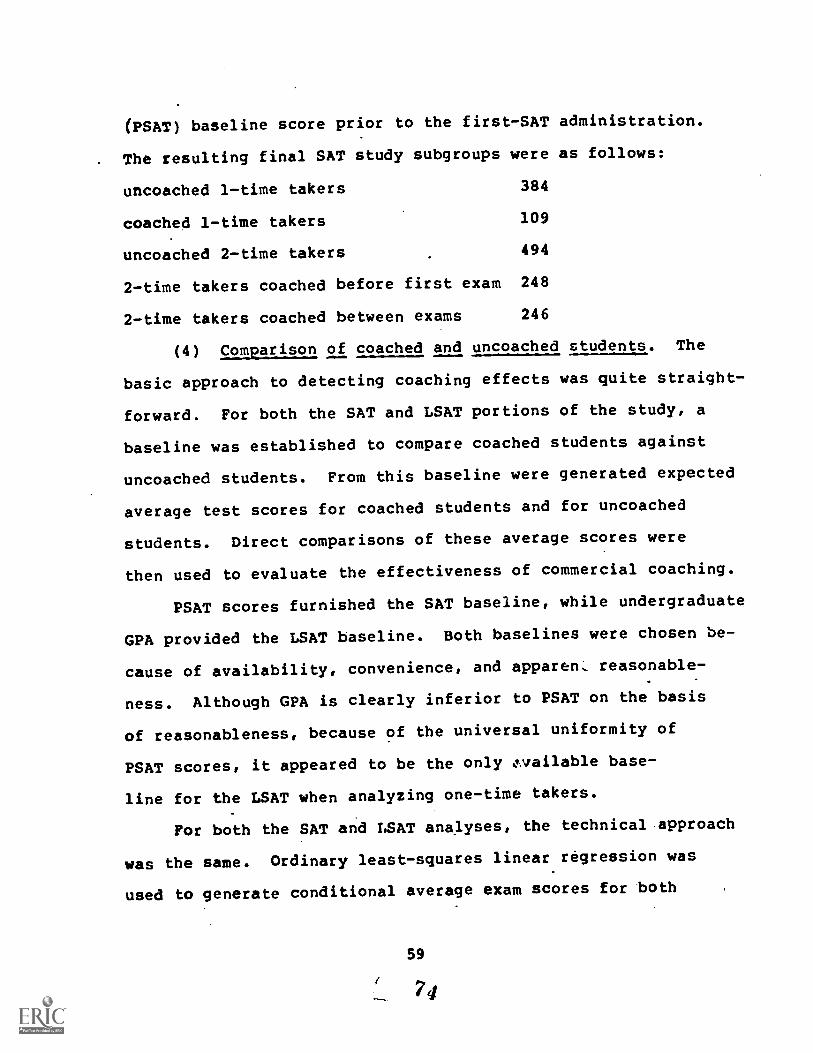
(PSAT) baseline score prior to the first-SAT administration.
The resulting final SAT study subgroups were as follows:
uncoached 1-time takers 384
coached 1-time takers 109
uncoached 2-time takers 494
2-time takers coached before first exam 248
2-time takers coached between exams 246
(4) Comparison of coached and uncoached students. The
basic approach to detecting coaching effects was quite straight-
forward. For both the SAT and LSAT portions of the study, a
baseline was established to compare coached students against
uncoached students. From this baseline were generated expected
average test scores for coached students and for uncoached
students. Direct comparisons of these average scores were
then used to evaluate the effectiveness of commercial coaching.
PSAT scores furnished the SAT baseline, while undergraduate
GPA provided the LSAT baseline. Both baselines were chosen be-
cause of availability, convenience, and apparent reasonable-
ness. Although GPA is clearly inferior to PSAT on the basis
of reasonableness, because of the universal uniformity of
PSAT scores, it appeared to be the only available base-
line for the LSAT when analyzing one-time takers.
For both the SAT and LSAT analyses, the technical approach
was the same. Ordinary least-squares linear regression was
used to generate conditional average exam scores for both
59
74

coached and uncoached students. Estimated impacts of coach-
ing were then inferred from comparisons of these conditional
averages.
The statistically sophisticated reader will immediately
note the absence of fiducial lines around the linear regression
estimates. This omission is deliberate. Strictly, fiducial
lines can be drawn only where the underlying data is the pro-
duct of sampling where sample selection probabilities can be
calculated; because the calculations are convenient and well-
known for simple random sampling, this approach is normally
used. However, investigatory requirements and constraints
of time and cost have prevented this statistically desirable
approach. Fortunately, the difference between coached and
uncoached student scores is sufficiently large that the
absence of this formal statistical test appears to be a minor
defect.
At this point it is of value to focus on the terms
"control" or "uncoached". They have been used in the preced-
ing discussion as well as in other parts of this memorandui
and are used on labels on the charts and graphs appearing
infra. These terms are somewhat misleading. We have not
determined to a certainty that the "uncoached" or "control"
groups have in fact been culled of all coached subjects.
Some subjects may have attended a coaching school we have not
identified, they may have undergone extensive self-preparation,
60
7.3

they may have been coached by the not-for-profit segment of
the industry. For purposes of convenience we continue to
use the terms "uncoached" or "control" remembering that due
to the probability these groups are not pure we will have
underestimated the benefits of coaching.
VIII. STATISTICAL FINDINGS
The following discussion analyzes with statistical
methods the effects of coaching on the Scholastic Aptitude
Test and Law School Admission Test.
It is important to keep in mind that although this docu-
ment is meant to be self-contained, it does not include all
of the different approaches and methods we have employed in
attacking the problems we faced. For example missing from
this discussion are histograms, frequency tables, and analysis
by stratification (although this is in essence included in the
regressions).
In order to fully understand the breadth of this undertak-
ing it is essential to make an in-depth review of the techni-
cal appendices. However such a review io unnecessay to compre-
hend our findings.
The charts and graphs appearing in this section that
analyze individual coaching schools are labelled with either
a numerical or numerical/alphabetical code in lieu of a
coaching ichool's name. These codes are present due to the
convenience they afford in labelling. The codes corresponding
61
76

to the coaching schools names are found parenthetically in
the text of this section after the mention of a coaching
school. The full set of codes which must be utilized to
decode coaching school names in the technical appendices
are attached hereto as Appendix A.
A. THE SCHOLASTIC APTITUDE TEST
(1) SAT 1-time takers
Actual SAT scores for 1-time takers appear on pages
65-67. The first of these pages displays verbal and math
scores for uncoached students. The second page shows verbal
and math scores for students coached at the Stanley H. Kaplan
Educational Centers, Ltd. in New York (SHK) (OO1A). The
third page shows verbal and math SAT scores for students
coached at Test Prep Centers in New York (022).
Pages 68 and 69 compare average SAT scores for coached
students against uncoached students. These comparisons indi-
cate that SHK (OO1A) is extremely effective in coaching 1-time
SAT takers. Average verbal SAT increases attributable to
SHK's (OO1A) coaching range from 40 to 76 points above the
uncoached group. Students who score higher on the PSAT re-
ceive the greater benefits. Average score increases for the
math SAT are 40 points above the gains of the uncoached group
over the entire PSAT range. Students of SHK therefore who
are coached in the period intervening the PSAT and the SAT,
62

and who take the SAT only once, show a combined net increase
of between 80 to 116 points above a' matched control group.
Although generally beneficial, Test Prep Centers (022)
appears to be somewhat less effective than SHK !001A) for
1-time takers of the SAT. Average verbal score margins for
students coached at Test Prep Centers (022) range from an
increase of 60 points for low-PSAT students to a decrease of
33 points for high-PSAT students compared to the uncoached
group. Conversely, average math SAT score differences range
from an increase of 8 points for low-PSAT students to an
increase of 40 points for high-PSAT students above the gains
of the uncoached students. The total net benefit for 1-time
SAT takers at Test Prep Centers (022) can be calculated to
be between a range of -25 to +100 points compared to the un-
coached group.
To amplify on the preceding analysis SHK (001A) shows a
gross verbal SAT increase from PSAT verbal of between +84 to
+42 points from the low-PSAT to high-PSAT verbal scores. The
corresponding control group shows an increase of +44 SAT
points at the lowest PSAT verbal score to a decrease of -34
points at the highest PSAT verbal score. Therefore the net
benefits to SHK (001A) students range from +40 SAT points
at the low end of the PSAT range (+84-+44) to +76 SAT points
at thg,high end of .the PSAT range (+42- -34).
63
78

Correspondingly SHK (001A) shows a gross math SAT in-.
crease of +68 to +39 SAT points from the low to the high end
of the PSAT math range. The matched control groups shows an
increase of +22 to a decrease of -3 SAT math points from the
low to the high PSAT range. The net benefit therefore to SHK
(001A) 1-time takers for the math SAT is roughly 40 SAT
points over the entire PSAT range (+68 - +22 = +46 to +39
- -3 = +42).
This type of analysis can be done for each of the scat-
tergrams presented here by merely inserting the appropriate
figures into the formulas representing the regression lines.
It is important to note that the figures recited in the
preceding analysis are conditional average figures based on
the equation of the regression line. The actual score in-
creases or decreases may be considerably larger or smaller
as can be seen from the plots of the scattergrams.
6479

SAT 111.11
Ver.4
MAI
f2201
111.40
Was
&ism
4:2.22
11140
Map
Mao
210.00
1
1
1
1
I
2
I.I
I
:
I
IIt.3
SATV=PSATV(8.7)
N=384 4.I
11.:
:
I
2
0 .I
0224, eso
1 . I 1 .1 3
....
1 3
22
2 2 2 4 22 42
Se
2
2 2 3
+ 70.4
000000 ........2
I.
. ..
1 27 2 2
o w . 2 2
1 I . 1. . 2j . 2 2
2 4. 3
. 2 2 2. . 2... .......q. ....
I 1
I 2f f
1.
1.
.2
2
. ..
1
.2
3
i3
3
a
I
1
1
I
I
2
2
I
:
I
Is
Z
Os
1I
I1
I
I
I
I
1
I
1
1
1
1
1
1
1
1
1
1
1
1
1
20.00 23.30 30.40 11.10 41.10 44.30
SAT verbal and PSAT verbal coreefor uncoached 1 -flee takers of SAT
27.10 42.44 47.70 71.c
PSAT Verbal Scores
170.10SAT'lath
Scores
....... o.1
I
21
o. .
114.10
I
a : 1
1
1
411.10
.1 3
. I f
412.11l
I 2
..... ....... .... ..2--
Ior f .1 Ili
1
242.0e 2 4 2 42
1
1
I s a 2
:122.11 .6 a a Ia
2 1
1 1 1
I 1 f 2 2 1
11.111 2
I2 I 2
I
11
1 2
2144: a 1
II 2 1
I I I 1
I f 1 1
SIMS 3 I
I 31
2. 4 1
8 I t 13I
1
14441 -60
1 ,41.,ii,r 3co
2
212.12
141.11 11.11 33.40 11.41 43.21 41.111 11.41 13.41 41.40 67.1 7140
PSAT lath ScumSAT Math and PIA? oath .cfor unecachd 1-tloa thl of SAT
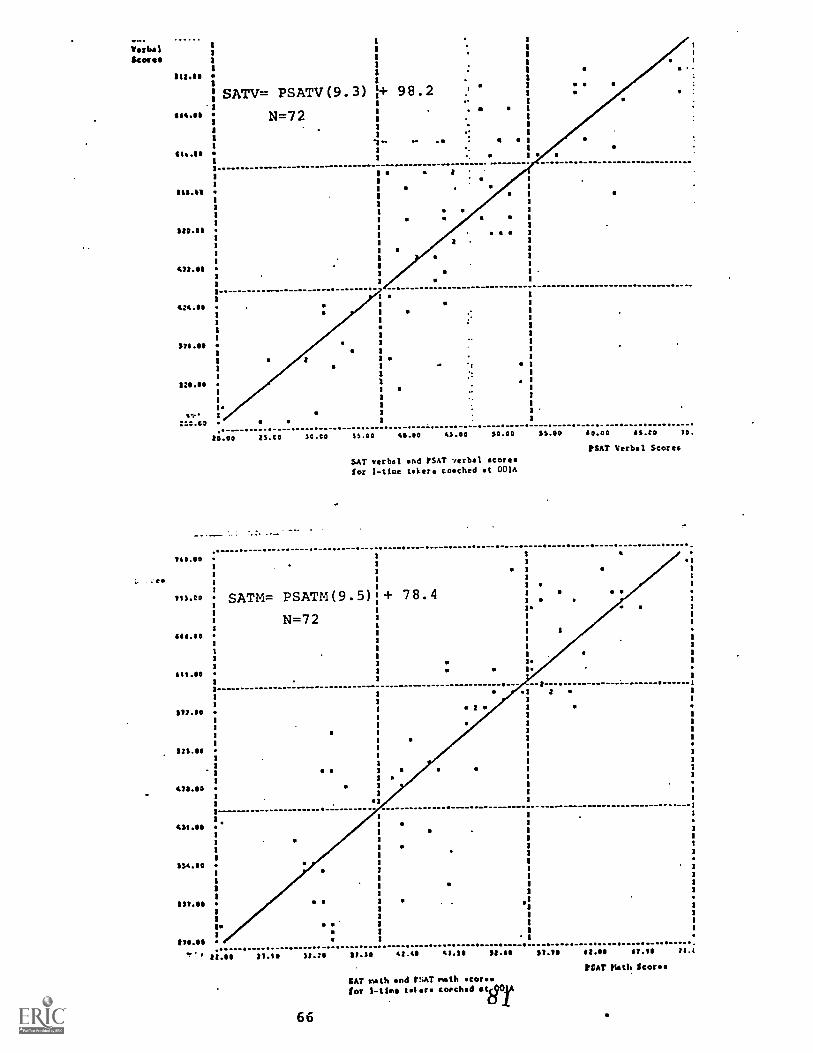
VerbalScore*
e.
1
1
1
1
tsg.le1
1'SATV= PSATV(9.3)A
1N=72$114.112
416.011
MAI1
a
124.02
424.00
a
+ 98.2
1..
MAO
Si...,3
st,:ZIA*
tO.00 2s.co
a
30.00 33.00 40.00 45.00 50.00 $5.00
SAT verbal and ?SAT verbal score.for 1-Clce taker. coached at 001A
740.00
7s5.e0 SATM= PSATM(9.5)
2112.11
4711.110
N=72
+ 78.4
1421.11,
IS4.110
a
1
1
317.0. .
1
1g.
MA,
al
a
. -2
40.00 45.20 20.
PSAT Verbal S
2
' mee 23.1112 32.20 37.10 41.4O 47.15 48.1e 11.70
SAT rash and rSAT nath 00000for 1-11.4 Were coached atinA
66
11
Olaf 47.20
SLAT nath Scores
a
3
".5

SAT /MgtTselLal
Stow'15.0
41/.110
SATV=PSATV(7.11N=37
+ 162.4 .
1141.111
...... 40
211.21
all0.$11a
434.01
a
112.11
144.0
gtg.1
.RIS.1
...
10.40 24.) 16.48 32.10 31.70 4140 44.1 110.10
.SATMathScores
SAT verbal and PSAT verbalfor 1-time takers coached at 022
..... «g.s
s
' SATM=PSATM(10.1 + 35.4sg).
smog
ssg.
.
N=37
IMO,
s
La..a
Sl.le
SUM
IW$
A." IA',
.
.
MAO $41.71) 113.
TSAT Verbal Scores
# ...... 0
la..: /1.71 15.15 $4.11.4 4940 ,Lee Slag ISM SI il.S It
8 9SAT usth sod rsAT cot..0s, $ilas gales, teethed el 022
PIAT bath Scores

i . . . ' - . .1.. :.: . .... . .
200 1 ! ; . : i ; : I : . ;
1 : : ; ; : . 1
- ------- I : .1I : I
. : I 1.:_ ..1- ; ..!. .1 1-400 . ;.. .._...._.: 8_: 4- 1. 1_
; . 8 : I :
1 ;
!- --1-; -I- I II I I ! ; I
300 rT7-1.-:-___.:.._:....__._ ;.... .._._ ._......_. /...... .1----- . .1
-: 1-7- I ----.-- 1
.--1I
- ine.va Ned
1
. I
400
200
I
I o
..,....-7--1...-1.. .........................1- - - i .
1.8 1_Joo la;. ...1. I _ i _44-1 .1 _ _12 Li : _. Li ol'I':1
20 430
SAT t0f3 rLathicor as
700 --
SAT mint verbalfor 1 -time triccre.
tudente
50 60 70 tO/SAT Verbal Score.
*cores a (unction of rsAr verbal scoresres:... 001A enrollee gainat. uncoached
00Ut
;
: I 1
--% I
I
; .
600.1
'1
1
! I _;--
471Incoached
I I ;I , ,
Sooi 1
: :g ! I
.
400 ...____,-I I-_. --1_4--_.. - ---.......-!..._ _4....;__ . 11
o s . ....1
I1 , ; I , I : : I.
; J ___: ___. . __.. :.... : j . 8.4_ '... .. _J
___I ' -i 1 .--71 -----
- 1...* .... . -... . -.-._. , ........1-1-:I
200
I_1
-riI'
I1 J1
1 1_
1717120 30 40 50 60 70 l°/SAT Kith licore
SAT ge oath eor f unc t tan of /SATearth for 1 -tine takers. elapartng OblAenrollee. getnst ,sleoser.e.f tvdents
.
; .
688 3

'term/ /
; :
.L-4,
SAItat,Scot %
700
600
II i L. _ _I . -.. _ ____.1_. _1 I , .
1 - i !' .1 i talc . octiod..
:-
H .i : i 1 ,
-;-i-._ ! .
;4---- -FIT--- 1
I :. . :
. .'.--I
I tr -t ,
1 , , .. ; ;
; :, '' i -I i i--- - ..-- -.--
.ti, 1- . -:-I--i.-400 - ------1 _4
_., _ __I
1,..., l
.1 .... ....! ...... .1 ---......
1
I
. I . I II i
I
--4
-.. : I
1 . . : .. L . .. ..' I
I ..1 1 '1 7- ..r".......-....
1__1 .il__11' il . . 1
---,--. ---- ---- - ..._._.___. ._ . , _ _ .
1.-T-j- -I ---7-7-7-7 71/ I 1_ '
-1
1+1 _l__I ;_ i_i_i_ l_i_i_l . __ _L41_11_
20020 30 40 50 60 70 EJ
PSAT Verbal Scores
SAT verate verbal scores as function of SAI verbalscores for 1 -tire taket tn:-partng 022 enrolleeage ltat tconched tudents
20 30 40 50 60 10 BOrSAT Math Score
SAT varra euith acorn its fur tfon of PSTIN4th et0f41$ (or 1.tir, talfo, tor .arin$ 022enrollee, ttlnt uncoacheJ student,
698

(2) SAT uncoached 2-time takers
Actual SAT scores for uncoached 2-time takers of the SAT
appear on pages 71 and 72. The first page displays first-
SAT and second-SAT verbal scores. The second page displays
first-SAT and second-SAT math scores.
Page 73 compares average SAT scores for the students'
first and second attempts. For both verbal and math scores,
SAT improvement for uncoached students appears to be pro-
portional to PSAT scores; a similar improvement pattern
is shown later for uncoached white 2-time takers of the
LSAT.
The precise meaning of this improvement pattern is not
clear. Possibly, two factors are at work:
(a) Persons with higher initial test scores tend to con-tinue to develop further than those with initiallylower test scores; and
(b) Persons with higher test scores find the SAT somewhat"learnable" even without coaching. The fact that asimilar score growth pattern occurs for uncoachedwhite 2-time takers of the LSAT, who are presumablyalready mature and unlikely to exhibit the rate --Jfaptitude growth of younger SAT students, tends tosupport this hypothesis.
Sc3
70

&AT
Sccres
411.4
SATV1=PSATY(8,1h
I
411.111
1
.N=494. et 1
1
1
c a 2
1
121.101 2
12
11
.2
322221 2 t
) 3 3
433.301
I 2 2 4 .22 I3
a 3 1 2 2
1
1
2 - 2 2 2
3
2 2
31 1 3 2 f g
5'.
2 1 t
..4- .1-4.4.
13
)/43112
$ 2 1.3 2
3a 3 3
3 2 I
. 2 2 1 1
2
1
1
1
MAO1 2 2
3
1. 3
1
MAO 3
ur 130.0
lerb.1S-ore
1.4.40
20.90 31.03
a33
1..e
11)11
ADD01
432.0
m
10.30 31.10 30.00 31.00
S.
-:9
a
I.
1.0.00 ms.o
LSAT and 111-6t-SAT verbal scoresfor uncoched 2-tlmc takers of SAT
1
ShT72= PSLTV(8.7D + 82.7-4=479
40.00 45.00 I
?SAT Verbal Scores
2
4
2 1
1 3
13..
2 2 1 2 1
20
1
3 ) 2p
u p
3
2 3 I
S.3 3
a)
g 3
1
S.II .3 7. 3 ;
Iso; g .m,. 01
2 n 1 - .0," 3 33 , . s
w ; .
12
,,0:004d/Ism I
I 52
, t D
3
a
13.01
22 4 8
3
1 A21 Si
3
3 1
3
11.11 23.111
71
4.10 41. 1.11 11.2 00.10 45.0*
UT Verbal S
PSA7 and second-SAT oralfor wrocochd tler of SAT
86
10

222 360.66
haft&We a
1:41.99a
SATM1=PSATM ( 6'4=454
. 9) + 7' 7. .
161.66It /
1
41241
2 2
a
........
1/J 1
SSI 2 3 2
I.
2* 3 f we 3
...al 322 3 4 2
. 2
a 2 3 3
11116.66 2 1 2 $
1 2 1 2 2 33
144.21
3 2 3 f2
a
1
1 2 2
3
3 3 . .farmirrmwm -1-28
5 2
3.1.50.1 1
II I 2
12 3
2 so 2 2 -
2 1531.611 1 ..
1:
121
1 2 a*.
1
274.00. t
1.120.00
. . o... .
21.00 24.10 21.20 14.10 4..40 44.10 11.40
PSAT and first -SAT oath storesfor uncoached 2ttne takers of Si
54.70 61.40 44.10
PSAT hoth Score.
( 9 . 68 . 3 0
8
SAT 7111.40
Mathscore.
733.4{
1 . .-
1 SATM2=PSATMN =479
1) 1-
as 228414.0!
2
12 12 3
2 S.
3
111.662 2
/2 3 )
a . - .-..-......- ......
14 2 ) 1 2
12 2 2 I.
561:6,12 1 3 4 3 2
33 1
22
2 as
4 1 3
661.66 2 2 4 4 3 2 4 1
12 4 1
12 2 Z
1 2 2 3
1 4 2 2 5. 2
241.0 11 1 1 1 8 1 -
2 1
/ 4 1 I 1 IIlermammma .4ra-r. I.. . ...... .m ....... . w
1
MO.. 41. 2 a
1 8 1
WA,1
2
1
221.861
1
2. '
2211.0
21.66 16.16 11.26 14.11 44.42 16.16 61.66 16.10 61.16 114.10 71
/SAT Path Score.
72
PSAT and scond.SAT Nth Cafefor ongochd 2 -tire takers of SAT
7

SA
TT
ost61S
cores
SA
TS
core
114RI
700600
300400
: , . - .7 i I , ! i
- ! i : I .: : .1..; : .1 I ;
- ,i..-i -
I
e.--/
t--
_I__ .! costr1
SA
I
L-.
1 .
I 1 -;.. . . -.
: iI I --:-.
1
Iii
II I l' ! : I ;. . ..4
- 1 I- 4 '
, :. .:.........:-.-1-1-
-1 : i- - - ."-tit
et SA
T -1
-.
-:.-1-...!-. -
! I - --, .s I
, _..i._!_
_I.
_I _
!_ i. :
.
_IF-1 --11 .. ..
_:...._,. 1._..........
i .. : .1I :- -
:......1L
:Li..1.__
I .;_l
- ?. .
. ..' I
-:
I
I ;
:_ 7
__J
3oo .
! I " ItI-i --,
-i-t---1--,-t-r
7-17
7-1
200
1 -1 1-1..1
1-F--
_
n t! I! i
30
4020
30 60 70 tO
PS
AT
verbI
Score
SA
T
verte
verbal
scores
as
function
of PS
AT
corc
for
ancoAched
2-tthe
takers
603
r , ---,-
--1---
.---I-
---,-1. :. I : ' II--
-..i.---
__.-.____...1: ' I. . i 1--
".-/
: -
- ,
H
1 .__'
I. - . .
I.
!..:__I..1
:-
4700
,ilf.;; , 1
.....-..ncSA
T.
'i'IL1
r. 1II
L.1 1 . ._ 1
L . I , , I . I 1 ' 1.
i I : : I
CI
. .
-1 1 L
.., ._
_____._:___I: ,-r-
r- 11:1-t
. , ..- first
SA
T
I
6.7.
- ; ' I- 7-71-
.1. - Ill.------
i I I
' .. f.-i-'
-1--- .....-
I. ', I :
: 1
5°D
.
400200
- 1.___
I, 1 i ,
t i: I
_
-4 ) -rr ._
20
30
I 1-:1- ----!
40
Sal
. I
______._
_ _ _ ___
60 70 60
TU
T
)1.th
Scores
SA
T
r*.**
sNtIl
sror
full:sitar%
of PU
T
for
untocher7
2 -tins
takr
73
88

(3) SAT verbal scores for 2-time takers coached beforefirst exam
Actual SAT verbal scores for 2-time takers coached be-
fore their first exam appear on pages 75 and 76. The
first page displays first-SAT and second-SAT verbal scores
for students coached by SHK (OO1A). The second page shows
first-SAT and second-SAT verbal scores for students coached
at Test Prep Centei:-.s (022).
Pages 77 and 78 compare average verbal SAT scores
for coached and uncoached students. The comoarisons suggest
that SHK (OO1A) is clarly effective for all students and that
Test Prep Centers (022) is effective for low-PSAT students,
but possibly counterproductive for high-PEAT students; how-
ever, Test Prep Centers' (022) high-PSAT stunts do recover
much of their lost ground on their second .9T attempt.
SHY (OO1A) students show average verbal conditional SAT
score increases above a matched control group ranging from
56.7 to 32.7 '.:Yrits from low to the high PSAT scores. Test
Prep Centers' '022) students reflect gains of 34.4 SAT verbal
points at the low end of the PSAT range but Losses of 55.6 vu.'
verbal points at the high end of the PSAT verbal range The
second SAT verbal score for Test Prep Centers (022) reflects
losses of 22.0 SAT verbs' points at the high end of the PSAT
scale compared to the matched control ltoui.:.
74
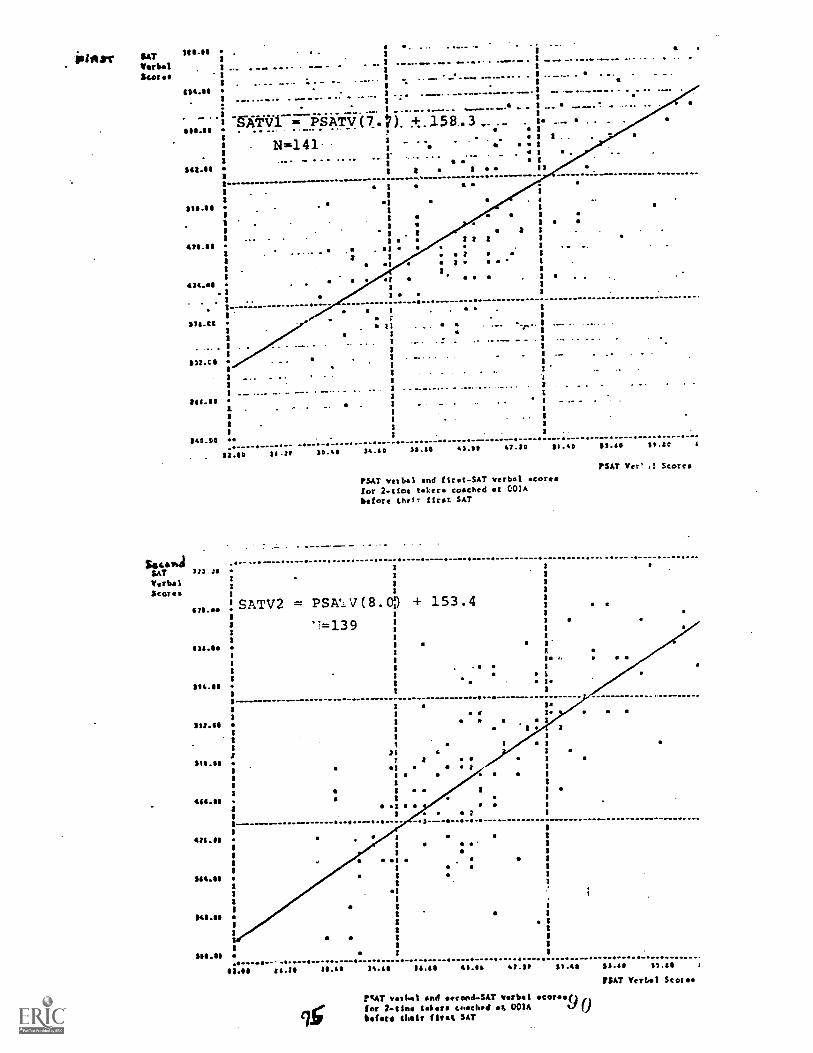
SATVerbal&r
. 4.. .
- ""*-- **
1111.11 =). ±.1583 .
- - -. ..
1
118.681
81
410.11
1
1
424.11. . 1
1
1
174.0211
0000. t232.0 I
WAS.
140.40
00.00
.
2
C
e
3141
34ItaftliSAT 227.00
Vrbal2
178.5 SATV2
434.15
514.0
1112.1
11
31110.48
412.88
1-
411.08
844.18
1141.11
1
810.01
=
.2 a
. II
2
2
2
30.40 34.40
a
a .
-
32.40 43.00 47.20 11.40 13.40 39.00
/SAT verbal and first-SAT verbal scoresfor 2-tioe takers coached at CO/Abefore their first SAT
1
PSAL V (8.05 153.4'1=139
.
2
a
..... .4. ...I
. .
I.
M
2
0
2
di'
5
PUT Vce ,1 Scores
4....0. .0 ....I
MOO 14.19 $11.611 34.45 Mee 41.05 42.12 11.4 11.6 52.211
/SAT Verb,' Scores
V4111401 and second-SAT verbel scarcefor 2-tin tars vlachod it UOIAbefore their fleet SAT

SATVerbalSevres
WAS1 . .
1
1
1114.11
1
SATV.1 = PSATV(6.N.+611.1
1 l' N=1:07.
1111.141
. ,
..... ......1
2416.41
ss
4631.1101
3
1
3
a
1
31!.003
1
158,0_a
1
a
a
1
. ....
. 3
Ofte.aad
13.911 14.13 311.4111 14.410 17.20 41.00 41.10 41.11 17.4e a1.: is
PiA7 Verbal arme
Secorase 76/.66
Verbal&erre.
1611.611
AMU
134.1
"am
VW verbal and fir at -SAT verbal scoresfor 2-tine takers coached at 022before their first SAT
SATV2= PSATV(7.t7) + 139.9N=107
I .. .....
1
1
.....13.1e 11.44 JOA 34.6 1446 411.1$ 61.111 46.6$ 43.46' S.T.ta 6
SAT Verbal Wiese
76
PUT verbal and second-SAT retailfur 2-lim takers coached At gm6416r their flask wr 91
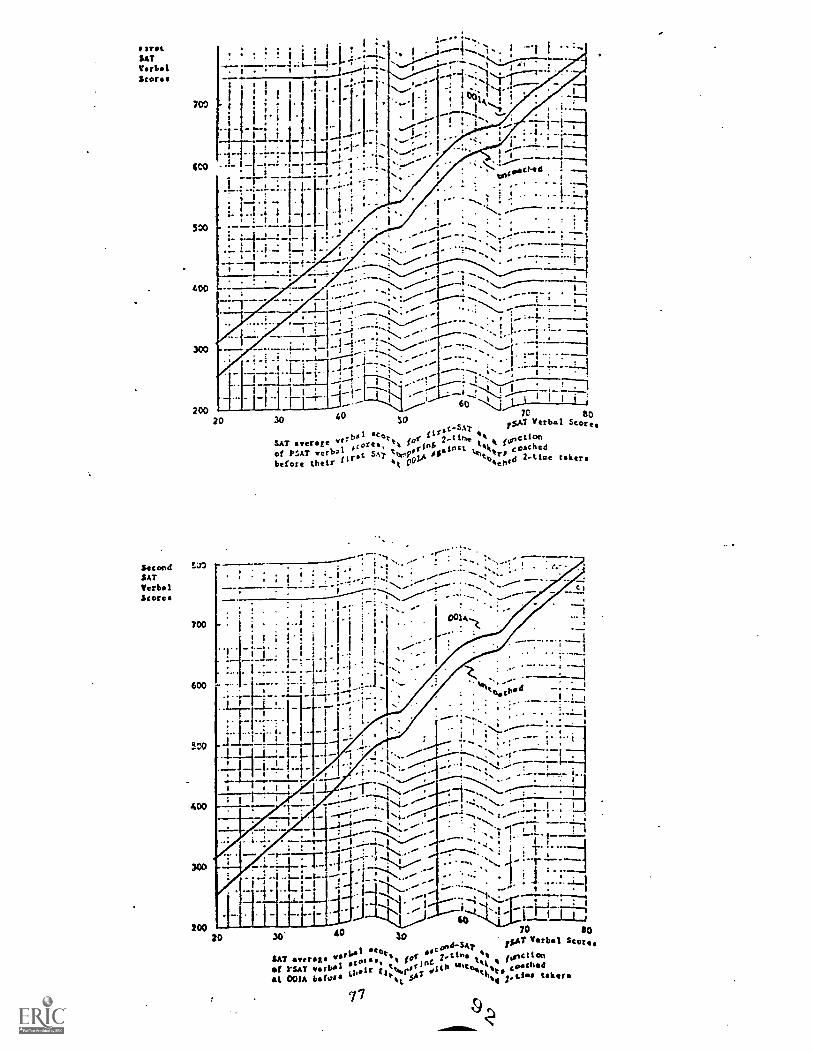
ITIPt
SATVerbalStem
700
'Co
500
400
200
Second ELIO
SATVerbalScore.
. : 2..,......._4._, .
..
. . .,Iiii 'i'L...,,.....,_.1 .
.,.:._t_.),-1-:,-; 1 --:--!....-,......,
r.--- ;...,:...>,------
.........--, .: 4 ...:.1.,i .;..' I '.` 1--r---1--1
- i; t 1
j Imo!_
. ... I
. '..---
t Til i__......1,.-1 -I . s_...-,.._...,
i .....1. . 1
...L. _ _._..: . .. - -:----r_d-i-.- -:-s-i- , :, ......._
.\--:. .-.0.4:d.:=11-1.-_,T1
i '.-r: 7 1.- .... . -,
- --.. : ..1
''' -.,.. I .! - - I.. ;_,1
I ''; .
\_ ...------- -- . --__II 1
1 - !
:-'.-1__I__:,_ I. , ,..----- ' ---: 1
' I I' .'- , '- : '' s 1-;'"*----- '''
-77-1--: ":,,,,...--
:---------1--------...;:-.21--'s
7....1--- -.-/-* -2 -.-
..-.--- - : .....-' ', .,,,,.""--------1,-
.---- 1 '4
N... -----'7"- ; ---;
---;---------.. ' .-- f: ,-"' '. ..--........ ..:
-_,_-, 1 :---................--4----... : , i-. -f _. ,
.
t____, ...:_.; _____.............:
1 ' I ''.1 i :............." ... :.. #I
I LI j I H!--1. ,--i -1-7, -- k.,,,-- .-- -:- s ' 1 - ;--..I -: ..--...J
----- ..,-' \ ..--''
20 30
SAT verase vericor:::1.e,
of PSia verbal
---i.,---.--.-J'IvyJ---,-'II --1.-
40SO
./.--
'foc.,t. 1.1i1,isA,7T2: a
likens
ea
in$ 2-1113e t foiction
60 \,..,..i...J__3- ' i I i ;
, _-
before their fIt." 5AT
tbrer oglin" uiltikr, cosched
1t 00114
f.. ! ...
# ..
I . i . I
./....l
.
--..- : , ............. r'-: " .......s...! "...I- . ..... ,..j..... . : ...., .......,../
: :s.......''....--.1 , ,,.. 's! .
: i i ii ; ; '', '' . .I
0014....tI
1
.,. . -
200
.
:.... -, :
1" ; ;- ;1,
,
s_.
,
- .
- ..1...;..!
, _ . ,
20 30' 40 ao70 SO
SAT t f In. 5%
rAST Verbal s c ,,,,
se varlA I at6r,,oar ena-SAV
ofI$AT
verbal "I"' t '°,, Int ,. l,,,- g iting11011
At 001A Woof 4".1. titt%r:Al °II" -itt% 'i "chedt ..-
th toNI 2,Liovo tokens
77

SATVelblScores
I
,5
1 0
. ....... :; ; .5 i t1- .. .- .. - 4....--,;.................
.--
Second 6°.-1
SATV erbalScore
700
400
500
-400
200
:0 30 40 50 60 70 60PSAT Verbal Scores
SAT overage verbal scores f or first -SAT a functionof PSAT verbal scores. Ce"TArifIg 2-tine takers coachedat 022 before their first SAT with uncoached 2-time taker
_
r .: 1 -i'-'-'7-!-71-7 . .
t , .:
.:
i I : : --.----.. 1
[ ; ' '1- -.1 !-1.-:- -.:i I
. :..
i..1-,--1--- ...-T---:1-' !
., -11 1- i I!
1-71.-1---.! -1. i_i
L-' i-.! :
... .:_ ,-i--1.- .
1 . ;. :. -..---i--,--,--7-1
I ' I . -:7.- i f-7:-171:1_1
1 1.. !-f !-I .........-.:.--.I
1: ._
i s : . , .t.! ji, 022-7.._.... .
:. _ _ _ .i___.... i_
,. 1 .
.,...
! ;
1
1 .
I ; :-....1
--- ___ _...-f -7---7- I -T.--
. .r --if--
- II 1 4 1
:1-
1 r---t-
I 30.F40 SO 70 110
verbal s
SAT eeeee g verbal icor for ond-SAT trunotionof PUT verbal scoria. emparinr. 2.410. taker, coaciridat 022 before their Urfa SAT with uncoached i-ttoaZjaaro
20
I
78
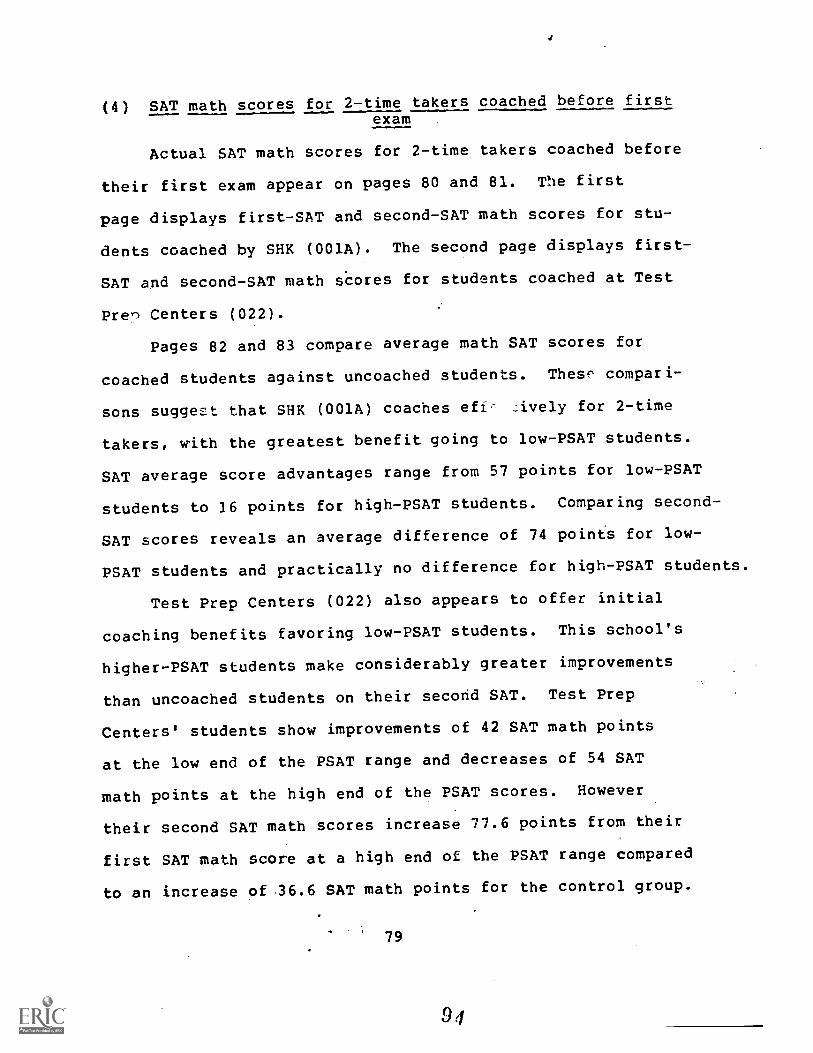
(4) SAT math scores for 2-time takers coached before firstexam
Actual SAT math scores for 2-time takers coached before
their first exam appear on pages 80 and 81. The first
page displays first-SAT and second-SAT math scores for stu-
dents coached by SHK (001A). The second page displays first-
SAT and second-SAT math scores for students coached at Test
Preis Centers (022).
Pages 82 and 83 compare average math SAT scores for
coached students against uncoached students. These compari-
sons suggest that SHK (001A) coaches eff- .:ively for 2-time
takers, with the greatest benefit going to low-PSAT students.
SAT average score advantages range from 57 points for low-PSAT
students to 16 points for high-PSAT students. Comparing second-
SAT scores reveals an average difference of 74 points for low-
PSAT students and practically no difference for high-PSAT students.
Test Prep Centers (022) also appears to offer initial
coaching benefits favoring low-PSAT students. This school's
higher-PSAT students make considerably greater improvements
than uncoached students on their second SAT. Test Prep
Centers' students show improvements of 42 SAT math points
at the low end of the PSAT range and decreases of 54 SAT
math points at the high end of the PSAT scores. However
their second SAT math scores increase 77.6 points from their
first SAT math score at a high end of the PSAT range compared
to an increase of 36.6 SAT math points for the control group.
79
94
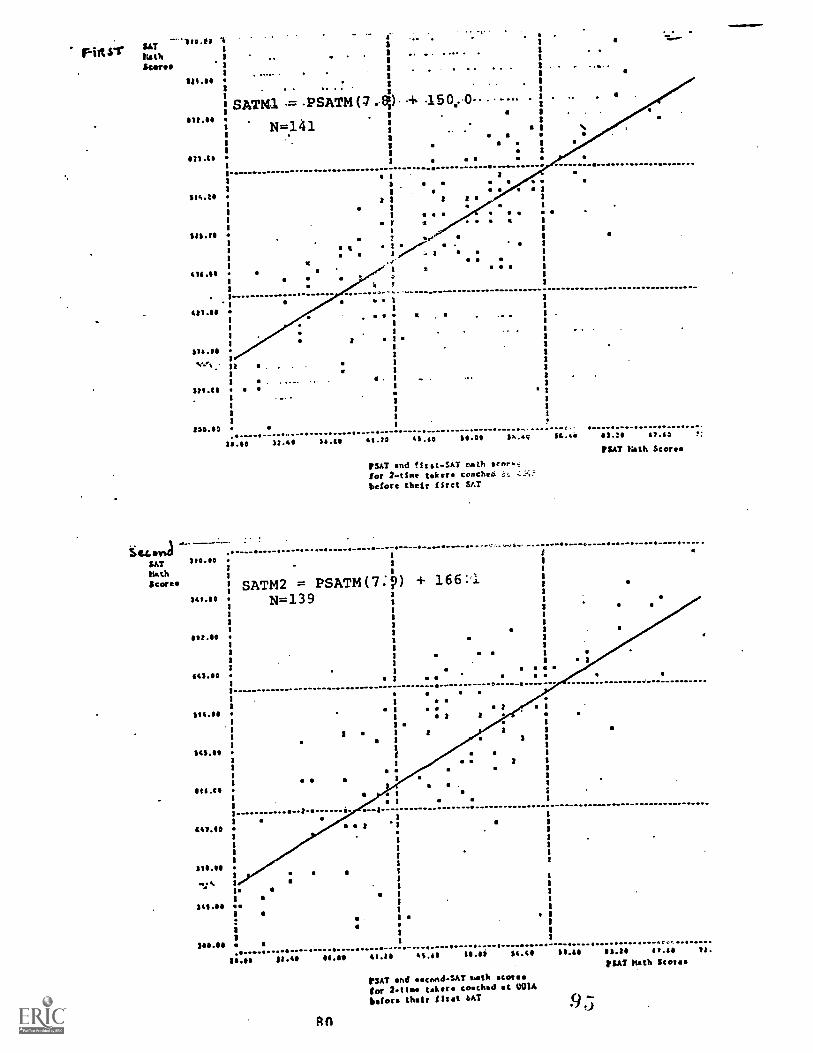
F-ut rr SAT--Isr.tia 1
1
14th 1
Score, 1
1WM1
SATI41 .= PSATM (7 ..13) .150...0012.00
3 N=141
621.441
1
1
1
$144.1
1
1
*
313.0.1
1qg
471.001
1
. 1
1
427.001
4
1
1a
370.01. 1
."". 11
1
fte.t1
1
1
1
230.02 .. ....14.50 32.46 2.40 41.22 41.40
t44..SATMathScores
08 a . 4 1.8..
"
II
I
.,
./. .....: s
a .
10.00 97.q St.55 41.10 47.41 !:
?SAT Kith S
?SAT and first-SAT oath ocnrifor 2 -cisc taker. coachea
before their (Sect SAT
. ........
110.001
11
11
1 SATM2 = PSATM (7: 9) + 166 :1N=139141.90
612.60
I
441.00
1a
1
114.01
'11
2 3
1
S4S.101 2
1
I
let.t.a .
- -3 -.. .1
3 a 1
2 1
1
40.05
3,..001
$411.00 .2
ISOM. 4.. .
f
24.0. stoke 14.10
an
...
41.4 15a. 14.45 24.40 62.30 64.44 /1.
'SAT Math Seer..
?SAT and .cond-SAT math *cotefor 2-tlia. taker coached at OglA
before their first /AT 90

.S4 46.4 411.0 4.8 9
SAT meth 'mod rsAT siTII Sc.,..Sew 1111Aos 1.1.1 coached et 022


MICROCOPY Ri',0(11TION IL ,

Stem1
478.80
100.111
Sat.,
St0.0
fe.101
410.0$
311.111
S$0.0$
1
310.0 .
$70.20
11.11
SATM1 = PSATM M 9) +. 15 7.
Nag107
17.13 35.t8 21.40 1. 7.00 51.0 SS.00 s.0
[SAT and fire; -SAT meth scoresfor 2-time Were coached at 022
before their first SAT
SitCtita ..... .... .--....... ..... .....
11A7Ile.8
I
Math 2 SATMZ = PSATM ( 8 6) + 94.6Stereo I
H0.0,I
I
1
I
414.00t
I
I
e
I
.0II....... ............ ..... ............................ . ...... ..... .
1
1Il Il 8
1I,A0 .1
I
ta
t:
411.11
N=107
$
I
400.1111
.1
51440 1
1
100.011
aft.o.I .
IISOM as.....L........................... ..... ......04..........00.00 ..... 0.0.0 . 0
Mee tt.im 35.15 I1.00 31.01 41.11 4E00 11.11 SSA@ SIAS AS
PUT rdith S
00.00.00000000
ria7 Math Scores
a
81
tit? end stand.SAT ',silk ters*ler 2.ttes tehor coached at OZZIslets theta tIrst SAT
96
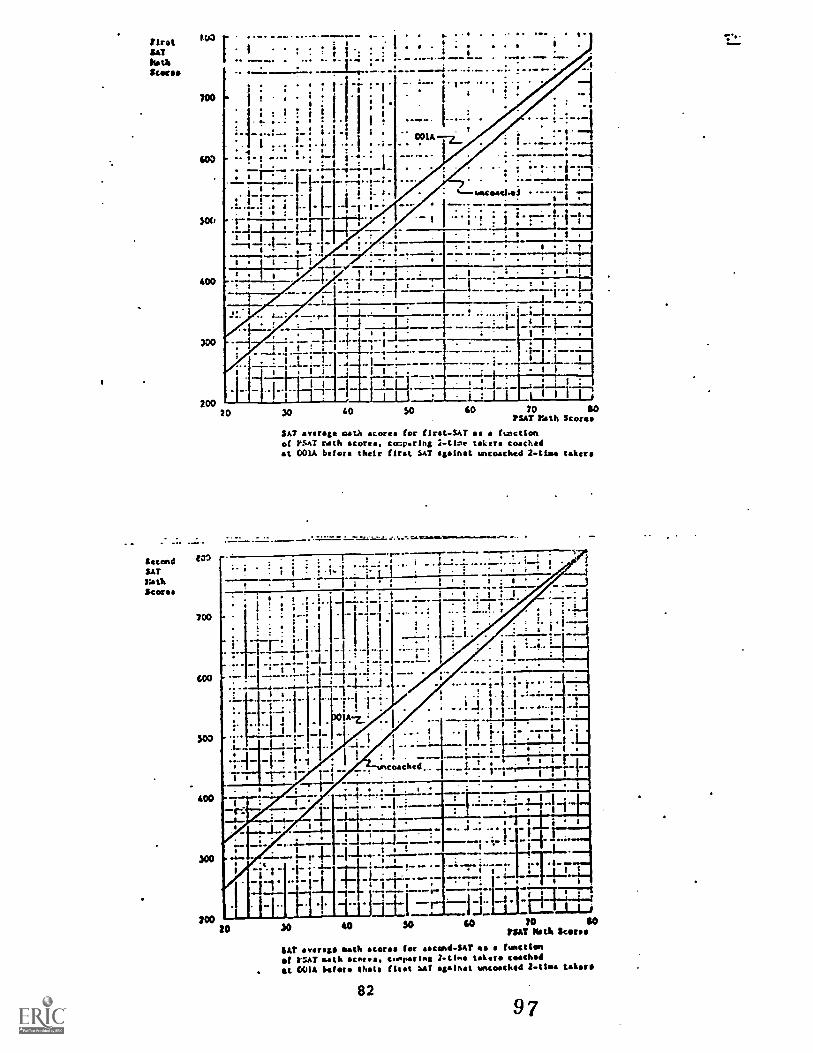
tlrotSATMathStereo
SecondSATIlath
Scores
:5
room
.-- ..,... ..1
I : ; . : -; : -1700 I 'I
.
; i 1!i
s :
.. I..1 -s. ... . $ : . 1
... _.._:__ :- : i .1 i
. 1 . I '.. I. I . . 1 . .;4 1 1
.. $ . . ..... . *.. . .
i . ..._..
..:-.................:- -.1- a...4 e :i. 1. . I
.!.....................,J.-...: j !- . I1 I
s j .. 1... : .. s t .
...ow.....1 . '.: / II , 1 . ;. 1
1 11.1;..- 1 i : t 1 1.
.....I . . 1 1 ; . 11400!
: __:I-2.i_ i-.I __-__A
. : i I I
"..-
'. : '-!' -1.
4---uncoseLi --7-1..":
g ::. ; 1
200
I - . I
--1---1-1,____ ____ ....... :--r-i: ,-, :-:--1 .
1 _: 1# I
. .
1
1 H____; i;" ..,1:....i....1--.
-aI I
- .. : 1 L : ..1.--. ------ --1 .L.... 1
1 1
I i
-17-20 30 40 $0 60 20
MethSO
SAT to oath scores for first ..SAT as functionof PSAT r ..th comp.ring 2 ticoe takers coachedat GOLA before their first SAT agslost uncoached 2 -Liebe taker.
SAT average oath (or cend-SAT as function
t t2AT oath scores. a voila* 1 -tine taker coachedet GOIA lifer. theft Mist MT against uncochod 2-tiss takers
8297

/intut"RathUses*
SecondSATStith140C*6
100
'Co
. .I
. . .. .
.1..:! o . ,
-
.... -
. . I. . .- ... J...
I i . - ! 6 t . ! II
. . i . - ; i
i
;.
i i t !e ; I ! I
!.. :4:ii.. 1. ! I. 1 1 I . : .
1 -.....1.- i .1. .. I . s 1-
-16.---%!.-i -11-!.!-- -1-.7-- ,
1
1-1 -..--;7-.-
i 1 : : .1 .. ---"1"1 ! -1 '14: .. s : ..;', s........i-4. i.
! 1 I --1-i-4 4-.1:.:._: s. .
1 .......i ..; : 1 - e
-:-.1-:. , ; ' . ' I : i I
............:...-,-........ --i lel s II
..-. -..-.-- : .-. - -.. .- - . !.-.
. ' '
-4. I
s I. 54
: I1
'
- .:.ai.......... :...-_______1............4...... .............. .. .
! : i 1 . - i
r,
__-1 ' I
1 I i I ;!r 1. --- "I'"7
..m.'; I I i . . r:..1T1-:-1
i . J.; I I : ,
I . 9
'.............L..".. ."; "I 1 1 r--, .---- ;--... . . . :
1 1
__ .-f---,--:
--I i-I --I -1±1 ,_;_,......_:... , : i
.........,i :! I
3010 70 CO
?SAT Math Scores
SAT to oath scores for first -SAT as a /uncialof IrSAT oath scores. cor.paring 2-time toter coachedat 022 before their first SAT with uncoached 2 -clue takers
.122 -.. 0.--., . .
1
200
too
20 40 30
r: : : i i . .: i .... I : ;- ..! . . ...t ir".:..JT_....._u_
. . 1 . : , . :
!
1
. ... --_._:. I _..z...--.__._P?st..
:1; ; : :III ; l'i , I 1022700 1 1 ' '- ' ' " gi 1 1 .i."'
:
. : 1 .
...,- 'l
:- I "-:-*Ci I 1 11. I.
..._:
I
I ; i
. i ! .-I-1.1 .1- ..!" ... -..-: : I; , .:--1__L___
L ' ' -. i500 - -""7-i .!--t--1:::- 1-
; --F-1-7:.--1-17: !.. :_: ._1_
,
.1._,__:. 1 ;. . .. , :.: 1..:..i.:_t...:_i..:_ , ._ ..._:_i_.; 1 !_:.....,_!
a 1, , :
f ..1- !
- "!! 1 i !-- 7:-t ! i
: isTr--!.-i I - :1 .. 1
.....4
OM
..±.1±1.... . .
--r I, ------";.-7-7.71-s . 1
sit, ,
--t' ----;1. .
1
1I ."7-`"-
'---s.
300
...ow
.1-.an 1: Ulm....
120
SO 70l'SAT Math S
SAT oath acorns for second-SAT a /unction64 11141 Path acorns, Co4rsflPg Islio0 lia..01111 Csalthad
I 027 Worm their that SAT with encaechad 2 -tine tater@
30
8398

-(5) SAT verbal scores for 2-time takers coached between
exams
Actual SAT verbal scores for 2-time takers coached be-
tween exams appear on pages 85 and 86. The first page
displays first-SAT and second-SAT scores for students coached
at SHK (OO1A). The second page displays first-SAT and
second -SAT scores for students coached at Test Prep Centers
(022).,
Pages 87 and 88 compare verbal SAT scores for coached
and uncoached students. These comparisons suggest that
SHK (OO1A) is effective although Test Prep Centers (022)
offers minimal benefits.
SHK (OO1A) shows a fairly constant increase over the
entire PSAT range with average conditional SAT second, verbal
scores increasing from 43 to 39 points. Test Prep Centers
(022) shows increases of 1 to 7 average conditional verbal
points over the entire PSAT range.
99
84

11111Cii. Verbal&coco
1.
SATV1 = PSATVii.5/ + 133.1
N=16q
2
471.111
3O
3
43$411a
35
2 0-
ISS01
a
341.10
3
I
0 a1 a
S 0
if
I
S a1
III SiO II
a . 3 0I 4 1
a 1 a a
2...,.:
Is, _..-- ............ ..,......... - ....... ..
I
MOO ZIA* 33.20 3300 at 40 tt ....00---- ..................7p;41..$7.22 "'SA? Vcrbl 5"re
VSAT and first-la
c°4c1:t1 :ctoGgebetween SAT ersto
SWAM/ ...-............---...
SAT
. ..............--*----1
...........
of115.
. .- ..........
Verbal I.
.
.I
Score.t .
S
I7
S
t
S
414.10 SATV2 = PSATV(8.d) + 128.1I
I
3
.
I
3 N =155 1 a I
I0{1.11
,
1
1
1
1
/
1
s a
008.1S
I
S
1.....-.... ....... -.....-_ ---. ....... ...........-- ...ie.,. . I ..
I
e
1
a2
S44.00
a 0I
I
I
1
I
II
a I I1
1a
I
01043II
11
I
4170.18 0 0
1
I e. 1 If
3...............................:..4 .. ... ......"-. .
.... ...... ......................-
410.00
.............I
422.8113
11
I. t
I
ISSAS1
I/I
1
I1
WAS'oba. 1
1
200010
SSOSS.4aw .....
MIS 33.28 01.4112306 ' 11;19 .. As.00 ".......... '"
42.$Z ..... . ..42.40
!SAT et"' $"1"a
85
LSAT and gerund.&5A: "bet sicrso
Cor 2"1" -41-ges114cbid 2 00IA
between :AT 'sake

Scores 1
0 1
SIMS 1 I 1
t
151.0 ISATV1 =PSATV(9.0)
oia ! N=78
4/4.10
1
3 1
4115.5 1
354.00
1
I St1.00
1
1
231.00 1.
r4 1-
230.00
+ 87.2
f
1
.
a
t . . 1
f
a a
1 .
t
T
..... ...... ................
a
..
ISM 24.50 20.00 33.33 35.20 43.34 43.01
0SAT and first -SAT verbal score.
for 2 -tie takers eoached at 022
between SAT exams
................... 31.35 31.00 40.10 45
tut Verbal Scores
itc.oree)
. .
Verbal SAT CMO
1 '
1
....... ....... ., 4... ...I.
1 SATV2 = PSATV(8:6) + 84.9
Scores 2 1
MAO s N=75 s
s
s
3
1 t
. . 1
222.12, 1 ..
e s
I 3
. I
s s
.. .:
t 1 t .
:
S3S.O 1 1
.
/
1 o
j 1 1
...«.-......----.......-1«:
1
« ..... «« ............. «....: aft
4,11.0 1
S I
; 1 a
1 1
1 1 a
t 3 418 1
I 1
1 0
1 3
1
1
443.11$ o 1
1
1
1 1
1 1 * 1
1 1
a s . s.
s
I s a s
s
400.00 e ; 1
1
1 1
1 1
1
1«...«......-7-«
1
I o«.......
...................«......«««««««««
........ «...«.......1
SSS.O$ S 1
1
I
I
s
I
sts.to
:
1 a
s
.
2 1
1
1
1
122.9.1 t
.
le
1
. 1
1
1
1 '
1
111.11 w /
1
.s........1......................... .......... ...................................
............... .
111.10 82.1 21.111 '.2.11 16.1, 4/.111 42.2111 $1.21 10. 112.11,
Score.
PEAT sad orond-SAT verbel scores
ti.0 Verbal
for 2-Ifo tiare :7chd
ma 02:
IrlUveft SAT exams 0/ 5
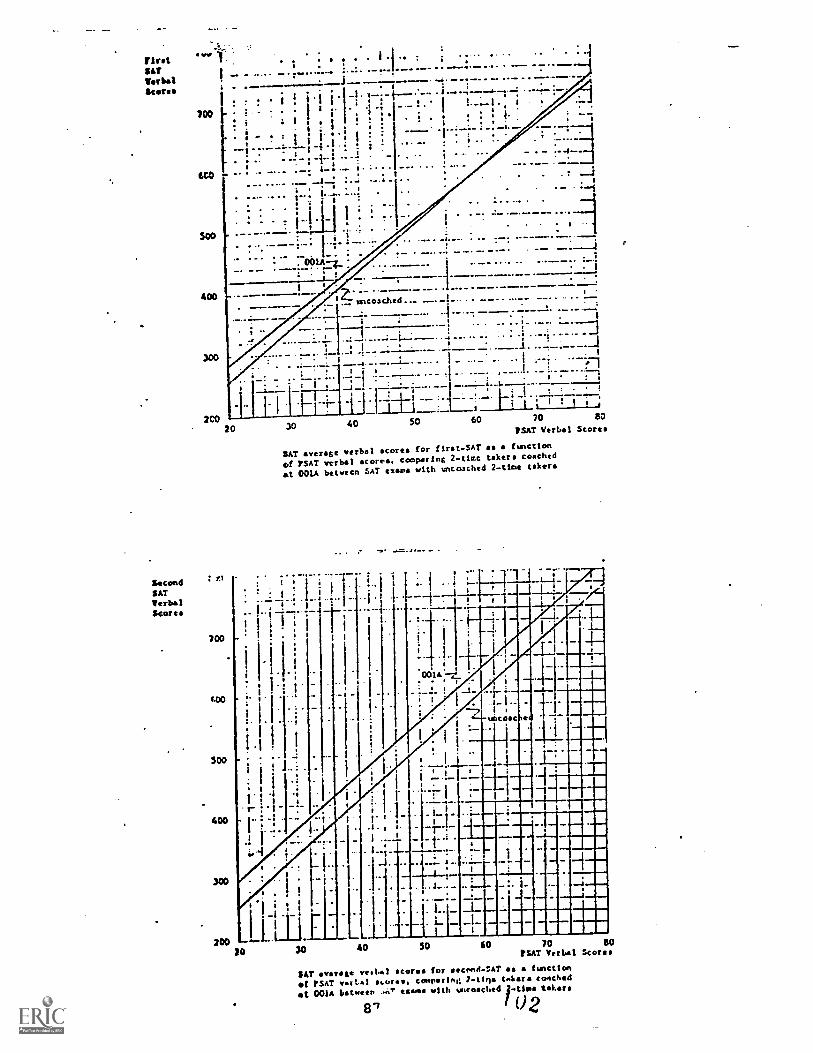
rivet
'CO.'UT
Scores
SccdSATVerbalScores
..
J
700
6C0
400
.....I
! i i. i _1. !---;i---.*--- 1. -4
; I.4 , ., .; ..- 1. I l......-1 . i
. 1 ,. z '-11 !!. -1..1 '. ' I.
i r . . :. . . - . . i. ...: ,
i
.-11 ..---7...: : ..il .. i . . . 1 1. : - . !
........ ..- -L.. :... .-.:.i ' 1
. I z i
7 i-1.1:1 :
. 1 ' .
_,... 4. __
7obu: '
- .
. !,--1
...-t - -.
._1
"' -1 -1 : -----a _, I. f
i . .
I _t_111.-.. -T. L : ...-.........---.......
1 1 I ri t i / : 1 I
20 30 40 50 60 70 sorSAT Verbal Scores!
SAT se verbal scores for first-SAT . function
of LSAT verbal scores. comparing 2 -tire taker coachedat 001A between SAT ex... with uncoeched 2 -tine takers
2C0
r.i
100
500
400
200'0 40 50 60 70 BO
?SAT Verbal Scores
SAT Re vestal scores for creitt-SAT Aka firietlonf ?SAT vertal n.or. comparing 1-ttria tekr coachedtit 0014 Lstweer exams with tosrosched j-times tellers
I 02
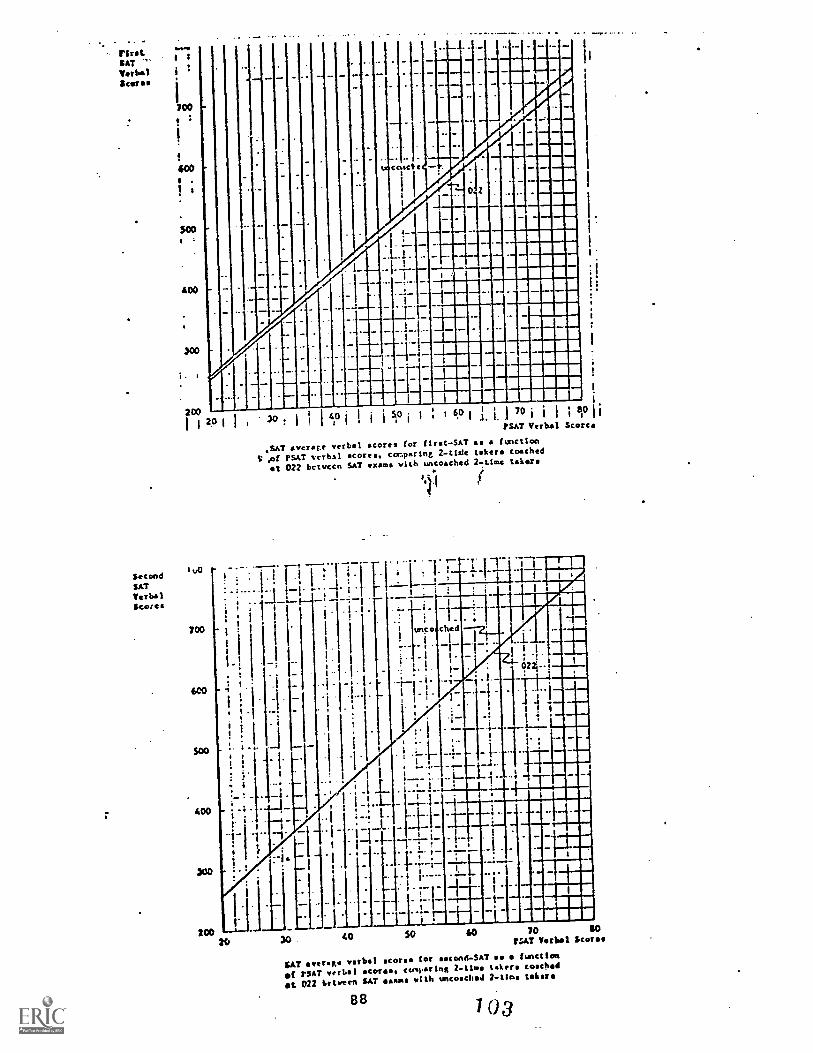
SecondVATVerbalScores
owvI
700
!
400.
500t
400
200
1v0
700
600
600
300
coact,
20 I30 40 I 5O 60 70 so
?SAT Verbal Scores
*SAT average verbal scores for first-SAT a. !unction
V ,of PSAT verbal score.,comparing 2-tide takers coached
at 022 betwcen SAT exam.with oncoached 2 -time takers
w co
I _ .
20020
5.40 60 70(SAT Verbal
IICAT.serene verbal scores for second-54T function
f PSAT verbal scoria,comparing 2..ttoa toter. coached
at 022 betweenSAT saws with oncoachod 2 -floe takes
88 1 03

16) .SAT math scores for 2-time takers coached betweenexams
Actual SAT math scores for 2-time takers coached between
exams appear on pages 93 and 92. Page 91 displays first-
SAT and second-SAT scores for 2-time takers coached at
SHK (OO1A). Page 92 shows first-SAT and second-SAT scores
for 2-time takers coached at Test Prep Centers (022).
Pages 93 and 94 compare average math SAT scores for
coached and uncoached students. As was the case with verbal
SAT, these comparisons suggest that both coaching schools
are effective, and that SHK (OO1A) is the more effective of
the two schools. SHK (OO1A) shows second average conditional
math increases between 22 to 76 points from the low to the
high range of PSAT scores whereas the control group shows
ir.aeases of 1 to 35 points. SHK therefore shows a net bene-
fit for second-SAT math scores of between 21 and 41 points.
Comparing results for those who were coached before their
first SAT and those who were coached between exams suggests
that coaching and SAT experience confer sliybtly different
benefits. Coaching without SAT experience appears to help
low-PSAT students. Exam experience with or without coaching
appears to help high-PSAT students and coaching after an
exam appears to help everyone. Possibly, this may mean that
commercial coaching tends to stress basic skills and remedial
learning, while not emphasizing the more difficult portions
89
104

of the SAT; however, high-scoring coached stutie:its with prior
SAT experience may be able to integrate their coaching lessons
with the requirements of the more difficult parts of the SAT.
1.J5
90

SUMO'U.S.
47/.111
MAIO
S60.06
Mal
4$0.011
4t1.0
340.00
21448
243.00
1
1
1
1
1
1
1
II1I
I
II
I
II
3
I
. .
SATM1 = PSATM('13.0)
N=168
0
P
a
2
+'114.8
3
OSa 0.7
aa
a ;r a
SATMath****
710.e
736.00
405.00
6)7.80
1186.00
814.1110
433.11
362.10
331.11
ROM
74.00 31.50 34.40 31.13 45.30
3
a
- .. --
5t.s0 55.80 61.10
PSAT and first-SAT math scoresfor 2-t1me takers coached At 001A
between StT exams
06.40 71.70 73.
PSAT With Scores
« . + O. . . ..
3 SATM2 = PSATM(8.19) + 118.7 0
0 0
N=155a
1
a
I. 00
= 7
21
a
1 7 el I
2
1
C
r
I
1.1
1 so
I
1
Ima .....
14.68 11.38 14.64 30.10 13.20
Q1
30.00 13.10 61.10 46.4 71.70 7
PSAT Huth Score.
PSAT and second-SAT math seemfor 2ttm. Ws,. coached at 001A
between SAT exams
1
1
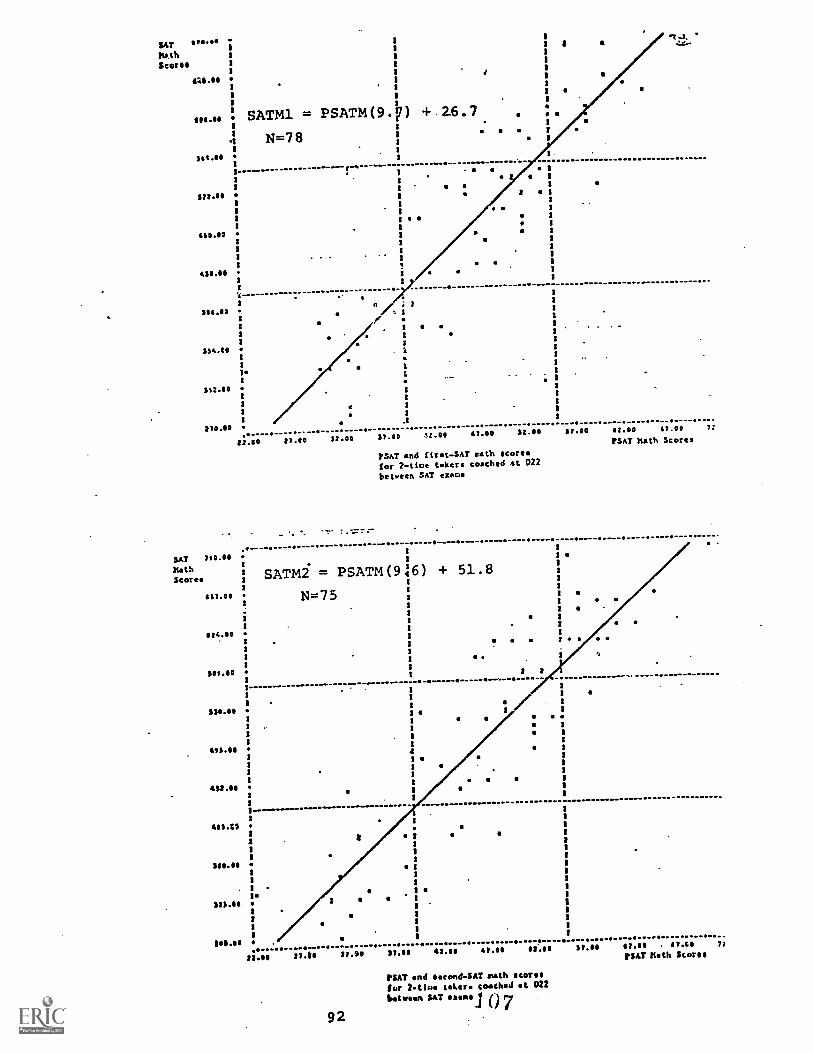
MATMethSmile
4211.11,
412.14SATM1 = PSATM(9.F) +.26.7
4
4411M
$22.80
438.07
4312.86
314.83
33430
412.80
r
3
2
1
3
e 1
:. 1
270.80.7
....... e ... ... . ...
22.80 21.20 32.00
8 a
37.00 $2.00 47.00 51.00 14.40 87.00 07.00 7:
rsja and first-SAT rath scores
for 2 -rice takers coached at 022
between SAT exams
SAT Y10.88
RathScore,
847.04
1
3
SATM2 = PSATM(96)
N=75
2
+ 51.8
Si'..., .
2111.80 1 3
......0
3
23..ee 2
3
411.11
422.11
........
481.12
3
284.14
a -
1sla.s
'
Ina*1141
,
1731 31.91 arm 43.11 *1.19 Si... 11.10
92
rSAT end eecond.SAT oath SCOT,.for Mime tiler. coached at 022vows SAT mail ()
rsAr haul Scores
....41.11 01.11 72
'SAT Roth Scores

Malistbala.assesSMS14106111111:""11..:..e.a.olait.V.:.4..-3;ftm.i4elfetSAT _1 _I.11.0
Wimp mo
111:
30 40 SO 40 70
P147 !lath S
SALT oversee oath for firet-SAT so a functionof PUT oath scores. comparing 2 -time takers coachedstoves 447 eases with uncosched 2 -tin. takers
SO
20. 70 TO 10PM? Math Scenes
SAT ..state oath (640. for eeeend.ST ea a functionOf PUT oath eerr. tverstift laeln wge (44m0664.1 cm between SST *...o silk umeache4 Satkoe Wore
93 108
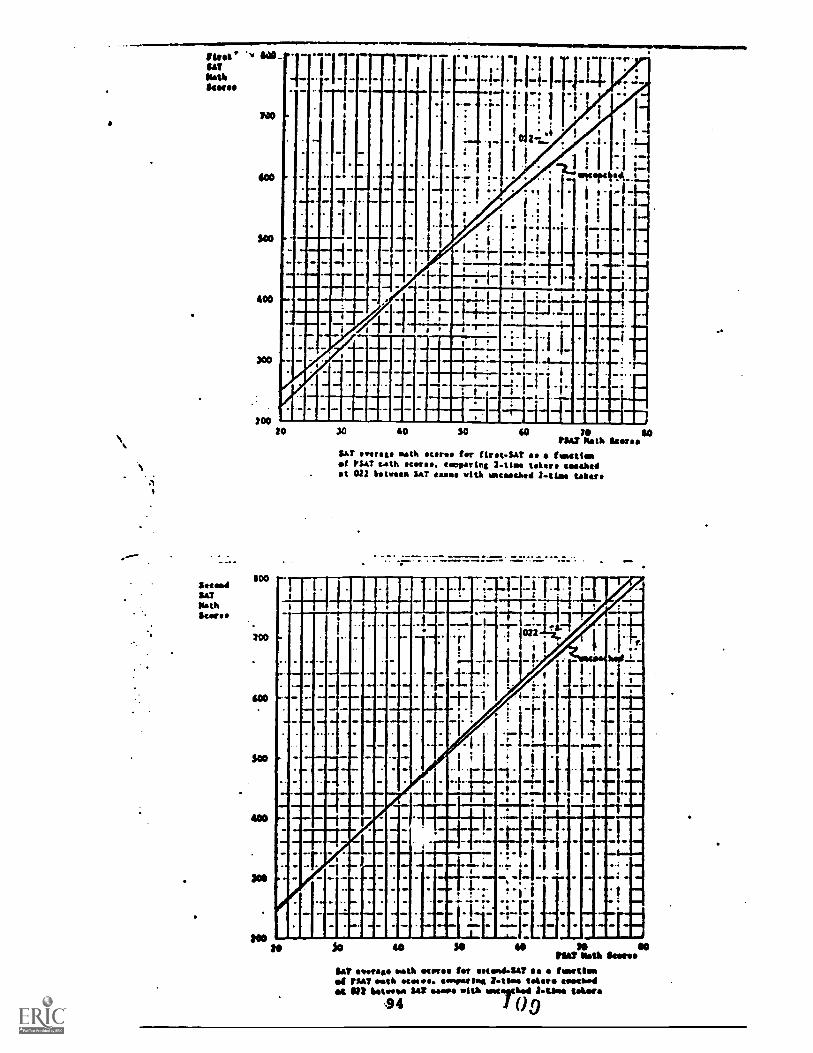
SUN'SATOathSCR'S
SeemedSATMathScam
OIN1
.11. 00 lab 00
aI I
400
T00
SOO
TOO
600
SOO
400
100to
20 30 40 So GO 20 SOt$42 Rath Seam
SAT average oath tar first -SAT as a Imistiomof Pm? &sit% stores. to:marina 2.tiala takers seethedat 022 betimes SAT eases with toe...chat 2 -time takers
M 1"-ri
.
...
II
I I
1
.
..
.
.....
-
.
_....
1
-.
-
-....
......-.
r..
..
-1
i
I.
1-1-..,..-
..
.
-
:
........022
1.1
.
-...+-
..
t
.
. .
.
..8
0
IP.
......
- -.
.1.
1...
. ...
. -.
0
0
. r.0 . I
,...tot..
I
a
i I.
.
I
I
.
i &
.t
.
*
.
ow ..
...
1
.
ow
.
I11
_
iOM
I I I.
IF
._
.
.I-
4......
1
.1
:'
So 40 30 GO 00PM? Moth Isom
SAT oath acme. too aetood.347 as a tom:Umcat PSO oath .taste. canoatifti 2.1goe 'Naos .sashedat 401 betootat Ste ONO. with UMCO1004 &lift Salome
.9 4 00

(7) SAT 2-time takers coached between exams
This final section of SAT results displays and compares
second-SAT scores as a function of first-SAT scores. Actual
first-SAT and second-SAT scores appear on pages 97-99.
Page 97 displays verbal and math scores for uncoached 2-
time takers. Page 98 displays scores for students coached
at SHK (001A). Page 99 displays scores for students coached
at Test Prep Centers (022).
Pages 100 and 101 compare coached and uilcoached students.
Each diagram in this comparison contains a "breakeven line"
representing no change between first and second SAT exams.
In effect, for this set of diagrams, the study baseline has
shifted forward from PSAT to first-SAT. Once again. SHK (OO1A)
is clearly effece.,e, although the case for Test Prep Centers
(022) seems somewhat marginal.
Using the first SAT score as the independent variable the
following results can be shown:
(a) SHK (OO1A) students' second average SAT verbal
scores increase from 42 to 24 points from the low
to the high range of first SAT verbal scores above
the control group;
(b) SHK (OO1A) students' second average math scores in-
crease from 20 to 44 points from the low to high
range of first SAT math scores above the control
group;
(c) Test Prep Centers' students (022) show second ver-
bal SAT scores changing from -3 to +15 points com-
pared to the control group from low to high first-SAT
verbal scores; and
95
I to

(d) Teat Prep Centers' students (022) show second
average math SAT scores changing from +7.1 to
-5.4 points compared to the control group, from
the low end to high end of the first-SAT math
score range.
./
96
I 1

Sttem4SATVerbal
Stone
SeccdSATMethStores
119.1011I
m 1
.o.
1 SATV2 =I SATV1(.9) + 52.91
.
s
4114.22N=494 a
t..
1I I
II
222.21I
I
I
I
522112
I
I
1
441.te3
1
I
I
411.11.I
I
I.I
$51.11I
3
1
I221.20
I 13 81
1
8111.11 11$
I
122.111
I
2
11 I
I
86
.
8 /1
OS I 1 1
8 I1 1
2 2I
/8 1 1
1
I I 1 2S
I si- 2 :15111 at 8
iI / 8 1
6 4 S V 2 I1 : 6
1 P. ) 8.1
1 *1 2 3 2I : :
1 s 4
2 / I.1.1....1........S.1 .
, 1
I
8
1
i
11111 171.110 184-ee 271.03 4211.00 10.01 MAO 181.55 16,09 age.t7 71'
Met SAT Verbal Sc
..
2111.2
SATM2
212.
1
4.21.1
212.114 1IMO.
1 IS I 1
MAO I 3 1 41 51
1f I I 8
I 411, 4
I I
1
g s 03 I
441.113 t I a
M.
/ I 4. 3
3 1
11116111 so
i 8g.
8 1 t
tolog
SAT verbal for
umoched 2-time takers
** ...
= SATM1(.9A) + 49.6
N=494
t
1 1
2222 3
6 g t
1 IR4 1 i
I / 3 1 ..
3 I 2 3
i 2 g I
8 8 t 8 ird.
g 8 Rs8
23.211
I
1113.04
w 3
1
3 14
It1.111 e...
104a* 1141.21 111.64 Mae 4.4.11 MAO MOH 41240 664.11 114.11 71:
Mgt SAT Hath S
97
SAT math stereo for
unteethed taker.
1 1 2

Second1411.
1
SATTorbal 1
PAD. 11911.
s
:
SATV2 SATV1(,813)+4$1.1
1
1 N=168
11.1
100.7
1
s a
1
...........429.1 070.0
.
I
a
a
it
.11
sas.ss
II
.4
0
111.00 010.03 11$.01
lia.s.0
$44.1
1
SI.SO1
1
1a
1
471.41$a
1
11
1
4111.0
1
340.60a
1
1
1
240. .
Ag
341.00 ..... .....
114.0 210.0 1110.10 140.0
locoedSArMath;cote.
first SAT Verbal S
SAT verbal scores far 2-tl. takerscoached at 001A between SAT woe
.6.,......., ...... .......................41044 e
I
II
SATM2 = SATM1(i98) + 61.91
1st...s N=168 . .
1
s
1
1
I
1
1
1112.01
. .
I_ .......................-........
1
a a
I.
42 2
. .
155.00'I1
I
I
521.001
a
1
1
I
4.0a
1a
431.05
wale
I a8SS8
efoo0
4
2
a 2 a a
I
1110.10112.10 0.50 MAO
. 98
II
oo
06.1 013.03 70.011 1246.11 it
?lest SAT Math S
CAT oath score. tar Ntlne takersCoached at 001A btween SAT smoll
1 1 3
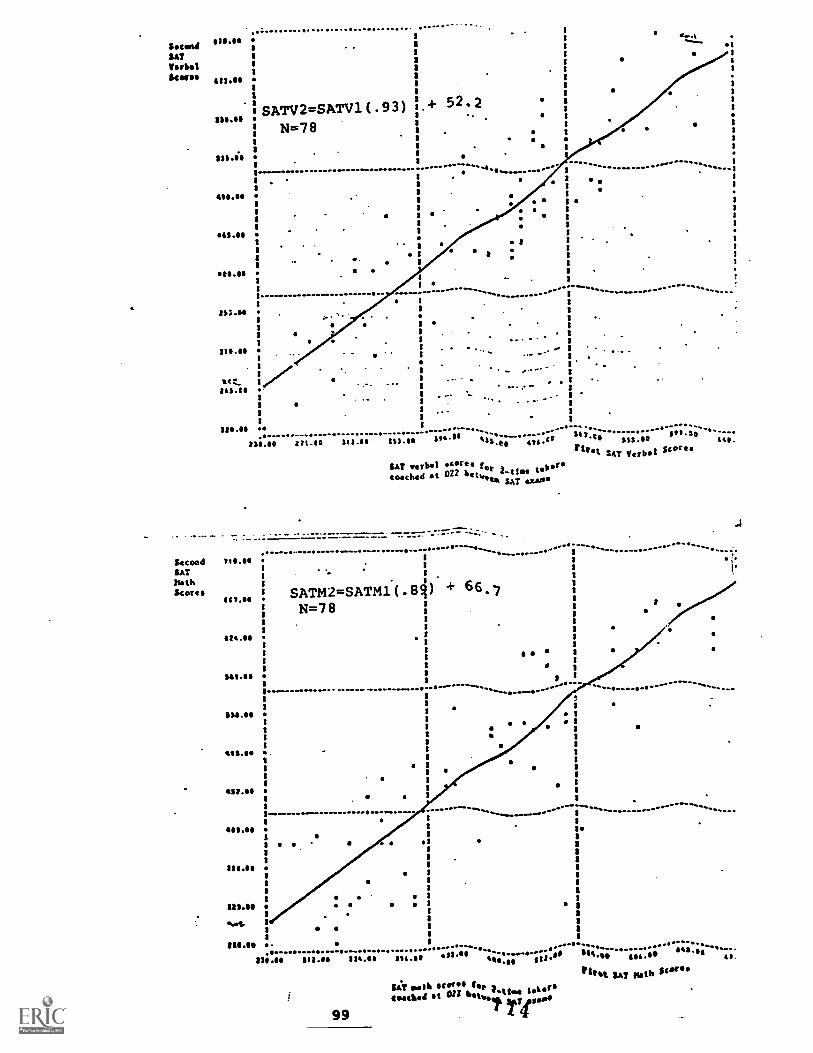
os OM Lit Ig4
" ti'Oo, ".991 46.bIt 10"1!- 9::!%b
wee, west erase oriel well ......... ....... ........ ... ..................... .... wes
..... , 1141
1 's zto es lottilloat
44ass. twat An
66
.... ......
a
..... "'".
- arm
I 10ft
'Etat .
11 1
1
1 111
I
II a am
8
! wolf
1
8L=N 8
4'99 + (b81TWIVS=ZWIVS 8
Will
8
1 t.
............ .........
r .
g 182.A 1, 114 '11,1 0181 2,1,
ta., ...... ,s.,6t was: writ ee-11/ wets
--"" .... - . ............... - .............. ...........
0wra "
I13 -" 1114..1,1 zzo 3 paSpOS
St" C 461 442 (A In
. . .
I
.......... ... ... .. z
.. . ... ..... . .......... ...
1
1
.
ZzS +.
8
1
'rift I ITaa.
'11
8
! 848
, 1111'111
gem,
Witt
8L=N s
(E6')TAIVS=ZAI 411 VSI."
1181
orate
_
. 0...00.
1,f 41,11
LYS puass
soma, ma.% LYS

SecondSATVerbalStereo
Secenct
SATMath
300 A00200 500 600 700 SOOTarot SAT Verbal Stereo
SAT e,,erage verbal score. for second-SAT as a function if
first -SAT verbal . comparing 2-time takers coachedat 001A between SAT exams with uncosched 2-ttre taker.
200
700
600
$00
400
I ! I .:-;-; :-:-- -!' i' ;_. 1...
i
1
---: 12 i ,_13 ...I.-1-1--- I. - :f/1--"-';;. .. ' I 1 ' A .
I ; ; : I I i I ; ;... 1i....
1..li , ;____.0016.-3- Z ._ ..akeachad
1
i I - ii ! I
i i i / .. I I .; I : 1 ./I .1 i
..i. ...:
/ "--: -,;.-r/ ... , . ... , . J. ...._./- .1.ti
../ : .. .;....1._ .......1..,............,1 /4z; : Li.: ,,!.. .,..k.v,.12......./ . ,-, ... ... = I alp' 1 ..... 9 0i
1.- --, T- ''"; i : t- . i 1
e. i I._ ......T......_ ...... . OM. all . a al..
...'. ; *
1._e 1 , , 1
i ; ;.!- I 1" :..T. !1 1'
--e -- L - :. :-.1- -;-.....--"-
--1
....1 ......... I . . :. .-f-ii : .
I--;
-.. --..1 I :.4_,..
. .
. ..
11.
:00SOO 500 400 Soo 600
/fretSOO SOO
et SAT Ilath Sews.
1001 1 3

Second&ATVerbalStereee
too
700
SecondSATbathScores
GOO
I.
-
1
:
.
022---.-.:_:.. .`:-..nreechett...,1
.1 I: 1
. I - I
.. , ....-. - -....1. , .
--: I, .. ...L.-. ..._ .....!...1 ..!--..--
, . .I 1
.. 1 : , ............-. -. .....1....- I - ...... - .- . - -... - - v--. -1 - - .- I .-: -
! 1 1 I I
.4. I I..- . - . .4 1 1 _1 1 1
...A... '1.'..
..:7Tbreakven line-J-4- 1-.-,.-1-4 - Iv. .
/ ' i t 1-1; !I l'.. -..- - i-....-1
: iH -i ..d
-1- / 1 i
-!... .,< . _ .. : . -1- .'... 1.--.. ---: . . .. :--1-71.7-11
.. _ _i_.i....,--L-A-.:-_1.- ..41 _ . ...--Hf-;
.--:: .. - ..;I. .4. ;..... -; ' 1
11300 -.-
200200 300 400 500 600 700 800
rirst SAT Verbal ScoresSAT average verbal ocores for second-SAT as functionof fIrst-SAT verbal scores. comparing 7-tire takers coachedat 422 between SAT eican with uncoached taker
800 - r f I I.4.1. I . i .. A :. . _ ; ..! .,...1........ I _,.: _1..r . r s " -- -:
_ 1_......1__ . i 1- -;_..: - .- -: - 1- !
I _I i _._ 1: . . _..1...:.;.; .._
1. , 1 1 . : . ,
7001 1 1. Mt cvaclied.-----..
-.-1-.7-1 t_ ...o
. ; . . / :
400 ; i / .. : o V -!-----!-- -.. / I
. 1 :,... ........ _ _ 1 _ _ _1........a.-L-1
-- ...1..._ 1 . i ir 1 e : . ; -.......-.. .. - r.....,....... .
. : . i 1 1
SOO ___, ..t.-:- -- -14.---"-.-..1-1-. .. .....I
.1._... _... ..] ,/. 1..-. .... .... .---.......7.... L I- _I- : ...,-.
- /.-i- I -A--r-1-.. . _...._,...._. 1 . ". ___. ----t--.
400 . .,--.1.....,..._.
IT-......._......._,
-.-i--;--.-.-:-; ;-
..... : Ir r
-:--
I-1I
i: 1. 1i1 -. 1:1: 1
I ..1
.
__
: 1-
i
1
...
. . I..;1
200700 400 300 400 700 700
first SAT Math Scores
6AT is svath scor for ec...ad-SAT lunette* atliget-SAT 1 t 1. court. c.sweeln 7.414. takers coachedat Olt between :ell Ith wocosebd 2-tla ta
17101
1

B. THE LAW SCHOOL ADMISSION TEST
(1) LSAT scores for white and non-white 1-time takers
As a prelude to the analysis of LSAT coaching, this pre-
liminary section indicates why the effects of coaching are
estimated using LSAT scores for whites only.
The first part of this section displays LSAT scores for
uncoached white, coached white, uncoached non-white, and
coached non-white 1-time takers of the LSAT. Comparison of
average LSAT scores for these groups reveals two major dis-
tinctions:
(a) Whites, whether coached or uncoached, perform con-siderably better than non-whites, whether coached or
uncoached, having a similar GPA.
(b) Among whites, LSAT coaching appears to benefit pri-
marily those with a lower GPA; among non-whites,
LSAT coaching appears to benefit those with a higher
GPA. This LSAT coaching impact for whites appears
repeatedly, suggesting that LSAT coaching operates
by refining or renewing some basic skills. But if
this is so, it is not clear why higher-GPA non-whites
benefit more than lower GPA non-whites. In any event,
there appears to be a distinct difference in coacha-
bility between whites and non-whites.
Amplifying on the foregoing, uncoached whites with a
GPA of 1.0 (on a 4.0 scale) have conditional average LSAT
scores of 436. Uncoached whites with a GPA of 4.0 have
conditional average LSAT scores of 640. Uncoached non-whites
with a GPA of 1.0 have conditional average LSAT scores .of 313
while uncoached non-whites with a GPA of 4.0 have conditional
average LSAT scores of 531.
102 117

Coached whites with GPA's of 1.0 and 4.0 have condition-
al.average LSAT scores of 458 and 634 respectively. Coached
non-whites with GPA's of 1.0 and 4.0 respectively have condi-
tional average LSAT scores of 301 and 556 respectively.
Uncoached whites score on the average between 123 and
108 points higher than their uncoached non-white counterparts
with identical GPA's. Coached whites score between 157 and
78 points higher than their coached non-white counterparts
with identical GPA's. Coaching prior to taking the first
LSAT appears to widen the white/non-white score gap at the
low end of the GPA spectrum but narrows the score gap at
the upper bound of the GPA range.
103
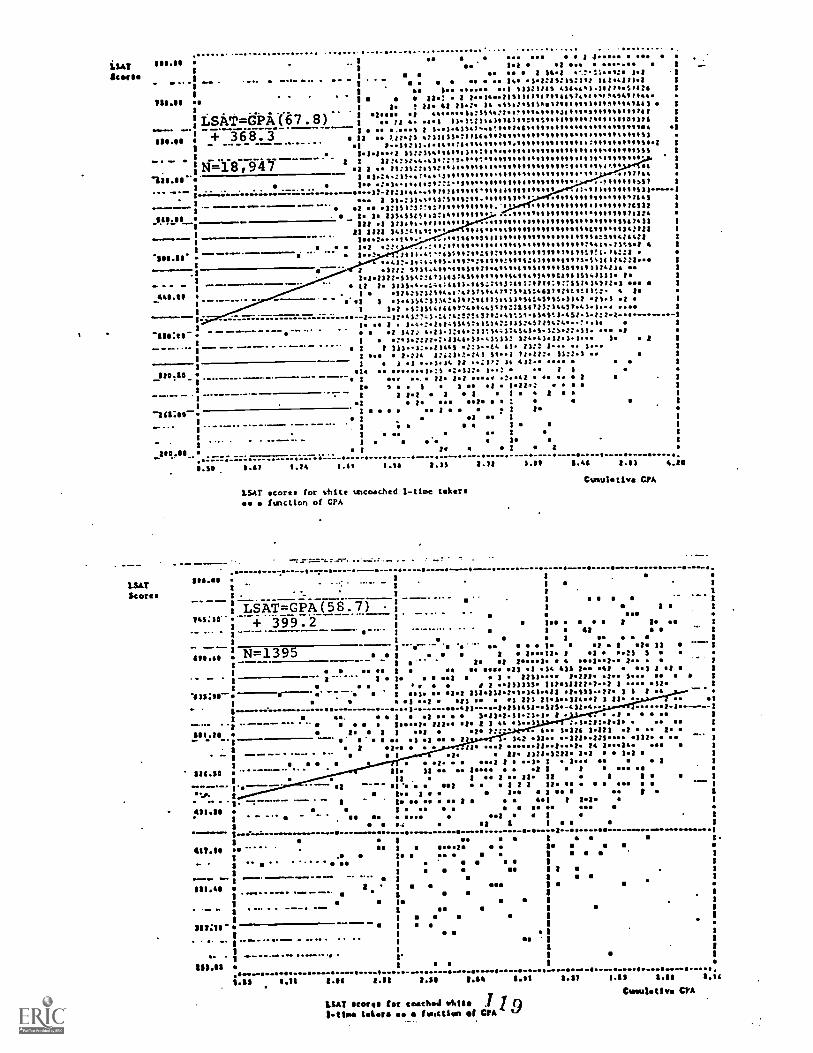
y43 lleteee3
/1 1 11'1 IC1
1
.
..... e 1
1 I
5.. OS I .8.0 1 I t 8 ups f
I ..... Si. es 611
1 1 1 gi
ob see / I
I C 110 ...IC I
I 2.2 /I 11:1.1211 I 111 11 t/// t
... 111 %/1.011t. "It.
1 6. /* Met Met ./ 1 .1. .. 11:ttC :
1 1. ' 1 .C.C:.1C.1.tt.0 1-.....-1.1 . sotoCtt0g1t..ittli101......t/O.00
1. ea .tt C 1.lttC11 v.
-- / 1 t .12..1111.1. itt11412/ttItt SIC. .... t I.L./MC.111
1 OS.. e.' u/ Mi./ .11// 1 1. I too MI ..i (ft St.
laj V of4m/ / 1/ f 1 /1/ g II lio 1 is PI
1 /
gS 1
1 OS of 1 is met 0
L. 1 I
4 I
I I
I
.
I
I
...-----
ya0 4211144%*
0511 tat Wt .........---..---............----...-- t
I
I I I S *
1 1161,11. 1
11 5 1 .. .. t 1
I
I .. C.::tt :///4 I .C .. ...1 I / t me.t.teltilloiw:(
is //..r.:i:1.1.1.1g1:111i111:15:1111 1 et 1C1tittt:ttt:Ctlit
1.2.:C/otCgtotIttgt.t1;it.:Ol1111 I ...t.tttttitC(C(ttl:COASPItOtt: 1 1. C.1t 4,1C.IS.St;
Si . :1411254 I . 1Ilti1y111.::i:1114:%4W66:T6I0.6116. I 1 t/W.c1tta2; I
1 /::,:t/Ii$.t/ .... 1 ::11;g1 I , sct,..1,61.: 1 10,1,441: 1 11101141. 1
51 .. 1 It12 I 6
1....... 1, 1
1 9. y. I ,
1
1 t. :
. . ..
1. 1 14110.51... 4 666666666 L11 1 1
1 CM 6666 V 666666666666 06%,%4046*
I 11:t11.61:Itt0.,C, St:ttttS I 1t1/,./ft :.t:%t:st:/.C
I. // .:.....:.,:. 1.14 I . /0
0. 66666 1 t m .
1,.)
sell 66 *
. se
w .1 I 1
gf fa
C. 1.11
Ctt
t.t.
(ii
CCCCC/.
I. Ito
10'1
1.111 1.:.
. . ..tc, tc
i..sc Ntl tt :tt..(...tisO11/..:./i::.1oZO
..... ZST4S:4114SO44
ttr,...:setl.:.:11.1-1sstit.C.:c,..
II.
66666 .i$4:$S1401
1.. 1 /
t.t
r V13 8 u011,155; . sitim pyaps
tt St I.
SOS
IS 18
Sm... I
1 Id . /5 0..6
S OS 1 ID. 5 1
a 1 ; 1 /. .1 f tell 1 11
f el. it SIC C ls .15
I I
/s tr a .10 d /0 t 1111
.../C/ of. 1. I
Ir. t t .1. //g /1 . t. 1
., C. . ti. 1 Is
1.1 / 1 1 ,
t 5 / Ire O MO f Si / 0
'
.. .......
siting/ 2(012-1 paglopun
Itt Ct 9101
..... -..--- .---0---0 .1
mg Se
S. is 4 f SO 45511
: 5 stay ass / goo 1 111 1 , 4.4 I ca ill off a,. 1.
:C .::C.:. i:/ :(t: Lt 11... C. f
tt:Z.12?:1 vt:/ tt..c::. flott..:1..C1t
?1t1 1 ltititt2 :1t
CITO:2:tf:t.I.:t :t ill
101tgl.:460;v:ito,Stt.t. 111,411S11/0.
. 1c1C
: ::v4t1:1t1.1.1 44.1,111S :10.
:36761:664.41..1,Ittr :117..0- ..::*
...VI;
1.616ei2:1,1 14,111
11,11111,i1/ :6;:tZttt:t
14:114S4Ctilt11:11 666666 , s, $ . , o I t : i
../. Z...;1:,:.1
41t04:S1:11 .1....5;;;.2%..0.22:,:11
: 1:st /..././.
:11,601 1t:6/,/ :i.111:.SCItt:, 1:trt 0....,,4t,..t.. I 4 11,014:1.11 111* .1. it
1 weld vt .1.11 Is ff i of
tt/ i :.ii 66666 "( "
s.
OS OS
tr,/ JO;
11'1
Of
.
OS 1
...._
/ 11
/ MO SO
owils8 leti
11.11 11.1
11111
. ... 410. 0 WWII
1
1
.-.-...... .......... 1
1 1W111 I
. , U.S ...... .. .. I
a' 1 11.1110
OS . sIt / ...............L_. .2. . ...
I .1. le
..... ___,1 .......... 1
.. ........... CI'lli
.
I
... ...-.--.. g
- .
1 g 1
2 Ira it - . ... ----.. t.. ----
. /
OS ... .....1
. . I
111111 1
e 1
1
1
S 6 £ T=N t """ I
............._,
_ 4 6 6 C. + :. st:sva
'78 ---i-Vci0=4.11Srl : . / 11421
.. I ITS1 011111,
-6 . . ........... .
vdo jo uolilurg v114A 20j 41530) 1111
1/1 Ill WI Ot --"0-7--.!-_:-:!:---
. (L
- 6_666
0
.. 2
16
1 . 1 1.
I
.1 11
..1 (.t
1111 1. 111
.t It
. i
f-f t
.. I
c. 1
WOW' .
- ...---- I
. - . . . ... I
. ........... ................. I
00171 1
1
I
_ - -- - - - ----- Ordli- I
I
.. ---_..- : ',M.,.
Welt 1
-, - ... - ........
I I
101 I
1 II 211;- I
- . . ... tell I
1 l'
I
. WOW. 1
I 1
11 1
1 GA
is 1
.- _ MIND An.* M .
..... 00 1 ei/.
1 i
. - _ - ' - - - 10E +
1 1 -TiFE§3 '
op elt 1
1.
1
M 6 0
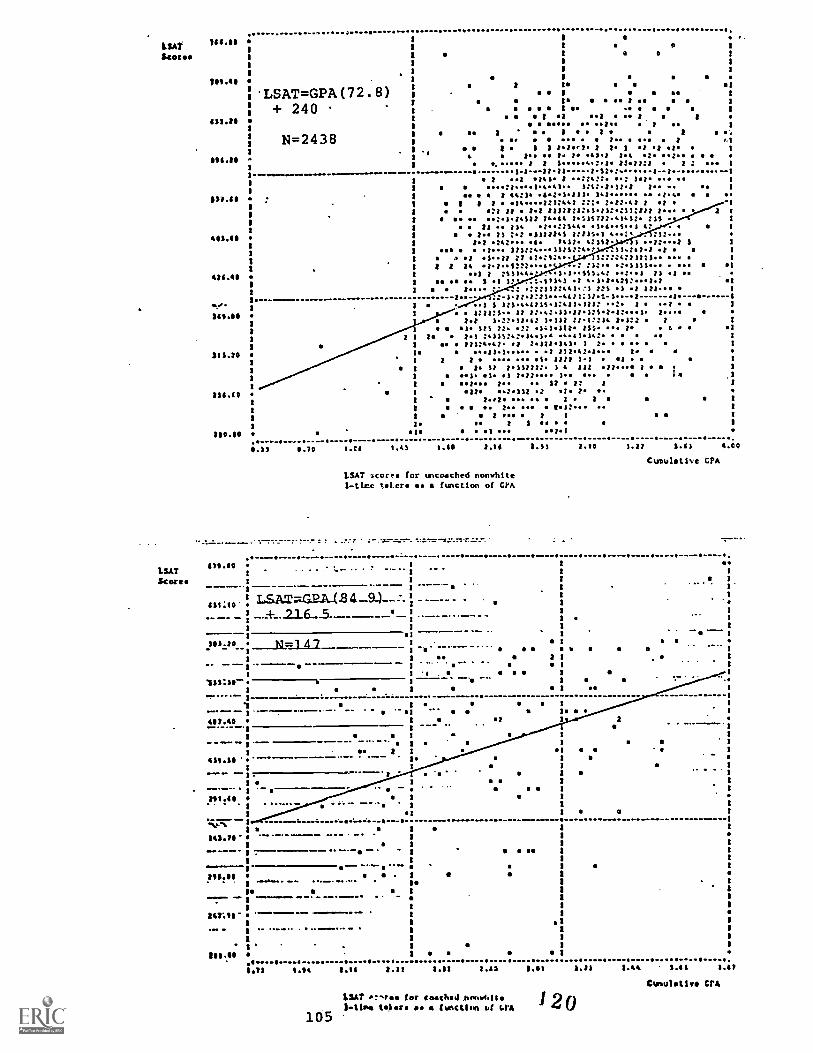
146014LSOkol
141.42
411.411
114.2
$21.00
41.04
426.44
1/40.
241.42
313.10
114.00
1110.40
LSAT=GPA(72.8)+ 240
N=2438
1
1
: s.t,me 3 . ...
I 4 3 1.21,e1.4 2.. a. 24
. f 2 0
1-1..12.22...---172
BOv.. f
s. aef 4e. f 31 1
f 11.. em 2
1 r 3 al 2 l2. .41.1 fed of. f
4,:.1. 12.11:1 2 212
2 "22422. .2 11,1 ego12:2.2.12.1 1
342 ...... .0221. 3.33.4: 2 .1
1...1.111722.41412. 211
3.031 df11233.1 232...
...Tssr. 1 "If...1 $-12.362.1 .2
1::::4:21173..31:e. .31211 ..
. 7 11.1 4.1.3.421:1.1
:30 .1 .2 121.
.2 2 .2222.1. 3.
32.13124 7.3:2 m 1
211 1 t:. .
3 2. . .
20 03.1 1
4 222 .11.... 2 I...
2: 2
2. a.
1 2.
.
-.......-..........
2010 1.11 3.03
.
2
1
.3
I
I
I
41,1
,1
1
1
1
1
1
1
1
1
dot
11
1
11
1
1
1
1
1
1
1
1
I
1
4.00
1
1
1
:
1
1
1
1
1
1
1
1
1.---
1
1
1
1
1
1
1
1
.......11.2,
._..............._.._...-._.......--.--......
0.10 1.01 1.43
2 .1 141.... 11141.1.4041..
go 2 04:36 4 2.1.2)1.1 I 2 ./4....1212441
022 21 1.1 2222222.2.1.212.2322222se . . :2.14122 14.04
22 114 . : .. 221.44.
1.4. 17 2.2 ..to
2.2 242 6 7423.bog .2 e. )31::.....31:0:30.:
a .122 :7 a7.:124.8 2 24
..) 2 2411444 .
S .1 1`. ..:a11141" .23:331:003.7)
3. .. .3.21.1:31 -44):333.1-1-1) $ 722.5.5. .32413111S:2222:s 22 1342.11.12.123
1.2 S2221.62 3.3613. 120 72 .:: .7A7.312.
1. 2.7 25.33325 274.3 .5..03.3511 22224.42 1 2.322.341.
...IS.) ..... .2 26242.2..3 3 ea..
1.
... .0. 22212. 771 7
.3. .3 .3 2.12 .... 3..Moab 1 3 2
11 4.2.332 .2 .3.2..2. .6. esse 2. 0.02.
1 Ob. 2
v. 2 1 ..
.1 as. ..1.1
..... -...-. .............
1.60 1.10 1.11
CUMUtiVe CPA
LSAT scores for uncoached nonwhite1 -tine takers a. a function of CPA
471.10LSATScores
451:10LSAT;---CP-A-(84..._-{:..2.161..
..
--9-)--
I
s
a
IP
2
a
a
2
a
.....
....a.
"
O.
I.
I
1
1
1
1
1
1
1
11
1
1
1
1
1
1
A
1
1
1
1
1
-5
5"g°- * 42-NIEL
-44/.40
11
411.54 --
I
I
?11:411I
.12717-1.0411.211'
21
I .
1
...-........
Is- 1
114/114'
.........
1
1
1/11.111
2.11. ...1014 1.14 1.11
............... ..........
1.11 1.63 1011 3.21 1.44 1.44 1.42
/SAT :,, for eeehd1.11w 4.2234 4 imictiu of &TA
10512o
CuraO1,1111
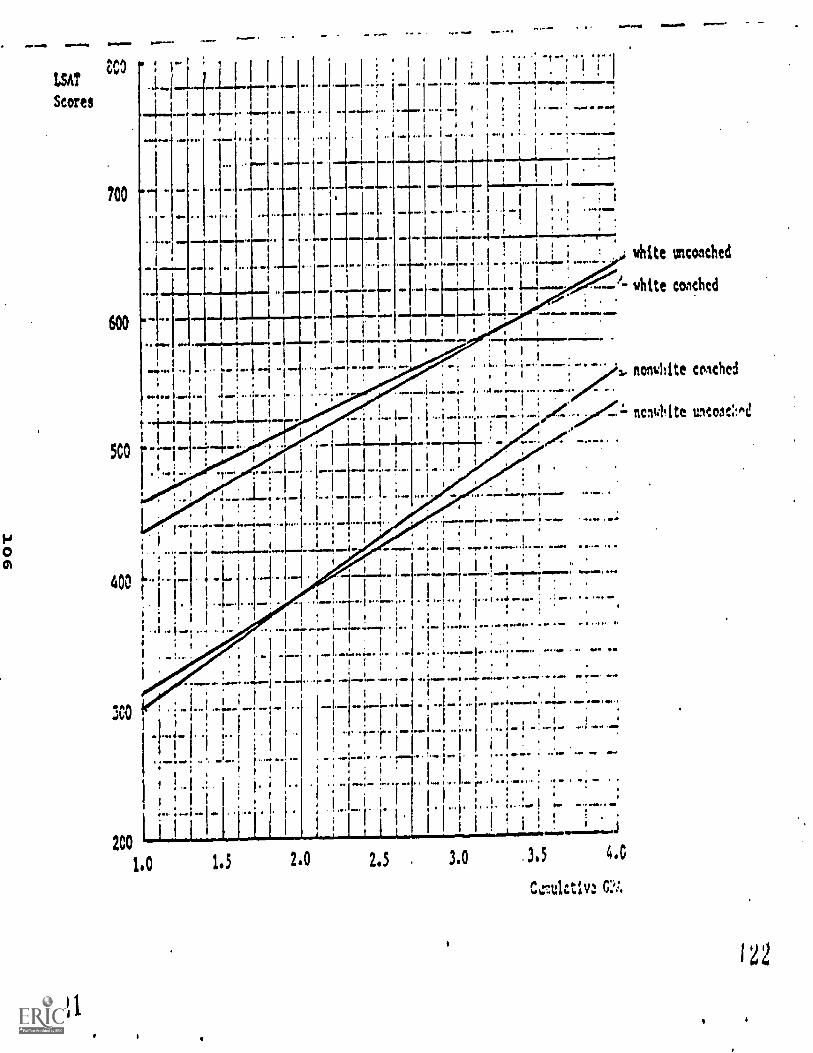
=111 .
I
ZC3 I 111 0 : t I:
i I ilow. w ' ,II
I 1 1 / wow' =01 I
1 0 t
700
1 I I
; I
1 ;
.11
I =111,
-1- I 1
OE 1.=1111. Ni
600
L. I «1
44! I ;
t
50 ,.........
110
1
I
=1111, own/WM..0 *Ewe
white uncoached
white coached
. - ... . i... .....; -.. . ea on!. . 00 .
a 1 / / nonwhite coached. .. 1
,{ i ' ; I
1
.4. : 0...1.. 1 .44 4. : ... e..°..4 .. 1 nenuill te untioa::"C
' I ! 1
' , i 1 ; 1
11 !LI...1.HW+ OD
I I I11....
11'..L. ' ... v. ; I
'0 I
h . I 0. /11, 'O.*. ..
I ."WM =1111=1NN
*. 11: .1...4'. 4.. !
10Jill
.;
,
- masalw 1. wit.. le o Moo.:
`
121
400 1.1-1--. .L. .
I
.I. I '......L...i. I .I I ! ?...VD 411=10 ..I...9
,
I I1 1 i ! 1 1 I i 1 1
I I, 1 .-. . 1 '
.....:..... ..1........,.. . 01 so 0 . 6 . 111. 0 ON . 0 0.r aI I i
o 1
1 : I. I 0
I .j I 1 I.
' ,
. .. ........... L.........' 1 I '....r a dm. I w.011. : A w a .. 0 o' ow I 0 .
I I II; i I / '/ ; . : , .
I . . .. , m I . IM....11.10, ....... # ..... ; ; li lo f ; .
0 '0
0 I 0 I I
0 ' 0
0 0
1
,.., ,.. 1 . Lgwl.. .. am i 1 oma MD. .1M1 1 H. OW i /WM II M. WO, . - .09 III MIR dr Mb
I I
/4 I .0111/ rd... #.= 1. M .1 111. 0 4 0 1 I14 . .4too
I I I I I
1
I I II . I I ,
I 11. si. i . t so I I . . ' i .0 0 0 ', .0., 0
I I
I
il r 1 I 1 i c .
.
.. _ i .. ... . ..... ..... ............ .., . . .
1 *a 411' V. 0 .110. i 11 III r ' i MI 4 . 0 . ... M
200
II. 11
.j I ,
1/
1.0 1.5 2.0 2.5 3.0 1.5 4.0
Cnactiv, .,
I 42
(2) LSAT scores for uncoached white and non-white 2-timetakers
This part of the white/non-white LSAT analysis displays
LSAT scores of uncoached white and non-white 2-time takers.
Comparison of average LSAT scores for these groups leads
to the following conclusions:
(a) On the average, both whites and non-whites displayimprovement on their second LSAT attempt.
(b) This upward shift, which is larger for both groupsas GPA is higher, may represent a "learning effect";that is, actual LSAT experience provides informationand exam familiarity that are translated into higherscores on the second attempt.
(c) Whatever they actually measure, GPA and LSAT appearto measure somewhat different things; this differ-ence is implied by the relatively low correlationbetween GPA and LSAT scores. However, increasingGPA presumably bears some relation to demonstratedability to learn; the same ability to learn whichleads to higher GPA may also lead to the higherscore gains associated with a higher GPA. This lineof reasoning suggests that the LSAT is "learnable"even by uncoached students. It also suggests thatstudents with greater ability to learn in generalwill find the LSAT more "learnable". Finally, be-cause intergroup score differences grow with in-creasing GPA, it may be that whites find the LSATmore "learnable" than do non-whites.
Unccached white 2-time takers of the LSAT show an
average LSAT score increase of 9 points at the lower bound
of the GPA range and an increase of 50 points at the upper
bound of the GPA range.
Uncoadhed non-white 2-time takers show average increases
from their first to second LSAT of 13 to 36 points ranging
from the lower bound to upper bound of the CPA.
107
123

... .,118.42 .
LSAT i3
Stoves II V
8 LSAT1=GPA (48.2) - a8 1 .. 2
2 g # s s .2
212.2lb 01 3 .2. ...I.. .. .
.+ 363.8 , 1 $ a 2 66622 6 ole 2
1.2 .2 U. .1 22622. l l Ise 1. l
II .2.1. 02 Moj e 1:6..6 22 22 .4.2
Ni--57zg---..'.... . 2 .. 2 l PI 1 :55320 l:4 I 40.22.2 $$ .. 24...2..2
1 2 48 - .
2 :, .ts I. 14::t 34/2$45. 2.. 262. 2I
so 2. solo 2 I/ l2.121.48 4242. *: 244.22222 1i 2 2 / :: :....2 22:11:21,22. .26462216.6 ; :6:2 22 .2
l 1 12 Ill 8232.23 l.* 2SI81 I34/65:22:%%.326.42 2:1
1 I 146:61.6- :36:r :44. iiiii 1.161161:421 ....:..1
821:28 - -. . . - 2 1 22 4:1$4::113.12$s3 22.0221.3.3:2412 iiiiiii 1;t% it 221.
1 I 2l .1 2.242.4. :62:61:.1: :1662.6226162:16.62:.:2
2..............--.--......---..-..--.2--11.32-4:26.:2621.2622.:22666.22611:2.1611,.. ....1
2
2
211.18II
I
1
46162
e .2.
-45 2I
1.2 2
)
1
is.. .4:,14./.4.2to.221.102:111.t:111.,fla... ..,.:62. :6 i
..1 3:: 2.2:22:422.3.2232oilot 20/Soe. .114221$5.42$4.. .3
13: Il3.:2:41:111:0 :21 2 2 122 2:2lo 2
12.11:1:242/.:3',.'...3;.I.4 :4' -43.c :7.:434:38 22 8. 1
M... 62 "...WI. . s.2 :628:2133's i 1612:22 22 2
2 2 ...2 As li'1s$'26 26,62,616 :866e6.22.22.. 2 I
.... SlIll 3 6:612S: 2 6446:1144 47..224 42 24. 2 /
.4.26:. 2 So 4..421:: .1.6.2411144311:2/164 2S2o:24.22 3 .. 2438..1. :4:214S)4::33636242.22 y 3
. 2.11 2:66:1.63:31.0.2 2.2.74 :Sls.S3S., v 42222 1
4.1... Isl Sloe .. 42.:2222:1:.:122:SletS:12:.SS.::24:3.22., 2.222 s 2
ISOM
a .1 6: 6:si 46:2.::$.0.1:2221::.2.22 Si .22.11 . .2
1
1
.0
6.
13...-.:-. -....
3
I
1.
1
11
32
11
Sal lag 1.12
1....31 .:311 IS $2.43 :4:::48 .16.:66:.2:.2 2. 2..
el 2 2 'SW :..r. 23:3:6.:462:2.16: 2:2::31 4 1
2 .1.2212 lel: ooll 2.4 2 22 1
22222.2..2.2..242222 ......... ...*..........2.......6............2
1 lab 2 2. 2.1.2.2.. .12 2 se 1
es 2.. IS "I I : .20 $
II i 2 . le es see I
222 "2.2... U. 81 3
12 . e 22
t es ease 2 as242. se
so I
. ..2
aa.
1
1
1
1
......--- .. .....2.10 2.27 2.24 1.32 2.12 3.44
LSAT first -score. for uncoached white 2 -tin. takers
Oa function At crA
3.71 4.3:
Cumulative CFA
0......m.00.......ma0................400.0..................................41...+0............w.....................0.1 .
LSATSUM I
3 1
1.
SCOVC3 .8 1
LSAT2=GPA(61.4) . a 3:1 8. .. 1
MAO + 359.6 Ise I 2 . 2414
3
a' l Ie 2 es. 2 I
/6 1 1,. 2 ..1.34.1 2212 22. 2 .1
..- :..1.1=5729. _ 2 2 2. S. 2...32 .11.2412 32I2 ...... 24 I el. 1s 'WWI 11..11.22 lael.ff. so .4. 1
2AS11.21I 4.2. .2.22 62 .222266:.:2.261 .. S R.
12. 2.2 ll.. ...... 422.22313S4421sI2III.. SI. ..... .2 el
I . . - ..lo 12 S. M.2 3$ 2464Si/el/Malt/ ........322312 2.2. 2
22 2 it loos
221.4.2213.4 ...... 22622m:6;61 2410. 2 21 1
.
.162115.4.76,224112222.. ol
-210.22.1 es 2 1333.1.411 I3S212.13.421112124
13.-.--.-
2 I 221 S./ 212 4 .....1....1 .l -.
33812
12441;:: ::::::ti i
.11411 *1 1.
31. 1 8 2 1:1161
F.*.
22 420 220.200:226622:.4245340:0411121 ........1;;6;440:4:42042:3 1
$110.611g 81.1. 14241234I3 222 og.
o 18284 :SoSPI 42114$8:41I41.. .o.1411 SSSSS ZI)S.:414) 82.2. 1
1.122.1. 1. I
3 1 .1212 22.4232::S3O22 .
2.2 1...2."
I22.3 /Sal SSSSSS ISS SSSSSSS :12oSS2411 134101 1
1 q 06 122.2.1 S. 2$11.4'"
I ......2,34,: SSSSS )261122262 SSSS :1:::1::11::.;:,::;:,
.3
$91.15a 2. .. 22/142.:$2242Itsl SS
. . .....1....................so 3 ,221.1 222 1,22:14:2422414,l2JO2424Sg244.42,412121122.22
I
.4 211$244SSS2.4. 3...). t 8 1I
I2 1 . 2.2214 1,44 441043.44M:02422 44444 212:4 24) 3s. .32I" SS" 4401ISI4.,/I44.1 I
II. . .4.. e2 22..410 0$222112lll2 el 2 1
446.8 18 I .1 2 13. 331 313 2..24. 3242222 224..2 S..) . 2
.'1 I1 .222 470. 311:48 2.60. :41444 2282.2 2: 2. .222 1
... ...
--
2 2 1. 1 33 .14.82.1.81 .1)131 64.3.42. 824. I I.. ... 1,;,-------.;;-...---------g----2--1.-2-s"J'y 4 2..21324.22..22.2.22,2 1
$a 8. 8 42 a.. s
MIMS 8 to 2. I .32133. 1...4 .2 2.2 Pogo l
s. 1 2 2. 1 24...2 2 . 11.1
.. 020 2 0.0 2 .4, ia I 00I
I
. s
sa I # se me Ii I I
---ri 4141 . a a s
Os le es $ Os2 OS2t....
8 1 .. 2.54 1 e
ss
2 I
sI
s
ss .
s
sum' " 3
s
I
I $s
s 1
1
.s
2$
Iss.sss
I
. 6
4.21 1.11 1.13 202 1.22 1.44 2.11 1001 1.44 1.22 4.1
Cumulative CFA
LSAT second. far 3nge8c1121 01212.1fime WW2at 141%2214in 1 crA
108

a
LSATti111.1
124.11
1112.11
403.2
468.1
3.2.4
6.4
344.31
114.1
20,.e.
i LSAT1=GPA (45.7)i + 283.8'
-; -N=781-
SO
3
aaa
SS0./
aaaaaa2 2
3. a ..12) 2 SS
.3 3 .22 aI am .22de 2 s.f 211 a de
01 I 1 ...Zoe
.. .3 a
las S. 3 4.0. 22 2go 22 .S2
II.. I. fa
seel
.1 pV
I we sow
2 en
ell
2
1.27 lap
2
as2.
2...222
2
.led 61
J. 8.132 2...
..
.1el. 12
a. a.
..............
)se
I
7.94
3.3
3
2.I.2
1 a
3 00
2.. 21
2
2
2
3
3.17
1
1
3
I
I1
1
.
s
I
1a
2
1
I
.8a
1
3.2 1
1
Ot
3
2 1
.....01.....................21
3
1
13
1
I
3
...
1.10 1.7) 3.14
23
31
1
3
lI3
S.3
3
I--
I33
1
IS1
I
1
1
3
3
7.27
6 11i
3a.
el 2 .2
8 1 e
a . 2 63).2 .2.
2 Gs
SO a le'5. 2 ..
etft3 .1 212
a 4
a le
2 1
1
a
se
1.14 2.11 1.24Cumulative CPA
LSAT first-scores for uncoached nonwhite
2.41.14 t aaaaa function of CPA
LSATScot
:,............................................................6114.11
1
3 *LSAT2=GPA (4 5 . 7 )a
+ 302.SSS3.14
1
1
1-.. . Nil Z-- ' .
122.1
8
3 43
V
614.4 11
2 I3....... 2.........e
1
3o
$33.$33.4., .
31
885
1I 17
4381.118 0 143 3
1- - SG
3a
I.
111.2 .122
I61.4 1 a a.....
11
::
iiI
: es
1
II 3 SS
8 aISe 0
I a3 Se es fee........1...... ...
3 Si
3 35 11I. 2 2 eve as 23.
WI SS 2 a 1. 2
2 3 Jell 1 2.21 a. 22i 2..2.2 2 .. a 3
a a I.1 11
22002 112 al..
3 mu lila 1..1. al a.
as...a .aSO
e ...... ......a2 Sed00.4.2 .2.2 ... we
2
.22 I
1lie I
a Se OS u 2
1de
. 1. a
1
a 1f
1-7.
2.71 3.1 2.84
....................
3 2 2
100
22g
1
1 a
1IIt P
as1
S4
se
SO
.. e
3.3/
........1
a31
a1
1
1
2
.a 1
.0.1.0.000.02
al 1
1
1
1
.1I
1
1
1
a . 1
1
Se I
II
21
1.S 1.7) 3.52
2
I. . el.
Mae al1
ego ...!
11
I .S. SOS
I
Mae s
1all.
1
1
1
MIS,11I
I
loom .... 0 aaaaa ....0
1.41 1.1 2.91 /O
LSAT gerund. few unattached nhtt2 -lim takers e function 01 CPA
1091 25
Cuviliv CIA
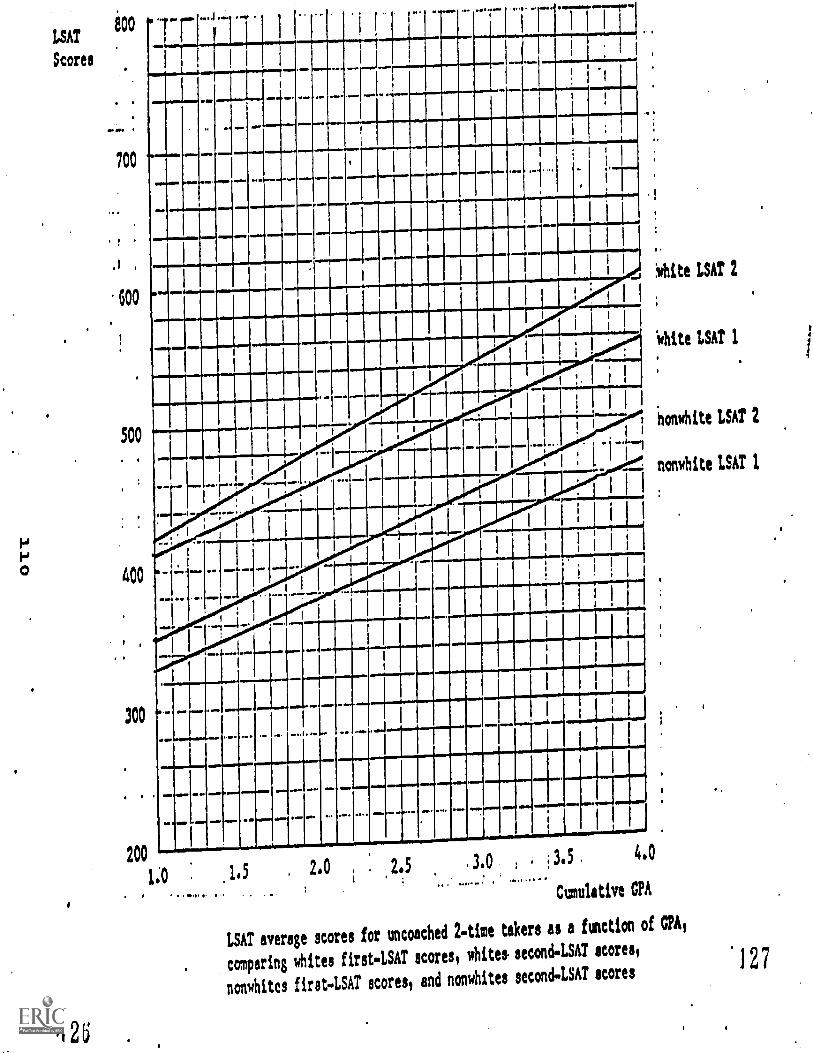
LSAT
Scores
.12U
7777!
honwhite LSAT 2
nonwhite LSAT 1
200
1.0 .1.5 , 2.0
1
;2.5 .3.0 ; ;3.54.0
Cumulative CPA
LSAT average scores for uncoached 2-time takers as a function of CPA,
comparing whites first-LSAT scores, whites second-LSAT scores,
nonwhites first-LSAT scores, and nonwhites second-LSAT scores.127

(3) LSAT scores for white and non-white 2-time takers coached
between exams
This part of the white/non-white analysis displays LSAT
scores for white and non7white 2-time takers coached between
exams. Comparison of average scores of these groups, and
also comparison against uncoached white and non-white 2-time
takers, reinforces the conclusion reached earlier regarding
the 1-time takers that LSAT coaching tends to have its
greatest benefits for low-GPA whites and high-GPA non-whites.
Despite coaching, marked LSAT score differences persist
between whites and non-whites.
For example, whites with a GPA of 1.0 coached between
administrations of the LSAT show score increases of 40 points.
Their non-white counterparts show score increases of 2 points.
Whites with a GPA of 4.0 coached between exams show conditional
average score increases of 51 points. Their non-white counter-
parts show conditional average increases of 65 points. The over-
all effects of coaching for 2-time takers of the LSAT based on a
comparison of this section and the preceding section may give
th, impression that at least in this category (2-time takers)
coaching has at best marginal benefits. However as we will
demonitrate when examining individual coaching schools in
an unaggregated form, this conclusion is not warranted for
for all schools.

se 04 OOOOO 000000.... ........,
That 1113.80.
I
$
It
LSAT I
t
icre4 II
1
(11.3$: LSAT1=GPA ( 41 .1 + 370.
1 ) SOIs1 OS
1 . ss
:1
WagI
; N=441 44 2
SeI 2
SIM:
001
1.
I2
el 411 j 4 8 .2I. 1 / .1 4
I
1
II so as f 2 . I
541.4$0 14 0
10 2 f 4
1.................o.. ....... .....0.00 I - . 2..... I
11
2 2 .1 el
Ij 7 S
4444.26:
es 2.. . . 1. 2
1I. sob 01 1 .. 1
1lb. 2 sl 2 1
I.1 Of I I
II es 2 a e. Of :0 2. f si 1 1
441.822 1 I
...4 2/ el 0 f: SO 1
1 4 I 2 I. I
II a 3 1 I
s1 2. s t
1121.411I . 2 I.
aI
sof I . t
II I 2I....-- ...... ........... t
I
I
221.18 2
1is
I
1
I1
1
2
1
355.452
11
1
224.202
1
I1
211.t0...... -.....----1.5 2.2 2.24 2.44 2.41 2.1 3.12 .2.24 8.54 3.20 4.10
Ctesultive GrA
LSAT first-score as function of CPA for whits
2 -tine taker. coached between LSAT cum.
Second 740.00LSATScore.
LSAT2=GPA( 44.9) '2. j
417.40 + 406N=441
1
1
.4 .016 1
1124.10I
I1 a 1
1P. 2
I j
1 2112.20
.2 2 /a .2 22 I
1 2 1 .2. 2 2
2 1 3 / 2
241.40Pe 2 2 0 1
1 a 1 : e 2
11$ '. 2 Is I
a I. j I
I es 1 1 1
/27.00e. 2 f $ see. ad $ Se
i 1 4 I
00;2
SO IS le.. I 1
I 4 1 I .. 1 1
22 me I
4$440 1 ma 22 I I
11
I
I. a I. I
a: ....-. ... 1
tI 1
4414 2.
A 22
2I
2111.24a
2
I2
22
451.111 1
1114.11,50..... . ........ .....4.........
1 2.8 2.24 2.44 8.4111 1.11 2.11 1.14 2.24 4.29
LSAT second.cors as function of CPA forlAttt 2-tins takers cochd between LSAT
112 129
eumuttirs CPA
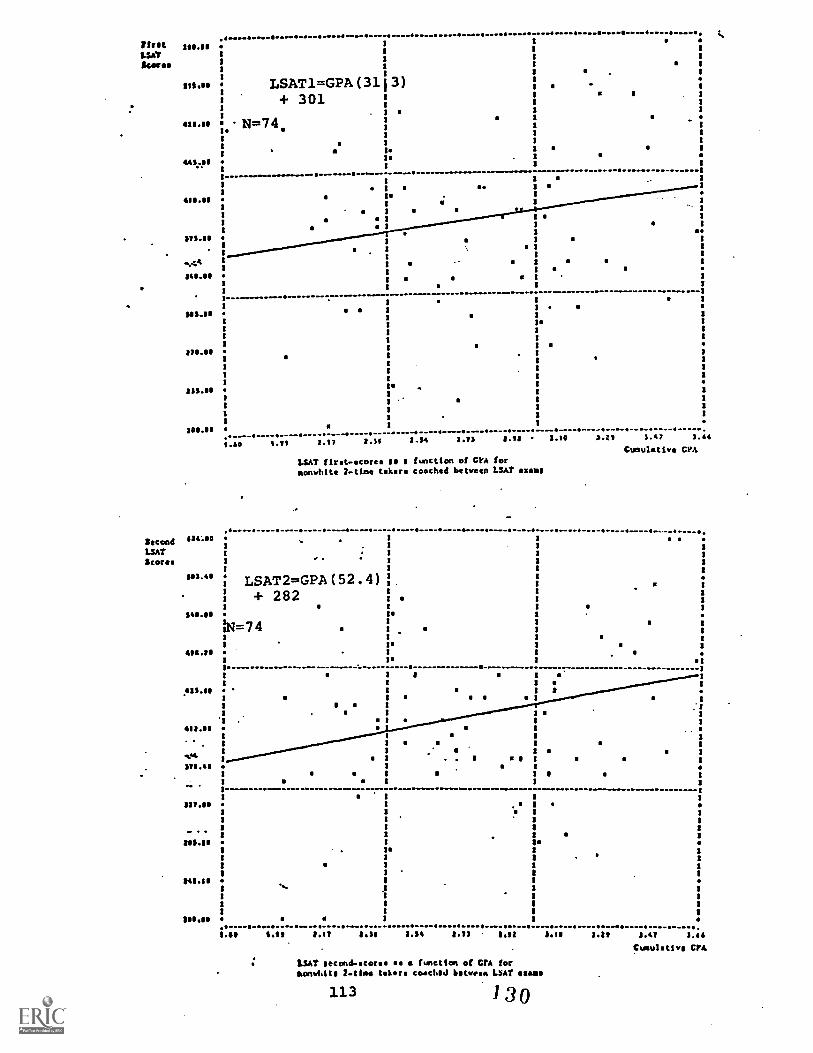
'featLSATScores
SeccodLSAT
126.16
Mae
4116.66
4444P1
4116.66
01.66
144F16.66
111.11
216.66
10.66
106.66
626A0
543.4.
341.1.
Was
.412.11
4117.66
. .
.31....
- .
317.66
111.11
621.66
$66.66
ed.. 000000 .0.........o.........S.
3
.
LSAT1=GPA ( 31+ 301
N=74
2
2
2
2
2
3
3
2
2
I
I .........
1
1
1
1
1.60 1.12 2.17 2.311
LSAT first-AcoresNonwhite 2-time takers
s
t
; LSAT 2=GPA ( 52.4 )+ 282
I
iN=74
1
I
I
I
I
:I
I
2
I
:
I
::.--------- .... ................-....-.-.....................--..........
I
I
3
11
i
1
1 is
1
I ..2
11
3)
3.16
aa
2
3.22
1
.
oII
I
2
2
2.67 3 6Calculative CPA
......I
$I
I$
I
$I..
I
2
:2I
2
1I
:
:
:
s
we
11
..
e.........
.
2.26 2.71 2.22
se a function of CPA forcoached between LSAT exams
g .....--....-..........-------..------------.....-11
1
..-.....-I
3
3
3
33
3131o
2
2
2
I
.....6 ..... swOollo.m.............. ...... 0 ......... 4 ww.......om.. m..0imp 1.22 8.11 1.74 1.24 2.711 1.11 2.16 7.22 2.42 7.66
LSAT second. 000000 a function of CIA forNomd.its Mims tiler. coached botwo LSAT stoma
113 130
Cumulative CIA

LSAT
Scores
!fit) . Of 4., 11r OM
I ! I ! ? 11 E' 10 1i 77'.i1
. .0.1 op * , , ,.... ....Wm polgodMM .iI NW 0.0 maw Om.
L. 1 I .I .
t I 1 i ; I;III 1, ;61 1 ,
It own op Nis 11= .0 iklim 1101 0 aim. p.m. wool .IMS
I 1 L 1 11 i ii :i ,
1
1
i! 1 1
.... ....._41....1........,. .. O. 4.1.. 0 , ,,', ' ,... b....n...9 1mb. 0 10 fa ..
1! I I I I 11 I
I I
! I
) I 1
I
.11
I
I I
... GM O. .; . ow i at IN ...m. ., N,11. I a. MO MO m,m
1 II i .
1 1, i I
.,...........
700 41, me ... I.", I ....4 ro ...
I 1
f i
1 I I
1
I '...a I- 41 en ma. t
mem*
11 O. rif ...Molls. 111114 ,I11.00 LEI ...II OM I I ==I
I I II1
0 ..... Po,....I.I II
1 411; ...J.." . 11. ,. - I . . !.. a... I glowI '
I II
r iI
. I
600 ...,
...,...14
I
IMN.
if J.....1,... j....,.... .....
,1 1
1-1- . ,
LI.
500
titt
400
300
200
1.0
131
, NOWI I
nito, whites LSAT 2
all OM IMO Illy a 11 r704
1 11 t 1
1....jaami11. MM.. , OW ....I: ..
4.
c w 14.
1 MI AgoI I i
O 0.. L......... .
whites LSAT 1
..,, nonwhites LSAT 2
[ 1 I .1%.nonwhites LSAT
=1 .6.
1.5 240 2.5 3.0 . 3.5 4.0
Cumulative CPA
LSAT average scores for 2-time takers coached between moo
with LSAT scores as a function of CPA,
comparing whites and nonwhites .
1'32 .
14) .LSAT first and second scores for white and non-white--I-time takers
This final part of the white/non-white LSAT analysis dis-
plays and compares second-LSAT scores as a function of first-
LSATscores. Shown are LSAT scores for uncoached whites,
uncoached lion-whites, coached whites, and coached non-whites.
The first set of comparisons displays differences be-.
tween uncoached whites and uncoached non-whites and between
coached whites and coached non-whites. In both comparisons,'
whites outperform non-whites, with greater differences appear-
ing at higher first-LSAT scores for the uncoached groups and
at lower first-LSAT scores for the coached groups. The second
set of comparisons reveals that coaching is more beneficial
for whites in the lower score ranges than for non - whites with
similar first-LSAT scores.
This study does not attempt to explain these persistent
differences in LSAT scores. We appear to have an effect with-
out an identified cause. However, to clarify subsequent com-
parisons among LSAT coaching schools and between coached and
uncoached students, non-whites are excluded from the remaining
analyses. Such exclusion allows subsequent analysis to com-
pare relatively more homogeneous groups. In addition, rela-
tively fewnon-whites enroll in coaching schools, so that data
are too sparse to rigorously evaluate individual coaching
schools regarding the extent to which they benefit non-white
115
133

students. Uncoached whites with an initial LSAT score of 200
show score gains of 63 points compared with - average gains of
.96 points for their coached counterparts. Uncoached whites
with initial LSAT scores of 800 show theoretical gains of 9
points compared to theoretical decreases of 2 points for their
coached counterparts.
Uncoached non-whites with an intitial LSAT score of 200
show average gains of 50 LSAT points while their coached
counterparts show average gains of 71 points. Uncoached
non-whites with theoretical intitial scores of 800 show average
decreases of 10 points whereas their coached counterparts
reveal average decreases of 32 points.
..
116
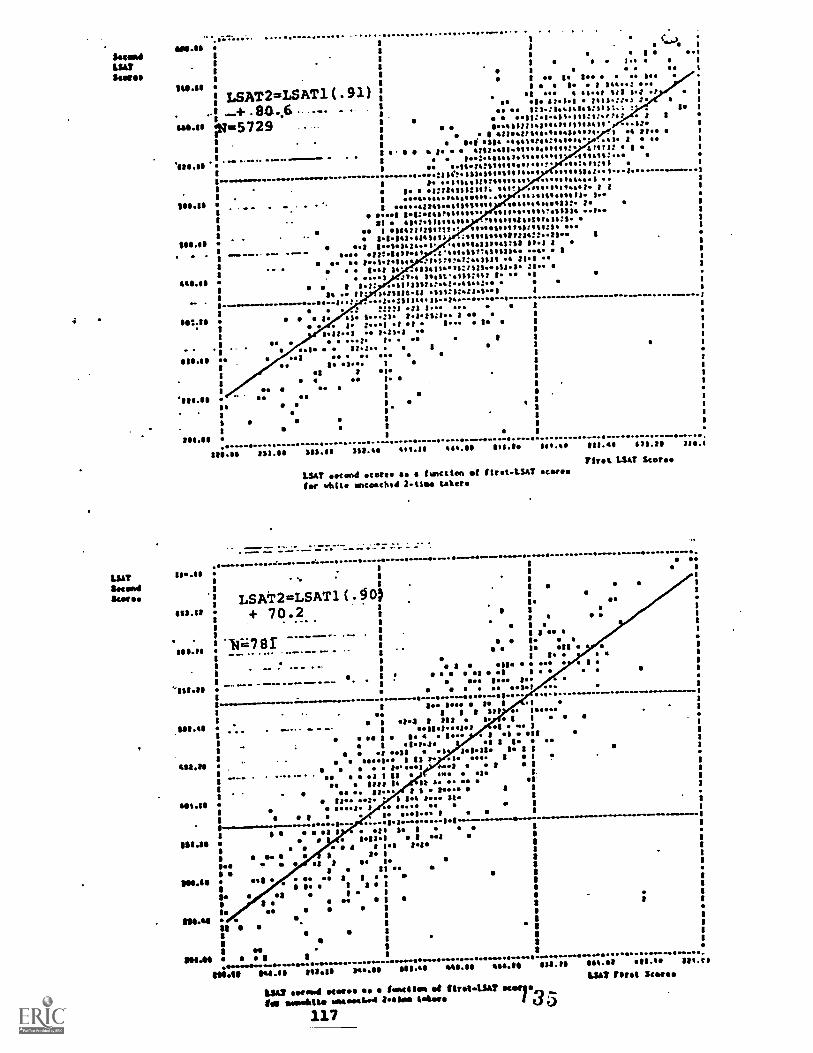
2.1.10
1
.
. ;O 2 00,
1
0 1.0 I
1
ft SO
148.80 to
.. 2. 2.. . 2..
LSAT2=LSAT1 ( . 91) . *441 srs see .,P le 1 444: 0... I
.. 1: ....... . 80, 6 . .... . .44 .1.1 :.1.1 2111.:; Z... 4 s
Is. iss.:1 %%%%% ss:sts:.: 7. le l
15.10 9 7 29 a 4.Zig.g:::.1::::sf:::1011 11 : s
1
I ittwts..::,..
t
181 all $$$$$ 4.14:41.104. ..e.1. 2 4 1
"I
. g 21:411. : il$IJ: 2
20./.
1
181/.811
8..........................................$$:::21:4!":%1'1
r1
1 1 1ter tttttttt ttttttt .1 I
1I. :: ttttt 12141. 4111! . tttttt 10.442. 2 / 1
DJI
I 1. 111:8I e..4 0.848 ge
OO2.
4224S0
1asses 22:4201? 11$10.1,ell$214 ..1 I
181 41421I . :s I
I1 4 ttttt IIII/Itet 4181 ttttttt 2/ISIIS 1
Mae 11.1.141. 4 ...81.. 8
16l 1.1.1.4..1 a 1II II./ 1 1
I ..1.0.11 . IIM .. a .. 1422.1411401 .V444.41/14441114. .1 I 1
..I. .. 0.1.2.1s. :I. 7V.1:.41111 21.1 ...
I
1
I2.42 14 . ttt :7121.401.2. II" 1
44242/ ..?7.5 191111):1 l I
11 3.1: .. ttttt 124:42...44.42
1
I84 it' .1:118812 111.71:6:81.1 1
I
8 ...........8. ..2zsft531: O ..00. OMe
I. .: el:III :1 S... e 1
8.2.18le ) S...11 2.12$.72. 1 es
1 1 8 :1 : 88 8... 8.I
I222..2 es 1.11.1 .
1
1 0 ,2 2 40 II
"1 01 112.: I .I
/MOO DOI MS
I. j *Jo..
I
1 4 11
1II SO
I
1 OS 0 1
'ags.seOS
11
I
.
Ia
I
.11.4,4PUS:SS11. 1 S a Slio ...
I a
ISOMa
11110.00 131.11 101.111 111.4 411.20 414.11 811.8 140.411 421,0 911,29
First LSAT
LSAT second .tort e se s function ad (trot-LSAT 0014for wLit ncoschod 2.tis caters
.0............ tttt....1...........LSAT
1046.10I
11
1
&Item 1
1
, LSAir 2 =LSAT' ( . 9 Oi .S"''
. o
1114.111 + 70.2..
.
I I
I. . .
. I
y
eI
' '1.1781s 4 4 1
:1164518.15
I
1
40 III
1
3 'Nub I I
1 ! 5 1 el1
..... am. or a. woo. da.....m... a ea.. ii see Ilo Is.
'22240I
* 1a/ .... I
--.......-1
1--...-.**,.....
28: lees . .1ttttI
I
I a I I It II/ I . I
.5111.411
.2 I ill il I I a
I541)3.2.4.4242 el woo I
1
8.1.45
1
I go I. I. I ell all
I0, , 8. w. 1
I.11 1 141.11 lo I
I
458.1111o wow. es 1 41 P ll peas j
I1.....0.1 ~of I
I
I""- ' es .3 1 II dm. ale,
I
2is 3111 14 lk a. w. dm
I
8810a 12. .2. I 1.4 p 33.
4I
es .. 88... 3 I i.e.. 83
1..I. 1 tt Mir
i
............1
1
I 8a. ...SO. S
............................ /.. 1191.- 8.8 ... ..... ..........
I 2 .8 .21 8 11
Mae 1.18.1 1 1;
8 1 108 8.8 lI
I4 I. 1
I
Iwo . 53 1 . I.I
as a I OS 4.
I
seel . so I 1
1 5 s 2 8
I
11. el I
1
t 8
I
I.a
1
mar...4....raomaraall
ISS.SS
.11
1101.4148..,..................4444ttttttttt 4040....000.040.
8118.10 844.111 114.0 See.40 111.010 44e.10 1118.10 $14.55 411.15 221.4./
LSO flft
184/ wood states es lanstIeo of 101.SAT Ken
souldto easousiod ?.t1.. 4above 1.35117
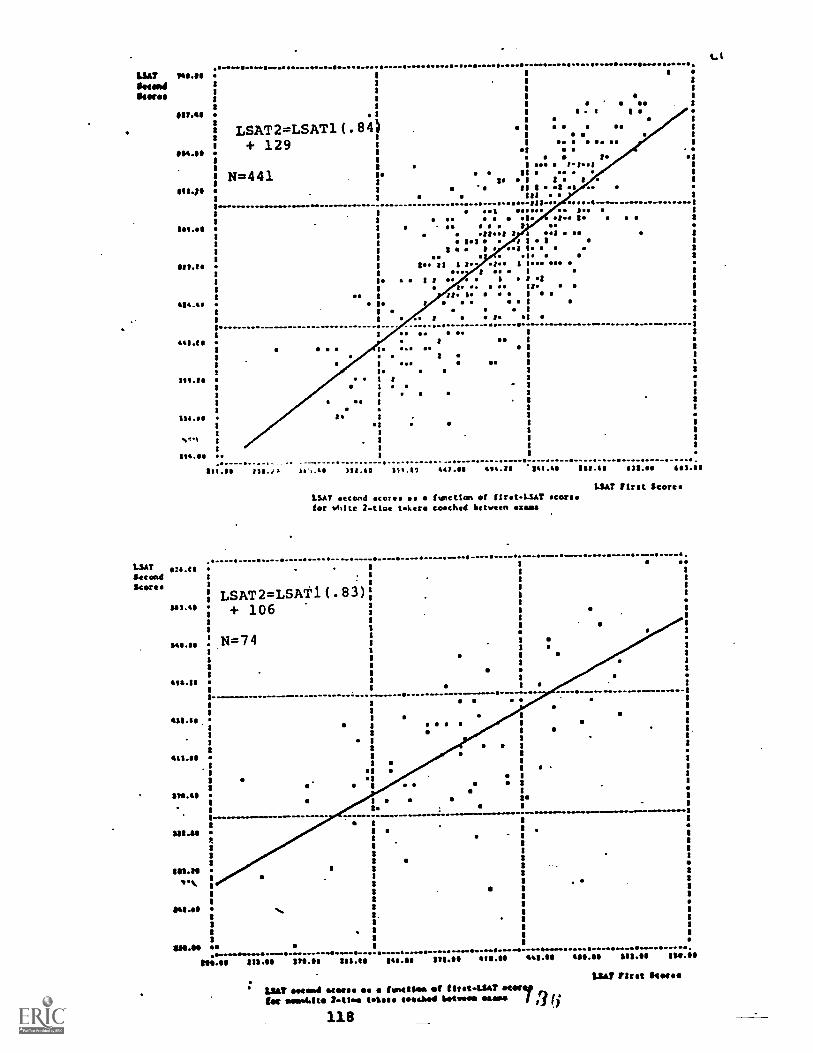
LSAT M.OSous.Store.
LSATSecondScores
...........-
I0
11.40
8 LSAT2=LSAT1(.841+ 129ma. I
1 N=4416224
1
142.6
1
It7.1.
464.46
16.000.01....... 088800.0.0.11.0.0.11.00..0000.....S
I
I. a
6 I
0 0 12. 10
418 0 0 O. .0I
S
I. 2I .. 1.1.1 1
II ..I. I I t I
II 1 *I 2 10III I
...... ..........880.411000 080.41.1 Se jo
O. 14 I... I ..
Moot I lost
1.2 1 I
111
II 1 of 1
O.1. 71 1 2o oi I Use
j
2 i .0 I 0 2. . 102. 2.
II
I.0 2 2 O
. .. ...
O. 100 .0
2 1001
00 W.S. O.0
2
1.
3
121.20
MAO1
"Vv.%
114.21 .
122.00 121.1.
No
212.40 171.12 442.00 4s4.2 .241.20 2111.40 35.15.
LSAT second tanctian of first-LSAT scaresfor white 2wttoe takers coached between mos
LSAT Tirol S
1
1
3
3
1
3
1
1
2
*MOO
.......... ....................................- ......0..................0 -...---...--.......---.................
ilT2.2..
I
I
I
I
1
1
""
I
+ 1061
I
I
I
1
1 I
1.0.60 . N=74 .
1I
I1 1
I3
1
I
11.1e42
I2
I- .--. - ..- -10..... - ..-... - - -.. ...... ...... 1
I
1
I
I
5.110421
4 4 1
111
1
1
1I
1 LSAT2=LSAt1(.83)
421.0
$1
122/.40 1111
a
. :. . . 1. :
. 1
2
.......... ....................... ............. .................w..........s.......I
1tla, 2.54 112. 420.611 4,14.110 4118.118 212. 214.11
LSAT /trot Stew..
LSAT ...nd seem as tunettow of (SAM? este,ie. 2202.4.2be 2121e. tofu'. twselhod letimoso mums 3 r.;
118
(.1

llooso4LSATStereo
'CG
I ; I .
.i.1_!. . -
I / ; "1
- I -I -I
!
I , lottoched outdo -t.I i..i....i. i J..: .. ;.I
; ..r , .
I t. 1 i I- 1 t .1
.. .....11...1...L_:1../-i...;...t-&_.
. I ! : : . 1 !.
-; I- I.
, . 4 , :
o - .I i /1 -..-
O 1.j "7loreakerro 1 InsI-1.
I : 11. . _
- ,- , . : . : - .- :-, -. i r
' L '. I . .
t... ...
-fi
I
I---bocoocood nonotat.
I
F
400
200
&eam, 300LSATSeem
700
400
300
400
300
200. 202
200 300 400
1-r-
:._;_!_._ J.-r-
.4I. , _ _J___, I, : Fri ; I
. _1
1-, 1--.- i_
.....,__
' 1 i i. I . _ ri .. _E_-
soo 600 200 LOO
first LSAT 1
LSAT overage for trocoelled 2-11m Jokerswith second-LSAT (unction of Ettot-LSA2,tooporInt whites and nanolitt
NM
s.p. sit_yitig.4:7R- t,7
oak14gill
!lirIp:d-11
I :,e
111L
. a
-:11 I 7 I: L--. aidu. , A ;air" ...mi......
,4
pliyi.v_,/- ,..1"
IIII
ii
_.,Ger,-.--. ...moo001,-
i-i-
iyenitt.,
A-iiiumimil :..:
mai
Li INI -:51:1:
white
300 400 300 600 .200 KOfret LSAT Scioto.
LSAT ay for Milos taws tomchoillkit000n Im,Iowilog ron4.1.1T story. fttottlen of ftruLSAT coro,toorottns blottobe and soorIstir
11.9 137
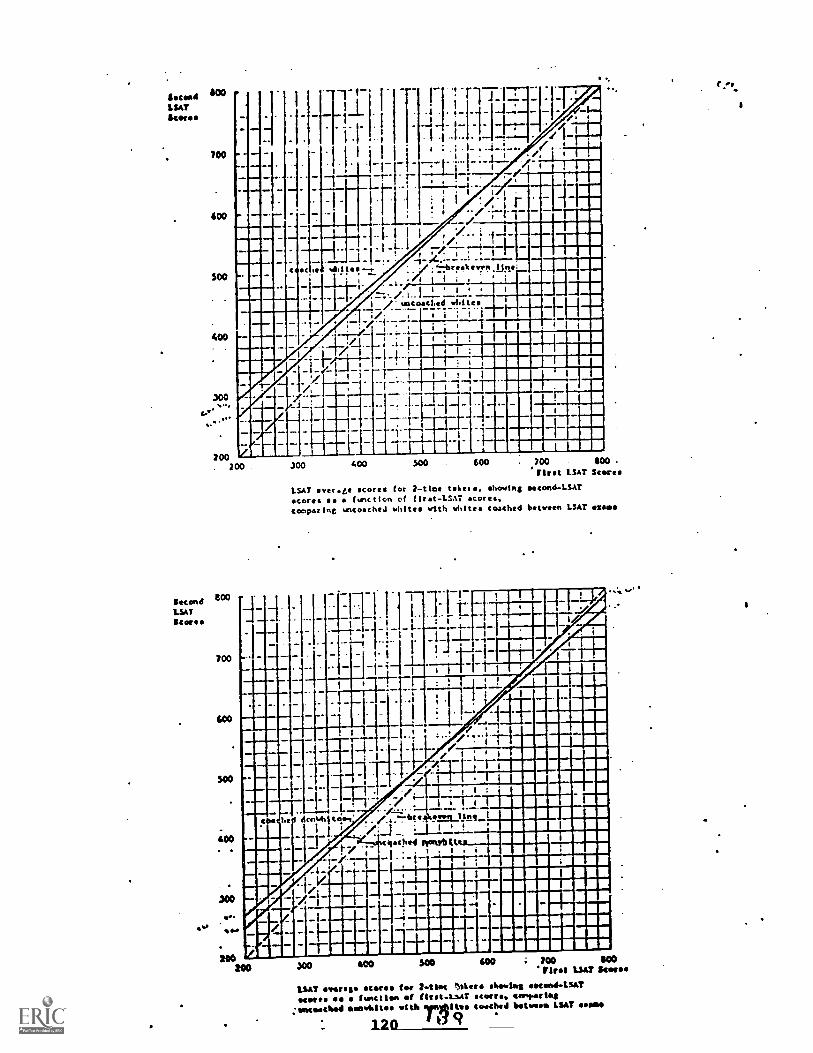
Siscfm6LSATScores
700
600
SOO
400
300
200. 700 300 400 700 400
first LSAT S
LSAT aver.te scores for 2-tice tette, shooing second-LSAT
scores ea lune tion of first-LSAT scores.comparing wncoacheJ whites with whites coached between LSAT ems.
Second SOO
LSAT
so
700
600
SOO
400
300
WS.
200200
300 600
-
t.
.
_' L-
...]:_f_
i
__
AIMI_
#
..1 '
/I1/ ...4....1 I
43-T/ . i a INr1
' iI
17-riI
. N
eoltom_linc1
111
he
.
eW ..7:tar /./'4.0/.. j
7! ' EE. .
colaci,e4 triages IIt MM
IIi.-/
.-'.
, ;--1 EKE am._,"-e-pMINIMpMUMNII
11
. :HI.....v
P "'I .
' ill !gal---hil--r_____ iiiirsIm
300 600 300 700 600'glut LSAT Uwe.
1SAT overags scores foe 2.ttest liter dloswifte ddoodLUT
*corn se function of ftreC.LsAT scores. comports/;meschml sweAltes with fowsbitwo so.chsi Wiwi* LSAT saws*
120 d9
600
f
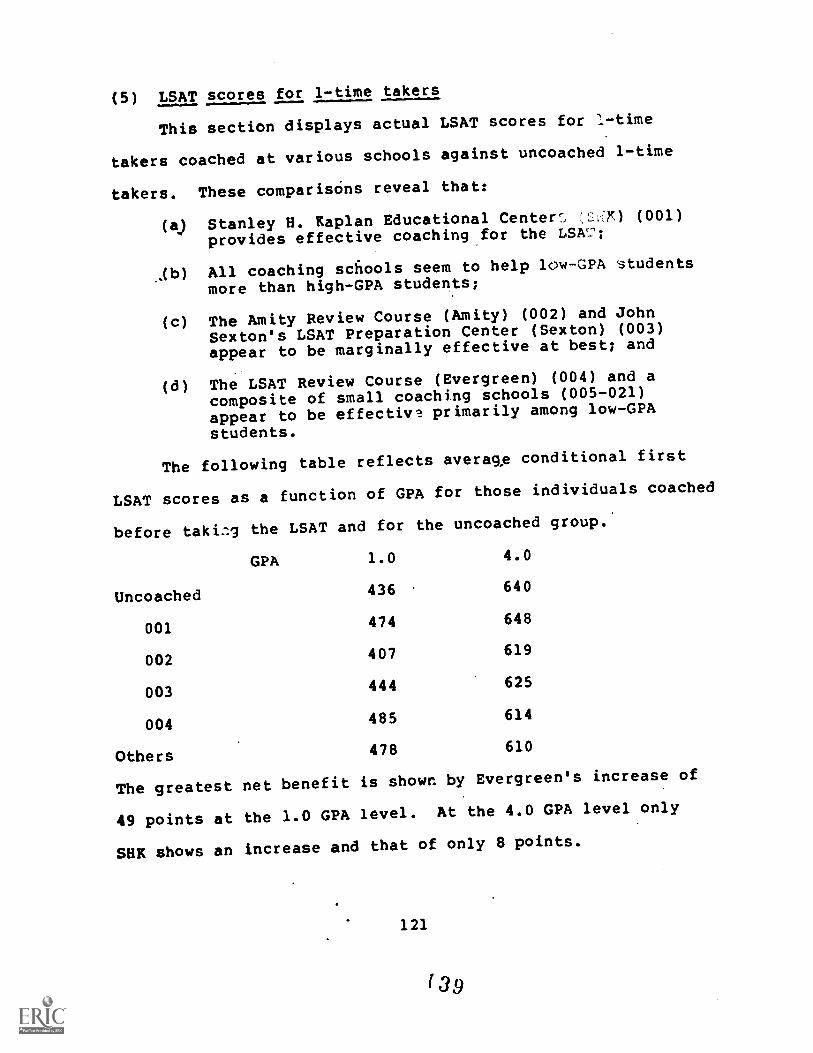
(5) LSAT scores for 1-time takers
This section displays actual LSAT scores for I-time
takers coached at various schools against uncoached 1-time
takers. These comparisons reveal that:
(a) Stanley H. Kaplan Educational Centers (001)
provides effective coaching for the LSV';
..(b) All coaching schools seem to help low-GPA students
more than high-GPA students;
(c) The Amity Review Course (Amity) (002) and John
Sexton's LSAT Preparation Center (Sexton) (003)
appear to be marginally effective at best; and
(d) The LSAT Review Course (Evergreen) (004) and a
composite of small coaching schools (005-021)
appear to be effectivl primarily among low-GPA
students.
The following table reflects average conditional first
LSAT scores as a function of GPA for those individuals coached
before taki.-..g the LSAT and for the uncoached group.'
GPA 1.0 4.0
Uncoached 436 640
001 474 648
002 407 619
003 444 625
004 485 614
Others 478 610
The greatest net benefit is shown by Evergreen's increase of
49 points at the 1.0 GPA level. At the 4.0 GPA level only
SHK shows an increase and that of only 8 points.
121
139

447Sew.
LSAT$
1
'Atm LSAT=GPA(58.2)1 + 415.5
ISO ; N=6081
1143.411Is
I.aaaa3
1.1Si
..0 ...... ..0r -
11 VI
/4 a
t1 1 .1. e me
a I I
fee s: ow es/ 3 11 1.
t I I 1
.1 41. . t 1 /
Oa 11 .2. .111 1 S. 91 : /
.. 7.
1
a
t
a.
af
I
Se / 1
so.
I . 1 31 .3 .1. 1 .
11 3 4 Soo ... s
MAO I. .61 / 3 3 es
Ile 1 / 33
I I a 8 . I: 1 1 I
1. 1 .I. 2 S
Ii 1
MAO 8I
I o t I
I1 g. Se
go., II es
II
41.14so
I a Ia
e.
I.
IAS
1
11
3
11110.43
3
3
I
141.83
a
I
34
I
Map
200
700
WO
.$00
400
co
1.76 1.11 3.22 2.41 3.6 2.I 3.13 3.34 3.35 S.s
Cumulative CPA
150.7 scores as A function of CPAfor White 1-tioe limiters coached at 001
-1 1i
-i- j I i I ! ;....,
t : t
I
-1-'
1
1-'
;
---t-1-1
-17-_L--
1 i :
I -1`i 1 1 1+1
--6 ...t.tte...z_ !
.1 I 1
.
....
a
.
I
a
--I
a --
"7--. ---- 7I.;0licoethed-Yhite---.. .
1 i I 1
-1 ;.al ..1..ialaral
a''''..
A_11---
r-
1 T--
..4....J.._i
. i - ...
1.3 2.0 3 0 3.3 0
Cvmdialvim CPA
Wit ..... stereo for 1.tio 6 r a flotillas a GrAl,colorlog while. 440.4 sit 001 oltlowatoeck464 oreltes
122 4 0
2.3
.
OAS

OW. Ieri.,01......
LSATISOM
Score' I
111.111 8 LSAT=GPA (70 . 8)+ 336.2
N=106 .ISOM I
i
f$1.1@ !
Ia
0
0We
00000 ..................1
Ia
II OS
a
.
a
II
.........
a
re-
t
1Se1
1
1
11
1
.1/
114
11
11
1
. 1
1
11
3
1...............1
;17.I@
I1
1$1.11@1
11
1
411.4,1
1'AMU
111
.354.41
1
3
141.7@
3
1
Issas
LSATScovs
'CO
700
600
SOO
400
300
.4...........................................e........e....... ...... .....-...4-..... 4............. .4.
1.11 245 144 Paa 3.7 1.11 3.11 3.11 3.17 1.71 ss O0
Cumulative CI'A
LSAT for I -tIs taker se function of CPA
for Mite, cach4 at 002
; .
I
I ; s I
I
1- -1:-.- I 1+1
I ;
3001.0 1.3
r2 0 LS 3.0 .3.5 A 0
Cfautattve CPA
LSAT refgo scares ref 1 -Um* tablets so bastion of CPAteAtatlfts whItso tacked at UCZ with unseat/64d MI.11 4
123 41

2beurl. *siZat0/A0AY*Job:46...iAi :aucan.64....aA.&...::
ucL1142
Scores
010.11010.111
eLSAT=GPA(60.4)o 383.6
cum ; N=3501.
1
5114.7111
a
4.0.
10. 1
1 1..... .....
I
OM 0110
2 a
a
. ......
041
O0
7
.
I
7
IO
3
a
le
8 Aa
I
4.7 a
a
a. ..
JI..2-2
asae a
al ..
as
.......
a
8
..
e
0
2
I.1.,.
filwoodwft...
.1!
I
I
I
I
i7
I
I
4
I
i
1
o
212.II
ft
I'4111.$
1000.40
400.30
11$1.2
'MAO
2$1.0
LSATScore.
100
700
SOO
$00
400
300
100
1.73 6.17.
2.2 2.22 2.$1 2.1$ 3.00 3.14 LAS I.73 3.18
Cuoulativa CPA
LSAT scores for 1 -tine takers as (unction of GrA
for whites coached at 003
47 1 01-1.-4 1.-14--:--
wm_Aba&vidteez...-i 1
.
--1 i
.! j i-.
_...1 1 ; 1_14.1I
1
1
-1 1
11-1-1-
-1
1.0
,.r ;
I !
!
i_lI...... ........
_ -4-J-1--:._1 I i
-1_111._ _ I _J:::::. .. -.L. -I-,
,
I
1 5 2.0 2.3 3 0 3 5 4 0
Cumulative SSA
ISO averse. cote. for 1.tio. toter. as function et CPA
tOertIns %Mies cumchd WI 003 Oth.unco0..61 vhill'
124X42

OPPONIM....0.................M.M......... 11 a. er. .......... .
LSAT MAIa
. I
1,4.1.1..SATGPA (430.0)+ 441.8
s .11 1.9D41,134.13 = ..
I111:111
- ...-----a
I
St.
fe
..
1.'1.11a I MMUS.IMO
111.33
. -
113.31I
als.11
Is
770.10
'113:30-
33111.16
15AT 600
700
600
/.ft
$.
1
1
1
1
1
a
II SO I
40 II OS II .01Oa 4 I
411
I
1
1.1 1
1
1
1
11
1
t .If&
7.17
1
r
2.17. a.aa 3.11 I.4 1.41
LSAT core for 1 -tire takers a foutIon of CPAfor white, coached t004
rdrri- rrTTIT1:
11 II I it/LI
J iT1
I %mimicked 11
-1-1-, , `-004 tail to.. 1 ii 1
--I 1.-i.--1-: 1-1-7/1i I I
I
7.44 3.11
Cumulative CPA
1 - -4--,i
1-7 '
. I
- -
T-1-1-I
_i____,L_1 1
1.0 1S 20 2.$ 30 3.3 40Cir/laity. crA
LSAT F. Roues for 1-11.. takers fiattIo of 463tokrreng ioldt coached se 14.4 via encivched whit 4
125
a
4.4

LSATStores
LSATScores
111.14
1
LSAT=GPA(44.2)1 + 433.6
0.
Phi"
N=141. t
iist:se --
-
$11.111
471.11
a
;S1.30 .....1.54 1.40 1.11S 3.21
te0
700
a
a
...
O 111
a I1
a I
I
a I
a 1
a iii I
a a I
ai... 1
i
eas I
ai
as S I
a I
a I
I
I
a
. .6. ...... ...... .....am
2.5s 7.71 3.1 1.77 3.5I 3.71 4.0t
Cusulative CPA
LSAT score. for 1-time takers as function of CPAfor Olt.s coached in other schools
----i=athlAas in other school.;
100 ..1...-.j! I I
!
2001.0 2.0
1
3.02.S 3S A0cvmuttv. CPA
LSAT awros score' for l-tio, talkers a function of CA.
CooarIon whites coached in othr hooi with lancoachd whIte
126 J44

(6) LSAT scores for 2-time takers coached before firstexam
This section displays actual first-LSAT and second-LSAT
scores for 2-time taker's coached before their first LSAT.
These scores, together with comparisons between coached and
uncoached students, are shown for individual coaching schools.
These results suggest that:
(a) LSAT coaching is primarily effective for low-GPA(white) students;
(b) SHK (001) produces better-results than the otherschools; and
(c) It appears that the benefits of coaching may besomewhat ephemeral; in most cases, the uncoachedgroup improved its relative position on the secondLSAT exam.
127
145
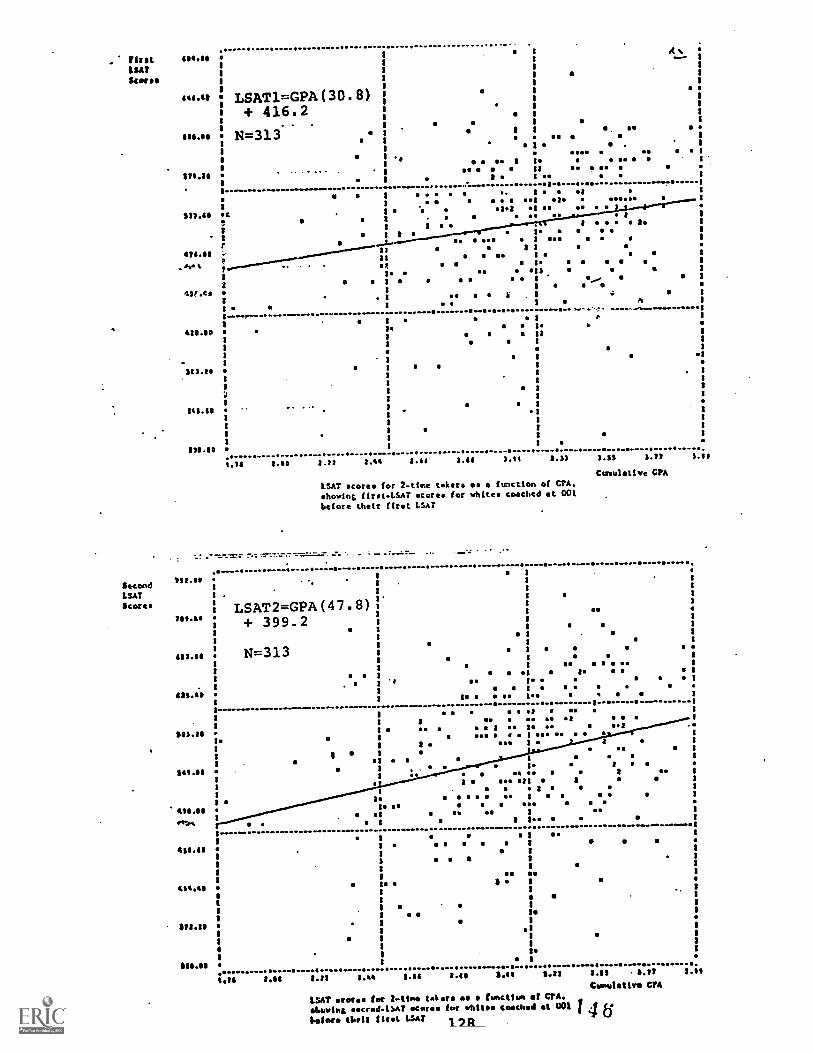
rfrt 414.11
LSATScorn
444.4111
411.11
sts.ts
ss).4
Cti..1.
4sr.c
10.110
413.11
814.110
304.10
;1
1
1
sc
I
II
LSAT1=GPA(30.8)
N+ =34 1136.2.
.
...
2
I
3
4.4...
. .
a .$a .4.4 .8
.I
tI
SO
e
ii
........... .......
IS
118
.4.--
1
1
O.SO 1
1 di4. Os I
I.11: Ir.
1.......8 a:
ll. 0
PO 8 I
I 3 1
1
see 1
1
1
3 a 1
...., 1
4 1
h 1
... .........q 8
1
1
.3
1
11
a
1211oP
IN1
.....;.7 1.08 2.22 2.44 1.1
........................
1. 3.88 3.33 3.31 3.77 3.77
LSAT score. for 2.ttme takers as a function of CPA,hewn first-1SAT score. for whites coached at 001before their first 15ar
Carsulative CPA
....... 41.11............................ ........... .......1......41......0.....40.
Second411.0
t
. 1
LSAT I .
1
Scares 1
8 LSAT2=GPA(47.8)e 1
1
)811.1ks8 + 399.2
8
1
a 3
t
I 1
487.48t N=313
3
1
. 1
1
. . 1
10 OM s
I.
* 1
424.08a .
I4 .. 9 1
... ........................ft....0 11.. a. .... I
8...............-----1
. .4 am 3
13 gm k a 1
$33.30 .1 ph .02 .
1.110 e 1 wire se I
3it
gee $ 1
1 Ia
3
t1 I
sehli a -
2 3 I 4P
t
.
. I es 1
11 aim ell 8 a a 1
1
. 1
I1.
8 I
41.411$ se
11 Os OS 1 41 1
ell" : 4 11. I
1- ........wm.dompwm... ..........0...8
1OM
444.48a .
1
1
8
1
40.488 a
18
11
1172.s1
1a
818.08
81
3
0.84 Oat 8.11 2.40 1.44 1.111 3.t1 1.33 3.41 1.17 1.88
CalmulatIve CPA
LSAT 'eaten for 3 -tine '.tars a function of CPA.
stowing &IAA? e1 fur 1/1111. cotited at COI 1 4 fbolero 'lett that LSAT 1711_

4
a
.
1
1
1al
1
1
1
first 4.44
kW111.10
"'"
w.
1
;LSAT1=GPA(68.3)+ 291.4
$14.11!N=41 . 1
GM. Were NM 1
1
414612 OP 1
1
1
1
asa.a 1
1
1
1
431.401
NIWOM
111.11
1
2414.111
MAO1
11
1
1
1
311.1111
0... .. .
1.11 1.11 1.44 1.60 1.14 SAO 1.14 3.1 1.34 3.41 3.01
Cumulative CPA
LSAT scores for Mime teker as e function of CPA
showin& first -LSAT scores for whites coached at 002
before their 11rt LSAT
7''7 ..
.
Second SUMLSATScores
sei.S1LSAT2=GPA(61.0)*
1
1
1
+ 337.51
1
a 1
1
1174.11 ; N=41U.
1e 1
a 1
1111.11 1
1
1
117.201
1
1
1
1111.5
1
2a,smea
....... 4.--....- ......
3
1
II
1
411.4
I
Uhell
111.55 0OOOO O
LIS 1.44 1.40OO
1.11 1.11 3.01O
1.11 1.14 . 1.4 1.04
47 1.241 score, for 2.tiee satire si fuor1lon of CPA,
hinflog eocend.LSAf store. far whites coached at 002
**lose Shelf tarot LMT 129
CtolillaUf crA
. _

rivet1.14T
1tas
811.44
9$0411
$4..4
Mae
41$.$
417.11
1175.56
113.4$
111.33
341.$6
,0 * *
4LSAT11=GPA (42,9 )
+ 364.7N=192
t.
a
1a
3. e
1a
1
Weem...
.......
s
OS
to
a
.8/
I.1
3
1
tom
s
I
.........
.
t
OS
.
SSa
SS
3
$ ..4
a
SIi
1
1e.. II
8 m s. 1
1 ..OS a
ipa
1
es ao . /
...... I. ....I1
a
II
e ill IO a
1a II
a1
10
a11I
I
3
3
3
.ffi.O
SecondLSATScores
..... ......
106 Sae 1.11 2.41 2.65 2.64 3.3* 3.21
LSAT scores for 2-time takers as s function of CPA,
showing first-LSAT scores for white. coached at 003
before their first LSAT
-141.$0
LSAT2=GPA ( 65 ; 9)MAO + 324.3
;N =192_1131.11$
3
I
ISO444.4$
11114.30
3
I2S.*
.473.113
0.va
431.31- - 3
SIMI3
1
$411.211
1
SII.s
.. 0
a
1.31 3.71
Cumulative CPA
3 11
.....
3
I
soass
1. ess 1
ess s
as
I
I
1.
It II CO I OSI a
ee . a
a / 41. a
4 a
aI
00 TOi Se a
: . aa
. 1 s
as ils p
a a 1 .. a
s
O ..... ...... ...I
a 3
a I
11
....-
1
......33
II
III
....... 6I
.
a
tad 1.141 8.17 1.11 SS 3.114 S.'s 341 0.$11 1,71 343
ClatIve CIA
LSAT scoria for 2-ti tabors as tictim 1 CIA.
Shoving ecn.AAT for *lt toothed at 003
blot Ott, gil.t tsif 130 148

SecondLSATScores
Met 4$11.9
UAT
1I2.16
MAO
.0..... 00000000 ..0
114.19 $LSAT1=GPA(37.6)
8 381.81
ma. N=891
1
Issas
311.40
2
448AI2I
la
421.48-.4.%,
426.2822
2
I
36O.SO
......
132.88
a
a
2
2
216.gal 8.24 1.41 8.61 2.42 1.81 2.1 1.11
LSAT scores for 2-ttne Weer. as function of CPA.
shoving first-LSAT scores for *bite coached at 004
before' their first LSAT
...
LSAT2=GPA(39.3)+ 411.8
N=89
MAO
MAO
Ise
4118.12
atlas
114.40
SO
s
3.2s 3.7 1.
Cumulative CPA
......
a-
I
t
al
I
8.81 844 8.42 841 2.1 1.13 1.113 2.14 1.2 LAI/
() LSAT stores fur T -tine tailors es function 4 CPA.
showing ron.J.ISAT enr Int whites coschJ t 1104
111
Cnultivo CIA

611.01MiltLSAT1401e0
111.11
sLSAT1=GPA(39.1)
el
1115.41 + 387.2
s N=378
SHAD
....... ........... .... ...
I
I
I
II
3
II
fOA.S .
411
I
I
I
I
II
I
3
40141 . 3
1---......- ........ -- --- ----
------.------..... ----.--
.........-.....................1
4$7.1 3
73
3
I
434.13
70
1
61840
7
507.1
5.01 240 1.31 147 2.76 1.13 7.16 3.33 141 3.70 3.11
SecondLSATScorn
076.4a
117.31
t
Cumulative CPA
LSAT scores for 2 -tire takers as function of CPA,
showiny first-LSAT scores for whites coached at other school
before their first LSAT
LAT2=GPA(72.6)4 314.9
Nrg;37
1...- .....
le
8
.
Iel
I
.....
III Sat tat 8.13 .16 SAI 1.111.1 Sat
Cumultiv CFA
LSAT to P.1141 111,40 fonetin of OA,lmatod t.61 *coes for whits. twiched at othetystl.00ls
Wilms thole Mot tIAT /
132

Viral r' ILSATUwe'
700
500
coo
I. : a- , , ,
A - i . I 1 - 1 - 1 - ; ;-- . - I-I--; . . . _ _.2. __I'. . - - - ! : I . . . I
-'I 1
. 1 I . 1 . .1 _ . i . : .1 - . . ,.1 . - .! . - . . --- . .1- . . I .1 .i__ ! I . -I..1 _ 1.. I I', I 1
-------1 .1-7,...4...,- 4- 1 .--.---1.1 " I __ ---- -1--- , . ,
1I. a - . ..,- .i .,- ... I. 1-..- i 1 .. ,
. i ....-. 1 . '. - 6---1
11 I I i I.1 !_j I 1 :
___._ i____:,[... .1 ;.:t1- ,--1 . . .i
. . . ..:.:,1 .. i . : :
, . 1 : : .Ti 1.. r _.,..) ri. i,I r"1
1_1_11_t /If 1
1 evItteethen selalt,ceI a I
tol--.41Tit.
..... ...... ; . ' -J I .1,1.....t. J. ! 1 8
1 1 1
, : i-L -f(t 1 i I I i .....1
i L. I " n ! j 7 i , . : . :
_H..]1
: : . : i i1 1 ! I t 1 :
. I 7-7-=_FI:
3C3
d-i... -i- -. __i I..__' 1111-71: -.1!1 CL___ : ! F 'rn. : 1 : 1
: I 1 ! i 1
L-11ii ;
1 6 I 1 1
:-Ij --.--/ . Lll 1 1 i ; i1 I I ..!--/.1-- . 1 . I-1 .___-__,-T: -4_!__
200J'il I IIi i
1.0 1.5 2.0 2.5
Second "°'LSATScores
700
600
500
400
300
200
3.0 .3.5 4.0Cumulative CPA
LSAT ge cores for 2-tInc takers as function of CPA.
shoving first -LSAT score, and comparing whites coached at 001
before their first LSAT against uncoached vhi tea
-; I .- -[.S 1 1_L1 1 :
LI1
1-17 I I I 1
1# Iil l'r7 1. 1 I I
A
1--7-4--Hi i
lam i , , , :. ,
i I I. 1 1 I! -1 1 I i
.21_ _ UMI
I
1
I 1 I :111
1. I i 1 ,
1II1 I 1
i
----001 wit
;
-. -tI
tncoecled eltte-%I I
i 1 I '.......L...
i 1 !
-,1 I
, 1 I-.1
I F- --1- i-_,_,_
i-t-I1.
i .i ._ -t
_ .
1
;
1
T----: I
'
--71-1......--,L..4
-1-1-1- i
1.0 2.0 2 5 3.5 4.0
CueglatIve
5 , IISAT ttttt o store. Cm 2.tIe cater. w (unction of CPA
,ahotv 1 hp ..eld.L:AT wrote, cvspag 1..ft whits,. coached t U0Ifetur Weir first Ilef soloist encroached ladies
133
15 30
!tee

firstLSATSt0e90
SecondLSATStores
t
4C0
4 4 -; :
11 MO I .1. . 11+,,, I _,_r--- 4
1--.
anceiched 14 1 te s
200
8C0
700
600
$OO
400
300
200
002
. . !
_.1....d : ! . ! . : ; .
, III
i I
.._r_!_.__!_; ...4__ , . i ! 1.
1 1 r, L --r ! -1 , .
_ -.3.-.17.[_i ----,._c.-__-_:_, j : ,----1 ---i-Tr_Qi ;----.__t- . . . , ,
i_H____ _LI 11,11,,L, .,,_IL - _1_4..1__,..1_ . . _
1_1 1 14 H 2T:I : _iT-r- I ! I I
I H-i"-:--I Ili 1 I r ±
-IF-1
1.0 1.5 20 2.5
1
3.0 35 4.0
Ctraulative C?.14
1.Skr average scores for 2tioe taker. a. function of CPA,.
showing first-L.5AT scores and tor:paring whites coached at 002
before their first LSAT against %stanched whites
t
I
3.0 2.0 2.5 3 5 4.0
Cuftwlatfa. CVA
LSAT eeeeeee cor.. far 2.tiral taker. as a function Af CPA.
hawing second-L:411 scares and ca.pnlins. whites coached el 002
Were. their first VAT against wet...abed *hits.
134
1.5 3.0
1 52

FirstAILSAT
Scores
Second
scare.
COM
TOO
430
SOO
'CO
200
5C0
700
S00
S00
400
'200
:J4::I -1-T g_. _g , .
_ 1
ems, 1- F . t .
rI t ,
;
----1---*...1_1_._.;
i 1 -4-1-
l sncosched w4itsimmn:,
..- _,.':-..003 vtlite,__
f____. . : r-, : : :.
1---- --- i ,. .
A .
111..+--
-- ^- 1 1 I -.---L ..-.1-71 -.4 --J.-T-11-- 1 1!--1I
I I : ;1 s
.---, Fr----7. .--1-":1 : :
.1---- .1r- "--.--".; . : '
-+--
i
L. 11 I! 7---- 11
I. 44--ii
i
i . : . i I I
I_j_--1 1 -1 I
--i I i I 1
1
i, 1 H : -1-FH:
1.5 2,0 2.5 3.0 ,3S 4.0
Cumulative CPA
LSAT to scores for 2-time takers as function of CPA,
showing first-LSAT scores and camparIng whites coached at 003
before their first LSAT against wcoachad whites
1.0
2.0 1.5 2 03 S 4.0
Cumulative CPA
LSAT ge o for 2-tine later se a function of CPA,
showing their second -LSAT COre1104PCCOperinA VhitOS coached at 003
before their first LSAT agaluat tmcoached Nate,
3.0
15.3135

Met 100
1:47Scam
SecondLSATScore.
700
400
00:1.0; il5
SOO
:
700
. _
un Ord wlitg000
whit s
2 0 2 5 3 0 3.5 4.0
Clasuiskitvc CrA
LSAT to scores for 2-time takers as function of CPA.showing first-LSAT scores and co-raring whites coached at 004before their first LSAT against uncoached whites
to
00
00f 1.0: 1 5 2.0 2 5 3 0 3 5 4 0
cumulative crA
tsAr AAAAA tel scoria for 7-11. takers se a function of CPA,allowing cunt.i.wr eeeee on4 a...paring Witte. cnochod at 004Wawa their first LSAT ageinat uneooched whit.%
136 -I ° 1

fleetLsATSee's.
SecondLSATScores
I
700
S00
.300
2001.0
SOO
700
;
SOO
I
00
200I 2.0
L
'-.whites apached in other school.
i t 1 i "I "i i
2-.. 1......-J
_I IJ.:=1"/-1
1 S 2 0 2.5 3 0 :3.5 4.0
Cumulative CYA
LSAT ge scores for 2 -tire tater. as function et CPA.
showing first-LSAT scores and coopering whites coached at other school*before their that LSAT against uncoached hites
-a
chid wi i it a
-II-
1 Iff
ites:cnached at other schools
-
1 S 2.0 2.1 3 0 3$ 4 0
Cumulative CIA
LfAT &&&&&& score. for 2rio tater. as a (unction of CM,shoving acund.LUT Genie. and c.avarIng white. coached at other school,
before their first LW &vinal uncuached whit,
55 137

(7) 'LSAT scores for 2-time takers coached between exams
This section displays first-LSAT and second-LSAT scores
for white 2-time takers coached between exams. Comparison
of average LSAT scores for coached and uncoached students
reveals the following:
(a) Amity (002) appears to offer the greatest benefit
for high-GPA students, whereas the other schools
seem to be marginally effective with Sexton (003)
showing a score decrease.
(b) Evergreen (004) appears to be ineffective for
low scoring GPA students whereas all the otherschools appear to be extremely effective.
The following is a table of first and second LSAT scores
as a function of GPA at the 1.0 and 4.0 levels for the coach-
ing schools we have analyzed. The uncoached group is also
included:
GPA1.0 4.0
001 LSAT1 410 534
LSAT2 464 586
002 LSAT1 302 580
LSAT2 364 645
003 LSAT1 467 524
LSAT2 502 568
b04 LSAT1 417 515
LSAT2 414 569
Others LSAT1 354 536
LSAT2 402 591
Control LSAT1 412 556
(Uncoached) LSAT2 421 605
The composite group of small coaching schools shows gross
average conditional LSAT increases of 55 points at the 4.0
GPA level, Amity (002) shows a gross average conditional
138 1 5 U

increase of 65 points. The corresponding control group shows
increases of 49 points indicating a net benefit of 6 LSAT
points at the 4.0 GPA level for the composite group of
schools and a net benefit of 16 points for Amity (002)
students. Although these increases are small compared with
the dramatic increases reflected in SAT scores part of the
apparent minimal effect is accounted for by the extra-
ordinarily large increases in the control groups.
At the 1.0 GPA level Amity (002) shows score increases of
62 points, SHK (001) shows score increases of 54 points and
the control group shows average conditional score increases of
9 points, indicating a net benefit of 53 score points for
Amity (002) students at the 1.0 GPA level, and a net benefit
of 45 LSAT points for SHK (001) students at the 1.0 GPA level.

Met 801.8LSAT t
tSeot t
t
841.18LSAT1=GPA(41.2)+ 369
$.411
00.000..0.4.00.00 ................. 0....000110
571.1
411.58
451.10
411.10
114.40
147.50
110.30
N=155
.
a
1
.
- a af
1
1
SO1
1
1
1
1
I.1
as1
1
f
atI3
.5 a
1
3.
a
a
2.54 1.73 an 5.09 3.17 1.40 3.44 7.2 4.10
Cumulative CPA
LSAT first Acores for 2-tio takers as a function of CPA
for white coached at 001 between exams
Second 740.00
LSAT 1
Scores
721.10 LSAT2=GPA(40.7).+ 423
`"*" ; N=155.
11.43
I
I
3 1
a
a 1
1
SO
1
01M .... 0.
Ia 5
5
Ia :
I
ill II
I5
e s
a 5
as I....,I
al1
1 , 4 0I
:
:gI
0I
I:I
......... ..........1.71 1.9 1.t 3.41 b.8 4,151.01
CUm=8* CPA
LSAT cond scorn for P -118.0 takers function of CPAfor mitts. coathd at COI Initusn egaa
140i 0
t.O 1.11 0.84
,
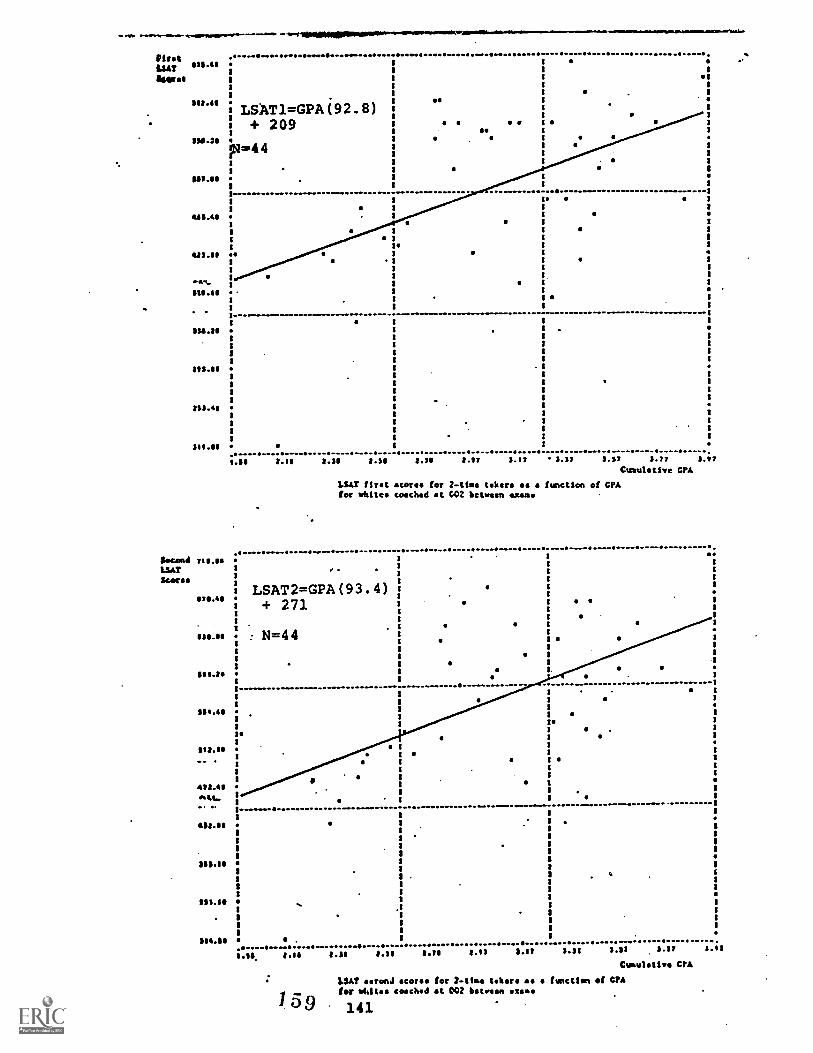
PIC' .04...Geo 00000000 .4104444..44
LSAT 1114311 1%W 1
1
SecondLSATfumes
LSAT1=GPA 92.8 )1.11
+ 209'soar
Fq.4 4
sm.a
442.4
1
1
411.1
..21.6
1
21.11
111
tim.1
1
1
1
153.41
1
1
1
111.
1.1 106 1.3 1.5
$
21
1
se1
1
S.1
a
1
$
11
1
1
1
1
1
1
1
1
1
1
...... .. .. ..
1.76 7.17 3.17 3.37 3.37 3.77 3.2/
Cumulative CPA
LSAT first ..... for 2-ttoe taker as function of CPAfor Atte/ coached at 002 between exam.
ts.
670.66
63.
$21.1
177.$
212.66..
413.4salt.
.
21.6
$111.1.
211.1
116.
..... . .
t r .
LSAT 2=GPA ( 93.4 )+ 271
N=44
1
1
1
1
1 a '
1
1........1
1
1
1
1
1
1
1.1 1.1 1.16 1.16
do. O.
OMB.
7.16
4. .0.. ...
. 4.
O.MMMIP..w.O.m.m..0...1,0MOMIPMAI..MO..
o .....
8.71 1.11
O.
a
1.11 1.11
.
3.17
$
11
11
1
1
1
1
1.1$
59LSAT conf for 2.4104 takers as function ffor whites coached at 002 ....
141
CUA6/41141 CPA
CPA
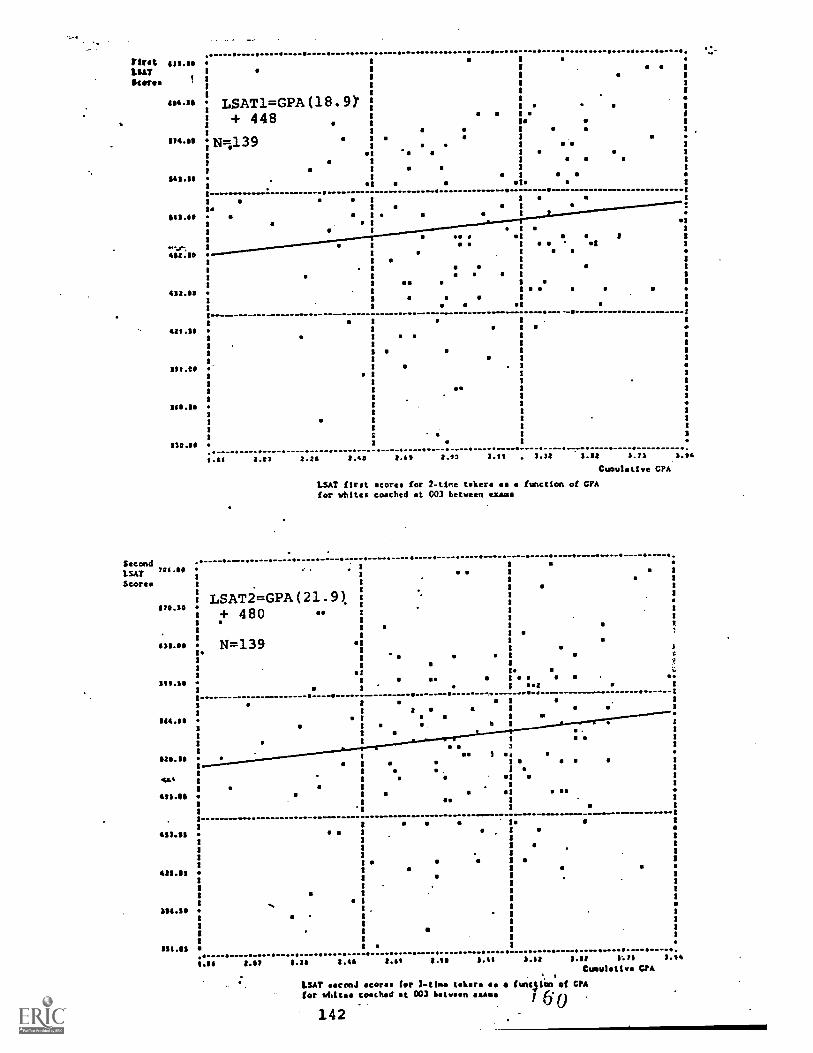
Stet asSJOLSATrn ISco
1
4154533 LSAT1=GPA(18.9Y1
+ 4481
11 -113974.111 ;N
1
1
&mond1SATScores
***
1141.5e
1
:110
Om. . U.
I
31
a . 1I
3
1
1
.. 1
1
1
35. .......flemmw.m. 1
1
0 1
el1
OS I S' el 1
......
MAO ..11
1
355.55
1
1
2317.60.. ....
1.31 2.07
. ---701.50
1
1
1
I LSAT2=GPA(21.9)1 + 4801
{MOO1
N=139lo3
3
11
WAS1
1
sa
11
I
1
3
11
1
1
1
1
..... -
2.10 1.11 1.12
3
1
1
2.7 2.60 2.03 1.12 3.72 1.14
Cumulative CPA
LSAT first scores for 2-tine taker. as function of CPAfor whites coached at 003 between exams
15 .15.
:es 1 ..
1 :
. I :
a: 1
1 1
:.. 3
. 3
.... ....1 .... .............. ....... ..... . .............................:3
3
1
s 3
11
1
1
11
..0.
*am.
I
I
I
1
;?-
s.
P si
I
I
1
. 1
13
1.11 1.5$ 1.611 lag SAO 3.11 la, S.IS 1.1Cumulative CIA
for utilise toschd et 003 betwn ...for -tine toter. as (unclean of CPALSAT earonJ
14260

rivet...... 4.......... 4. .......... ............, . -..
LSAT14.
2
Seats.
LSLT1=GPA(32.7)a
2
1
111.11s + 384
I a
; 1
!0;
1 4 1
104 2
511.10 N=58..
I
I
1 I
521.41.1
1
..... ... ....... -.................. ...... I
1
I a 1
I I
411.1I.
I
II
I
. 1 I
4141so
...I
I
III
1
I
411.8
1
1
321.1I.
1
1
1442.4011
a
1
311.21
1
1
12.1.40
1.1111 2.00 2.20 2.40 2.40 2.$t 3.11 3.21 3.41 3.41 5.131
Cumulative CPA
LSAT first scores for 2-time takers as a function of CPA
for Cites coached at'OCA betwecn exams
Ind 774.00LSAT 1
Scores I
111.00 LSAT2=GPA(51.4)a 363
10a
.11s N=58
a
ste.s
I. .....
.
1114.110a
......... ..... ..........- ................. ..... -- .4
1.11 /A0 3.35 1.45 1.41 1.41 1.01 1.11 1.411 3.41 3.01
Cumulative CIA
.
.
LSAT ccund score. for 2-tio taker, es function of CPA
for Atte* soilchod at 004 aveect exams
. O.
I
8
11
1
1
....
Of
161143

/fretLSATSeers'
185.88
SA.11
1131.11
L9AT1=GPA(60.4)+ 294
1
1
1 N=451
s'
11.»»
Mat .
sa
4711.0
1
417.101
1 e..
wre.1
17.10
317.0
1
1
337.101
1
327.10 . . e .
SecondLSATScore.
104.20
114.10
1
1
1
I
I
1
111.70
317.40
1
Ass.s.
1.11 2.2, 1.11 2.13 2.10 2.17 3.111 . 3.32 3.41 3.11 3.113
CUaulatiVo CPA
LSAT first score. for 2 -time takers a a function of CPAfor whites coached at other schools between exams
LSAT2=GPA(63.0)+ 339
N=45
..
43140
411.11
111.00
a
11
1
8
.
1.111 2.41 1.40 1.17 3.111 an 1.4. 3.14Cumulative CPA
LSAT cond scorn for Ttime taker, (unelln of CPAfor Whites coached at ether schools betemoett
144 162

!fleetISAT&cocoa
2.2i., -
.--I -1-1- - i-1
; ..- i - , . i
F.
--- I "i I iI-i.1 '
i?CO
,. , .
Uncce ched e .-.I t
, --t---ti---, - .--..-4-4-..!--.-i-14.1.- i 1 1
... - -1.--------------:,'1 . ,
! i'i _..L II; . ..414 .111:1::t=.11, t 2 1 I l' 1 i 1 I T -:-. ,.- . i , j 1,1
1_1_1 1_ _;. . _ , . :.4____) . ......_ ._.1.!_.1.....1_ __171_.L.
_.., rf-------1- i' 7 ; I- 17-- -1 i i1 , . 1
11
300 l- l4- ,
". I- I t i ir_l_...._.
_ _I-i- 1_m -
_
'_
1 i 1 I j -: 1
1
r
! -!- tI 1 1t1:200 L_
_1 . -___....._.. -- .
Second E04LSATScore'
100
3 0 1.5 2.0 1.4 7.S .1 0Cuullative CEA
Vef !co. 11. it 1.41 , of tsCocv4cl.r.5 I .A1 .. 'n 70ot' C nt 001 '3etiolurn examss6a lost f le t- U.Ar 4....c.tr, vtiite
r---r T7, i ;
-,. -1.:!._ _,_ _ ...---1
-i I 71 TI'I:L.1-1 I
i ! I . ,
'._..-._7. Dr_l__T17.19
, _ I 1 _ I_____,,..1. _..L...,_
,--i" a
I 1--;--t -1- --1'-'' .---i----- 1 1121 -1-1- Er -'
...I. _..1._:___1____:_,_.__; i.,_ : ____;1_4_ -, r-1! , ±_,
-77 I 1_ 1_4 .i Ll...1 1 . .
_. . . - i ' 1- 1 . . 4._ ,_.: _t_i -I_ -1,...7,.... ""-
, , : . .--_-.----- - __Lill i_ _Ili_ _ ._. .: l_r___, j>.,...._7_,....1_4_1+,
1 I 001 14.1 It .. -. ' .-...-- __,.... 1 1 11iT --i ---'' 1 1. l'li1 '
-_- -.....:.,.0.,,, ,..,, ...., I ,,_, .1_4_4j....
1 -r-ri--1-1-7--E 7 I-1111 j1 ii , , I
l'":- ,--1.--I-7-7- I- . -1,--4, -1- _J--1--:---t -r-T----1--- -,---1--, 1l'!It,-, k .,II,.
i ..._ 1 __I _ ,------- , . _ _ . i
i I I
fr_i_:,_.__;___.:......, l_j_,4 ...i. i !-
...;_i____:,._:_i__, _1 ____-____i____,
1 0 2.5 :'.$ .!-C :. 5 40Ctralete'_,I.yo C?A
LSAT ***** a c-4 far .!'-t t41 te1e a .4 . fonettot of CTA./ (per ring lGOni-L:.A.1' AC I, e i : -r ....
. foot ce4-.J c:.res Cot ar,.."...1.44 ...alt...t -c ..,^0.4 .1 V.#1 tebtletwo lawn
1.S
145

Mat $00
LSAT&coos&
200
400
35;)
200
d\Second400
LSAT&cores
200
GOO
$00
e1 et- 400
300
102
3 0 1.5 2.0 2.5 3 5 4.0
Cumulative CA
LSAt ge score. for 2-tire takers aa a function of CPA.
empertne first-LSAT scores for vhites coached at 002 between !ROCS
gatnst first-LSAT scores for uncoached 4hitea.
3.0
!-------1-7- ;-14-1 ! lip- 1
Illim"ri riN°!
.
--I T , .
III ± ; PPP--T-E-i-............111 es--.4
1
'-'wached
. -7 -1 'ill um_1_
_ _.
,addt--002-
:=1111.116
11011
a p
--.
-7--7
.. iilliiiman11_ milmal
lams
.1ili
am.2.52.0 3.5 4 0
Cumulative CPA
LSAT average 000000 tee 2.th.. takers of lametion 41,1 CTA.
0100$0,TIA seeeed-tSA, serves ler whttee teethed at 042 babes.* e
sides% se-con4.13AT fin unceetted whites
1.0 1.5
146
30

MACLSATSu res
700
400
4400
300
200 II -IL;.
"1
,. 1
--T-i--:-- -;----;--1-------' -1- --..
i_
_.._it..._i........_!...1___:_! -
f . 1 I
:-
-;-1-..- -";---- -.1--. 4
orirosaed
Secoul COO
LSATScore.
700
SOO
. W.4
400
200
10 2.5 3S L0Cuesast I ve CPA
svvaEe scores (or 7-tire Ulcers. as function of C/A,
eortartor first-VAT scores for whites couched at 003 between enema
against (fret -LSAT scores for uncloached sisttes
1.5 2.0
LSAT
3 0
1 0 1.5 2.0 2.5 3 S 4.0
Cimltiv. CrA
LSAT Ve101. re... for 1-11.. takers e (unction of CrA,
coortp.6 ecrod-LIAT Zvi,* for white. earthed at 003 between exams
tsInt weeendLSAT steles for uncostl.ed %bits1 6.3
30
147

$OO
LSATStores
700
...1a. A.
'Co
200
Second' P00
LSATScores
100
. 400
200
1 0 1.5 2.0 2.5 30 3$ £0Cumulative CPA
2SAT evetece .toree for 2-ttme tia-ers so function of CPA,
compartnr. firet-1..\T ecores for .4,fte coached at 004 between exams
against fir6t-LSAT scores for vr40ached weatell
I
1-- --1--i '-. : 1'_
1
: _s_
-T.F14-1-11121- --I-1-1 untocf,ed whites
77...
3.0 2.0
Jr.
2.$ 3$ 10Cr*
LSAT average scores Per 2.ttfte tele,. is (unction et C,A,compering ees..J-LT score. for %%Iles coached at 004 between emotegatatt acondASAT scores toe wnteachad %Mine
3 0
148
166 .

rirfa'ISATStores
200
700
NA-
secood
Scores
333
200
00
700
GOO
a400
300
srlf.,H.; 1_ ,
_ .. ....1...1._:- r r!"1" : .
. 4- f,-- ,--.-- ---i-4 I-
1 ;
--1-1-tmc..04.d.whikes
7.wrates in.otber sctssils
F., r.
F-1-77.7.1f 1
i-47,
0 2.5 3 0 3 S 4 C
Cumulative CIA
LSAT Averste scores for 2-time takers as function of CPA,
comporlPt Tf:st-1.;;J scores for +elites coached oL other schools between examsagainst first -LSAT scores for uncoochod whites
7.5 :.0
2.0 3.5 - 2.0 2.5 3.0 3 5 4.0
Cumulative Cr*
67 LSAT ,core, inr 2-tiro takers function ef Crik,
tomn!kring second-1.NA? scar., for whites coached et other schools between sane
egoicet olicon4.1.SAT score. (or hecoached ehites
149

(8) LSAT first and second scor:s for 2-tine rakers coachedbetween exams
This section displays second-LSAT scores as a tqnction of
first-LSAT scores and compares average LSAT scores by coaching
school for coached aLd 61coached students.
All the major coaching schools UK (001), Amity (002),
Sexton's (003), and Evergreen (004) -- appear to benefit pri-
marily students with initially low LSAT scores. The composite
of small schools appears to offer fairly uniform benefits.
The influence, if any, of self-selection is somewhat obscure.
If self-selection were dominant, then we would expect to see
greater gains for higher initial scores for SHK (001), Sexton's
(003) and Evergreen (004). Instead, the average benefits are
larger for lower initial LSAT scoring students. Similarly, the
composite of small schools shows an almost uniform average benefit
while self-selection would imply a greater benefit for lower initial
scoring students. Only the pattern for Amity (002) is consistent
with the theory of self-selection.
This section is an alternative method of demonstrating
score increases for 2-time LSAT takers to the preceding
section. Here the first LSAT score is the independent vari-
able and the second LSAT score is dependent on it. In
the preceding section the GPA is the independent variable
and both LSAT scores are dependent variables.
150
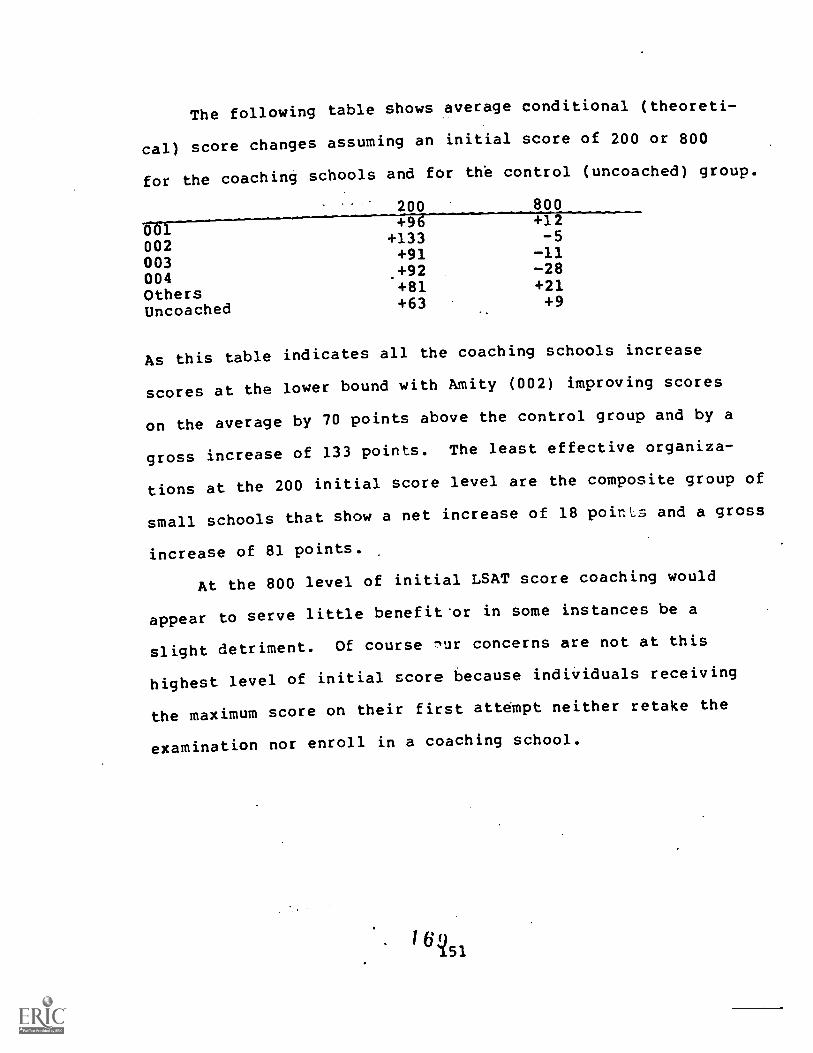
The following table shows average conditional (theoreti-
cal) score changes assuming an initial score of 200 or 800
for the coaching schools and for thb control (uncoached) group.
200 800-49VO16- +12
002 +133 -5
003+91 -11
004 .+92 -28
Others +81 +21
Uncoached +63 +9
As this table indicates all the coaching schools increase
scores at the lower bound with Amity (002) improving scores
on the average by 70 points above the control group and by a
gross increase of 133 points. The least effective organiza-
tions at the 200 initial score level are the composite group of
small schools that show a net increase of 18 points and a gross
increase of 81 points.
At the 800 level of initial LSAT score coaching would
appear to serve little benefit'or in some instances be a
slight detriment. Of course 'ur concerns are not at this
highest level of initial score because individuals receiving
the maximum score on their first attempt neither retake the
examination nor enroll in a coaching school.

Second ,,..ppLSATSeems 1
'MOOLSAT2=LSAT1(.86+ 124
foal
' N=155.11.10
1
1
1
1194.es
sasses
601.01
3
3
I
487.70
101.0011,
331.00
Second8
LSATScores
I
a
e
.. . ......
S.OS
00
2 es 8
.
. .
110.CO )47.30 364.40 41.10 451.10 414.513 S33.30 311.00
LSAT second score. for 2 time takersas fwIctim of first scores for whitescoached at 001 between LSAT eras'
006.40 443.70 ess.io
first LSAT Scores
300 100 700 100
'trot LSAT Sc
LSAT ...... second scours for 2.ttewe tolurr
as fenctlon of fleet scores for white
coached at U01 between ItAT uses'.
Compered with uncoacbed Lit 2.tiews takers1 7 o
152

SecondLSATScores
I.... ..... 000000000lt1.0
LSAT2=LSATL(.77)+ 179
N=94
II
$11.114
511.11
411.4tO
431.10
211.28
1111.110
..
1
1
111
1
1
I
a
11
1
1
1
1
1
1
Second aoo
LSAT
700
400
SOO
400
200
333.43 115.00 131.20 313.40 433.00..
443.40
LSAT second scores for 2-ttoe taker.as function of first core for whitescoached at 002 between LSAT exam.
sir... 100.30 312.0 533.23
large LSAT Scores
' 1
....
.. r 1 1.
-1
I 1.- I
T riEn1111""', i
1 1
-I -Fi1 1 1.........4 i.,_
! l
.1. ..,......,
I L....... / ,i !..1._, I....
; . I I I
I
_,1 I I I '
I
I lelI
. ..,!!...11 LI I i i .
i 1 6,I
.,!
1_ _
,
', ,
_
. : ; 1
-i-1?:.
1
, . . 1
.
.4.1.,_LIZ:vr.
.,....
r1
!.:.:..
,.
,
.
, , WIN.
i NENPActiscLuh
;4._
I ; NM MIREz 1 -1 t Ii __L_t
1
gill+I.---E- Ism.
IlwANI
...
203 3G0 400 SOO
LSAT ge prowl score. for 2-tto taker,
Imoctifet of (trot scot. for whitesteethed et GO: between INAT wee.tempered wth uncosehd wills tebere
1 7 153
Ileac LSAT S
:7

ftee. o ###
Second /aAsLSATS I
"" .LSAT2=LSAT1
$15.111
N=139ma.
1I-II
ItS.ss
1
$211.141
1
1
1
SILOS1
1
1
1
diSr.ss1
1
1
Cu...1
40,0I
111.SI
I
HIM330.05
+ 125( .
421.10
0
412.00
.
4111.5 511.0
a
se
.541.1111
.....
034.0
a
404.50
O.11 01
I
1
1
1
1
1
I
1
1
1
1
1
1
11
1
1
1
11.110
.0.1
oo310.10 MAO
StrandLSATScores
600
700
COO
SOO
£00
300
..
200
LSAT second .,ort for 2 -tine takersasA funct4un of first scores for white.coached at 003 between LSAT
r-
1*-
1 ---1 1 -Ty 1 _
1.
-1 i_ii,:.
.
.
1_ _ _...
7- .
J......... .
:-. _. .. 1
I 1 '
.- _.1...)...1..1
incoachertA4iitias.. ;
-H_I . . i . sum
I- ---1. Elm__!. i Al.go
_ T s/...2. rinir
IIIn
l7--- t;TfitrsiLin
: z.i_ 1
/, I LL 1
i
1 Irmo____
1 1
-+-/ --r- 1 1 1 U1111
IFRan
.1 1
71rnaRIM
E91 ail -1
r.:PS11:1 : .I
200 . 300 400 500 50
LSAT avrss icnd tee 1-ti. taker
ad function of first 00000 for Milts*
leeched at 003 between LSAT vases,
compared with uncosched whits 2.116.4 come.
154
1 1ov
first LSAT Scores
first LSAT S
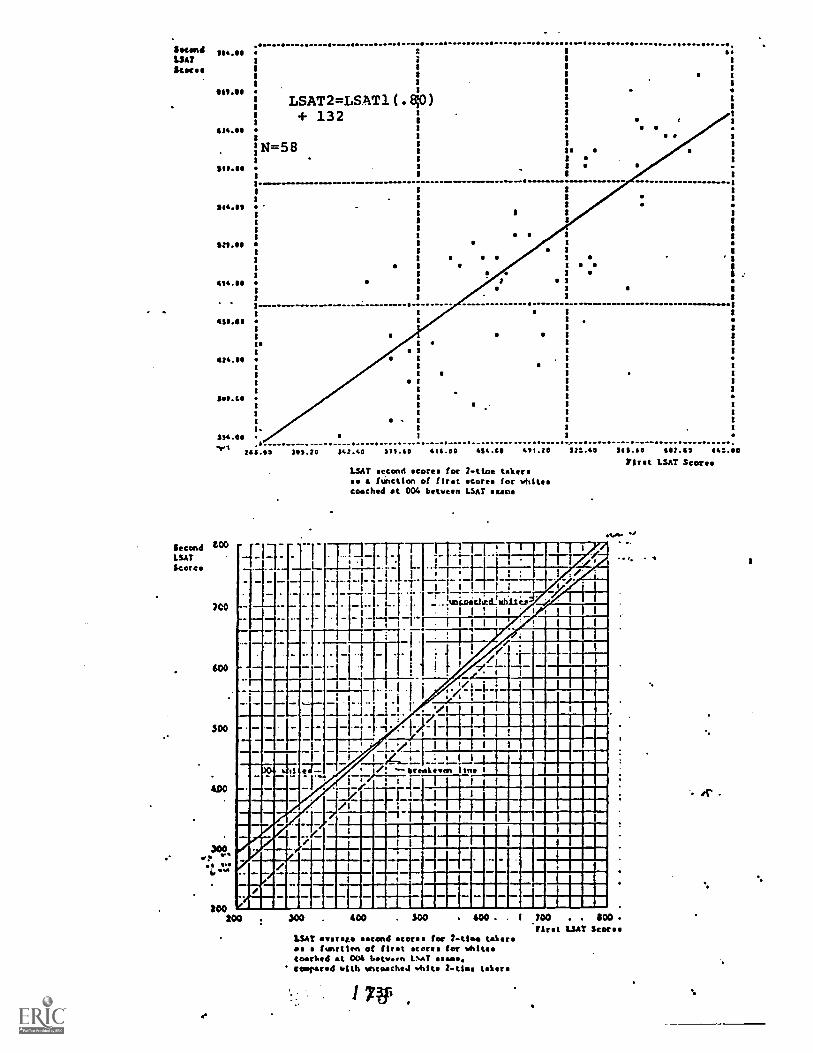
SoundLSATSews,
611.1
I
LSAT2=LSAT1 ( .14o )+ 132
Whet
414.61
I
4111.011
Iv
424.6
321.11
1.
354.01.1
Second "0LSAT&core
'Co
600
SOO
400
200200 300 400 500 IWO TOO 100
First LSAT ScoresLSAT go 'wand o for 2411.6 takersas function of first score. for whitesCoached at 000 btwon LSAT s.a..
' sempArd with wmcoached whit. 2.4i.. takers
-
so
a
o
11.............
r - -
105.25 152.40 371.40 414.50 ASt.CO 411.20 !34.50 345.110 103.51 453 00
Pleat LSAT ScoresLSAT second scores for 2-ttos takersso a function of first scores for whitescoached at 004 b LSAT 'macs
4- 1-..!_i_.. A
I
_LI.-
i7
-r......I
1
1 'IT;I-1-_)'.
!1:1-I_
impschreithiti.i, "'
____
'
_.-7-1-1
. !
aili
i___
1
MT
_il-1I I.
-.1--I
I
, /41111AinA1111111AM
. , 1 1
__i
--T-L.11.1.:
, ___ .
....,
;T:b....--
I
iI
,
' 1
, .1-
111
IIIT: 1
vLd_LI
--1
-1-
,_/_:__,e.,_
1
.,,: 1
"L7,
-TrlinI.
sli =nom_ . ...: .N...:
17 #3a.

SecondLSATScroces
.....................................ells./1
I
1II
III
1 . 1
454.9e LSAT2=LSAT1 ( . 90bt' + 101
: N=45
1
1
1
WAS11
1
1
135.151
11
1
1101 AO1
1
44.11
11
431.:1111
1
511.1S1.1
1
1M% 1
;MoO .. . .. ...
MAIO 117./0 107.04 417.00 40.4
11
1
1
1
11
1
1
1
11
11
1
1
1
1
111
1
1111
070.0 05I.li 010.40 044.00 106.10 12s.00Mist LSAT Scores
ScondLSATScores
v...
LSAT second sccres for 2-tin takersas function of first scores for whitecoached at returning schools between LSAT exams
S.
6120
)00
$00
SOO
too
300
4%.
IL%
200200 300 400 $00 $00 200 SO
met LSAT Seers
_
-r 1 1--r-I-T-1
! il-,-,
.1 1 1
i--f- 1
. .
' 71-..../1. I_:. .1..
--i
....) +. 7;L
.
__Li1 1
..,,ii td xi ..0t1 er.schcol
Iri:'unto
.1.1 5ti.!,; ,-. -Illchod uhrt
1 1 1 ; 1 / MIMII i L I /I !
-
131Er I, 1 1. I . . Z Ti . . WI:tr. 1 v.: *:-1.resteven. line
! 1 ' 1 1 1 IIImg II
....._y
,!: r I , .
. .
_III-
;111141
3, . ; 1 Mifflin"'4RIMRN
71,1--1+ !
II
III!II MIIIII-1111RE 11111111111:11
/SAY second for 2 -[tee takers
as function of first SCOgt0 for Matescoached at other schools between LSAT *silos.
tooested with uncoached vl.ite 2.11.. takers
156
1 74

.There is no one easy generalization that characterizes
the effects of coaching for all the analyses we have dis-
played. Furthermore the analyses exhibited in this document
are only one segment of the.approaches we have undertaken.
As we have already indicated, exploration of the technical
appendices is mandatory for total comprehension although this
docuient can and does stand alone.
The results of our analyses reveal that coaching is
dramatically effective for the SAT. The LSAT, although
susceptible to coaching in a general sense, does show areas
where the effects are marginal. As we have indicted we be-
liev part of the apearent lack of susceptibility of the LSAT
to coaching is related to abnormally large control group in-
creases and the relatively low correlation between GPA and
LSAT scores. Furthermore the lack of consistency of GPA's
both between and within undergraduate universities may be a
contributing factor. Additionally we believe the gross
score increases found when analyzing 2-time LSAT takers
and using the first LSAT as the independent variable may be
applicable to 1-time takers coached before the first LSAT.
This would greatly increase the benefits received from LSAT
coaching. We hope to look into some of these areas in the
studies recommended, infra.
157
175

G. CASE HISTORIES
The case histories that follow are drawn from Technical
Appendix M (Miscellaneous). Appendix M contains relevant data
concerning all individuals who were either coached more than
once or who took, the LSAT more than twice. Technical Appendix
M reflects testing histories of some individuals who have
taken-the LSAT five or more times and those of some individuals
who have enrolled in multiple coaching courses, occasionally
simultaneously.
Technical Appendix M is composed of the testing histories
of those individuals who have probably suffered the greatest
psychological trauma from the law school admission process.
They have in some instances spent over $1000 in application
fees over a three or four year period only to be rejected
by every law school to which they applied.
The probability of acceptance to law school appears to
diminish with the length of time one remains in the "admission
process". Therefore any acceptances to law schools of
individuals whose data appears in Technical Appendix M
are not only surprising but emotionally gratifying.
The case histories that follow all have a portion of
happiness as all the individuals ultimately were admittee to
law school. They all were admitted after they had been
rejected, gone to a coaching course, and increased their LSAT
scores. Our study demonstrates that coaching is responsible
I71158
at least in. part if not in full for the ultimate acceptance of
all these individuals to law school. However, the fact that
these individuals waited until they were into the admission
process to enroll in a coaching course, rather than having
taken a coaching course at the outset, may have caused them
undue anguish and expense. They appear to have enrolled
in a coaching course primarily out of desperation.
The case histories that follow ?erhips articulate better
than any other mode, although in anecdotal form, the persorcl
costs and benefits of coaching.
STUDENT A
Student A, a history major at Bryn Mawr College, with a
GPA of 2.10, took the LSAT in December 1974 receiving a score
of 531, and in February 1975 receiving a score of 565.
Student A applied to New York University Law School, Columbia
University Law School, Fordham Law School, Rutgers Law
School, Brooklyn Law School, Hofstra Law School, and St.
John's Law School, for the class commencing in the fall
of 1975. Student A was rejected by all these law schools.
Student A then enrolled at the Stanley H. Kaplan Edu-
cational Center in New York for the course prior to the July
1975 LSAT. _After being coached Student A took the July 1975
LSAT and received a score of 665.
Student A then applied to Columbia Law School, New York
University Law School, Fordham Law School, Rutgers Law
159
177

School, Brooklyn School, Hofstra Law Schc31, and St.
John's Law School. Student A we's placed on the waiting list'at
Rutgers Law School and was adMitted to bc1-. Brooklyn Law
School and St. John's Law School. Student A registered at St.
John's Law School for the class commencing in the fall of 1976.
STUDENT B
Student B, a major in social work at use University,
with a GPA of 2.27, took the LSAT in July 1973 scoring 518
and in December 1974 f..ng 511. Student B then applied
to Fordham Law School ,r;z: the class enterins in the fall
of 1975 and was rejected.
Student 3 then enrolled in John Sexton's LSAT Preparation
Center prior to the October 1975 LSAT and received a score of
616 on the October 1975 LSAT.
Student B then applied to Fordham Law School, Temple Law
School, American University Law School, and George Washington
University Law School.
Student B was admitted to Fordham, Temple, and American
University Law Schools and enrolled at Fordham Law School
for the class commencing in the fall of 1976.
STUDENT C
Student C, a history major at McGill University, with
no reported GPA, took John Sexton's LSAT Preparation Center
course in New York prior to the July 1975 LSAT but did not
take the LSAT until October 1975. Student C scored a 480 on
160
78

the October 1975 LSAT and a 516 on the February 1976 LSAT.
Student C Aid not apply to any law schools for the class
entering in the fall of 1976.
Student C was coached at the Stanley H. Kaplan Educational
Center in New York prior to the December 1976 LSAT and
received a score of 632 on that exam. Student C then applied
to 18 law schools for admission to the class commencing in the
fall of 1377.
Student C was accepted at Fordham Law School, Syracuse
Law School and at the University of Pittsburgh Law School where
Student C enrolled.
STUDENT D
Student D was a psychology major at the John Jay College
of Criminal Justice with a GPA of 2.88. Student D enrolled in
John Sexton's LSAT Preparation Center course for the December
1975 LSI.T but did not take the LSAT until February 1976.
Student D received a 437 on that exam.
Student D applied to Brooklyn Law School, New York Law
School, New York University Law School, St. John's Law School,
Fordham Law Sc; and Pace University Law School for the
class entering in the fall of 1976. Student D received no
acceptances.
Student D then enrolled simultaneously at John Sexton's
LSAT Preparation Center and the Law Boards Institute prior
to the July 1976 LSAT. Student D scored 581 on the July
161
1 79
1976 SAT. Student D reapplied to New York Law School, St.
John's Law School and Pace Law School. .Student D was admitted
to Pace for the class commencing in the fall of 1977.
STUDENT E
Student E, a political science major at Wellesley College,
with a GPA of 2.82, took the LSAT in October 1974 and December
1974 receiving scores of 402 and 424 respectively. Student E
applied to 8 law schools for admission to the class commencing
in the fall of 1975 and was rejected by all. Two of the
schools where Student E was rejected were Georgetown
University Law School and New York University Law School.
Student E enrolled in John Sexton's LSAT Preparation
Center course prior to the December 1975 LSAT and receivr,d a
score of 503 on the December 1975 LSAT. Student E then applied
to 8 law schools including New York University and again was
rejected by all 8.
Student E enrolled in the Stanley H. Kaplan Educatio.111
Center prior to the October 1976 LSAT. Student E to tit*
December 1976 LSAT and February 1977 LSAT scoring 529 crud 527
respectively. Student E then applied to 13 law schools.
Student E was accepted at Rutgers Law School,
University Law School, and New York University Law School f r
the class commencing in the fall of 1977. Student E
registered at New York University Law School.
162
I 80

STUDENT F
Student F, an english major at Manhattan College, with a
GPA of 3.26, took the LSAT in December 1974 and February 1975
scoring 512 and 518 respectively. Student F then applied to
5 law schools for admission to the class commencing in the
fall of 1975 and received no acceptances.
Student F retook the LSAT in December 1975 receiving a
score of 530 but made no applications to law school f-,r the
class entering in the fall of 1976.
Student F enrolled in John Sexton's LSAT Preparation
Center course prior to the October 1976 LSAT. Student F scored
582 on that exam. Student F then appliel to 5 law schools for
admission to the class commencing in the fall.of 1977 and was
accepted at Pace University Law School.
STUDENT G
Student G, an economics major at Queens College, with a
GPA of 3.18, took the LSAT in April 1975 and scored 536.
Student G applied to St. John's University Law School and
was not accepted.
Student G then enrolled at John Sexton's LSAT
')reparation Center prior to the July 1976 LSAT but did not
tako the exam. Student G next enrolled in the Stanley H.
Kaplaa Educational Center prior, to the December 1976 LSAT
whtct, dent G scored 649. Student G thenapplied
to 8 law scnools ±or the class commencing in the fall of
163

1977. Student G was accepted at 7 of these law schools
and enrolled at St, John's University.
STUDENT H
Student H, a psychology major at Brooklyn College, witha
GPA of 3.54, took the LSAT in December 1974, scoring 496.
Student H applied to three law schools for the class
commencing in the fall of 1975 and received no acceptances.
Student H enrolled in the Stanley H. Kaplan Educational
Center prior to the October 1976 LSAT. Student H scored 621
on the October 1976 LSAT and applied to 8 14w schools.
Student H was rejected by 3 of these schools (Hofstra,
Fordham, and New York University). However Student H was
accepted at Brooklyn Law School, New York Law School, St.
John's University Law Soh(' 1, SUNY at Buffalo Law School and
Rutgers Law School.
Student H registered at Rutgers Law School for classes
commencing in the fall of 1977.
STUDENT I
S4-ulent I, a sociology major at Hofstra University, with
a GPA of 2.99, took the LSAT in December 1974 and February 1975
scoring 514 a.d 424 respectively. Student I applied to 8 law
schools for admission to the class commencing in the fall of
1975 and was rejected by al'. One of these schools was New
York Law School.
164

Student I enrolled in the Stanley H. Kaplan Educational
Ceiiter prior to the July 1975 LSAT. Student I took the July
1975 LSAT scoring 549 and the October 1975 LSAT scoring 590.
Student I applied to 2 law schools for the class
commencing in the fall of 1976.- Student I was accepted at New
York Law School.
STUDENT J
Student J, a philosophy major at Harvard University, with
a GPA of 2.98, took the LSAT in July 1974 and December 1974
receiving scones of 560 and 573 respectively.
Student J applied to 7 law schools (New York University,
University of Pennsylvania, Cornell, Harvard, Fordham,
Georgetown, and University of \_rginia) for the class com-
mencing in the fall of 1975. Student J was rejected at all 7.
Student J enrolled in the Stanley H. Kaplan Educational
:n NPw York prior to the October 1975 LSAT. Student
J sk..t.t.1 618 on that exam.
Student. 3 then applied to 15 law schools for the class
commencing in tie fall of 1976. Student J was placed on two
waiting lists (Fordham a;ld Rutgers) and was accepted at The
Benjamin Cardozo School of Law.
STUDENT 1:
Student K, an economics major at Fordham, with a GPA of
3.15, took the LSAT in December 1974 and February 1975 scoring
482 and 518 respectively. Student K applied to 5 law schools
165
i 8 8

for the class ente,!-: ir the fall of 1975 and was rejected by
all 5 including New York Law School and Seton Hall University
Law School.
Student K enrolled in John Sexton's LSAT Preparation
Center prior to taking the December 1975 LSAT. Student K
scored 569 on that exam.
Student K then proceeded to apply to 4 law schools for
admission to the class commencing in the fall of 1976.
Student K was admitted to two of these schools, New York Law
School and Seton Hall University Law School.
STUDENT L
Student L, a social sciences major at Seton Hall Univers-
ity, with a grade point average of 2.79, took the LSAT in April
1973, December 1974, and February 1975. Student L received
scores of 482, 430, and 429 respectively.
Student L made 6 applications for the law schoc_ class
ertering in the fall of 1975. Student L made 7 applications
for the law school class entering in the fall of 1976. All
13 of these applications were rejected.
Prior to the October 1975 LSAT Student L was coached by
the Law SJnool Admission Test Review Co.Irse (Evergreen).
Mysteriously, Student L did not take the LSAT until December
1976, s,.oring 586. Student L applied tc six law schools
for the crass entering in the fall of 1977 and was accepte
at the Internatione School of Law.
166

STUDENT M
Student M, a business major with a 3.42 GPA at Saint
Bernard College (Alabama), took the LSAT in October 1974 and
December 1974 scoring 239 and 286 respectively.
Student M applied to eleven law schools, including
Deleware Law School, for the class entering in the fall of
1975. Student M was rejected by all these law schools.
Student M znrolled in the Evergreen LSAT Review course
prior to the October 1975 LSAT but did not take the LSAT until
December 1976. Student M scored 477 on the December 1976
LSAT. Student M applied only to Deleware Law School for the
class entering in the fall of 1977 and was accepted.
STUDENT N
Student N, a history major at Indiana University with
3 2.68 GPA, took the LSAT in Decembet 1972 and February 197A
scoring 391 and 444 respectively.
Student N applied to Chicago-Kent Col.,ege of Law, John
Marshall Law School, and Depaul University Law School for
admission to the class commencing in the fall of 1975.
Student N was rejected by all three schools.
Prior to the December 1976 LSAT, Student N was coached at
the Amity Review Course in Chicago. Student N scored 534
on the December 1976 LSAT and applied to 5 law schools for
admission to the class commencing in the fall of 1977.
167
18

Although rejected by Depaul and Chicago-Kent, Student
N was accepted at the John Marshall Law School.
STUDENT 0
Student 0, a political science major at Valparaiso
University (Indiana), with a 3.18 GPA, took the LSAT in October
1975 and December 1976 scoring 474 and 424 respectively.
Student 0 applied to Valparaiso University Law School and
Loyola University Law School of Chicago for the class commenc-
ing in the fall of 1976. Student 0 was rejected by both of
these schools.
Student 0 then enrolled at Test Prep in Chicago prior to
the December 1976 LSAT. Student 0 took the February 1977
LSAT scoring 517.
Student 0, although rejected t Valparaiso University Law
School and John Marshall Law School for the class entering in
the fall of 1977, was accepted at Lewis University Law
School, Loyola University Law School (New Orleans), and
Hemline University School of Law.
STUDENT P
Student P, a psychology major at University of California
at Los Angeles (UCLA), with a GPA of 3.30, took the December
1975 LSAT scoring 591.
Student P applied to UCLA Law School and Harvard Law
School and was not admitted by either, for the class com-
168

mencing in the fall of 1976. Student P then simultaneous-
lienrolled in both the Stanley H. Kaplan Educational Center
and the Amity Review Course in Los Angeles prior to the
December 1976 LSAT.
Student P scored 712 on the December 1976 LSAT and
applied to 10 law schools for admission to the class commenc-
ing in the fall of 1977. Although again rejected at UCLA and
Harvard, Student P was accepted at the University of San Diego
Law School and the University of California at Davis where
Student P enrolled.
STUDENT Q
Student Q, a biology major at UCLA with a GPA of 3.08,
.00k the LSAT in July 1974 and December 1974, scoring 438 and
479 respectively.
Student Q applied to 6 law schools for admission to the
class commencing in the fall of 1975. Student Q was rejected
by all 6 schools.
Student Q enrolled in the Law School Admissior. Test
Review Course (Evergreen) in Los Angeles prior to the October
1975 LSAT. Student Q scored 529 on the October 1975 LSAT.
Student Q then applied to 3 law schools for admission to
the class commencing in the fall of 1976. Although rejected
at Loyola University (Los An,e1,--1, Student Q was accepted at
both Southwestern University Law School, and Whittier Colleg,3
- Beverly School cf Law.
169
8

IX. ACTS AND PRACTICES OF COACHING SCHOOLS
All coaching schools make claims or have made claims
regarding their ability to improve scores on standardized
admission examinations.. Some claims are blatant, others
are subtle. However, they all have the same purpose -- to
convey to the student (or parents of students) that taking
a coaching course will increase an individual's score on an
examination that may well be the mwIt important examination
that person ever takes.
These claims appear in national newspapers of general
circulation, in college and high school newspapers, 66/ in
posters hanging on campus bulletin bo7-rds, in radio advertise-
ments,
mailed
places
in brochures distributed to students and parents,
circulars,
as bowling
in speeches, and in such other diverse
alley score sheets.67/
in
A representative sample of claims made by the coaching
schools, and the coaching school making each claim fo".dows:
thousands have earned increases of a hundred points or
more in their scores 68/
Stanley H. Kaplan Educational Center
66/ See generally, Category III File 772 3000, Vol. 111,
p. 51-61, for a sampling of newspaper advertisements.
67/ ''"egory III File 762 3033, Vol. IV, p.50.
68/ dory III File 762 3033, Vol'. I, p.l.
170
88

most effective course available
the resulting competence and confidence will allow you
to perform at your maximum potential 69/
gtanley H. Kaplan Educational Center
from the reports we have received we have found there
is an average increase of 50 to 100 points for testrepeaters 70/
Stanley H. Kaplan Educational Center
...achieved such dramatic results that many nationalmagazines have written articles about our success 71/
Stanley H. Kaplan Educational Center
we teach twice as many students as any other course in
the metropolitan New Yorkt,ew Jersey area 72/
John Sexton's LSAT Preparation Center
The LSAT Preparation Center is the only institutiondevoting its attention exclusively to the LSAT.73/
John Sexton's LSAT Preparation Center
the scores of many of our students have jumped 250 points
or more 74/
John Sexton's LSAT Preparation Center
69/ Category III File 762 3033, Vol. I, p.9.
70/ Category III File 762 3033, Vol. I of Investigational
Hearing Exhibits, Exhibit 5. This statement was made
in a speech by a representative of the Stanley H. Kaplan
Educational Centers, Ltd. to the Black American Law
Students Association of George Washington University.
71/ Category III File 762 3033, Vol. IV, p.42.
72/ Category III File 772 3000, Vol. XV, p. 21.
73/ Category III File 772 3000, John Sexton Physical
Exhibit C, p.4,
74/ Id. at 12.
171
189

the average score of its students greatly exceeds thenational. median 75/
John Sexton's LSAT Preparation Center
the average score of our students is one-third higherthan the national average 76/
John Sexton's LSAT Preparation Center
the median increase for our students who have previousscores is over 100 points 77/
John Sexton's LSAT Preparation Center
no other course can demonstrate better results thanours 78/
Evergreen LSAT Review Course
thousands of successful students prove we significantlyincrease scores 79/
Evergreen LSAT Review Course
since 1968 we've hei NI over 10,000 students gain admis-sion to law schoo.1
.rgreen LSAT Review Course
October LSAT average for those taking the course was630 81/
LSAT Review Course of Massachusetts
75/ Id. at 13.
76/ Id.
T7/ Id.
78/ Category III File 772 3000, Vol. XLIX, p.131.
79/ Id. at 132.
80/ Id. at 134.
81/ Category III File 772 3000, Vol. LIII, p.37.
172; 1) 0


114.1Gam
2 8 2.5
12.2
LMr
120
118
1.25 11111.4 1111-11.-
MICflOCOPY VA ioN I AR

Follow-ups show that our average student increases his
LSAT score over 80 points with some achieving a nearly
200 point increase, demonstrating the course's capacity
for enabling you to maximize your score within your
ability 82/
Law Board Review Course
...it will add crucial points to your test scoresTHE POINTS THAT MAY WELL GET YOU OVER THE THRESHOLD
OF SUCCESS 83/
Columbia Test Preparation Institute
the average increase of students who take our course is
80 points with some improving as much as 150 points 84/
Rutgers Review Course
...if an average improvement of 30 points results mere-
ly from having taken the test before, a still greater
score advantage would be expected to follow an effe::tive
instructional program... 85/
Amity LSAT Review
...the LSAT METHOD can help you make your first LSAT
score your best score.86/
LSAT Method
the Seminar equips the
taking skills essentialthe LSAT 87/
law school candidate test
for maximizing performance on
States ReviewWestern
82/ Category III File 772 3000, Vol. XXVII, p.115.
83/ Category III File 772 3000, Vol. XLVI, p.317.
84/ Category III File 772 3000, Vol. XXVI, p.16.
85/ Category TII File 772 3000, Vol. XXXII, p.117.
86/ Category III File 772 3000, Vol. LIV, p.42.
87/ Category III File 772 3000, Vol. XXXIV, p.99.
173

Even if the coaching schools made no advertising claims
their corporate names are implicit if not-explicit representa-
tions that they serve some affirmative benefit in preparation
for standardized admission examinations.
The use of the words "coach", "cram", "review", "educate",
"prepare', and words of similar import convey to the person
perceiving them that test takers will achieve some affirmative
benefit by attending the course. Thi.s is corroborated by con-
sumer testimony, the testimony of coaching school proprietors,
and the perceptions of guidance counsellors and educators.
The coaching schools' claims are not limited to effective-
ness in raising scores. The schools claim to have superior
curricula, 88/ small class sizes, 89/ experienced faculty whr
have scored high on standardized examinations, 90/ and exten-
sive classroom and homework materials that are continuously
updated to match the most recent standardized examinations.91/
These claims are of course all ancillary to the claim of
effectiveness in increasing score.
88/ Category III File 772 3000, Vol. XLIX, p.131.
89/ Category III File 772 3000, Vol. XXXII, p.99.
90/ Category III File 772 3000,Exhibit-C, p.8, 16-17.
John Sexton Physical
91/ Category III File 762 3033, Vol. I, p.l.
174