1 why do denial of service attacks reduce future visits? avi goldfarb university of toronto june 2,...
TRANSCRIPT

1
Why do denial of service attacks reduce future visits?
Avi Goldfarb
University of Toronto
June 2, 2005
Switching costs vs. changing preferences

2
Denial of Service (DoS) Attacks
On February 7, 2000, a hacker named ‘mafiaboy’ shut down the Yahoo website for 3 hours in the first of a wave of DoS attacks.
February 8, 2000: Amazon, Buy.com, CNN.com, EBay
February 9, 2000: E*Trade, ZDNet
Since then, dozens of other cases.

3
Effect of DoS Attacks• DoS attacks had a lasting impact as well as a short-
run impact• I show that these attacks had an impact on user
behavior to all websites except E*Trade.• I examine the cause of the lasting impact
– Do users like the attacked website less?– Or do users become locked-in to competing websites?
• The results help understand the impact of a website shutdown on user behavior.– How costly are DoS attacks in the long run?– Why?

4
Structure of the Talk
1. DoS Attacks2. Data 3. The overall effect
-identification and magnitude4. Switching costs vs. changing preferences
-identification and results5. Caveats6. Managerial implications and conclusions

5
Denial of Service (DoS) Attacks
• Defined as an attack to suspend the availability of a service.
• Typically, attackers make websites inaccessible by overloading servers with requests for information (called “Distributed DoS”).
• Has happened frequently since February 2000, most notably Microsoft (MSN, Expedia, Carpoint) in January 2001.
• Now sometimes used for blackmail (e.g. Gambling websites during the Superbowl)

6
Immediate Impact
Attack Timing Estimated Immediate Impact
(visits lost)
Yahoo Mon. Feb. 7: 1:20–4:20 PM 2,221,350
CNN Tues. Feb. 8: 7:00–8:50 PM 653,338
Amazon Tues. Feb. 8: 8:00–9:00 PM 522,671
EBay Tues. Feb. 8: 6:20–7:50 PM 326,669
ZDNet Wed. Feb. 9: 6:45–9:45 AM 179,668
Buy.com Tues. Feb. 8: 1:50–4:50 PM 32,667
E*Trade Wed. Feb. 9: 8:00–9:30 AM 19,600

7
Data
• The raw data set (from Plurimus Corp.) consists of every website visited by 2651 households from December 27, 1999 to March 31, 2000.
• A total of 3,228,595 observations– An average of 1217 per household
• Exact timing of attacks in CNET• Data for Yahoo is especially rich, so I
will emphasize the Yahoo results.

8
General Method• The data provide a natural experiment for testing the
effects of exogenous website shutdowns.• There is a Treatment Group that was online during the
attack and a Control Group that was not. – The impact is the difference between these groups.
– The treatment group is defined by the probability of visiting the attacked website during the attack.
• Regressions test whether the treatment group behaved differently after the attack than the control group.
• Difference-in-Difference identification

9
The Effect on Yahoo’s Share
0
10
20
30
40
50
60
5th week
before
4th week
before
3rd week
before
2nd week
before
week
before
week after 2nd week
after
3rd week
after
4th week
after
5th week
after
6th week
after
7th week
after
Mar
ket
Sh
are
(%
)
Yahoo share Rival share all others
DoS Attack
Against Yahoo
10
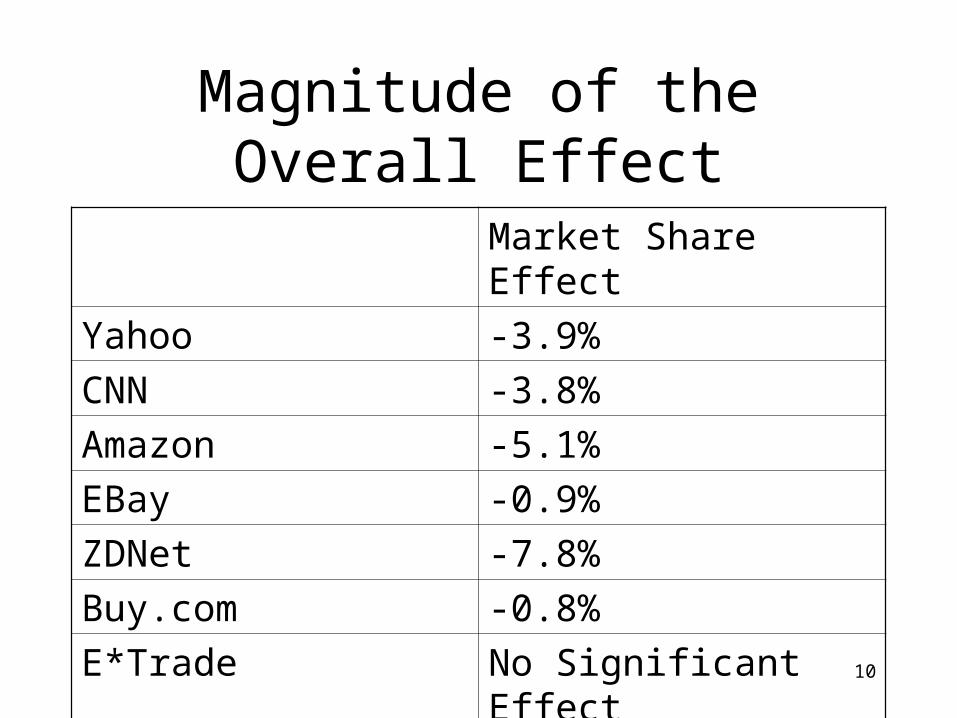
Magnitude of the Overall Effect
Market Share Effect
Yahoo -3.9%
CNN -3.8%
Amazon -5.1%
EBay -0.9%
ZDNet -7.8%
Buy.com -0.8%
E*Trade No Significant Effect

11
Yahoo-Overall CoefficientsProbit
Variable Coefficient
Treatment group & After the attack -0.0977 **
Days since attack × (Treatment & After) 1.07E-03 **
Treatment group -0.0685 **
After the attack 0.0276 **
# Media Mentions over past 15 days 1.95E-03 *
Choose last time 1.1384 **
Log(bytes uploaded on last visit to attacked site) -0.0296 **
Days since attack -2.78E-04
Day 7.00E-06
Constant (Mean) -1.0666 **
Constant (Standard Deviation) 0.5428 **
Observations 855,370
Simulated lost visits 6,250,021

12
WHY DO TEMPORARY WEBSITE SHUTDOWNS REDUCE FUTURE
VISITS?
Switching costs vs. changing preferences
13
Online Switching Costs
• Considerable disagreement about existence of switching costs online– Economics tradition says no—Shapiro & Varian
(1999), Gandal (2001), & Porter (2001) say none—the competition is just a click away
– Marketing tradition says yes—customers show state dependence in most categories. Johnson, Bellman, & Lohse (2003) label this “cognitive switching costs” in the online context

14
Identification of switching costs as different from overall opinion
• This method identifies (short-run) switching costs that accrue to the website visited instead of the attacked website during the attack.
• Switching costs will accrue only to the website visited as an alternative to the attacked website. – i.e. suppose a user tries to visit Yahoo and cannot due
to the DoS attack. Instead, the user visits MSN. – If the reduction in Yahoo visits is due to switching
costs, only MSN will benefit. Other portals such as Altavista will not.
– If the reduction is due to a decreased perception of Yahoo’s quality, then MSN and Altavista will benefit proportionally to the user’s previous preferences

15
The Effect on Yahoo’s Share
0
10
20
30
40
50
60
5th week
before
4th week
before
3rd week
before
2nd week
before
week
before
week after 2nd week
after
3rd week
after
4th week
after
5th week
after
6th week
after
7th week
after
Mar
ket
Sh
are
(%
)
Yahoo share Rival share all others
DoS Attack
Against Yahoo

16
Magnitudes of Switching Costs and Changing Preferences
Overall Effect on Rival (visits)
Switching Costs
Yahoo 4,929,643 2,251,988
CNN 390,435 No Significant Effect
Amazon 406,768 65,312

17
Yahoo-Switching Cost CoefficientsProbit
Variable Coefficient
Treatment group & After the attack 0.1823**
Days since attack × (Treatment & After) -0.0140**
Treatment group 0.1386*
After the attack -0.0192+
Choose last time 0.8267**
Log(bytes uploaded on last visit to attacked site) 6.35E-03*
Days since attack 7.06E-04*
Day -3.00E-07
Constant (Mean) -0.4429**
Constant (Standard Deviation) 0.4981**
Observations 221,842
Simulated lost visits 2,251,988

18
Caveats• I evaluate short-run switching costs to the website visited
instead of the attacked website. – This is a distinct concept from long-run switching costs and
loyalty that accrue over a long time and involve deep relationships.
– There may also be a reduction in switching costs at the attacked website. I do not measure these.
• Household-level not individual-level data (should bias effects toward zero).
• I do not actually observe a perception of reduced quality. I only observe that the utility measure of the website is lower relative to all other websites in the category.
• Each DoS attack lasted less than 4 hours.– I cannot understand the impact of a long-term shutdown

19
Segmentation (overall effect)Yahoo
HIGH LOW
Time Online -0.0343** -0.0388**
Email/Chat Use -0.0185+ -0.0702**
Ecommerce Use -0.0685** -0.0184+
YES NO
Yahoo Mail Users -0.0130* -0.0493**

20
Segmentation (switching costs)Yahoo
HIGH LOW
Time Online 0.0433* 0.1152**
Email/Chat Use 0.0583** 0.1139**
Ecommerce Use 0.0893** 0.0510**
YES NO
Yahoo Mail Users 1.64E-03+ 0.1040*

21
Conclusions
• DoS Attacks Matter. They cost Yahoo millions of visits– (Estimated total cost $338,854)
• Both an immediate and a lasting effect
• Lasting effect has two causes– Changing preferences– Switching costs
• Sources not clear: learning, state dependence, etc.