1 · web viewthe filter element was monitored by a diaphragm-type differential pressure (dp) gauge...
TRANSCRIPT
Fabrication and Modification of A Pilot-Scale Continuous Flow Reactor for
Hydrothermal Liquefaction of Wet Biomass
Feng Cheng, Travis De-Loux, Brian Treftz, Juanita Miller, Scott Woolf, Jiuling Yu,
Umakanta Jena, Catherine E. Brewer*
Department of Chemical and Materials Engineering, New Mexico State University, P.O.
Box 30001 MSC 3805, Las Cruces, NM 88003, USA.
* Corresponding author. Tel.: +1 575 646 8637; fax: +1 575 646 7706.
E-mail: [email protected]
Highlights
A pilot-scale continuous flow reactor (CFR) was modified to process wet biomass.
A high-temperature high-pressure self-cleaning filtration system was designed.
Flow and heat characteristics were described in the continuous flow reactor.
Wastewater-feed algae was converted into energy-rich product.
Abstract
Currently, hydrothermal liquefaction (HTL) of wet biomass for biofuel production shows
significant advantages over other thermos-conversion techniques, owing to higher
productivity and quality of biocrude oil, no need of feedstock dewatering, and higher
adaptability to the existing infrastructure of petroleum refinery. In this study, a novel
pilot-scale continuous flow reactor (CFR) was designed and created for HTL of a
biomass slurry under subcritical conditions in water tTo investigate the feasibility of
scaling up the of HTL reaction. The CFR used , in this study, a pilot-scale continuous
flow reactor (CFR) was built up and modified for HTL of biomass slurry under water
subcritical conditions. aAn innovative and novel dual high-pressure filters system was
introduced in this CFR system, with the functions of HTL solids removal and self-
refreshing. Commissioning work was carried out to address the potential problems of
particle settling and clogging with pumping and running a 2-5 wt.% wastewater treatment
(WWT) algae slurry in the CFR system under milder conditions (≤165 °C). According to
the result of residence time distribution of CFR system, the discrepancy between the
mean residue time and the theoretical time was lower than 1%. The performance of the
CFR system was evaluated byvia steadily running 8.3 gallons WWT algae slurry with a
the solids loading of 3-5 wt.% under 325-350 °C and 17 MPa., and Nno pumping or
clogging issue was observed. The yields of carbon and nitrogen in HTL liquid
(containing aqueous and oily phases) reached up to 39 wt.% and 57.3 wt.%, respectively.
Keywords: Hydrothermal Liquefaction; Continuous Flow Reactor; High-Pressure Filter;
Wastewater Treatment; Microalgae
1 Introduction
As industrial development accelerates global warming and the reservoirs of primary
energies are being depleted, renewable energy resources have been regarded as one of the
most promising alternatives to variety of fossil-based energies (e.g. gasoline, diesel oil
[1], jet fuel [2], etc.). The superiorities of biomass-based energy over other sustainable
forms could be primarily attributed to the abundance of biomass waste and easy drop-in
nature of biofuels into the existing infrastructure.
Hydrothermal liquefaction (HTL) is an energetically favorable thermochemical
conversion over other technologies [3], because the HTL process does not require
feedstock drying [4] and is able to convert most of the biomass components into bio-
crude oil [5]. HTL reactions are catalyzed by H+ or OH- ions [4-6] derived from water
molecules under the subcritical conditions (temperatures of 180-370 °C and pressures of
5-21 MPa). When approaching its critical point, water possesses both liquid- and gas-like
properties, with lower density and increasedyet better ability for mass transfer abilities.
The lower dielectric constant of water at high temperature is conducive to dissolving
more organic molecules derived from biomass and facilitating HTL reactions. HTL
involves hydrolysis, dehydration, decarboxylation, repolymerization, and deamination [4,
7], breaking bio-molecules from lipids (e.g. ω-3 fatty acids), proteins, and carbohydrates
[8, 9] into smaller organics to form bio-crude oil, aqueous, char, or gaseous phases. The
yields of bio-crude oil range from 30 to 60 wt.%, with the energy recoveries of 50-70 %.
Greenhouse gas emissions are less and the energy return on investment is better for HTL
[10], especially for bio-jet fuel production [11].
Most studies have focused on algal HTL in bench-scale batch reactors (4-2000 mL) [12,
13]. Semi-continuous tubular flow reactors [14-16] have been developed for continuous
bio-crude oil production. For both systems, the reactors require pre-loading of the algal
feedstock and need a long period for heating; this creates challenges for defining the
reaction time and achieving high heating rates.
To improve the throughput rate for HTL and thus enhance the market competitiveness of
HTL bio-crude oil [17], a few continuous HTL reactors have been developed [18] around
the world since the 1980s: at Lawrence Berkeley Laboratory [19], Albany Biomass
Liquefaction Experimental Facility [20], University of Illinois [21], Shell Research
Amsterdam [22], Shinshu University [23], Karlsruhe Institute of Technology [24],
University of Sydney [17], and Pacific Northwest National Laboratory (PNNL) [25]). If a
continuous reactor is operated, the oily components in the HTL product do not need to be
recovered by organic solvents [25]; this is advantageous because bio-crude oil quality
may be jeopardized by introducing undesired hetero-compounds soluble in the solvent
[26, 27]. Various continuous HTL reactors, e.g. continuous stirred-tank [28-31] and coil
reactors [17, 32, 33], have been reported. The stirred-tank reactor has the drawback that a
certain amount of non-completely reacted biomass and intermediates are produced with
the HTL product, and these hamper the quality of bio-crude oil.
To achieve higher heating rates and appropriate residence times, which are beneficial for
bio-crude oil production [32], the more economically feasible and chemically
controllable continuous processes, including plug-flow tubular reactor [25, 34], have
been reported recently (Suesse et al. [35], Hammerschmidt et al. [24] and Patel et al.
[36]). However, the HTL liquid product was mixed with char and unreacted algae
particles, implying that post-treatment of HTL product (e.g. solids removal) is needed.
Some other continuous plug-flow tubular reactors have been built in which a cylinder
filter was used to remove char, leading to longer operating periods (Elliott et al. [29, 30]
and Mørup et al. [37]).
Due to pump clogging [18, 28] and undersized filters, continuous operation is still
challenging. To solve these problems, researchers at PNNL recently commissioned a
novel continuous modular HTL system [38]. This system adopted a filter-settler vessel
with a blowdown receiver and oil/aqueous separator such that bio-crude oil can be
produced continuously. Notwithstanding, the system pressure will be disturbed to some
extent by filter cleaning due to no back-up filtration system.
In this study, a novel pilot-scale continuous plug-flow reactor was fabricated, in which a
double cylinder filtration system with blowdown pots and a high-pressure gas booster
was used to achieve in-situ filter cleaning under full HTL temperature and pressure
without interrupting system operations. The filtration capability was examined in terms of
clogging/leaking during processing of algae slurry under the desired conditions. The
presence of abundant heteroatom-containing compounds and ash in the wastewater algae
meant that the selection of the shapes and sizes of the fittings and tubing, and the
positions of pressure gauges and rupture discs, were essential factors for mitigating
clogging problems and maintaining steady system pressure. Technical feasibility of
continuous HTL of high-ash algae slurry with the target solids loading in this novel CFR
system was demonstrated. The final goal of this study is was to evaluate and improve the
capability of handling and processing solid-containing biomass slurry in the CFR system.
This study will deepen the understanding of HTL mechanisms in a CFR system, lay a
foundation for scaling-up continuous HTL reactor systems, and provide valuable
experimental evidence to researchers working on continuous high-pressure biomass
reactor systems.
2 Fluid mechanism of slurry in the pipe
The CFR’s configuration was determined, in order to best reduce clogging, by
usingBased on fundamental knowledge of fluid flow patterns, terminal velocity, and
residence time distributions of slurry flow in a pipe/reacting system, the likelihood of
clogging can be reduced via appropriate selection of CFR configuration. The biomass
algae slurry in this study, had small organic particles (2-80 µm), a slow flow rate (<1
m/s), and vertical tubing with inner diameters (I.D.) of 1-8 mm. It was also run under
subcritical (water) conditions. A general fluid mechanism needed to be determined, asIn
most studies on slurry flow have, large inorganic particles (> 0.1 mm [39]) , were present
in the flow at a high flow rate (>1.5 m/s [40]), in a horizontal pipe tubing with a diameter
of 2-5.5 cm [41] and were ran under atmospheric conditions.. Most of these cases were
studied by a relatively efficient Euler-Euler multiphase model: the mixture model. In
contrast, the biomass slurry in this study contained much smaller organic particles (2-80
µm), and was pumped into the system at lower flow rates (< 1 m/s) in the tubing with
inner diameters (I.D.) of 1-8 mm under subcritical (water) conditions. Thus, little direct
information is available about the flow characteristics of the algae slurry here, however, a
general fluid mechanism could be reasonably speculated to address the effects of particle
characteristics and tube shape on the slurry flow pattern (e.g. velocity and concentration
profiles), heat transfer in the tube, and hydraulic pressure drop throughout the CFR
system.
The asymmetric nature of solid velocity profiles in the tube can be depicted as higher
velocity in the upper half relative to the lower half, due to higher solid concentration and
shear force in the lower half. This indicates a greater need of energy to drive the particles
in the lower half. Alternatively, the asymmetric nature of the solid concentration profiles
can be described as there being lower solids concentration in the upper half of the tube
relative to the lower half, with a coarser, particle-rich sliding bed regime in the lower part
of the tube due to gravity [42]. Velocity profiles are influenced by particle density [43],
particle size [44], particle velocity, solid concentration [45], and the distance from the
tube wall. The asymmetry of the velocity profile decreases at a higher flow rate [46],
assince lower flow rates lead to decreases in turbulence and eddeddyingy, causing solid
sedimentation. At the region near the tube wall, with a thin and flat settled bed, a higher
velocity contributes to the intact “streaky” structure of flow as that in a single-phase flow.
By comparison, a low velocity deteriorates the typical streaky flow structure at the region
near the wall, and a thick and well-packed bed is formed [47]. In addition, the asymmetry
of the velocity profile decreases (that is, the position of maximum velocity moves toward
the upper half of tube) at smaller particle sizes and lower solids concentration, because of
the effects of gravity and viscous shear stress (the interference among particles) in several
different boundaries (the turbulent boundary and the non-slip wall boundary) [43]. The
asymmetry of the velocity profile is sensitive to the solid concentration for coarser
particles.
For slurry flow in a vertical tube, few studies have been conducted. Sumner et al. [48]
found that if the solid concentration is lower than 40 vol.% and the particle size is smaller
than 500 µm, the profiles of solid concentration are basically consistent throughout the
entire tube. Therefore Herein this study, with solids concentration of algae is up toof
10%, and algae particles betweenare 2-80 µm, . Therefore, the slurry flow mechanism in
the vertical tube was assumed to be negligible relative to that in a horizontal tube.
For slurry flow in a tube bend, the asymmetry of the velocity profile is lower in the
downstream of the bend than that of a typical profile in a horizontal tube, owing to the
strong turbulence effect of fluid at the bending point [49]. A certain length of tubing
following the bend is required to reshape the velocity profile to the typical pattern (the
ratio of tube length to tube diameter in the fully-developed flow should be ≥50 [50]). A
similar change of velocity profile is also observed at the tee of a horizontal tube with a
vertical branch, and a higher solids concentration was found in the blank zone of the tee-
junction [51]. The abrasion in a tube bend (e.g. an elbow) cannot be ignored for
engineering. Zhang et al. [52] found that the most serious erosive point is at an elbow atis
about 40° because ofdue to the direct hit from particles flowing through the tube. The
abrasion point moves deeper as the flow velocity increases and the bend orientation
changes due to the force of gravity force. Thus, the latter half of the elbow suffers milder
friction than the former earlier half. A similar result was obtained in a U-shaped bend and
the blank zone of a tee-junction [51].

Pressure drop is an important parameter for the flow pattern. According to the Darcy-
Weisbach equation of pressure drop (Eq. 1) [53], larger pipe diameters (the larger cross-
section area) lead to lower pressure drop in the pipeline, and lower energy consumption
for the feed pump.
∆ PL
=8 ρQ2 fπ2 D5 (1)
where ρ is the density of the fluid in kg/m3; Q is the volumetric flow rate in m3/s; f is the
Darcy friction factor; L is the length of the pipe in m; and D is the hydraulic diameter of
the pipe in m.
Pressure drop is impacted by different factors, such as flow velocity [54], solids
concentration [43], and particle size [55]. Lower flow rates decrease the pressure drop
until the flow velocity is lower than the critical deposition velocity [50] at which particle
settling could occur.
Particle settling of algae HTL in a CFR, could lead to a higher pressure drop due to the
smaller cross-sectional area and more friction lossesWhen running algae HTL in a CFR
system, particle settling would lead to a smaller cross-sectional area and more friction
losses, so that the pressure drop would increase. Pressure drop is impacted by different
factors, such as flow velocity [54], solids concentration [43], and particle size [55].
Lower flow rate decreases the pressure drop until the flow velocity is lower than a critical
deposition velocity [50]. , because too-low flow velocity facilitates the formation of a
stationary bed of solid particles [39], resulting in smaller cross-section area of tubing, and
subsequently higher pressure drop.
At higher flow velocities, pressure drop is more sensitive to solids concentration. At low
flow rate and high solids concentration, the pressure drop iwas more seriously influenced
more by finer particles. [43], due to the effect of particle angularity on the inter-particle
and wall-particle interactions, and the ratio of particle diameter to the viscous sub-layer
thickness [43]. Higher pressure drop for finer particles was attributed to a greater friction
loss in suspension and from the wall-particle interaction [56]. Therefore, the energy
provided for transferring finer particles needs to be compensated by additional power
[43]. While, pressurePressure drop is rarely affected by particle size at relatively low
solids concentrations, since the contribution of particle texture to fluid friction is
neglnegligibleectable [56].
Tubing with a Ssmaller diameter tubing was chosen in this study , so that, with a given
volumetric flow rate a higher velocity could be achieved. A , higher velocity improves
turbulence, therefore reducing and eddy formation to avoid particulate deposition.
Avoidance of clogging limited the minimum tubing size, resulting in tubing selection
with I.D. of 2.11, 3.18, 5.08, and 7.87 mm. Larger tubing was used before the dual filter
system due to the presence of HTL solids. Also, smoother curves, rather than sharp 90-
degree bendselbows, were selected to for all bending points to mitigatealleviate clogging
from occurring.
.
The terminal velocity of flow in the tubing can be measured according to Newton’s law.
Consider the influences of gravity force, drag force, and buoyancy force of particles, a
force balance is reached with a terminal velocity of flow (below which the particle start
to settle), as shown below [57]:
W =FB+FD (2)
where W represents the particle weight, FB and FD represent the buoyancy force and the
drag force, respectively, acting on the particle. Assuming anSuppose algae particle as a
smooth sphere, the specific terms for the above three forces are expressed as below:
W =π6
ρp gd3 (3)
FB=π6
ρw gd3 (4)
FD=12
CD ρw v2 π4
d2 (5)
where ρp is the particle density, ρw the fluid density, g the gravitational acceleration, d the
particle diameter, CD the drag coefficient, equal to 0.445 when Re ranges from 750 to
350,000, and v the terminal velocity.
It was necessary to study the residence time distribution (RTD) tTo define the residence
time of reactant in the CFR system more accurately, it was necessary to study the
residence time distribution (RTD) using the appropriate method.determine how long the
reactant is in the reactor. Unlike the uniform residence time in the batch reactor, the
residence time of flow in the continuous reactor was defined via experimentally setting
up a RTD function curve [58] and plotting the normalized distribution function E(Θ)
against the relative time Θ [59]. To measure the RTD in a subcritical-water system, Kruse
et al. [59] suggested that 1) the tracer substances should be injected appropriately without
heating, 2) the view cell should be equipped with a powerful heating system, 3) stable
aromatic compounds should be used as the tracer substance, and 4) the spectrum should
be measured using a UV-VIS spectrometer. To extract a RTD function from the
experimental data, the convolution integral was required. Because of the mathematical
complexity, an analytical method was used to simplify this problem. Time domain
analysis and frequency domain analysis were two primary options. Convolution in the
time domain was preferable for the RTD extraction due to higher data dependability [60].
In time domain analysis, the flow model was assumed with fixing the shape of RTD
curve. Meanwhile, the mean residence time τ and the diffusion situation of an ideal tracer
peak due to dispersion σ2 should be included in the flow model. To obtain more reliable
RTD data from a continuous system by time domain analysis, the Plug Flow with
Dispersion model at large values was adopted [61].
To measure the residence time of the flow in the CFR system more accurately and easily,
Aa residence time distribution (RTD) should be characterized and compared to the
theory/ideal space time, τ, which could be estimated by the following equation.
τ=VF (6)
where V is the inner volume of the reactor in mL, and F is the volumetric flow rate in
mL/min. Phenol was chosen as the tracer in this study with the suggestions of Kruse et al.
In addition, the RTD function curve was plotted and then normalized. The real residence
time was defined as the RTD of the flow in the PFR system at a desired reaction
temperature. However, Ssince the temperature profile inside the PFR was non-uniform,
however, it was challenging to experimentally measure the RTD of flow at the individual

zone of the PFR under the uniform reaction condition. Thus, in this study, a simplified
RTD of flow was calculated according to the total volume of PFR.
3 Materials and methods
A pilot-scale CFR system was built and modified as shown in Figure 1. A dual high-
pressure filter system combined with blowdown pots and a high-pressure gas booster
were adopted (in Figure 2). A thermophilic microalgaeA thermophilic microalga (G.
sulphuraria), and an algae polyculture, grown at a wastewater pilot plant at the municipal
wastewater plant (Las Cruces, NM) were harvested, centrifuged, and processed in the
CFR system. Flow/pressure stability, clogging/solids removal, and product yields were
tested under the operating conditions.
Tests of system performance under subcritical conditions included flow/pressure stability,
clogging/solids removal, and product yields.
3.1 Configuration of CFR system
This CFR system contained five four primary components: (1) supply system, (2)
reacting system, (3) separating system, (4) letdown system, and (5) auxiliary system,
which were are described individually in the following sections. As shown in Figure 1,
algae slurry entered the CFR system from a stirred tank, went past a cylinder filter, and
reached a metering pump, which supplied a stable high-pressure flow. The slurry was
heated by a preheater, followed by enteringthen entered up a vertical plug-flow reactor
upwards. After exiting from the reactor top, HTL products entered one of the high-
pressure filters. The solid residues were filteredtrated from the liquid product by the filter
elements and collected by the blowdown pots underneath the filter vessels during filter
cycling. The solids-free product came out of the filter vessel, went through a cooler, and
then a back-pressure regulator to reduce the temperature and pressure of the product flow
back to the ambient levels. Finally, the solids-free oil/aqueous mixture was collected in a
flat-bottom product drum, and while the gaseous product was vented through an air
filter. All of instruments used in the CFR system were depicted in Table S2 in terms of
materials, sizes, and other specifications.
3.1.1 Supply system
The supply system consisted of a feed tank with an agitator, a cylinder filter with athe
pore size of 841 µm, and a metering pump, as show in Figure 3. To avoid algal residues
remaining in the feed tank, a 30-gallon cone bottom tank was used. A C-clamp mount
agitator was installed above the feed tank to help to generate a uniform biomass slurry.
As shown in Figure 3, Tthe cylinder filter was used to remove most of inorganic
particles (e.g. silica stone, clay soil, and dead bugs) from the slurry , thereby andto
alleviate blocking in the thin downstream thin tubing. When the filter was clogged, the
pass-by valve would be opened, and the filter element could be cleaned in-situ without
disturbing pumping feedstock. The slurry would then go to After the filter, the algal
slurry was pumped to the CFR with high pressure. tThe metering pump was able towhich
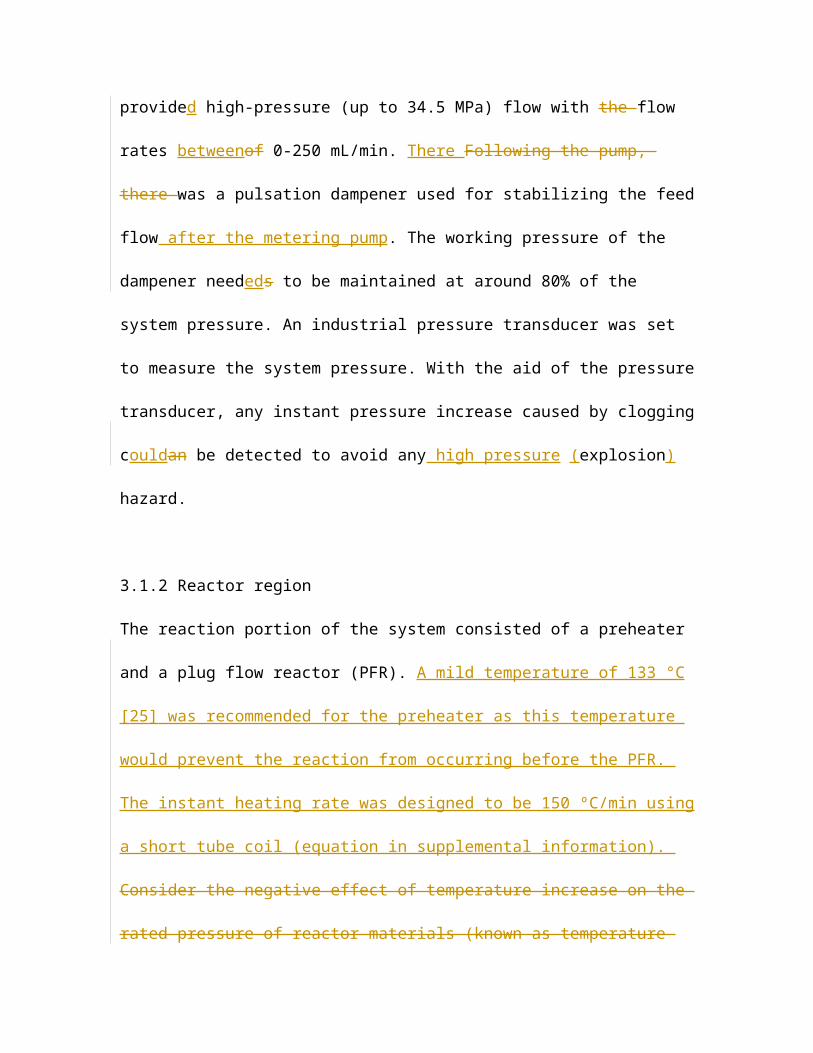
provided high-pressure (up to 34.5 MPa) flow with the flow rates betweenof 0-250
mL/min. There Following the pump, there was a pulsation dampener used for stabilizing
the feed flow after the metering pump. The working pressure of the dampener neededs to
be maintained at around 80% of the system pressure. An industrial pressure transducer
was set to measure the system pressure. With the aid of the pressure transducer, any
instant pressure increase caused by clogging couldan be detected to avoid any high
pressure (explosion) hazard.
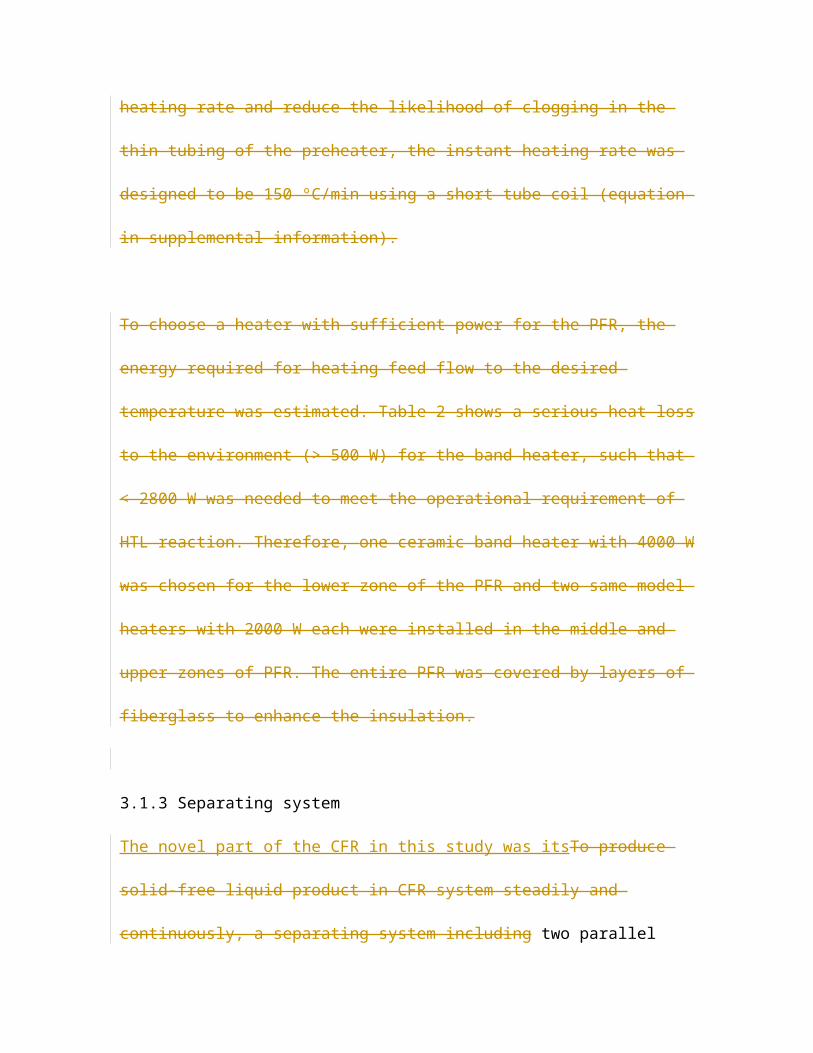
3.1.2 Reactor region
The reaction portion of the system consisted of a preheater and a plug flow reactor (PFR).
A mild temperature of 133 °C [25] was recommended for the preheater as this
temperature would prevent the reaction from occurring before the PFR. The instant
heating rate was designed to be 150 ºC/min using a short tube coil (equation in
supplemental information). Consider the negative effect of temperature increase on the
rated pressure of reactor materials (known as temperature derating factor), Hheavy wall
tubing (O.D./I.D. = 6.35 mm/3.18 mm) was used in the preheater with a rated pressure of
413.7 MPa to mitigate any negative effects of temperature increases on reactor materials
(temperature derating factor).. The PFR was selected as the main HTL reactor, because of
thea higher heating rate which could be achieved [62]. The size and material details of the
preheater and PFR arewere shown in Table S2.
one ceramic band heater with 4000 W was chosen for the lower zone of the PFR and two
same-model heaters with 2000 W each were installed in the middle and upper zones of
PFR. This was due to serious heat loss estimates as shown in Table 2. The entire PFR
was covered by layers of fiberglass to enhance the insulation and prevent heat loss. .
As an important operational parameter, the preheater temperature was considered
carefully. A mild temperature of 133 °C [25] was recommended for the preheater to
prevent reaction occurring before the PFR, which would confuse estimates of reaction
time and lead to premature formation of carbonaceous solids and clogging. To achieve a
higher heating rate and reduce the likelihood of clogging in the thin tubing of the
preheater, the instant heating rate was designed to be 150 ºC/min using a short tube coil
(equation in supplemental information).
To choose a heater with sufficient power for the PFR, the energy required for heating
feed flow to the desired temperature was estimated. Table 2 shows a serious heat loss to
the environment (> 500 W) for the band heater, such that < 2800 W was needed to meet
the operational requirement of HTL reaction. Therefore, one ceramic band heater with
4000 W was chosen for the lower zone of the PFR and two same-model heaters with
2000 W each were installed in the middle and upper zones of PFR. The entire PFR was
covered by layers of fiberglass to enhance the insulation.
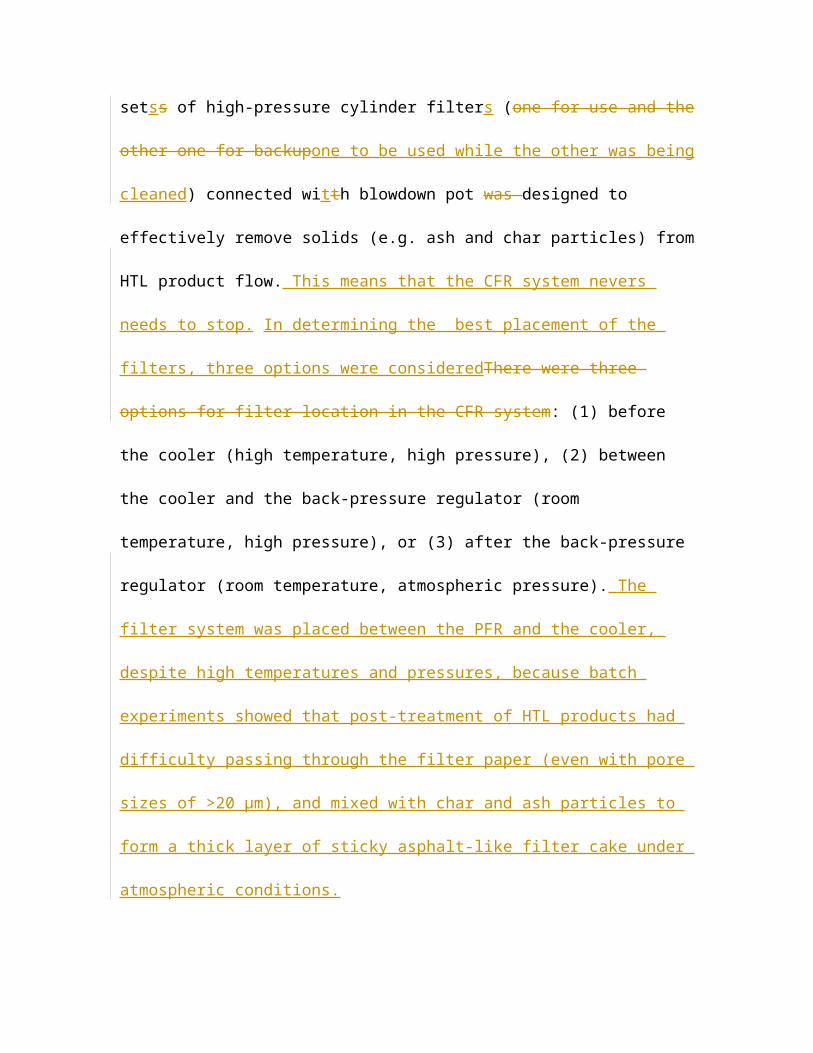
3.1.3 Separating system
The novel part of the CFR in this study was itsTo produce solid-free liquid product in
CFR system steadily and continuously, a separating system including two parallel setss of
high-pressure cylinder filters (one for use and the other one for backupone to be used
while the other was being cleaned) connected witth blowdown pot was designed to
effectively remove solids (e.g. ash and char particles) from HTL product flow. This
means that the CFR system nevers needs to stop. In determining the best placement of
the filters, three options were consideredThere were three options for filter location in the
CFR system: (1) before the cooler (high temperature, high pressure), (2) between the
cooler and the back-pressure regulator (room temperature, high pressure), or (3) after the
back-pressure regulator (room temperature, atmospheric pressure). The filter system was
placed between the PFR and the cooler, despite high temperatures and pressures, because
batch experiments showed that post-treatment of HTL products had difficulty passing
through the filter paper (even with pore sizes of >20 µm), and mixed with char and ash
particles to form a thick layer of sticky asphalt-like filter cake under atmospheric
conditions.
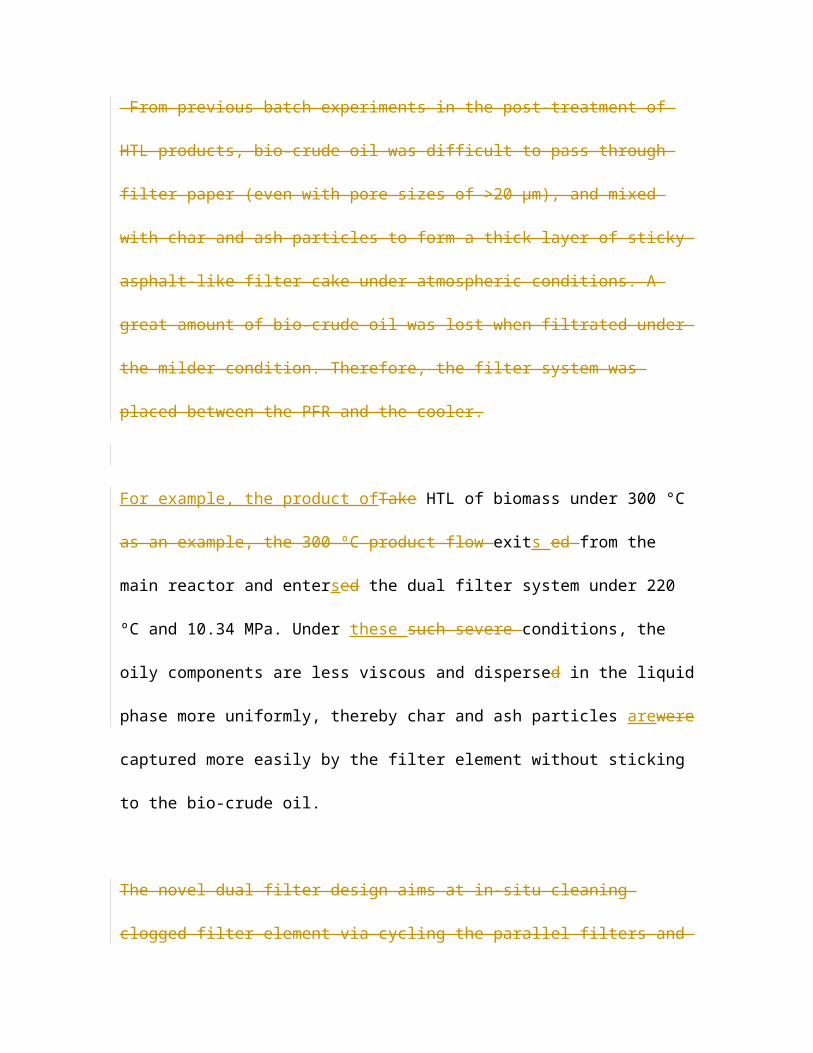
From previous batch experiments in the post-treatment of HTL products, bio-crude oil
was difficult to pass through filter paper (even with pore sizes of >20 µm), and mixed
with char and ash particles to form a thick layer of sticky asphalt-like filter cake under
atmospheric conditions. A great amount of bio-crude oil was lost when filtrated under the
milder condition. Therefore, the filter system was placed between the PFR and the cooler.
For example, the product ofTake HTL of biomass under 300 °C as an example, the 300
ºC product flow exits ed from the main reactor and entersed the dual filter system under
220 ºC and 10.34 MPa. Under these such severe conditions, the oily components are less
viscous and dispersed in the liquid phase more uniformly, thereby char and ash particles
arewere captured more easily by the filter element without sticking to the bio-crude oil.
The novel dual filter design aims at in-situ cleaning clogged filter element via cycling the
parallel filters and with no need to stop CFR system. As shown in Table S2, the volume
of individual filter housing is 1.9 L, even larger than that (1.45 L) the of PFR (1.45 L).
This large filter area had a pore size of 10 µm and an overall area of 405 cm2 . Things to
consider about this large filter is that 1) is that the system can run for a longer period of
time, 2) the product would have a lower velocity and hydraulic pressure. This means the
solid particles could precipitate by gravity, 3) that with high pressure, the solids are more
firmly stuck to the filter element, making cleaning more difficult. The filter element was
monitored by a diaphragm-type differential pressure (DP) gauge tThis notwithstanding,
larger volume suggests lower product velocity and lower hydraulic pressure in the filter
housing, so that solid particles would tend to precipitate by gravity. With higher pressure,
the solids were stuck more firmly onto filter element surface, so the difficulty of cleaning
filter element was increased.
In addition, larger volume of filter housing gives a large area of filter element, the
effective area of which was 405 cm2. Large filter area implied a longer period of running
without refreshing filter elements. A pore size of 10 µm was selected for the filter
element. o prevent plugging in the filter, The plugging situation of filter element was
monitored through detecting pressure difference between both sides of filter element by a
diaphragm-type differential pressure (DP) gauge. A DP of 0.34 MPa was set as an upper
limit, at above which the filter element was required cleaning.to be cleaned.
TheA procedure of in-situ cleaning filter element iwas shown in Figure 4. TIn the filter
vessel, there werehas four valves: a solid-containing feed inlet, a solid-free flow outlet, a
purge gas inlet and a solid outlet. During a regular running, the solid-containing feed
entered the outer layer of filter housing, crossed the filter element, and exited from the
top center, while the solid outlet and the purge gas inlet were keept closed.
The process for changing filters wWhen DP of was higher than 0.34 MPa is reached is as
follows.,
Ffirstly both inlets and outlets on the running filter vessel arewere closed,, and the flow
was guiding flowed into the backup filter vessel.
Secondly, the solid outlet of the filledoriginal filter vessel iwas opened. , Due to theand
huge pressure difference between the filter vessel and the blowdown pot drove, all
product is driven downward, including most of solids on filter element surface.
Thirdly, after the solid outlet iwas turned off.
Fourth,, the filter vessel iwas pressurized by inert gas from the purge gas inlet until the
pressure is rose back to a level equal to system pressure. Re-pressurization would avoids
the violent water evaporation under too-low pressure when the cleaned filter vessel iwas
reconnected to the CFR system. in the next turn. The purge gas inlet was connected to a
compressed gas tank and an air-driven gas booster, which could provide up to 27.58 MPa
compressed gas. In the last stepLast, the liquid inlet iwas half-opened halfway, and the
filter vessel iwas pre-filled with HTL product prior to the next turncompletely opening
the valve.
It is important to note each time the filter vessel was refilled, Though each time the filter
vessel was refilled, the product flow at the final outlet of CFR system was discontinued
until the refilling process was finished, which took 20-30 min. (20-30 minutes). While it
may seem time consuming, over the usual seven hour run, liquid productivity is not
impacted. Nevertheless, consider a seven-hour HTL running, one or two times of
cleaning filter element would not impact liquid productivity significantly.
Each blowdown pot, which collects the removed char and ash from the filter, was
equipped with a cooling jacket, as shown in Figure 5(b). The solid-rich mixture in the
blowdown pot was cooled and subsequently depressurized by athe release valve,
followed by pouring the mixture out and collecting solid product in an open-endeding
drum. The empty blowdown pot was assembled back to the system and ready for the next
turnto be used again. The char and ash particles were captured ex-situ by a 25-µm sieve
filter. In addition, consider the solid-rich flow, the tubing size between filter vessel and
blowdown pot were 12.7 mm O.D. and 7.87 mm I.D due to the solid-rich flow..
3.1.4 Letdown system
Solid-free product from the filter passes through a cooler (Figure 6) and a back-pressure
regulator (BPR). A thermocouple was installed at the cooler outlet to monitor flow
temperature and prevent hot flow from entering the BPR, which could damage the
diaphragm. Exited from the filter system, the solid-free flow passed through a cooler (in
Figure 6) and a back-pressure regulator (BPR) subsequently. Due to a large area of heat
exchange (about 2200 cm2), liquid flow at the outlet of cooler was cooled from over 100
°C to room temperature within one minute. A thermocouple was installed at the cooler
outlet to monitor flow temperature and avoid over-heat flow entering BPR, which may
lead to diaphragm damage. Because the temperature of the cooler was relatively lower
and most particles were removed, a thinner wall (6.35 mm O.D./3.86 mm I.D.) tubing
was used (in Table S2).
The downstream BPR was used to hold the system pressure and inhibit water evaporation
in the CFR system. The pressure in the dome of the BPR was supplied by athe
aforementioned N2 gas tank and the gas booster. Lastly, theThe liquid was collected in an
18.28-gallon tank product under the atmospheric conditions. The off-gas was vented
while most organic volatiles were removed by an activatedion-carbon air filter.
3.1.5 Auxiliary system
As shown in Figure 1The auxiliary system is shown in Figure 1, the auxiliary system
consisted of safety and protection system (red solid lines), gas supply system (black solid
lines), and electrical controlling system (red and blue dash lines). In the safety and
protection system, a set of check valve and rupture disc (31.36 MPa at 350 °C) was
installed between the pressure transducer and the preheater to protect all upstream
instruments from the reverse flow of high-temperature slurry. One auto relief valve (rated
pressure of 20 MPa) and one manual relief valve were installed after the PFR. One
rupture disc (31.36 MPa at 350 °C) located after the PFR, and two rupture discs (19.15
MPa at 350 °C) assembled on the lid of the filter vessel were used to protect the
downstream instruments from a potentialthe explosion hazard caused by clogging issue.
To guarantee the operator safety and the non-contamination in the working zone, the
tubing in the rupture disc system was set up to direct high-pressure hot steam into a
stainless-steel tank.
In the gas supply system, two compressed gas tanks (one for N2 and the other one for air),
and an air-driven gas booster were incorporated. The gas supply system has two primary
functions: (1) pressurizing the cleaned filter housing and (2) providing high pressure for
the BPR, as introduced earlier.
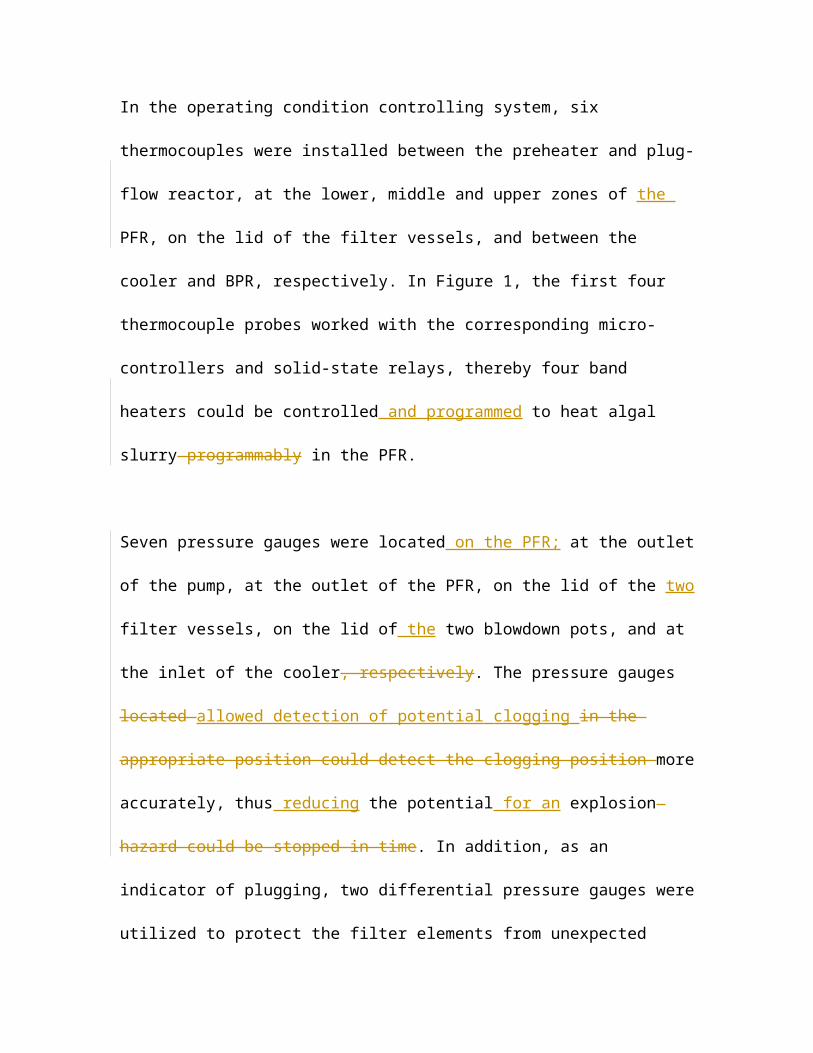
In the operating condition controlling system, six thermocouples were installed between
the preheater and plug-flow reactor, at the lower, middle and upper zones of the PFR, on
the lid of the filter vessels, and between the cooler and BPR, respectively. In Figure 1, the
first four thermocouple probes worked with the corresponding micro-controllers and
solid-state relays, thereby four band heaters could be controlled and programmed to heat
algal slurry programmably in the PFR.
Seven pressure gauges were located on the PFR; at the outlet of the pump, at the outlet of
the PFR, on the lid of the two filter vessels, on the lid of the two blowdown pots, and at
the inlet of the cooler, respectively. The pressure gauges located allowed detection of
potential clogging in the appropriate position could detect the clogging position more
accurately, thus reducing the potential for an explosion hazard could be stopped in time.
In addition, as an indicator of plugging, two differential pressure gauges were utilized to
protect the filter elements from unexpected damage caused by the over-loading of filters
and the rapid pressure increase.
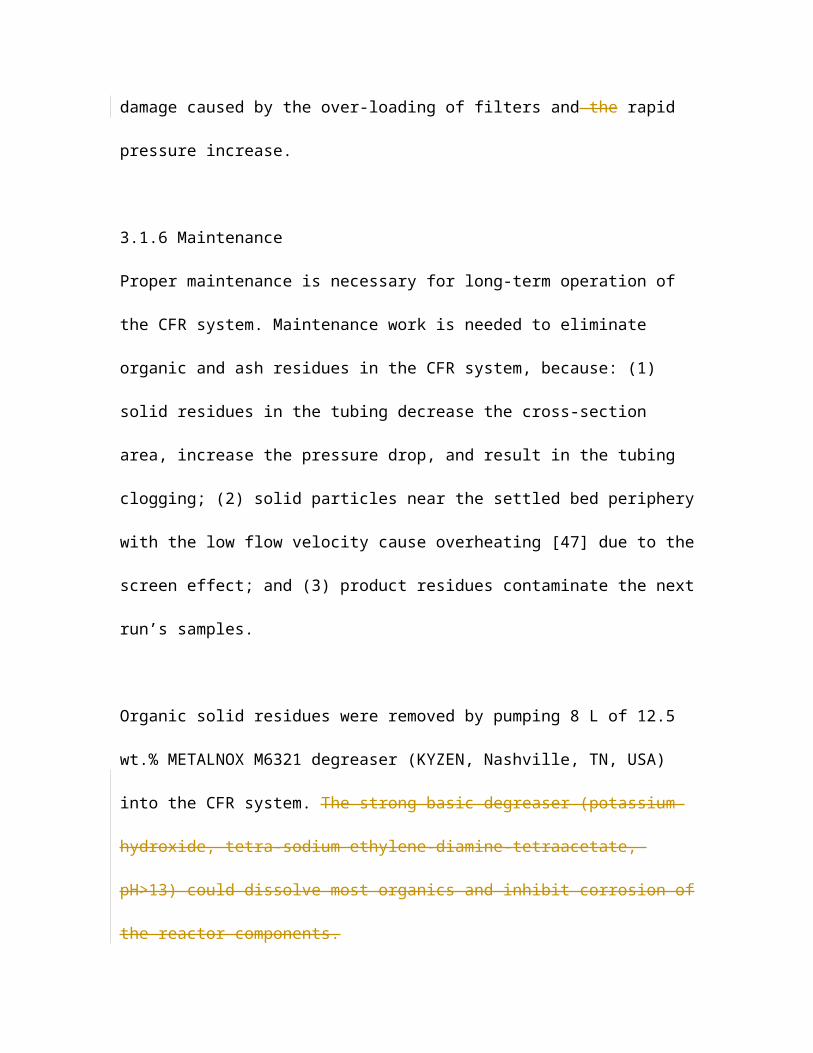
3.1.6 Maintenance
Proper maintenance is necessary for long-term operation of the CFR system.
Maintenance work is needed to eliminate organic and ash residues in the CFR system,
because: (1) solid residues in the tubing decrease the cross-section area, increase the

pressure drop, and result in the tubing clogging; (2) solid particles near the settled bed
periphery with the low flow velocity cause overheating [47] due to the screen effect; and
(3) product residues contaminate the next run’s samples.
Organic solid residues were removed by pumping 8 L of 12.5 wt.% METALNOX M6321
degreaser (KYZEN, Nashville, TN, USA) into the CFR system. The strong basic
degreaser (potassium hydroxide, tetra-sodium ethylene-diamine-tetraacetate, pH>13)
could dissolve most organics and inhibit corrosion of the reactor components.
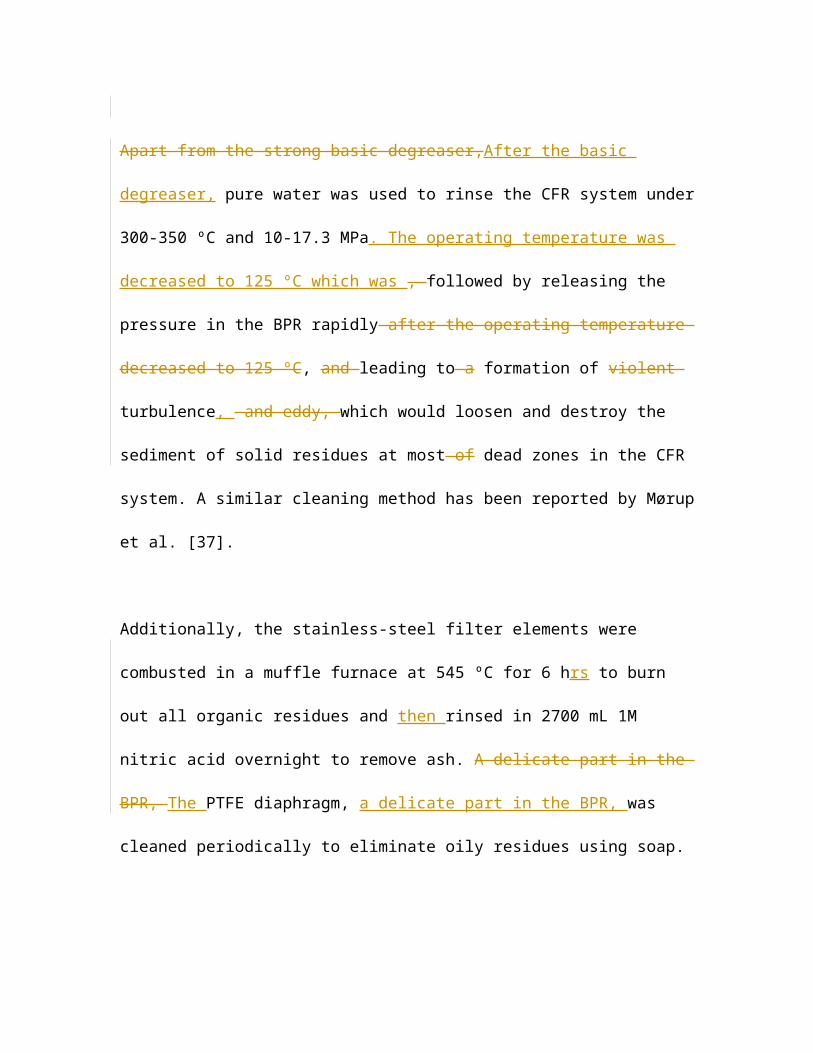
Apart from the strong basic degreaser,After the basic degreaser, pure water was used to
rinse the CFR system under 300-350 ºC and 10-17.3 MPa. The operating temperature was
decreased to 125 ºC which was , followed by releasing the pressure in the BPR rapidly
after the operating temperature decreased to 125 ºC, and leading to a formation of violent
turbulence, and eddy, which would loosen and destroy the sediment of solid residues at
most of dead zones in the CFR system. A similar cleaning method has been reported by
Mørup et al. [37].
Additionally, the stainless-steel filter elements were combusted in a muffle furnace at 545
ºC for 6 hrs to burn out all organic residues and then rinsed in 2700 mL 1M nitric acid
overnight to remove ash. A delicate part in the BPR, The PTFE diaphragm, a delicate part
in the BPR, was cleaned periodically to eliminate oily residues using soap.
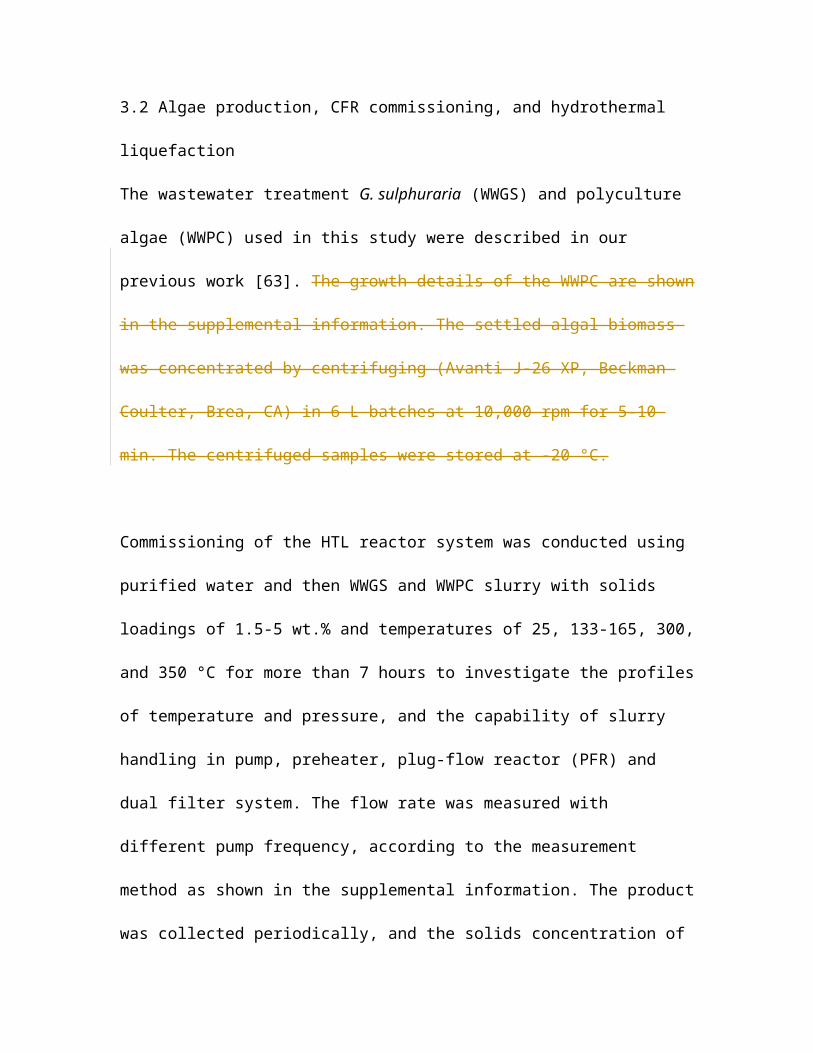
3.2 Algae production, CFR commissioning, and hydrothermal liquefaction
The wastewater treatment G. sulphuraria (WWGS) and polyculture algae (WWPC) used
in this study were described in our previous work [63]. The growth details of the WWPC
are shown in the supplemental information. The settled algal biomass was concentrated
by centrifuging (Avanti J-26 XP, Beckman Coulter, Brea, CA) in 6 L batches at 10,000
rpm for 5-10 min. The centrifuged samples were stored at -20 °C.
Commissioning of the HTL reactor system was conducted using purified water and then
WWGS and WWPC slurry with solids loadings of 1.5-5 wt.% and temperatures of 25,
133-165, 300, and 350 °C for more than 7 hours to investigate the profiles of temperature
and pressure, and the capability of slurry handling in pump, preheater, plug-flow reactor
(PFR) and dual filter system. The flow rate was measured with different pump frequency,
according to the measurement method as shown in the supplemental information. The
product was collected periodically, and the solids concentration of feedstock was
measured by freeze-drying. The temperature and pressure profiles in the PFR and
throughout the entire CFR system were monitored by the controlling panel and pressure
gauges.
Flow patterns under different conditions wereas described by Reynolds number (Re), and
the equation of Re was described in the supplemental information. The terminal velocity
was estimated as shown below:
v=√ 4 gd3 CD
( ρp−ρw
ρw) (7)

where ρp is the particle density, ρw the fluid density, g the gravitational acceleration, d the
particle diameter, CD the drag coefficient, equal to 0.445 when Re ranges from 750 to
350,000, and v the terminal velocity. The terminal flow rate was obtained by via
multiplying terminal velocity by the cross-sectional area of the corresponding tubing.
A modified method was used to measure residence time distribution (RTD) in the CFR
system [37] (see Eq. 8-12). The inert tracer compound, 1.5 L Phenol solution (with a
concentration of 60 mg/L) was injected into the CFR system, and the sample was
collected at the outlet, and monitored by UV/Vis Spectrometer Lambda 35 (PerkinElmer,
Inc., Waltham, MA, USA). A series of parameters about the flow RTD were obtained
based on the following equations [64]:
E ( t )=
c( t)
∫0
∞
c (t)dt=
c i
∑ c i ∆ t i (8)
tm=∫0
∞
tE (t)dt=∫
0
∞
tc(t)dt
∫0
∞
c (t)dt=∑ t i c i ∆t i
∑ c i∆ t i
(9)
σ 2=∫0
∞
(t−t m)2 E (t)dt=∑ (ti−tm )2c i ∆ ti
∑ ci ∆ t i
(10)
σ2
tm2 = 2
Pe+ 8
Pe2 (11)
E (θ )= 1
2√ πθPe
exp [−(1−θ )2
4θPe ] (12)
where c(t) is the instant concentration at the outlet of the BPR, E(t) the exit age
distribution, tm the mean residence time, σ the time variance, θ = t / tm, and Pe, Peclet
number, a dimensionless number used to describe the transport phenomenon of
continuum by a ratio of the convective transport rate to the conductive transport rate. The
value of Pe was obtained experimentally by determining tm, and σ2 from the RTD data
and solving Eq. 11 for Pe. The normalized distribution function E(θ) was estimated based
on the known values of Pe and θ. The detection limit of this UV-Vis is around 0.005
A.U.
As commissioning was completed, HTL experiments were performed in the CFR system,
where 31 L of algae slurry, with solids loading of 3 and 5 wt.%, were liquefied at 325-
350 °C with theoretical retention times of 3-9 min and flow rates of 152-155 mL/min.
HTL products included a two-phase liquid (containing organics and aqueous) and solid
phase (containing char and ash particles). The liquid products were collected in 25 mL
aliquots every 10 or 20 min,n, and stored under 4 °C before analysis. Solid products were
collected from the blowdown pots, freeze-dried, and stored in the desiccator prior to
characterization. Yields of carbon and nitrogen were estimated using the equation
displayed below:
C /N Yield= C /N content∈liquid sample× HTLliquid volumetric flow rateDry algal solid loading × algaemass flow rate× C /N content∈algae
× 100 %
(13)
3.3 Characterization of algal feedstock and HTL products
To measure ash content, the weighed samples were placed into a programmable box
furnace (Cole–Parmer, Vernon Hills, IL, USA) at 585°C for 240 min in triplicate [65].
The viscosity of algal solution was measured using a CANNON® Model 2020
viscometer (Cannon Instrument Company®, State College, PA, USA) with athe LV-1
spindle. Elemental CHNS contents in feedstock were analyzed using a Series II 2400
elemental analyzer (Perkin Elmer, Waltham, MA, USA) in triplicate. The analyzer was
calibrated using cystine and acetanilide. The surface morphology of algae particles was
detected using athe S-3400N Type II Scanning Electron Microscopy (SEM) (Hitachi
High-Technologies Corp., Pleasanton, CA, USA) and analyzed by FEI Nova NanoSEM
630.
The pH value of liquid product was measured with athe Surpass Electrokinetic Analyzer
(Anton Paar USA Inc., Ashland, VA, USA). Total organic carbon (TOC) and total
nitrogen (TN) of the 25 mL liquid products were measured by athe model TOC-VCPH
analyzer (Shimadzu Corp., Kyoto, Japan) and athe model TNM-1 analyzer (Shimadzu
Corp., Kyoto, Japan), respectively. The inorganic element contents in the algal biomass,
HTL liquid products, and char samples were quantified using an Optima 4300 DV
inductively coupled plasma optical emission spectrophotometer (ICP-OES)
(PerkinElmer, Waltham, MA, USA).
4 Results and discussion
4.1 Commissioning
To develop a safe, steady and continuous process for running HTL of biomass, the
commissioning is required for testing the range of operational parameters (e.g.
temperature, pressure, flow rate, solid loading, residence time, etc.).
4.1.1 Temperature profile
The temperature profile in the CFR system with a reaction temperature of 300 ºC is
shown in Figure 7. The flow was heated by the preheater from 30 to 133 ºC within 10
seconds, then up to 300 °C as soon as it entered the lower zone of the PFR. After the flow
exited from the top of the PFR, the temperature dropped down to 230 ºC sharply due to
the heat loss from the 3/8 in. O.D. tubing. The solids-containing flow entered the filter
vessel at 210 ºC. After 15 minutes, the now solids-free flow out of the filter vessel was
cooled from 180 to 30 ºC by a downstream cooler. Lastly,A 25 ºC product flow was
collected in the product tank.
Figure 8 shows the configuration and temperature profiles of the band heaters on the PFR
when running HTL of 5 wt.% microalgae with a flow rate of 155 mL/min atunder 350
°C. The experimental data showed that the desired operation condition was reached
throughout the PFR using the ceramic band heaters and fiberglass. An average heating
rate of 150 ºC/min, a ramping period of less than 2 min, and a reaction temperature of
350 °C were achieved in the CFR system, which were conducive to the recycling of
energy-dense product from wet biomass, compared to that of the 1.8 L batch reactor (a
heating rate of 3.2 ºC/min and a ramping period of 112 min) [66, 67].
In general, the temperatures profile throughout the entire CFR system should be
rigorously controlled and optimized, based on the following purposes: (1) reducing the
likelihood of tubing clogging in the preheater, (2) keeping flow viscosity as low as
possible and avoid any product lost, (3) maintaining high efficiency of solids separation
on filter elements, and (4) guaranteeing running under a safe operating condition (below
the high limit).
4.1.2 Pressure profile
The pressure was highest at the outlet of the pump and decreased until the inlet of the
BPR, after which the pressure was atmospheric. During running HTL of purified water
under 300 °C, the operating pressure was the highest (10.34 MPa) at the outlet of the
pump, and decreased as throughout the entire CFR system until the lowest level (10.22
MPa) was reached at the inlet of the BPR, due to the hydraulic pressure drop throughout
the entire reactor system, as discussed above.
In Figure 9, the operating pressure (blue line) varied slightly from pump to BPR, but
much higher than lower pressure limit (red line, that is the pressure of saturated steam
under the corresponding temperature) throughout the CFR system.
To maintain the stability of operating pressure, the procedure of cycling and in-situ
cleaning filter vessels was developed, as mentioned in Section 3.1.3. The pressure
changes during cleaning the clogged filter vessel was described in Figure 10. Despite the
cleaning procedure there wasWhen the right filter vessel was clogged, the solid-
containing flow was immediately directed into the left filter vessel. As the right filter
vessel was isolated and its solid outlet was opened, the vessel pressure was rapidly
released to 0.03-0.14 MPa. Following a blowdown step, the filter vessel was re-
pressurized by compressed N2 until the vessel pressure reached around 8.27 MPa, which
was further increased to 10.34 MPa when the liquid inlet was half-opened.
Simultaneously, anth initial e system pressure dropped down to 9.65 MPa, but the
system rebounded back to the original level instantaneously. Therefore demonstrating
that the clogged filter can be cleaned in-situ, without disturbing the stability of the CFR
pressure.
Thus, the stability of operating pressure was not impacted obviously during filter
cleaning. It demonstrated the clogged filter can be cleaned in-situ without disturbing the
CFR running.
4.1.3 Flow rate profile and solids loading capability
The capability of handling various solids-loadings slurries under a wide range of flow
rate for the pipe underneath feed tank and the downstream tubing was evaluated to avoid
sudden clogging and pressure spike in the CFR system.

The terminal velocities in the tubing with different sizes were measured, thereby the
operational window of flow rate was determined. As shown in Table 2, in addition to the
flow before the pump, the values of Re (6,800-82,000) were much higher than 4000,
suggesting the flow in the CFR system exhibited athe turbulent pattern and could be
studied as a case in the Newtonian regime.
In Table 2, the higher terminal flow rate before the pump (246 mL/min) was attributed by
the larger size of the pipe (20.6 mm), which was about 6.5 times larger than that after the
pump (3.2 mm). The particles settling in the pipe before the pump are less likely to be
avoided by simply increasing the flow rate (the high limit of the flow rate provided by the
pump is 250 mL/min).
To address the above problem, the back flushing of pipe was studied to alleviate particle
deposition. As shown
iIn Figure 11, the real solids loading of WWGS flow with the theoretical solids loadings
of 2.8 wt.% and 4.2 wt.% were measured at the outlet of the pump, when different back-
flushing frequencies (0.03-1 min-1) and flow rates (96-181 mL/min) were adopted. As
back-flushing frequency decreases from 1 min-1 to 0.03 min-1, the solids loading of
WWGS flow increases evidently, which was also caused by the flow rate reduction from
181 mL/min to 96 mL/min. In Figure 11(a), it shows the maximum of real solids loading
did not exceed the theoretical value even at a frequency of 0.03 min-1 and a flow rate of
136 mL/min. In Figure 11(b), when WWGS flow with a theoretical solids loading of 4.2
wt.% was investigated, back-flushing frequency doesn’t remarkably affect the real solids
loading under high flow rates (≥147 mL/min). The real solids loadings (3.1-4.0 wt.%)
were lower than the theoretical level in such a condition. By comparison, a back-flushing
frequency of <0.2 min-1 led to the real solids loading of 4.2-4.4 wt.%, higher than the
theoretical value, under lower flow rates (114 mL/min). In addition, solids loadings of
flow were lower than the corresponding theoretical level in most cases, which could be
attributed to that larger particles were captured by the first cylinder filter underneath the
feed tank.
TIn addition, the capacity of handling algae slurry for the preheater coil is necessary as
well. The preheater coil needed to be tested in terms of solids loading, preheater
temperature, and flow rate, tofor avoiding pressure instability and tubing clogging. The
smaller diameter of the preheater coil made it more susceptible to pressure spikes and
clogging at lower flow rates and higher preheater temperatures. The diameter size of
preheater coil was much smaller than that of the downstream tubing, thereby algal slurry
is more likely to cause pressure spike and clogging in the preheater coil at lower flow
rates and higher preheater temperatures. HBecause heat transfer occurs unevenly from the
band heater to the coil, the overheated/hot points in the coilwhich could results in the
sudden melting of organic carbon and accumulating of coke inside the coil. A safe
operational window needs to be identified., subsequently causes coil clogging. So, a safe
operational window of flow rate and preheater temperature should be tested when
different solids loading slurries are run in the CFR system. As shown in Table 3, the low
limit of flow rate, below which the system pressure begins to fluctuate seriously,

increases from 131 mL/min to 139 mL/min, as preheater temperature increases from 133
°C to 165 °C. Furthermore, when WWGS flow with a solids loading of 4.2 wt.% is
pumped through the preheater, the operating pressure fluctuated violently at a preheater
temperature of >142 °C, leading to a rapid increase of DP in the filter vessel, so that the
filter vessel had to be cleaned more often (it took < 15 min to reach a DP of 0.34 MPa).
Meanwhile, a tremendous amount of gaseous N2 was consumed for pressurizing filter
vessels, and more oily product was lost as mixed with solid residues and dumped into the
blowdown pots during filter cycling. Thus, no data associated with low limit of flow rate
was obtained at a preheater temperature of > 142 °C.
To avoid particle settling, dramatic condition change (that is, condition stability was
disturbed), and pre-reaction of biomass particles in the limited space of preheater coil
(3.2 mm I.D.), it s suggested that the flow rate is increased and temperature decreased in
the preheater. Higher preheater temperature and lower flow rate, as discussed earlier,
facilitate particle settling, caused dramatic condition change (that is, condition stability
was disturbed), and promoted pre-reaction of biomass particles in the limited space of
preheater coil (3.2 mm I.D.). Increasing flow rate mitigates clogging at the expense of
sufficient residence time. Thus, in addition to increasing flow rate, preheater temperature
could be lowered to maintain stable operation for HTL of biomass with higher solids
loadings.

When a biomass flow with solids loading of ≥4.2 wt.% is processed in the CFR system, a
flow rate of ≥147 mL/min, a pipe back-flushing frequency of 0.03-0.04 min-1, and a
preheater temperature of ≤142 °C are recommended.
4.1.4 Residence time distribution
The real RTD of flow throughout the entire CFR system, including the pump, preheater,
PFR, filter vessels, cooler and BPR, was measured under the desired operating condition.
In Figure. 12, the experimental RTD results were obtained under atmospheric condition
and the operational condition (350 °C and 18 MPa). The results are summarized iIn
Table 4., the data associated with the RTD of flow is summarized. Kruse et al. [59]
operated a lab-scale CFR with a relative lower discrepancy than that of Mørup et al. [37].
In this study, an extremely small discrepancy of 0.54% was achieved at room
temperature. Due to the tailing effect, the discrepancy at 350 °C was relatively higher
(22.22%). Nevertheless, the Peclet numbers under room temperature and 350 °C (18.44
and 13.77) were lower than that of Mørup’s work (28.02), indicating a relatively steady
flow throughout the CFR system.
RTD curves of phenol running were tested under room temperature and 350 °C. The
tracer onsets of both room temperature and 350 °C took place at a relative residence time
(θ) of 0.4 (Figure 12), implying a non-classical laminar flow. The relative residence time
of θ < 0.5 is explained by product flow entering and exiting filter vessels through the top
zone in a shorter distance rather than following the streamline center throughout the
entire filter vessel.
There was no obvious difference of peak broadening at room temperature and 350 °C.
However, the peak height of RTD curve obtained at 350 °C (14.3 mg/L) was lower than
that obtained under room temperature (23.7 mg/L) at the 21st minute, due to slight phenol
degradation at higher temperature. There was aboutAbout 70.8% of phenol exiteding out
of the CFR system within 80 minutes under room temperature, while only 56% of total
phenol exited out within the same time under 350 °C. It can be predicted that the tail of
350 °C curve is longer than that at room temperature, which There couldmight be caused
by two possible reasons. The first possible cause is that it is difficult to rinse the inner
surface of the filter vessel thoroughly dDue to the huge volume of the CFR system. This
could lead, it is difficult to rinse the inner surface of filter vessel thoroughly, leading to
the organic residues on the inside walls of PFR where . Therefore, phenolphenol could
bewas absorbed by the residual organics, then desorbed, which increases d the residence
time and the RTD tail. Secondly, phenol concentration gradient led to diffusion towards
the dead zone of filter vessels. Diffusion occurred acutely at higher temperature, thereby
more phenol entered the dead zone and spent longer time flowing through the entire CFR
system.
In Table 4, the data associated with the RTD of flow is summarized. Kruse et al. [59]
operated a lab-scale CFR with a relative lower discrepancy than that of Mørup et al. [37].
In this study, an extremely small discrepancy of 0.54% was achieved at room
temperature. Due to the tailing effect, the discrepancy at 350 °C was relatively higher
(22.22%). Nevertheless, the Peclet numbers under room temperature and 350 °C (18.44
and 13.77) were lower than that of Mørup’s work (28.02), indicating a relatively steady
flow throughout the CFR system.
4.2 Characterization of algae feedstock
The algae feedstock was characterized byfor evaluating the performance of feedstock for
continuous HTL running. Both WWGS and WWPC feedstock with high ash contents
(42.0±0.2 wt.% and 34.7±0.1 wt.%, respectively) may cause fouling in the CFR system.
The SEM results showed the particle sizes of approximately 10-20 µm for the lyophilized
WWPC algae particles with athe multilayer leaflet structure, as shown in Figure 13. It
implies that algae particles could go through the entire supply system and reach the PFR
without any plugging, unless the aggregation phenomenon was found. In Table 5, it was
found WWPC feedstock contains higher contents of carbon and hydrogen (34.5 wt.% and
53 wt.%, respectively) than that of WWGS (29.0 wt.% and 4.2 wt.%, respectively), while
WWGS has higher oxygen content (20.3 wt.%) compared to WWPC (18.6 wt.%). See
Table 5. It can be speculated that WWPC may have higher energy content than WWGS,
owing to higher molar ratio of H/C and lower molar ratio of O/C (1.83 and 0.40,
respectively) in WWPC relative to that (1.75 and 0.52, respectively) in WWGS.
4.3 Characterization of HTL liquid product
As shown in Figure 14, theThe HTL liquid product consisted of aa thin layer of organic
phase on the top, a great amount of aqueous phase andand another thin layer of organic
phase deposited on the bottom of the sample vial. Only a tiny amount of organic phase
(1-8 mg/g) was collected. , as shown in Figure 14. It was found that a thin layer of
organic phase was on the top of HTL liquid product, and another thin layer of organic
phase deposited on the bottom of the sample vial. Two possible reasons why such a small
amount of bio-crude oil was produced were 1) low solids loading of algae feedstock (3-5
wt.%), and 2) short reaction time (3-9 min). In addition, the such thin layer of organic
phase negatively impacted the separation of water-insoluble organics from aqueous
phase.
To estimate how much of the organics transferred from algae into the HTL liquid phase,
the contents of carbon and nitrogen in the aqueous phase were measured by TOC and TN
analysis. These values are shown in Tables 6-8. In Tables 6-8, the TOC and TN values of
the aqueous phase (3% WWGS: 2800-3300 mg/L of TOC and 550-620 mg/L of TN; 5%
WWGS: 3900-4500 mg/L of TOC and 620-710 mg/L of TN; 5% WWPC: 4100-5300
mg/L of TOC and 650-830 mg/L) increased with solids loading of feedstock, reaction
temperature, and residence time. However, consider the solids loading of algae feedstock,
the yields of carbon and nitrogen (3% WWGS: 31-39 wt.% of carbon yield and 55-61 wt.
% of nitrogen yield; 5% WWGS: 27-32 wt.% of carbon yield and 37-43 wt.% of nitrogen
yield; 5% WWPC: 24-28 wt.% of carbon yield and 20-27 wt.% of nitrogen yield) slightly
decreased as the operating condition became more severe. Additionally, the densities of
HTL liquid products were almost no different from water density, as displayed in Table
9. Even though the molar ratio of N/C in WWGS feedstock was 0.1 (in Table 5), the
molar ratio of N/C in WWGS-derived liquid decreased from 0.24 to 0.15 under a reaction
temperature of 325 °C and reaction time of 3.2 min (in Table 6), and the N/C ratio even
decreased from 0.18 to 0.13 under 350 °C and 6.2 min (in Table 7). Protein-derived
compounds enriched in the liquid phase at the beginning, but may gradually transfer into
other phases (e.g. oily/gaseous phase [68]) as the severity of operating condition
increased.
In all, low solids loading of feedstock, high nitrogen/oxygen content in algae, and
insufficient residence time result in slightly low yield of algae conversion and difficult
oil-aqueous separation in the CFR system, which is required to be addressed in the future
work.
4.4 Characterization of HTL solid product
According to the SEM analysis in Figures 13a) and 13b), the multilayer leaflet structure
of WWPC feedstock degraded into finer particles with coarse surface after HTL,
indicating the obvious decomposition of algal components. The inorganic/metal elements
were tracked in feedstock and different HTL products by ICP-OES to analyze the ash fate
and corrosion issue in the CFR system during HTL running. In Table 10, it was found
that the contents of Aluminum, Barium, Chromium, Iron, Manganese, Molybdenum, and
Nickel were increased by 0.7-1.5 times in WWPC-derived solid product than that in
WWPC feedstock, but extremely low in all HTL liquid products. Since the organics were
transferred from solid to liquid during HTL, the metals were enriched in the solid
product. Consider the alloy composition (e.g. Cr, Fe, Mn, Mo, and Ni) in the SS316
material (in Table S3), little corrosion was expected during HTL operation. As one of the
main components in ash, most of Ca and Mg entered HTL solid phase from 5% WWPC,
and still a small amount dissolved in liquid phase. This is consistent with the ash content
of the HTL solids (70.1±0.1 wt.%) compared to that of WWPC feedstock (34.7±0.1 wt.
%). K and Na were mostly soluble in the aqueous phase, leading to slightly alkaline
liquid product with pH values of 7.4-7.7 (in Table 9), which would alleviate the corrosion
of CFR system. Also, in Table 10, P was enriched in solid product from 5% WWPC,
which could be considered as the potential nutrient resource for plant cultivation.Table 10
shows the concentrations of the various inorganic/metal elements in the feedstock, HTL
liquid and solid products.
4.5 The existing problems in the CFR system
Even though the CFR system is able to process algal slurries under desired operating
conditions without clogging, a few critical problems still limit the further application.
These limitations are short reaction time, low solid-loading concentration, particle
settling, high energy consumption ratio, and difficulty separating. The capability of
handling low solids-loading slurry seriously impacts the economic feasibility for running
biomass HTL in the CFR system. Assuming a comparable bio-crude oil yield could be
achieved with higher solids-loading feedstock, a solids loading of 20 wt.% was
considered as a fair trade-off between the cost of water removal and the capital costs of
running running HTL. of higher-solids-loading slurry would give lower energy
consumption ratio (the ratio of the energy required for conversion of algae into bio-crude
oil to the energy available from bio-crude oil combustion) [67]. It indicates more
renewable energy is produced and usable as a same amount of energy is consumed, that
is, this process is more economically feasible.
Meanwhile, a solids loading of 20 wt.% was considered as a fair trade-off between the
cost of water removal and the capital costs of HTL running [69]. Herein, three types of
solution could be considered: 1) modifying the original metering pump by adding athe
slurry-tolerant pumps (e.g. double piston pump or hose-diaphragm pump [38]), and
adjusting tubing sizes based on capacity of slurry handling and terminal velocity; 2)
pumping high solids-loading slurry withby the current metering pump andwith adding
water-soluble thickener (e.g. guar gum), which helps to improve particles suspension
ding in the slurry; and 3) choosing another types of feedstock which is more suitable to
the metering pump, such as the industrial/agricultural/municipal liquid wastes, which are
homogeneous slurries with finer particles.
The small amount of bio-crude oil produced in the CFR directly affects the oil-aqueous
separation and oil productivity. Short reaction times and low solids loadings lead to the
under-reaction of wet biomass. Three methods could be tried to address the problem: 1)
modify the structure of the PFR to increase the residence time of feedstock under the
desired operating conditions (lowering flow rate may be another option if particle settling
can be controlled); 2) add hydrogen-donor solvents (e.g. ethanol and glycerol) into
feedstock to increase bio-crude oil yield by transferring organics from aqueous phase to
oily phase and inhibiting re-polymerization reaction; 3) integrate a
deoxygenating/denitrogenating/cracking catalytic reactor (e.g. packed-bed reactor) to the
filter vessels, so that oily compounds in solids-free mixture can be upgraded. Thus, more
small organics will be produced from decomposition of heavier oily compounds, and a
thicker oily layer will be formed on the top layer of HTL liquid, and separationed from
aqueous phase will be more easily achieved by a suitable oil/aqueous separator.
The heat efficiency of the entire CFR system should be improved through recycling the
excessive heat lost from the cooler to preheat the feedstock flow, and through enhancing
heat insulation of the reacting system. Specifically, the feedstock flow (cold flow) is
required to be heated to 133 °C. For the product flow (hot flow), if the flow temperature
was too high, it may damage the diaphragm of the downstream back pressure regulator
(BPR), while if the temperature was too low, the fluid viscosity will increase, resulting in
more organics stuck on the inner surface of tubing, causing lower bio-crude oil yield. The
intermediate temperatures (45-65 °C) of the product flow between the cooler and the
BPR need to be reached. Therefore, a suitable-sized heat exchanger is needed to meet the
operating requirement via recycling the sufficient amount of heat from product flow for
heating feedstock flow.
4 Conclusion
In this study, a novel pilot-scale CFR system was createdfirstly built up, incorporating an
advanced dual high-pressure filtration system with a function of in-situ cleaning under
high temperature and high pressure. In this new CFR system, ~5 wt.% WWT algae
slurries were processed under ~350 °C and ~18 MPa for more than 7 hours with no
clogging or leaking. Most ash was enriched into the solid product, which was captured by
the dual filters system. The, and solids-free liquid product was obtained with flow rates of
130–140 g/min. The yields of carbon and nitrogen in HTL liquid product reached 39 wt.
% and 57.3 wt.%, respectively. However, there was relatively small amount of bio-crude
oil in the HTL liquid, owing to the short reaction time and low solids loading of the algae
slurry. This not only increased the difficulty of oil-aqueous separation, but also reduced
the productivity of bio-crude oil. To enhance the economic feasibility of the CFR system,
the biomass slurry should have a with higher solid loadings concentration and should be
processed for a longer reaction time in the reactorfuture. A highly effective upgrading
reactor should be added following the dual filters system to facilitate the formation of
lighter bio-crude oil. Thise new design of pilot-scale CFR system exhibits a technical
potential of transitioning batch HTL into continuous HTL, and steady filtrating operation
under high temperature and high pressure, prior to the further scaling up of continuous
HTL process.
Acknowledgements
The authors would like to acknowledge funding from the National Science Foundation
New Mexico EPSCOR Research Infrastructure Improvement grant “Energize New
Mexico” (#1031346), and the National Science Foundation “ReNUWIt” Engineering
Research Center (#1028968). The authors would also like to acknowledge assistance
from members of the research groups of Holguin, Van Voorhies, Khandan, and Brewer &
Jena, Mark Chidester, Yu-Ping Tang, Charles Park, Ken Ruble, and Stefan Perez during
the fabrication, modification and commissioning of CFR, algae production, harvesting,
and characterization, reactor operation, and product characterization.
References
[1] S.K. Kim, D. Yoon, S.-C. Lee, J. Kim, Mo2C/Graphene Nanocomposite As a Hydrodeoxygenation Catalyst for the Production of Diesel Range Hydrocarbons, ACS Catalysis 5 (2015) 3292-3303.[2] F. Cheng, C.E. Brewer, Producing jet fuel from biomass lignin: Potential pathways to alkyl-benzenes and cycloalkanes, Renewable and Sustainable Energy Reviews 72 (2017) 673-722.[3] D.R. Vardon, B.K. Sharma, G.V. Blazina, K. Rajagopalan, T.J. Strathmann, Thermochemical conversion of raw and defatted algal biomass via hydrothermal liquefaction and slow pyrolysis, Bioresource Technology 109 (2012) 178-187.[4] A.A. Peterson, F. Vogel, R.P. Lachance, M. Fröling, M.J. Antal Jr, J.W. Tester, Thermochemical biofuel production in hydrothermal media: a review of sub-and supercritical water technologies, Energy & Environmental Science 1 (2008) 32-65.[5] P.E. Savage, A perspective on catalysis in sub-and supercritical water, The Journal of Supercritical Fluids 47 (2009) 407-414.[6] N. Akiya, P.E. Savage, Roles of water for chemical reactions in high-temperature water, Chemical reviews 102 (2002) 2725-2750.[7] O. Bobleter, Hydrothermal degradation of polymers derived from plants, Progress in polymer science 19 (1994) 797-841.[8] R.H. Wijffels, M.J. Barbosa, M.H. Eppink, Microalgae for the production of bulk chemicals and biofuels, Biofuels, Bioproducts and Biorefining 4 (2010) 287-295.[9] M.F. Demirbas, Biofuels from algae for sustainable development, Applied Energy 88 (2011) 3473-3480.[10] X. Liu, B. Saydah, P. Eranki, L.M. Colosi, B.G. Mitchell, J. Rhodes, A.F. Clarens, Pilot-scale data provide enhanced estimates of the life cycle energy and emissions profile of algae biofuels produced via hydrothermal liquefaction, Bioresource technology 148 (2013) 163-171.[11] M.-O.P. Fortier, G.W. Roberts, S.M. Stagg-Williams, B.S. Sturm, Life cycle assessment of bio-jet fuel from hydrothermal liquefaction of microalgae, Applied Energy 122 (2014) 73-82.[12] U. Jena, K. Das, J. Kastner, Effect of operating conditions of thermochemical liquefaction on biocrude production from Spirulina platensis, Bioresource technology 102 (2011) 6221-6229.[13] P. Biller, A.B. Ross, Hydrothermal processing of algal biomass for the production of biofuels and chemicals, Biofuels 3 (2012) 603-623.[14] S. Sunphorka, K. Prapaiwatcharapan, N. Hinchiranan, K. Kangvansaichol, P. Kuchonthara, Biocrude oil production and nutrient recovery from algae by two-step hydrothermal liquefaction using a semi-continuous reactor, Korean Journal of Chemical Engineering 32 (2015) 79-87.[15] K. Prapaiwatcharapan, S. Sunphorka, P. Kuchonthara, K. Kangvansaichol, N. Hinchiranan, Single-and two-step hydrothermal liquefaction of microalgae in a semi-continuous reactor: Effect of the operating parameters, Bioresource technology 191 (2015) 426-432.
[16] S. Kumar, R.B. Gupta, Biocrude production from switchgrass using subcritical water, Energy & Fuels 23 (2009) 5151-5159.[17] C. Jazrawi, P. Biller, A.B. Ross, A. Montoya, T. Maschmeyer, B.S. Haynes, Pilot plant testing of continuous hydrothermal liquefaction of microalgae, Algal Research 2 (2013) 268-277.[18] D.C. Elliott, P. Biller, A.B. Ross, A.J. Schmidt, S.B. Jones, Hydrothermal liquefaction of biomass: developments from batch to continuous process, Bioresource technology 178 (2015) 147-156.[19] L. Schaleger, C. Figueroa, H. Davis, Direct liquefaction of biomass: results from operation of continuous bench-scale unit in liquefaction of water slurries of Douglas fir wood, Biotechnol. Bioeng. Symp.;(United States), Lawrence Berkeley Lab., CA, 1982.[20] T.E. Lindemuth, Biomass conversion processes for energy and fuels, in: S.S. Sofer, O.R. Zaborsky (Eds.) Biomass Conversion Processes for Energy and Fuels, Springer Science & Business Media, Boston, MA, 1981, pp. 187-200.[21] K. Ocfemia, Y. Zhang, T. Funk, Hydrothermal processing of swine manure into oil using a continuous reactor system: Development and testing, Transactions of the ASABE 49 (2006) 533-541.[22] F. Goudriaan, D. Peferoen, Liquid fuels from biomass via a hydrothermal process, Chemical Engineering Science 45 (1990) 2729-2734.[23] S. Makishima, M. Mizuno, N. Sato, K. Shinji, M. Suzuki, K. Nozaki, F. Takahashi, T. Kanda, Y. Amano, Development of continuous flow type hydrothermal reactor for hemicellulose fraction recovery from corncob, Bioresource Technology 100 (2009) 2842-2848.[24] A. Hammerschmidt, N. Boukis, E. Hauer, U. Galla, E. Dinjus, B. Hitzmann, T. Larsen, S.D. Nygaard, Catalytic conversion of waste biomass by hydrothermal treatment, Fuel 90 (2011) 555-562.[25] D.C. Elliott, T.R. Hart, A.J. Schmidt, G.G. Neuenschwander, L.J. Rotness, M.V. Olarte, A.H. Zacher, K.O. Albrecht, R.T. Hallen, J.E. Holladay, Process development for hydrothermal liquefaction of algae feedstocks in a continuous-flow reactor, Algal Research 2 (2013) 445-454.[26] D.L. Barreiro, S. Riede, U. Hornung, A. Kruse, W. Prins, Hydrothermal liquefaction of microalgae: effect on the product yields of the addition of an organic solvent to separate the aqueous phase and the biocrude oil, Algal Research 12 (2015) 206-212.[27] D. Xu, P.E. Savage, Characterization of biocrudes recovered with and without solvent after hydrothermal liquefaction of algae, Algal Research 6 (2014) 1-7.[28] D.L.p. Barreiro, B.R. Gómez, U. Hornung, A. Kruse, W. Prins, Hydrothermal liquefaction of microalgae in a continuous stirred-tank reactor, Energy & Fuels 29 (2015) 6422-6432.[29] D.C. Elliott, T.R. Hart, G.G. Neuenschwander, L.J. Rotness, G. Roesijadi, A.H. Zacher, J.K. Magnuson, Hydrothermal processing of macroalgal feedstocks in continuous-flow reactors, ACS Sustainable Chemistry & Engineering 2 (2013) 207-215.[30] Y. Zhu, K.O. Albrecht, D.C. Elliott, R.T. Hallen, S.B. Jones, Development of hydrothermal liquefaction and upgrading technologies for lipid-extracted algae conversion to liquid fuels, Algal Research 2 (2013) 455-464.
[31] J. Becker, L.L. Toft, D.F. Aarup, S.R. Villadsen, M. Glasius, S. Iversen, B.B. Iversen, A high temperature, high pressure facility for controlled studies of catalytic activity under hydrothermal conditions, Energy & Fuels 24 (2010) 2737-2746.[32] P. Biller, B.K. Sharma, B. Kunwar, A.B. Ross, Hydroprocessing of bio-crude from continuous hydrothermal liquefaction of microalgae, Fuel 159 (2015) 197-205.[33] Y. He, X. Liang, C. Jazrawi, A. Montoya, A. Yuen, A.J. Cole, N. Neveux, N.A. Paul, R. de Nys, T. Maschmeyer, Continuous hydrothermal liquefaction of macroalgae in the presence of organic co-solvents, Algal Research 17 (2016) 185-195.[34] K.O. Albrecht, Y. Zhu, A.J. Schmidt, J.M. Billing, T.R. Hart, S.B. Jones, G. Maupin, R. Hallen, T. Ahrens, D. Anderson, Impact of heterotrophically stressed algae for biofuel production via hydrothermal liquefaction and catalytic hydrotreating in continuous-flow reactors, Algal Research 14 (2016) 17-27.[35] A.R. Suesse, G.A. Norton, J. van Leeuwen, Pilot-Scale Continuous-Flow Hydrothermal Liquefaction of Filamentous Fungi, Energy & Fuels 30 (2016) 7379-7386.[36] B. Patel, K. Hellgardt, Hydrothermal upgrading of algae paste in a continuous flow reactor, Bioresource technology 191 (2015) 460-468.[37] A.J. Mørup, J. Becker, P.S. Christensen, K. Houlberg, E. Lappa, M. Klemmer, R.B. Madsen, M. Glasius, B.B. Iversen, Construction and commissioning of a continuous reactor for hydrothermal liquefaction, Industrial & Engineering Chemistry Research 54 (2015) 5935-5947.[38] J. Billing, D. Anderson, R. Hallen, T. Hart, G. Maupin, A. Schmidt, D.C. Elliott, Design, Fabrication, and Testing of the Modular Hydrothermal Liquefaction System (MHTLS), TCS 2016 Symposium on Thermal and Catalytic Sciences for Biofuels and Biobased ProductsChapel Hill, NC, 2016.[39] Å. Sundqvist, A. Sellgren, G. Addie, Slurry pipeline friction losses for coarse and high density industrial products, Powder technology 89 (1996) 19-28.[40] K. Ekambara, R.S. Sanders, K. Nandakumar, J.H. Masliyah, Hydrodynamic simulation of horizontal slurry pipeline flow using ANSYS-CFX, Industrial & Engineering Chemistry Research 48 (2009) 8159-8171.[41] D. Kaushal, T. Thinglas, Y. Tomita, S. Kuchii, H. Tsukamoto, CFD modeling for pipeline flow of fine particles at high concentration, International Journal of Multiphase Flow 43 (2012) 85-100.[42] T. Nabil, I. El-Sawaf, K. El-Nahhas, Computational fluid dynamics simulation of the solid-liquid slurry flow in a pipeline, Proc. 17th International Water Technologies Conference IWTC17, 2013, pp. 5-7.[43] K. Wilson, R. Sanders, R. Gillies, C. Shook, Verification of the near-wall model for slurry flow, Powder Technology 197 (2010) 247-253.[44] M. Swamy, N.G. Díez, A. Twerda, Numerical modelling of the slurry flow in pipelines and prediction of flow regimes, WIT Transactions on Engineering Sciences 89 (2015) 311-322.[45] D. Kaushal, Y. Tomita, Solids concentration profiles and pressure drop in pipeline flow of multisized particulate slurries, International journal of multiphase flow 28 (2002) 1697-1717.[46] V. Seshadri, R.C. Malhotra, Concentration and Size Distribution of Solids in Slurry Pipeline, Proc. 11th National Conf. on Fluid Mechanics and Fluid PowerIndia, 1982, pp. 110-123.
[47] R. Rozenblit, M. Simkhis, G. Hetsroni, D. Barnea, Y. Taitel, Heat transfer in horizontal solid–liquid pipe flow, International journal of multiphase flow 26 (2000) 1235-1246.[48] R. Sumner, M. McKibben, C. Shook, Concentration and velocity distribution in turbulent vertical slurry flow, J. Solid Liquid Flow 2 (1991) 33-42.[49] A. Kumar, D.R. Kaushal, U. Kumar, Bend pressure drop experiments compared with FLUENT, Proceedings of the Institution of Civil Engineers-Engineering and Computational Mechanics 161 (2008) 35-42.[50] K. Ramisetty, Prediction of Concentration Profiles of a Particle-Laden Slurry Flow in Horizontal and Vertical Pipes, Oklahoma State University, 2010.[51] G. Brown, Erosion prediction in slurry pipeline tee-junctions, Applied mathematical modelling 26 (2002) 155-170.[52] H. Zhang, Y. Tan, D. Yang, F.X. Trias, S. Jiang, Y. Sheng, A. Oliva, Numerical investigation of the location of maximum erosive wear damage in elbow: Effect of slurry velocity, bend orientation and angle of elbow, Powder Technology 217 (2012) 467-476.[53] G. Brown, The Darcy-Weisbach Equation, Oklahoma State University–Stillwater (2000).[54] D. Kaushal, Y. Tomita, Comparative study of pressure drop in multisized particulate slurry flow through pipe and rectangular duct, International Journal of Multiphase Flow 29 (2003) 1473-1487.[55] R.G. Gillies, C.A. Shook, Modelling high concentration settling slurry flows, The Canadian journal of chemical Engineering 78 (2000) 709-716.[56] J. Schaan, R.J. Sumner, R.G. Gillies, C.A. Shook, The effect of particle shape on pipeline friction for Newtonian slurries of fine particles, The Canadian Journal of Chemical Engineering 78 (2000) 717-725.[57] F.M. White, Fluid Mechanics Fourth Edition, McGraw-hill, New York City, NY, U.S.A., 2017.[58] P.R. Patwardhan, M.T. Timko, C.A. Class, R.E. Bonomi, Y. Kida, H.H. Hernandez, J.W. Tester, W.H. Green, Supercritical water desulfurization of organic sulfides is consistent with free-radical kinetics, Energy & Fuels 27 (2013) 6108-6117.[59] A. Kruse, C. Lietz, Measurement of Residence Time Distribution in Hot Compressed Water–First Results Obtained in a Helical Tube, Chemical engineering & technology 26 (2003) 1119-1122.[60] P. Viitanen, Tracer experiments in a research tunnel of a repository for low-and medium-active nuclear waste, Nuclear Instruments and Methods in Physics Research Section A: Accelerators, Spectrometers, Detectors and Associated Equipment 353 (1994) 546-549.[61] K.S. Lieball, Numerical investigations on a transpiring wall reactor for supercritical water oxidation, Swiss Federal Institute of Technology Zurich, 2003, pp. 101-103.[62] K.-Q. Tran, Fast hydrothermal liquefaction for production of chemicals and biofuels from wet biomass–The need to develop a plug-flow reactor, Bioresource technology 213 (2016) 327-332.[63] C.E. Brewer, K. Mallick, F. Cheng, Z. Cui, S.M.H. Gedara, M. Karbakhshravari, T.M. Schaub, U. Jena, N. Nirmalakhandan, Hydrothermal Liquefaction of Galdieria sulphuraria Grown on Municipal Wastewater, 2017 ASABE Annual International Meeting, American Society of Agricultural and Biological Engineers, 2017, pp. 1.
[64] H.S. Fogler, Essentials of chemical reaction engineering, Fourth ed., Pearson Education, Boston, 2008.[65] S. Van Wychen, L. Laurens, Determination of Total Solids and Ash in Algal Biomass: Laboratory Analytical Procedure (LAP), National Renewable Energy Laboratory (NREL), Golden, CO., 2013.[66] J.L. Faeth, P.J. Valdez, P.E. Savage, Fast hydrothermal liquefaction of Nannochloropsis sp. to produce biocrude, Energy & Fuels 27 (2013) 1391-1398.[67] F. Cheng, Z. Cui, K. Mallick, N. Nirmalakhandan, C.E. Brewer, Hydrothermal liquefaction of high-and low-lipid algae: Mass and energy balances, Bioresource technology 258 (2018) 158-167.[68] F. Cheng, Z. Cui, L. Chen, J. Jarvis, N. Paz, T. Schaub, N. Nirmalakhandan, C.E. Brewer, Hydrothermal liquefaction of high-and low-lipid algae: Bio-crude oil chemistry, Applied Energy 206 (2017) 278-292.[69] S.B. Jones, Y. Zhu, D.B. Anderson, R.T. Hallen, D.C. Elliott, A.J. Schmidt, K.O. Albrecht, T.R. Hart, M.G. Butcher, C. Drennan, Process design and economics for the conversion of algal biomass to hydrocarbons: whole algae hydrothermal liquefaction and upgrading, Pacific Northwest National Laboratory (PNNL), Richland, WA (US), 2014.
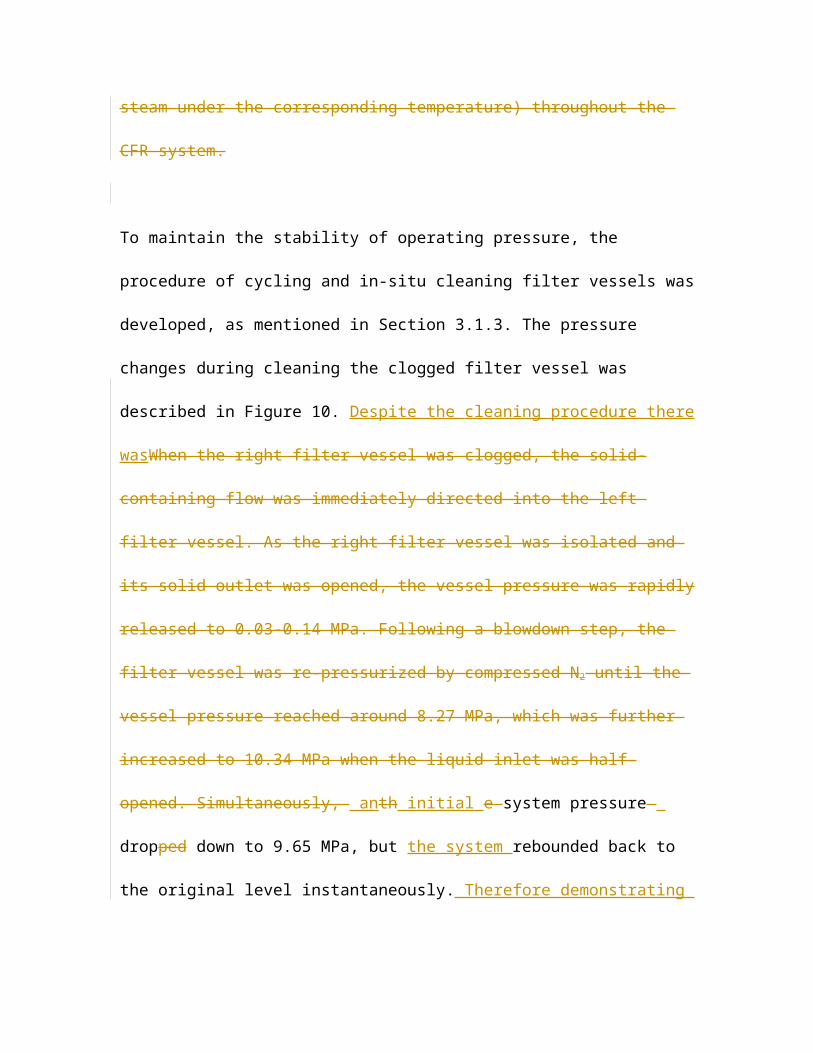
Tables and Figures
Table 1 Energy consumption in the lower-zone heater of PFR.Operating condition window in the lower zone of PFR 350 °C Flow
Tinlet (Temperature at the bottom of the lower zone) (°C) a 133Toutlet (Temperature at the top of the lower zone) (°C) a 350Theoretical power for heating algae (W) b 2150Theoretical energy loss flow toward atmosphere (W) b 50.1Theoretical total power for heating biomass (W) b 2200Real energy loss flow toward atmosphere (W) b >566Real total power for heating biomass (W) >2766
a Obtained from the experimental data. b Equation details were found in the supplemental information, and physical data of water were obtained from http://webbook.nist.gov/chemistry/fluid/.
Table 2 Reynolds number and the terminal flow rate throughout the CFR system under a reaction temperature of 300 °C. Feed supply system
before pumpBetween pump and preheater
Between preheater and reactor
Lower part of reactor
Middle part of reactor
I.D. inch 0.81 0.125 0.125 1.25 1.25Re b 1727 11272 26442 8209 8209F mL/min a, c 245.77 5.85 5.85 N.A. N.A. Upper part of
reactorBetween reactor and filters
Between filters and cooler
Cooler After cooler
I.D. inch 1.25 0.2 0.0833 0.152 0.125Re b 8209 49292 82001 30573 21078F mL/min a, c N.A. N.A. No particles No particles No particles
a Terminal flow rate. Assume the particle size before the plug-flow reactor is 20 µm, while the physical data of particles after the preheater were unavailable, due to unknown density of HTL solids. b Physical data of water were obtained from http://webbook.nist.gov/chemistry/fluid/.c Physical data of algal slurry were obtained from the experimental measurement, as shown in Table S1.
Table 3 The low limit of flow rate under different solids loadings and preheater temperatures.Solids loading wt.% Preheater temperature
°CLow limit of flow rate mL/min
2.8 133 131.41165 133.03
4.2 133 135.74142 139.04
Table 4 Previous experimental data associated with the RTD of flow.
Ref. Reactor size mm F mL/min Variance Mean time s Expected time s Discrepancy % Pe
Kruse et al. [59] 6 m × 2.1 mm I.D.27.75 12679 40.6 33.3 21.92 N.A.21.82 58536 54.1 42.4 27.59 N.A.10.62 110 93.6 87 7.59 N.A.
Mørup et al. [37] 1.2 m × 5.17-25.4 mm I.D. 6-24 311364 33.4 (min) 24.2 (min) 38.02 28.02
In this study, 25 °C 1.83 m × 31.75 mm I.D. 150 86 25.5 (min) 25.7 (min) 0.54 18.44
In this study, 350 °C
1.83 m × 31.75 mm I.D. 150 185 31.4 (min) 25.7 (min) 22.22 13.77
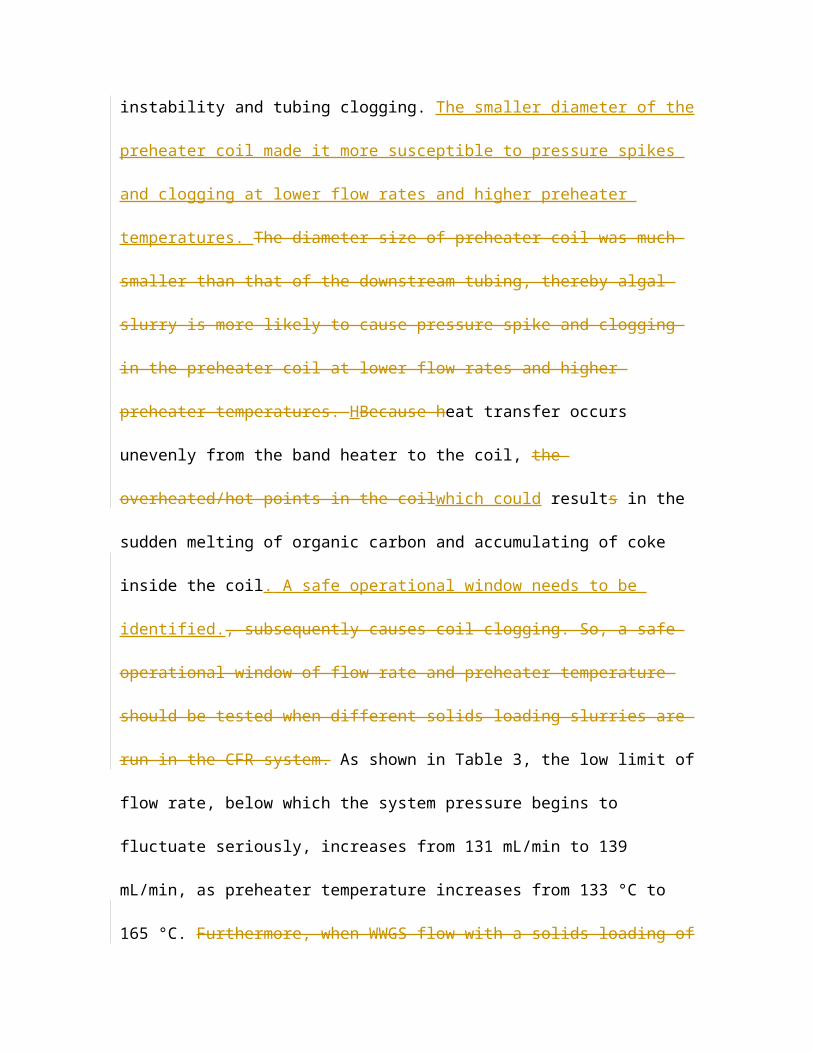
Table 5 Elemental composition of algal feedstocks.Algal Species WWPC WWGSElemental Analysis wt.% a
Carbon 34.5 ± 0.2 29.0 ± 0.1Hydrogen 5.3 ± 0.1 4.2 ± 0.2Nitrogen 5.6 ± 0.1 3.4 ± 0.0Sulfur 1.4 ± 0.0 1.1 ± 0.1Oxygen b 18.6 ± 0.3 20.3 ± 0.3H/C molar ratio 1.83 1.75O/C molar ratio 0.40 0.52N/C molar ratio 0.14 0.10
a Dry basis. b By difference.
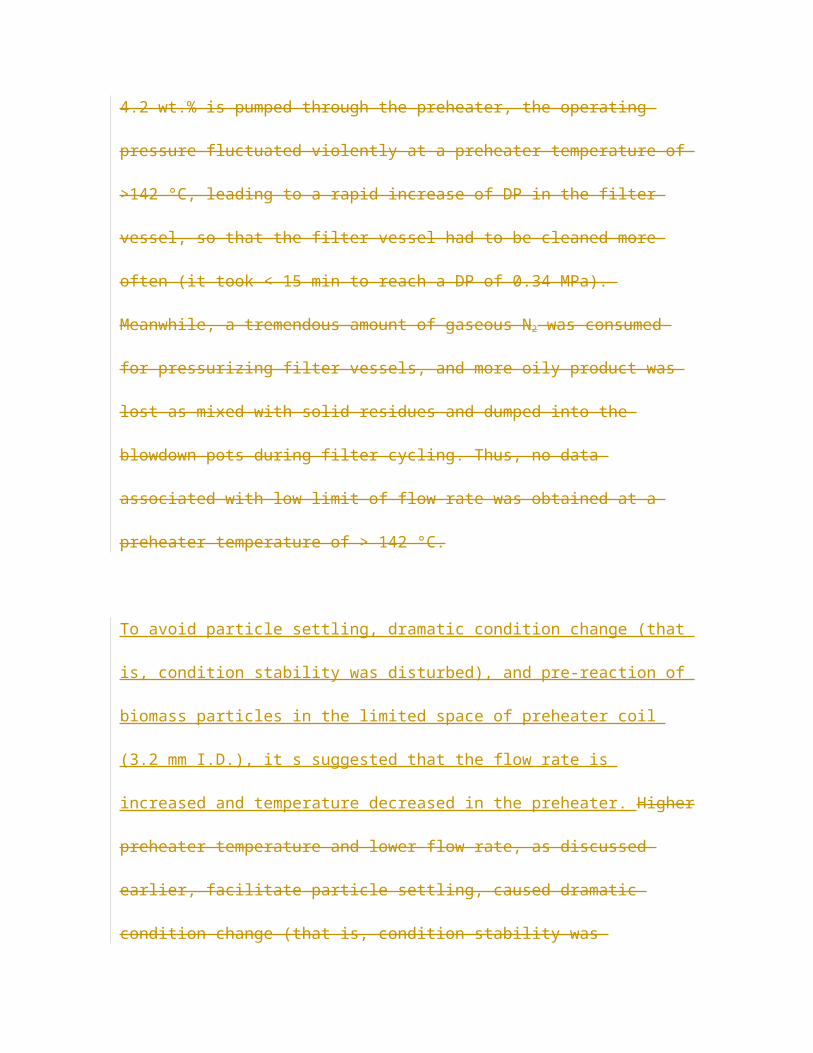
Table 6 Carbon and nitrogen balances in the HTL liquid products derived from 3 wt.% WWGS under 325 °C and 13.8 MPa, with a flow rate of 152 mL/min and a theoretical residence time of 3.2 min.Time min TOC mg/L TN mg/L Carbon
yield wt.%Nitrogen yield wt.%
N/C molar ratio
30 1086 304 12.42 29.88 0.2450 1985 451 23.58 46.16 0.1970 2814 551 33.08 55.80 0.1790 2679 585 31.06 58.40 0.19110 2825 625 32.47 61.76 0.19130 3021 607 35.04 60.58 0.17150 2996 577 34.58 57.28 0.16170 3179 584 36.69 57.97 0.16190 3230 567 37.09 56.03 0.15210 3374 576 39.02 57.30 0.15
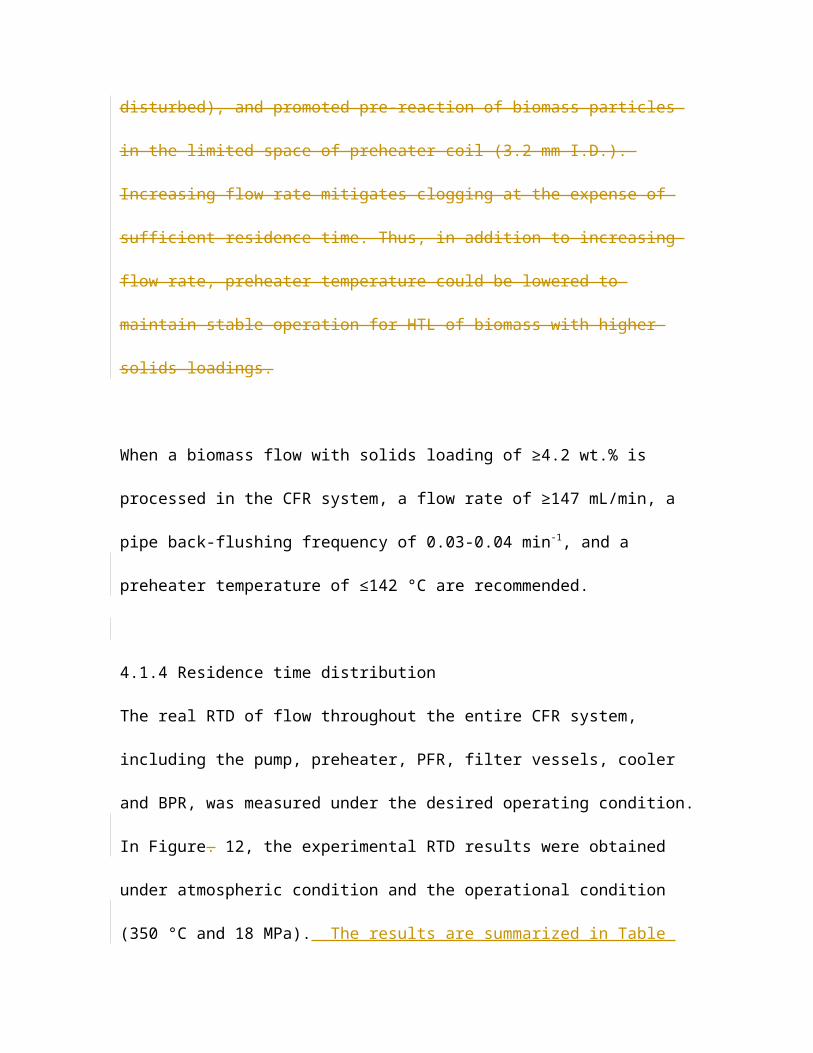
Table 7 Carbon and nitrogen balances in the HTL liquid products derived from 5 wt.% WWGS under 350 °C and 17 MPa, with a flow rate of 155 mL/min and a theoretical residence time of 6.2 min.Time min TOC mg/L TN mg/L Carbon
yield wt.%Nitrogen yield wt.%
N/C molar ratio
30 1827 393 12.82 23.73 0.1850 3918 626 26.72 36.74 0.1470 3910 637 27.07 37.98 0.1490 4082 645 29.62 40.29 0.14110 4198 685 28.41 39.87 0.14130 4403 694 31.44 42.64 0.14150 4564 710 31.67 42.40 0.13170 4553 691 31.69 41.37 0.13190 4566 710 32.59 43.64 0.13210 4434 693 31.59 42.47 0.13
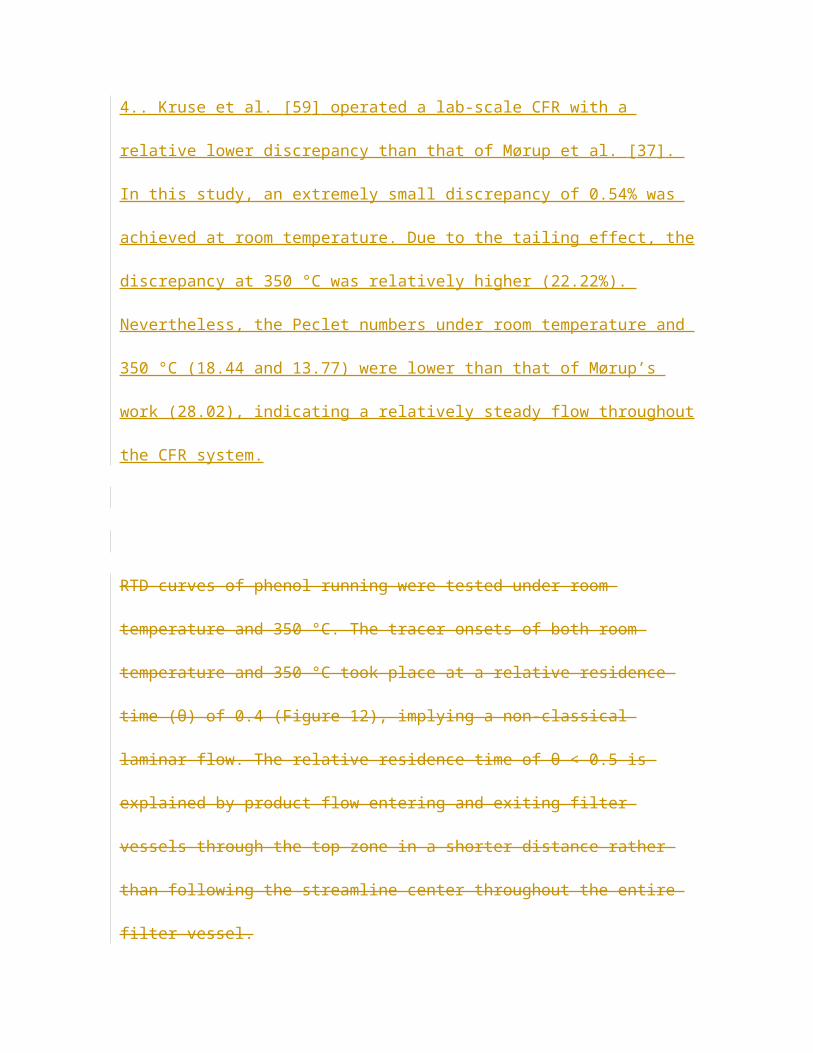
Table 8 Carbon and nitrogen balances in the HTL liquid products derived from 5 wt.% WWPC microalgae under 350 °C and 17 MPa, with a flow rate of 155 mL/min and a theoretical residence time of 9.3 min.Time min TOC mg/L TN mg/L Carbon
yield wt.%Nitrogen yield wt.%
N/C molar ratio
105 2043.47 369.90 11.38 12.78 0.16115 4174.47 649.06 20.74 20.00 0.13125 3575.78 556.76 19.05 18.40 0.13135 4623.10 715.69 24.62 23.64 0.13145 4361.81 705.45 23.83 23.90 0.14155 5194.37 808.29 26.54 25.62 0.13165 4987.33 794.22 26.40 26.08 0.14175 5377.68 738.87 28.11 23.95 0.12185 5085.43 819.26 26.81 26.79 0.14195 5347.28 836.02 28.27 27.42 0.13
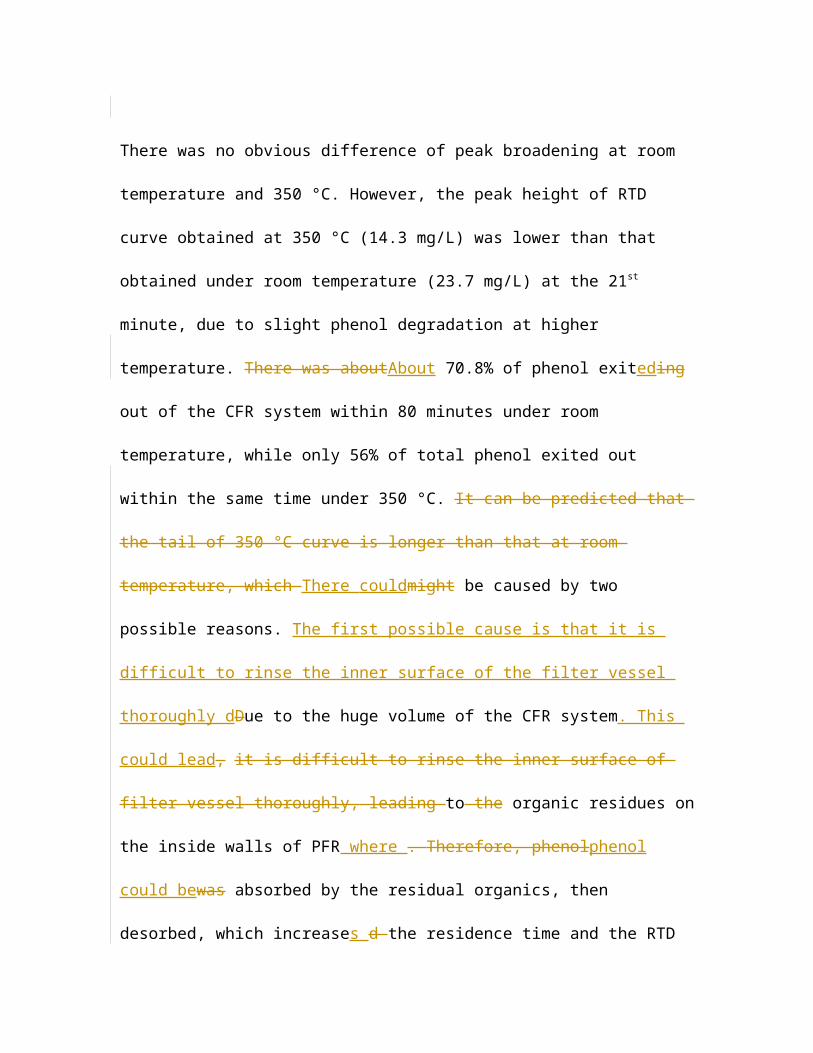
Table 9 pH and density of HTL liquids produced from HTL of microalgae in the CFR system.Experiment pH value of HTL liquid
productDensity of HTL liquid product g/mL
HTL of 3% WWGS 7.52 ± 0.01 0.991 ± 0.003HTL of 5% WWGS 7.65 ± 0.01 0.996 ± 0.003HTL of 5% WWPC 7.40 ± 0.02 0.990 ± 0.001
Table 10 The concentration of inorganic elements in the algal feedstock, HTL liquid products, and HTL solid products.Element
ConcentrationWWPC Feedstock mg/kg
5% WWPC HTL Liquid Product mg/L
5% WWPC HTL Solid Product mg/kg
WWGS Feedstock mg/kg
3% WWGS HTL Liquid Product mg/L
5% WWGS HTL Liquid Product mg/L
Al 18.47 ND a 33.68 7.132 ND a ND a
Ba 0.0823 0.0375 0.1423 0.0934 0.0365 0.0462Cr 0.0507 ND a 0.0934 0.0186 ND a ND a
Fe 31.84 ND a 54.07 5.469 ND a ND a
Mn 0.6077 0.0145 1.251 0.843 0.0106 0.0237Mo ND a ND a 0.0105 0.0123 ND a ND a
Ni 0.0136 ND a 0.0337 0.0106 ND a 0.0042Zn 0.2605 ND a 1.552 3.055 0.0015 ND a
Ca 76.38 2.839 181 138.2 5.756 8.453Mg 105.5 9.922 188.6 73.02 1.076 9.535P 16.25 0.0983 32.14 7.488 ND a ND a
Sr 0.6349 0.088 1.196 0.4084 0.0577 0.0806K 2.323 4.55 0.8802 13.05 17.44 26.49Na 2.099 4.104 1.049 33.03 49.37 73.44S 16.45 6.904 13.81 10.85 3.06 4.85
a Non-Detect < Minimum Detection Limit.
Figure 1. Schematic diagram of the pilot-scale CFR system.The auxiliary system consists of the following systems: safety and protection system (red solid lines), gas supply system (black solid lines), and electrical controlling system (red and blue dash lines)
Figure 2. The pictures of the pilot-scale CFR.

Figure 3. The components of the supply system modified.
Figure 4. The schematic diagram of filtration and in-situ cleaning of the dual filter system.
Figure 5. Schematic diagrams of (a) the filter vessels and (b) the blowdown pots.
Figure 6. The inner structure of the cooler.
Figure 7. The temperature and pressure profiles of purified water flow passing through the entire CFR system under a reaction temperature of 300 ºC

Figure 8. The reacting system and the temperature data were obtained from HTL of WWT algae under a reaction temperature of 350 °C.
Figure 9. The pressure profile of purified water flow passing through the entire CFR system and lower pressure limit under 300 ºC.
Figure 10. The pressure profiles of the entire CFR system and the right (R) filter vessel during the period of switching and cleaning under 300 °C and 10.34 MPa.
Figure 11. Impacts of back flushing frequency and flow rate on real solids loading of algal slurries with theoretical solids loadings of a) 2.8 wt.% and b) 4.2 wt.%.
Figure 12. The RTD curves of phenol in the CFR system under room temperature and 350 °C.

Figure 13. SEM of a) WWPC algal feedstock and b) HTL solid residue obtained from HTL of 5 wt.% WWPC algal slurry under 350 °C and 17 MPa.
Figure 14. HTL liquid product obtained from HTL of 5% WWPC under 350 °C and 17 MPa.