1 vote 22: safety and security briefing to the portfolio committee for safety and security 14 may...
TRANSCRIPT

1
Vote 22: Safety and Security
Briefing to the Portfolio Committee for Safety
and Security
14 May 2008

2
Index
Strategic overview MTEF period 2008/09 to 2010/11
allocation: Figures and Facts Prominent aspects Summary

3
Strategic Direction of the SAPS
The SAPS Strategic Plan 2005 to 2010 provides the strategic direction of the SAPS for a five-year period while the Annual Performance Plan, extrapolated from the Strategic Plan 2005 to 2010, indicates the priorities and objections that the SAPS will focus on during a particular financial year. The Annual Performance Plan for the SAPS for 2007/2008 therefore extends the policing priorities and objectives described in the Annual Performance Plan for 2007/2008, within the strategic direction provided by the Strategic Plan 2005/2010
The SAPS Strategic Plan 2005 –2010 covers a five year period
The most important Constitutional, legislative, functional and policy mandates are summarized as follows Constitution of the Republic of
South Africa, 1996 (Act No 108 of 1996):
South African Police Service Act, 1995 (Act No 68 of 1995)
Public Finance Management Act, 1999 (Act No 1 of 1999)
Public Service Regulations, 2001 Treasury Guidelines, 2002 National Crime Combating
Strategy (NCCS:2000) Goals and objectives of the JCPS
Cluster Initiatives of the Integrated Justice
System
4
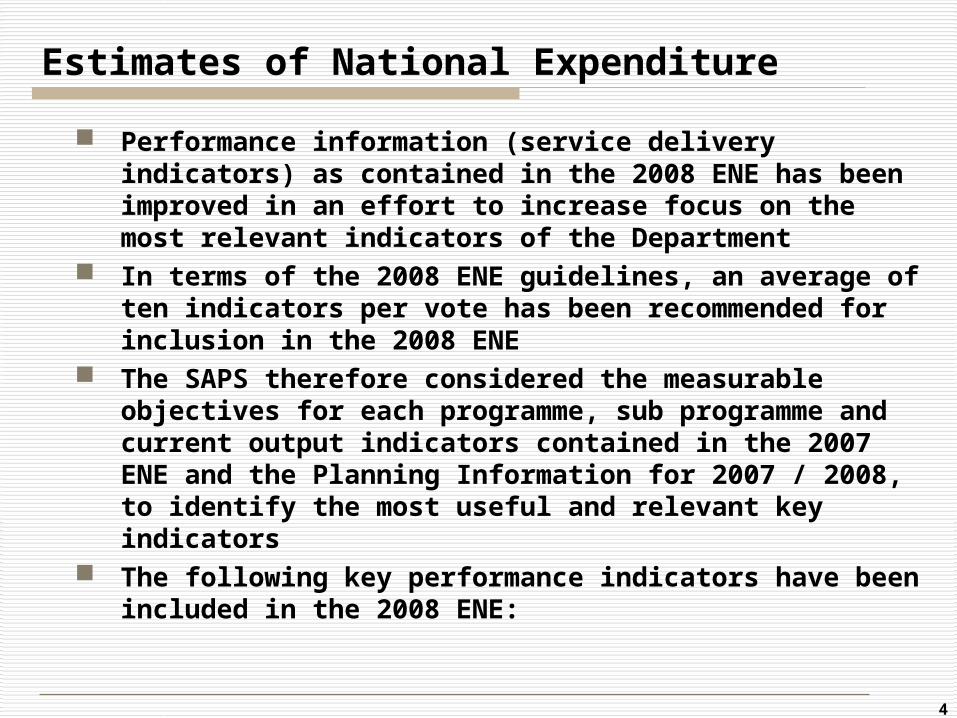
Estimates of National Expenditure
Performance information (service delivery indicators) as contained in the 2008 ENE has been improved in an effort to increase focus on the most relevant indicators of the Department
In terms of the 2008 ENE guidelines, an average of ten indicators per vote has been recommended for inclusion in the 2008 ENE
The SAPS therefore considered the measurable objectives for each programme, sub programme and current output indicators contained in the 2007 ENE and the Planning Information for 2007 / 2008, to identify the most useful and relevant key indicators
The following key performance indicators have been included in the 2008 ENE:
5
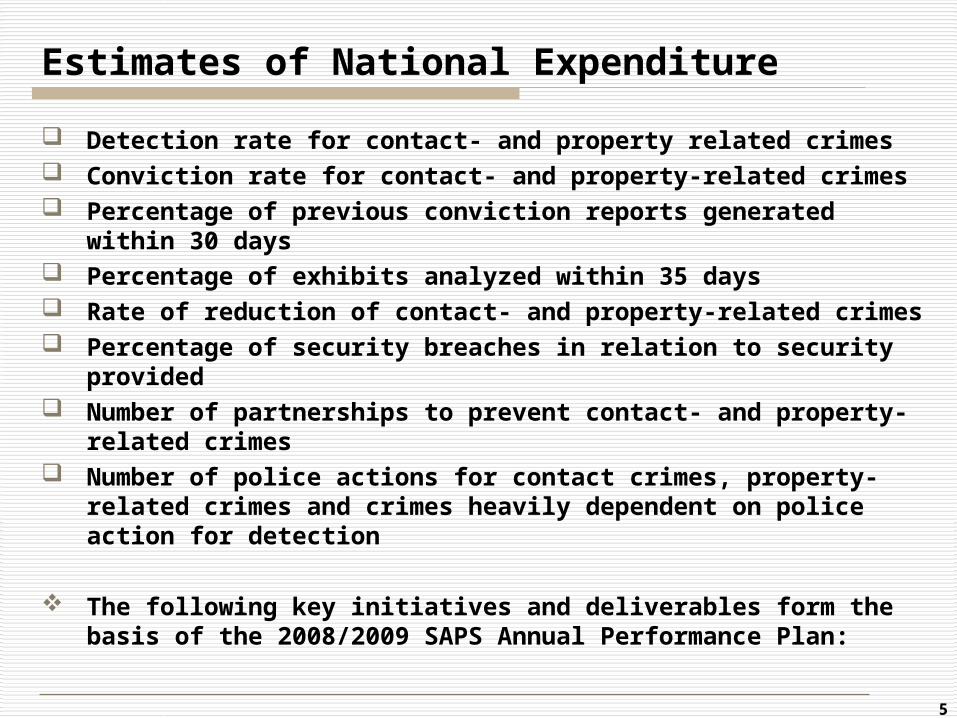
Estimates of National Expenditure
Detection rate for contact- and property related crimes Conviction rate for contact- and property-related crimes Percentage of previous conviction reports generated within 30
days Percentage of exhibits analyzed within 35 days Rate of reduction of contact- and property-related crimes Percentage of security breaches in relation to security provided Number of partnerships to prevent contact- and property-related
crimes Number of police actions for contact crimes, property-related
crimes and crimes heavily dependent on police action for detection
The following key initiatives and deliverables form the basis of the 2008/2009 SAPS Annual Performance Plan:

6
Key Initiatives and Deliverables Programme 1 – Administration
Provide for developing departmental policy and managing the department, including administrative support
Indicator TargetDevelopment of an annual HR Plan for the 2008 / 2009 financial year
Develop an annual HR Plan for the 2008 / 2009 financial year by 31 May 2008
Percentage Employment Equity ration of the workplace Maintained Employment Equity ratios of 75/25
Percentage of employees using the performance management systems
95% of employees utilised the performance management systems
Percentage of training provided in terms of the Training Provisioning Plan (TPP)
90% of Operational Training provided for in the TPP80% of Support Training provided for in the TPP90% of Management and Leadership Development Training provided for in the TPP95% of entry level Training provided for in the TPP
Number of reported disciplinary cases finalized Finalize 70% of reported disciplinary cases within 60 calender days (new Regulations only)
Ratio of number of successful civil claims vs personnel strength of the Service
Decreased by 5% the ratio of number of successful civil claims vs personnel strength of the Service (to be measured over the next 3-5 years)
Percentage of employees reached during reactive and proactive EAS programmes.
Provide support in 100% of instances where requests for support for members and their families occurred (reactive)Exposed 30% of SAPS personnel establishment to proactive EAS interventions

7
Programme 1 – Administration
Provide for developing departmental policy and managing the department, including administrative support
Indicator Target
Finalise and approve SAPS structures Finalise organisational structures, functional analysis and post structures for all divisions, provinces and stations by 2009-03-31
Personnel and resource expenditure versus operational expenditure
Maintain expenditure ratio at 73/27% for compensation / operational expenditure
Implementation of capital investment, asset management and maintenance plan.
To be benchmarked over the next two years.
Extent of the implementation of the SDIP1 Established Service Delivery Improvement Plans and Charters all divisional-, and provincial offices and at 169 High Contact Crime Stations by 31 March 2008.
Extent of the implementation of Risk Management Established Risk Management at all Divisional and Provincial offices and the 169 High Contact Crime stations by 31 March 2009.
Extent of the implementation of the Corruption and Fraud Prevention plan
Integration of Corruption and Fraud Prevention Plan into operational plans at all levels by March 2009
Number of cases (charges) of corruption against police officials in terms of the Combating of Corrupt Activities Act (Act 12 of 2004) in relation to the personnel strength of the SAPS
To be benchmarked in 2008 / 2009
(1) Please note that this priority has been included under this financial programme but is applicable to all financial programmes and sub-programmes

8
Programme 2 : Visible Policing
Indicator Target
Purpose: Enable the services at police stations to institute and preserve safety and security and provide specialized interventions for South Africa’s borders
Objective: Discourage all crimes, through providing a proactive and responsive policing service that will prevent the priority crimes from increasing
Output : Visible Crime Deterrence
Number of partnerships to prevent contact- and property-related crimes
Initiatives established at the 169 High Contact Crime Stations and other stations2
Number of police actions for contact crimes, property-related crimes and crimes dependent on police action for detection.
Actions undertaken at the 169 High Contact Crime Stations and other stations-Recovery of 85% stolen/lost firearmsRecovery of 46% stolen/robbed vehiclesMaintain/increase quantity of drugs seized
Number of high contact crime stations where Sector Policing is implemented
Sector policing implemented at 169 High Contact Crime Stations
Rate of reduction of contact crimes Contact crimes to be reduced by 7% per annum
Number of: Escapes from police custodyAttacks on police officialsKilling of police officialsActs of violence against the farming community
Decrease in 2008 / 20093
Extent of crime at South Africa’s land, sea and air borderlines Maintain or increase4
Number of interventions in medium-risk operationsNumber of interventions in high-risk operations
Maintain or increase5
(2) Partnerships will depend on the occurrence of crime in a particular area. (3-5) These cannot be measured as a proportion of the total incidence of the crime because for example illegal firearms, stolen vehicles, drugs and goods move both in out of the country illegally can not be determined. The number of interventions in high and medium risk operations are subjected to various circumstances and can therefore also not be determined.

9
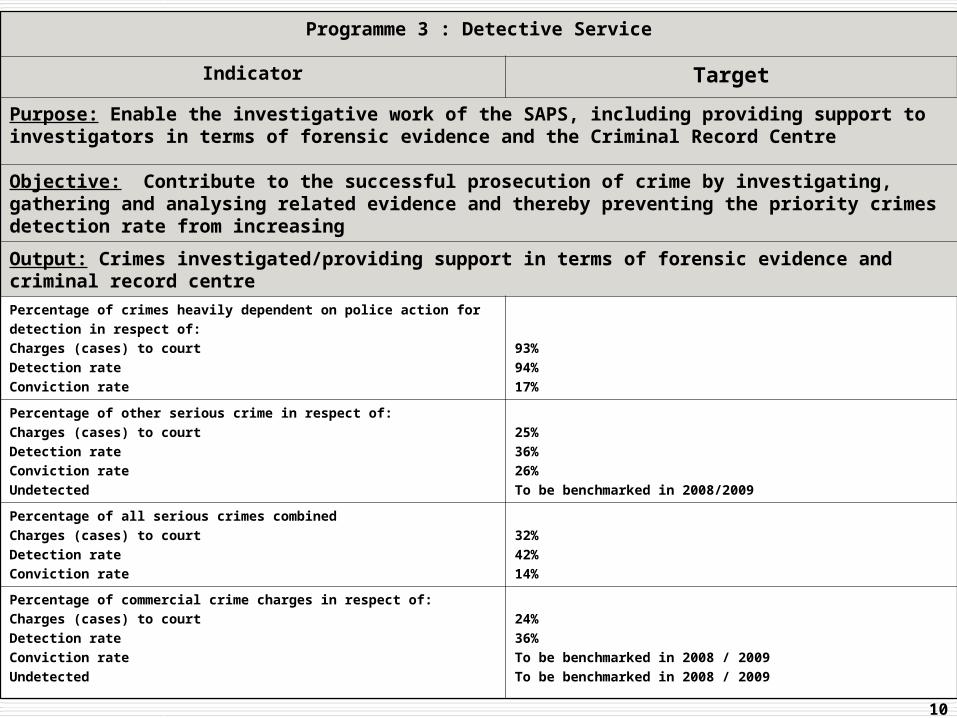
Programme 3 : Detective Service
Indicator Target
Purpose: Enable the investigative work of the SAPS, including providing support to investigators in terms of forensic evidence and the Criminal Record Centre
Objective: Contribute to the successful prosecution of crime by investigating, gathering and analysing related evidence and thereby preventing the priority crimes detection rate from increasing
Output: Crimes investigated/providing support in terms of forensic evidence and criminal record centre
Percentage of contact crime inrespect of-Charges (cases) to courtDetection rateConviction rateUndetected
39%53%19%To be benchmarked in 2008 / 2009
Percentage of contact-related crime inrespect of-Charges (cases) to courtDetection rateConviction rateUndetected
29%44%16%To be benchmarked in 2008 / 2009
Percentage of property-related in respect of:Charges (cases) to courtDetection rateConviction rateUndetected
11%15%13%To be benchmarked in 2008 / 2009
10
Programme 3 : Detective Service
Indicator Target
Purpose: Enable the investigative work of the SAPS, including providing support to investigators in terms of forensic evidence and the Criminal Record Centre
Objective: Contribute to the successful prosecution of crime by investigating, gathering and analysing related evidence and thereby preventing the priority crimes detection rate from increasing
Output: Crimes investigated/providing support in terms of forensic evidence and criminal record centrePercentage of crimes heavily dependent on police action for detection in respect of:Charges (cases) to courtDetection rateConviction rate
93%94%17%
Percentage of other serious crime in respect of:Charges (cases) to courtDetection rateConviction rateUndetected
25%36%26%To be benchmarked in 2008/2009
Percentage of all serious crimes combinedCharges (cases) to courtDetection rateConviction rate
32%42%14%
Percentage of commercial crime charges in respect of:Charges (cases) to courtDetection rateConviction rateUndetected
24%36%To be benchmarked in 2008 / 2009To be benchmarked in 2008 / 2009
11
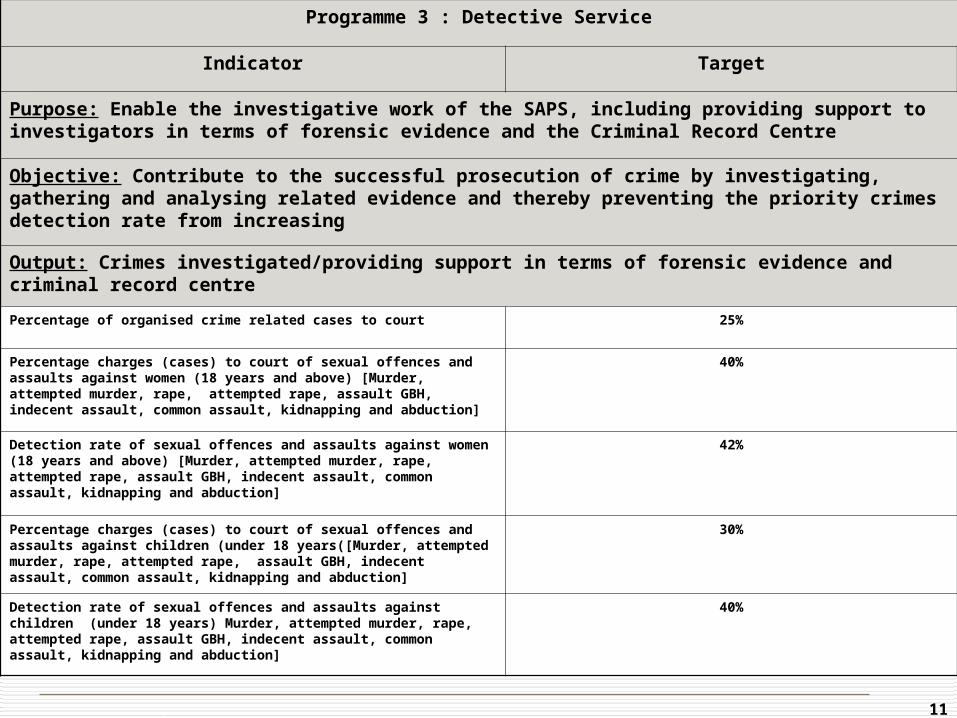
Programme 3 : Detective Service
Indicator Target
Purpose: Enable the investigative work of the SAPS, including providing support to investigators in terms of forensic evidence and the Criminal Record Centre
Objective: Contribute to the successful prosecution of crime by investigating, gathering and analysing related evidence and thereby preventing the priority crimes detection rate from increasing
Output: Crimes investigated/providing support in terms of forensic evidence and criminal record centre
Percentage of organised crime related cases to court 25%
Percentage charges (cases) to court of sexual offences and assaults against women (18 years and above) [Murder, attempted murder, rape, attempted rape, assault GBH, indecent assault, common assault, kidnapping and abduction]
40%
Detection rate of sexual offences and assaults against women (18 years and above) [Murder, attempted murder, rape, attempted rape, assault GBH, indecent assault, common assault, kidnapping and abduction]
42%
Percentage charges (cases) to court of sexual offences and assaults against children (under 18 years([Murder, attempted murder, rape, attempted rape, assault GBH, indecent assault, common assault, kidnapping and abduction]
30%
Detection rate of sexual offences and assaults against children (under 18 years) Murder, attempted murder, rape, attempted rape, assault GBH, indecent assault, common assault, kidnapping and abduction]
40%

12
Programme 3 : Detective Service
Indicator Target
Purpose: Enable the investigative work of the SAPS, including providing support to investigators in terms of forensic evidence and the Criminal Record Centre
Objective: Contribute to the successful prosecution of crime by investigating, gathering and analysing related evidence and thereby preventing the priority crimes detection rate from increasing
Output: Crimes investigated/providing support in terms of forensic evidence and criminal record centre
Detection rate regarding charges (cases) of corruption against police officials in terms of the Prevention and Combating of Corrupt Activities Act (Act 12 of 2004)
To be benchmarked in 2008 / 2009
Conviction rate regarding charges (cases) of corruption against police officials in terms of the Prevention and Combating of Corrupt Activities Act (Act 12 of 2004
To be benchmarked in 2008 / 2009
Percentage of offenders’ previous conviction reports generated within 30 days.
85% within 30 days
Percentage of exhibits analysed within 35 days.
92% analysed within 35 days
13
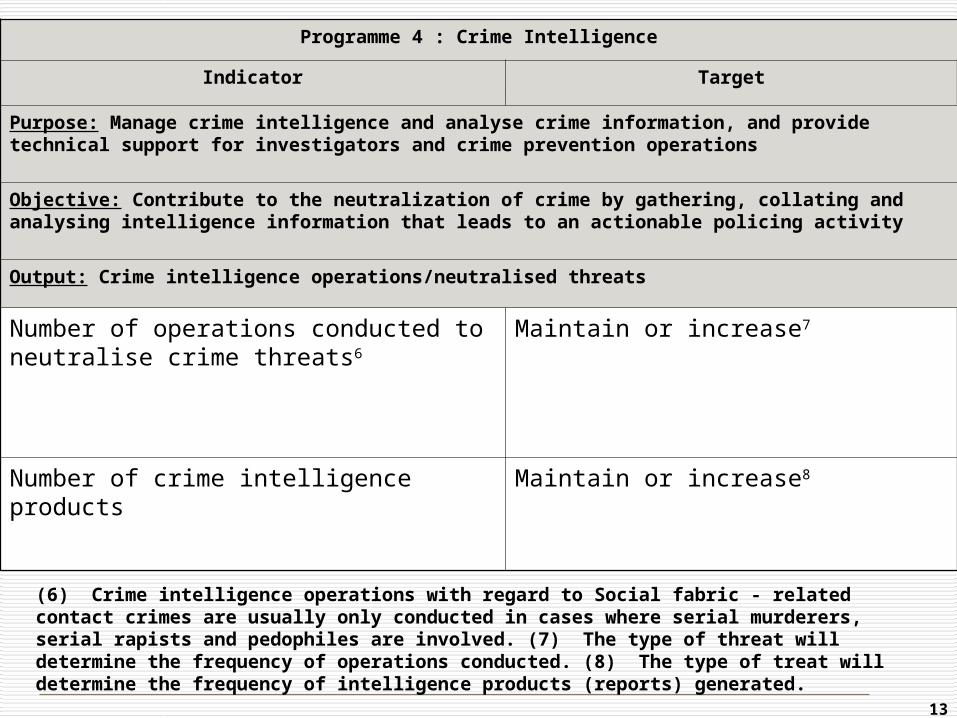
Programme 4 : Crime Intelligence
Indicator Target
Purpose: Manage crime intelligence and analyse crime information, and provide technical support for investigators and crime prevention operations
Objective: Contribute to the neutralization of crime by gathering, collating and analysing intelligence information that leads to an actionable policing activity
Output: Crime intelligence operations/neutralised threats
Number of operations conducted to neutralise crime threats6
Maintain or increase7
Number of crime intelligence products Maintain or increase8
(6) Crime intelligence operations with regard to Social fabric - related contact crimes are usually only conducted in cases where serial murderers, serial rapists and pedophiles are involved. (7) The type of threat will determine the frequency of operations conducted. (8) The type of treat will determine the frequency of intelligence products (reports) generated.

14
Programme 5: Protection and Security Services
Indicator Target
Purpose: Provide protection and security services to all identified dignitaries and government interests
Objective: Minimize security violations by protecting foreign and local prominent people and securing strategic interests
Output: Security and policing of VIP's, Ports of entry/exit, rail environment and national key points
Percentage of Security breaches in relation to security provided
Maintain or decrease
Percentage of security breaches in relation to security provided
Safe delivery rate of valuable cargo
Maintain or decrease
89-99% delivery
The extent of crimes at Ports of Entry and Exit Maintain or increase9
Priority crime rate in the railway environment Maintain or decrease
Extent of compliance with institutional framework (see explanation paragraph 7.4.5 (f))
To be benchmarked in 2008 / 2009
(9) This indicator cannot be measured as a proportion of the total incidents of the crime because the extend of illegal firearms, stolen vehicles, drugs and goods that move both in and out of the country illegally cannot be determined.

15
Key Strategic Initiatives
National Crime Combatting Strategy Firearms Strategy Crimes against Women and Children
Strategy Prevention of Attacks on and Killing of
Police Officials Strategy Corruption and Fraud Prevention Strategy Risk Management Strategy Service delivery Improvement Programme

16
Previous year [Background]End-year Reporting – 2007/08
Sections 40 and 65 of the PFMA are applicable Year-end closure – 31 March 2008 Subsequent compilation of Annual Report (07/08)
on performance of Department (Previous ENE and strategic plan are reported on – backward looking)
Annual Report consists of general information, programme performance, report of audit committee, annual financial statements and human resource management information
To be tabled by Minister before 30 September 2008 Legislative oversight to take place regarding
2007/08 Some preliminary indications of departmental
performance i.r.o budget priorities and State of the Nation Address 07/08 are provided herewith

17
Previous year: Preliminary outcomes 2007/08 – Certain indicators
Additional personnel Target 173 120 – Achieved
Vehicle fleet Purchased ± 8 400 vehicles
IJS priorities (SAPS specific and Transversal) R224 million allocated and spent
Bullet-proof vests Paid R98 million in 2007/08 (Last 3 years in
excess of R300 million) Capital Works
Allocation spent Modernization and expansion of equipment Specific detail during legislative oversight

18
Programmes / Items(2008 ENE p. 433 to 446) [Background]
Programmes represent the general purposes (objectives) on which funds are expended
Items represent the estimated expenditure on goods and services required in pursuance of a department’s objectives
Responsibility (centre of financial responsibility) represent the organizational unit entrusted with the task of compiling an estimate and accounting for expenditure against each such estimate

19
PAYMENTS (Items) [Background]
Economic Classification of Payments
Current Payments (Funds directly spent by departments.) Compensation of employees (Salary costs and social contributions e.g
salaries, wages, most allowances, government contributions to pension fund, medical etc.)
Goods and services (Purchasing of goods and services to be used by department excluding capital assets e.g fuel, oil, small tools/equipment, travel, subsistence, communication, uniform etc.)
Transfers and subsidies (Funds transferred to other institutions and individuals. In other words it includes all unrequited payments made by department – “does not receive anything directly in return for the transfer to the other party”) To: *Provinces and municipalities (E.g Regional Service Council Levies and
vehicle lic.) *Departmental agencies (E.g Landing fees of aircraft and
instrument grading – pilots.) *Households (E.g discharge/retirement payouts, death
grants, medical treatment of detainees, injury on duty, civil claims etc.)
Payments for capital assets (Goods that can be used continuously for at least one year and from which future economic benefits or potential are expected to flow.) Buildings and other fixed structures Machinery and equipment above R5 000 (E.g transport and other
equipment.)

20
Spending policy direction 2008/09
Minister of Finance – MTBPS: 30 October 2007 “We will also increase spending on fighting
crime” “Improving the efficacy of police services
and the justice system to make further progress in reducing crime”
Minister of Finance – Budget Speech: 20 February 2008 “Intensifying the fight against crime”
President – State of the Nation Address: 8 February 2008 “…revamping the criminal justice system
to intensify our offensive against crime…”

21
Budget – 2003/04 to 2010/11 (New ENE)Budget – 2003/04 to 2010/11 (New ENE)
R22.7 b
11.3%
R b
illi
on
s
05101520253035404550
R25.4 b
11.9%
R29.3 b
15.3%
R32.5 b
10.9%
R36.4 b
12.0%
R40.4 b
11.2%
R45.3 b
12.0%
R49.4 b
9.0%

22
Nominal growth from 2007/08 (R36,386 billion) to 2010/11 (R49,393 billion) = R13,0 billion (36%)
Average annual nominal growth since 2003/04 – 11,7%
Strong growth mainly reflects the employment of large numbers of personnel, investment in capital assets and improvements in conditions of service
Budget – 2003/04 to 2010/11Budget – 2003/04 to 2010/11

23
New allocations (Over and above)
Categories 2008/09 2009/10 2010/11
R’000 R’000 R’000
Adjusted baseline including the following:
40 453 243 45 320 626 49 393 696
Leases and planned maintenance - 10 000 50 000
Additional policing personnel) - - 530 000
2010 Soccer World Cup - - 640 000
Upgrading of hosting and network services 150 000 400 000 700 000
Compensation of personnel: Resolution 1 of 2007 675 687 810 829 851 371
Capacitating the FSL 150 000 50 000 50 000
Accommodation charges 58 612 87 912 119 879
Inflation adjustment: Compensation of personnel 233 339 406 508 507 734
Inflation adjustment: Non-personnel 117 757 136 589 168 035

24
Budget – Programmes(Year-on-year increases)
Main Programmes
2007/08Adjusted Allocation
R’000
2008/09Allocation
R’000
%Increase
2009/10Estimate
R’000
%Increase
2010/11Estimate
R’000
%Increase
Administration 11 907 609 13 382 925 12.39% 15 018 911 12.22% 16 362 276 8.94%
Visible Policing 15 706 164 17 081 910 8.76% 19 062 986 11.60% 20 699 045 8.58%
Detective Services
5 805 816 6 494 606 11.86% 7 103 389 9.37% 7 643 586 7.60%
Crime Intelligence
1 284 546 1 427 925 11.16% 1 673 084 17.17% 1 954 140 16.80%
Protection and Security Services
1 681 970 2 065 877 22.82% 2 462 256 19.19% 2 734 649 11.06%
Total 36 386 105 40 453 243 11.18% 45 320 626 12.03% 49 393 696 8.99%

25
Expenditure trends: Programme 1: Administration
Purpose: Develop departmental policy and manage the department, including providing administrative support
Management includes the provision for the Secretariat for Safety and Security
Corporate Services consists inter alia of Logistical Services (R2,568 bn) of which R843 million is for Capital works, Information Technology (R1,739 bn), Financial Services (R436 m), Training (R947 m), Medical Support (R3,226 bn), Personnel Services (R760 m) etc.
Increase due to intensified funding levels for training interventions, facilities, information technology, radio communication systems, IJS projects and AVL system
Funds devolved from DPW resulted in a redefined baseline
Sub-programmesMinisterDeputy MinisterManagementCorporate ServicesProperty ManagementTOTAL
2007/08R951 000R773 000
R29 743 000R10 558 016 000R1 318 126 000
R11 907 609 000
2008/09R1 008 000R820 000
R37 159 000R11 716 754 000R1 627 184 000
R13 382 925 000
26
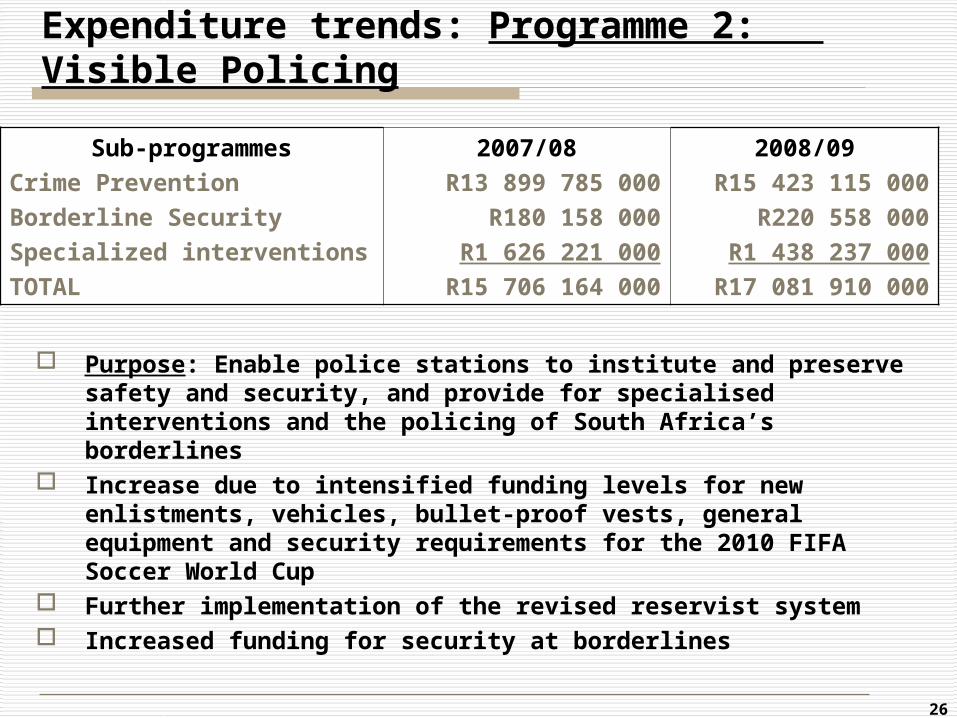
Expenditure trends: Programme 2: Visible Policing
Purpose: Enable police stations to institute and preserve safety and security, and provide for specialised interventions and the policing of South Africa’s borderlines
Increase due to intensified funding levels for new enlistments, vehicles, bullet-proof vests, general equipment and security requirements for the 2010 FIFA Soccer World Cup
Further implementation of the revised reservist system Increased funding for security at borderlines
Sub-programmesCrime PreventionBorderline SecuritySpecialized interventionsTOTAL
2007/08R13 899 785 000
R180 158 000R1 626 221 000
R15 706 164 000
2008/09R15 423 115 000
R220 558 000R1 438 237 000
R17 081 910 000

27
Expenditure trends: Programme 3: Detective Services
Purpose: Enable the investigative work of the SAPS, including providing support to investigators in terms of forensic evidence and the criminal record centre
The new Crime Investigation sub-programme includes both general and specialized investigations, mainly as a result of the restructuring process
Increase for capacity at station detectives Significant emphasis on Forensic Laboratories with a 62%
increase focusing on upgrading / expansion of equipment
Sub-programmesCrime InvestigationsCriminal Record CentreForensic Science LaboratoryTOTAL
2007/08R4 966 133 000
R568 256 000R271 4727 000R5 805 816 000
2008/09R5 447 272 000
R605 456 000R441 878 000
R6 494 606 000

28
Expenditure trends: Programme 4: Crime Intelligence
Purpose: Manage crime intelligence and analyze crime information, and provide technical support for investigations and crime prevention operations
Increase due to intensified funding levels for personnel and associated operational expenditures at crime intelligence offices
Continued emphasis on equipment of a technical nature
Sub-programmesCrime Intelligence OperationsIntelligence and Information ManagementTOTAL
2007/08R582 863 000
R701 683 000R1 284 546 000
2008/09R663 477 000
R764 448 000R1 427 925 000

29
Expenditure trends: Programme 5: Protection and Security Services
Purpose: Provide a protection and security service to all identified dignitaries and government interests
Increase due to intensified funding levels for capacity of the Division for the continuation and expansion of Rail Police projects and various other ports of entry
Sub-programmesVIP Protection ServicesStatic and Mobile SecurityPort of Entry SecurityRail PoliceGovernment Security RegulatorOperational SupportTOTAL
2007/08R317 446 000R398 600 000R569 835 000R221 723 000R30 296 000
R144 070 000R1 681 970 000
2008/09R358 468 000R465 255 000R734 636 000R308 420 000R33 082 000
R166 016 000R2 065 877 000

30
Items (Year-on-year increases)SCOAItems
R thousands
2007/08Adjusted Allocation
2008/09Allocation
%Increase
2009/10Estimate
%Increase
2010/11Estimate
%Increase
Current payments-Compensation of employees-Goods and services
34 057 651
25 685 020
8 372 631
37 869 631
28 416 836
9 452 795
11.19%
10.64%
12.90%
42 429 892
31 630 754
10 799 138
12.04%
11.31%
14.24%
46 344 806
34 243 193
12 101 613
9.23%
8.26%
12.06%
Transfers and subsidies-Provinces and municipalities-Departmental agencies & accounts-Households
320 076
17 453
15 893
286 730
353 474
19 432
17 657
316 385
10.43%
11.34%
11.10%
10.34%
372 097
20 453
19 132
332 512
5.27%
5.25%
8.35%
5.10%
390 979
21 477
20 368
349 134
5.07%
5.01%
6.46%
5.00%
Payments for capital assets-Buildings and other fixed structures-Machinery and equipment-Cultivated assets
2 008 378
727 019
1 280 859
500
2 230 138
843 278
1 386 325
535
11.04%
15.99%
8.23%
7.00%
2 518 637
1 064 435
1 453 612
590
12.94%
26.23%
4.85%
10.28%
2 657 911
1 118 201
1 539 075
635
5.53%
5.05%
5.88%
7.63%
Total 36 386 105 40 453 243 11.18% 45 320 626 12.03% 49 393 696 8.99%
31
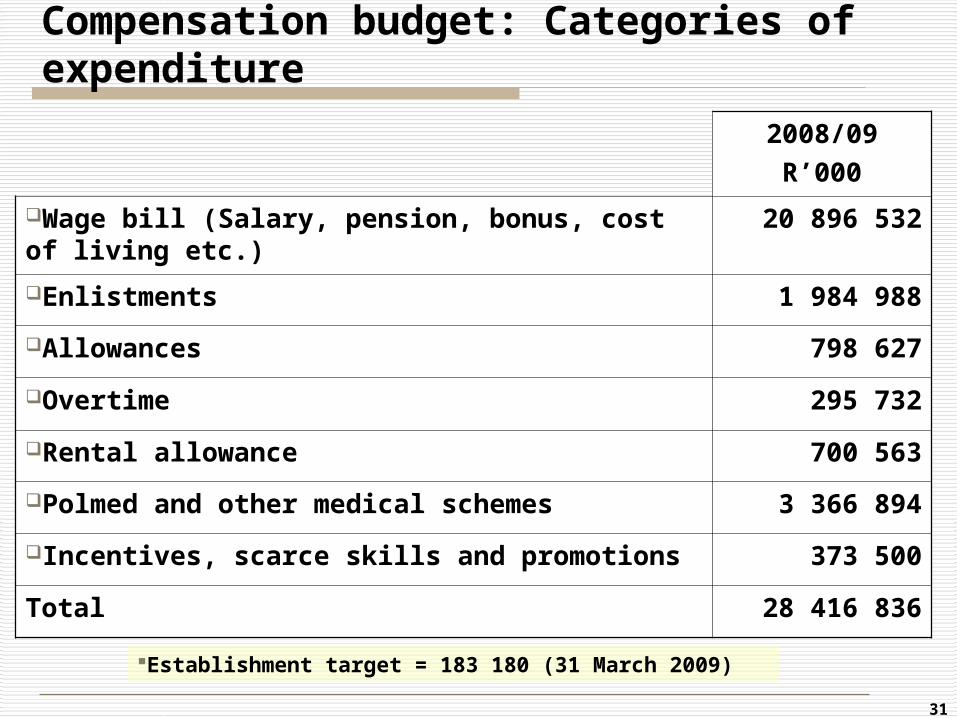
Compensation budget: Categories of expenditure
2008/09R’000
Wage bill (Salary, pension, bonus, cost of living etc.)
20 896 532
Enlistments 1 984 988
Allowances 798 627
Overtime 295 732
Rental allowance 700 563
Polmed and other medical schemes 3 366 894
Incentives, scarce skills and promotions 373 500
Total 28 416 836
Establishment target = 183 180 (31 March 2009)

32
SAPS enlistment programme2002 to 2011 (Personnel figures)
By 31 March 2003 131,560 By 31 March 2004 140,560 By 31 March 2005 148,060 By 31 March 2006 156,060 By 31 March 2007 163,060 By 31 March 2008 173,120 By 31 March 2009 183,180 By 31 March 2010 193,240 By 31 March 2011 201,300
(Programme commenced beginning of 2002/03 when number of personnel was 119 000)
Targets Targets (milestones)(milestones)
✔✔
✔
✔✔
✔

33
SAPS enlistment programme:2002 to 2011
1st Yr 2nd Yr 3rd Yr 4th Yr 5th Yr 6th Yr 7th Yr 8th Yr 9th Yr Total Totals
2002/03 2003/04 2004/05 2005/06 2006/07 2007/08 2008/09 2009/10 2010/11 (period) new
MTEF
New additions
-Entry level constables 7,100 9,550 9,050 11,000 10,000 11,360 11,360 11,360 11,360 92,140 34,080
-Civilians 8,900 4,010 2,450 1,000 1,000 3,200 3,200 3,200 1,200 28,160 7,600
Total 16,000 13,560 11,500 12,000 11,000 14,560 14,560 14,560 12,560 120,300 41,680
Projected personnel losses
-Entry level constables 3,000 3,000 3,000 3,000 3,000 3,300 3,300 3,300 3,300 28,200 9,900
-Civilians 1,000 1,000 1,000 1,000 1,000 1,200 1,200 1,200 1,200 9,800 3,600
Total 4,000 4,000 4,000 4,000 4,000 4,500 4,500 4,500 4,500 38,000 13,500
Effective gain
-Entry level constables 4,100 6,550 6,050 8,000 7,000 8,060 8,060 8,060 8,060 63,940 24,180
-Civilians 7,900 3,010 1,450 0 0 2,000 2,000 2,000 0 18,360 4,000
Total 12,000 9,560 7,500 8,000 7,000 10,060 10,060 10,060 8,060 82,300 28,180

34
SAPS enlistment programme:2002 to 2011
Significant capacity expansion Since 2002/03 up to 2007/08 already
54 120 additional personnel apart from 24 500 replacements as well (45% increase)
Since 2002/03 up to 2010/11 will reflect 82 300 additional personnel apart from 38 000 replacements as well (69% increase)
Allocated according to the Resource Allocation Guide(RAG)

35
Equipment and operational costs for the multi-year phase-in strategy of the borderline control function at various South African borderlines
Detached duties for the functional deployment of members
Funding commenced in 2006/07
Borderline Security (Estimate)
2006/072006/07
R’000R’000
R76,171R76,171
2007/082007/08
R’000R’000
R180,158R180,158
2008/092008/09
R’000R’000
R220,558R220,558
2009/102009/10
R’000R’000
R233,984R233,984
2010/112010/11
R’000R’000
R245,683R245,683
36
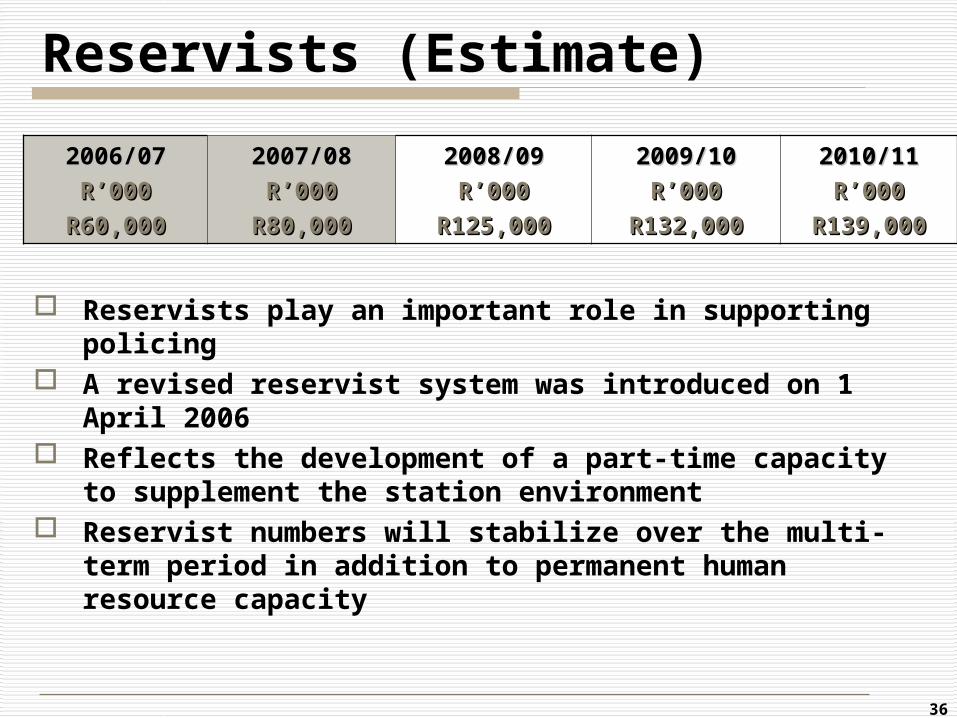
Reservists (Estimate)
Reservists play an important role in supporting policing
A revised reservist system was introduced on 1 April 2006
Reflects the development of a part-time capacity to supplement the station environment
Reservist numbers will stabilize over the multi-term period in addition to permanent human resource capacity
2006/072006/07
R’000R’000
R60,000R60,000
2007/082007/08
R’000R’000
R80,000R80,000
2008/092008/09
R’000R’000
R125,000R125,000
2009/102009/10
R’000R’000
R132,000R132,000
2010/112010/11
R’000R’000
R139,000R139,000

37
Automated Vehicle Location System(AVL) (Estimate)
Enhanced command and control system for operational response vehicles
Provide for automated vehicle location / positioning updates, mapping etc.
Implementation in process Radio Communication System in Gauteng
came into operation towards end of 2007
2007/082007/08
R’000R’000
R37,500R37,500
2008/092008/09
R’000R’000
R45,000R45,000
2009/102009/10
R’000R’000
R70,000R70,000
2010/112010/11
R’000R’000
R73,500R73,500
38
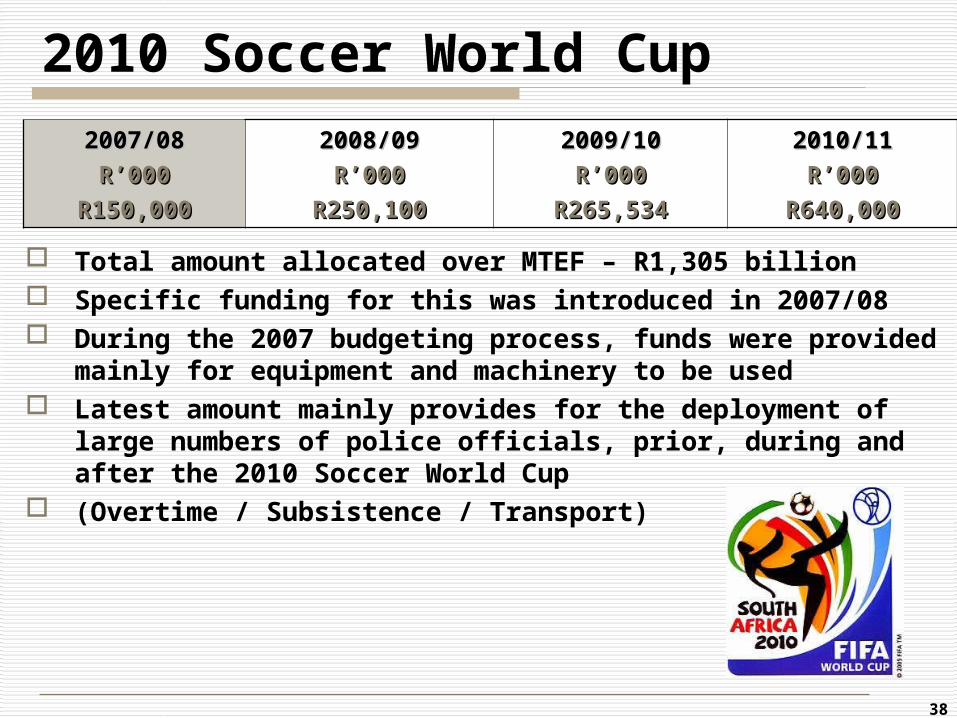
2010 Soccer World Cup
Total amount allocated over MTEF – R1,305 billion Specific funding for this was introduced in 2007/08 During the 2007 budgeting process, funds were provided
mainly for equipment and machinery to be used Latest amount mainly provides for the deployment of
large numbers of police officials, prior, during and after the 2010 Soccer World Cup
(Overtime / Subsistence / Transport)
2007/082007/08
R’000R’000
R150,000R150,000
2008/092008/09
R’000R’000
R250,100R250,100
2009/102009/10
R’000R’000
R265,534R265,534
2010/112010/11
R’000R’000
R640,000R640,000

39
Property Management and Devolved funds from Public Works
CategoryCategoryR’000R’000
2007/082007/08R’000R’000
2008/092008/09R’000R’000
2009/102009/10R’000R’000
2010/112010/11
Maintenance &Property rates
470 367 574 575 730 792 856 566
Municipal services 319 594 339 717 373 688 411 056
Property leases 528 165 712 892 803 538 920 062
Sub-total 1 318 126 1 627 184 1 908 018 2 187 684
Capital Works 727 019 843 278 1 064 435 1 118 201
Total 2 045 145 2 470 462 2 972 453 3 305 885
Day-to-day maint. (Projects amounting to less than R20 000 per case)
148,500 153,121 155,010 157,647

40
Principles: Devolvement of budgets from Public Works
Full portfolio of funds devolved as from 2006/07 financial year Maintenance and property ratesMaintenance and property rates
User charges (rental) system introduced Planned maintenance to be performed by DPW for all non-
functional accommodation Payment: Quarterly invoices
Municipal servicesMunicipal services SAPS opt to have DPW perform this function on their behalf – 5%
management fee is charged Payment: Cost recovery basis, quarterly invoices
Property leasesProperty leases Remain DPW responsibility Payment: Cost recovery basis in respect of actual expenditure,
quarterly invoices Capital WorksCapital Works
DPW and SAPS own resource capacity perform execution of projects
Payment: Cost recovery basis in respect of actual expenditure, monthly and expenditure against budget (own resources)

41
Training provision MTEF
Revised estimate
Medium-term expenditure estimates
2007/08R’000
2008/09R’000
2009/10R’000
2010/11R’000
Programme 1Administration 838 688 947 717 1 006 476 1 063 845
(“Training for all functions”)(“Training for all functions”)
Rapid growth in personnel numbers also require sustainable and focused training programmesVast numbers of people are being trained, ranging from annual enlistments to detective and station commissioners

42
Training provision MTEF
Training has been categorized in the following fields: Basic training Management and Leadership training Crime Prevention (CAS, CSC Commander, DFO etc.) Tactical skills (Crowd Management, Street Survival
etc.) Investigation (Detective, Crime Scene Man, Statement
taking, LCRC training etc.) Intelligence (Analyst Notebook, CIG, Electronic and
Physical Surveillance, Strategic Analysis, INKWAZI) Support (Vehicle Fleet Management, Basic Financial
Management, Applied Government Accounting etc.) Generic skills (ABET, Computer Literacy, Driving etc.)

43
IJS-related expenditure Although interdepartmental of nature,
allocations and expenditures vested against the vote SAPS until 31 March 2007
With effect from the 2007/08 financial year, funding allocated to SAPS are intended for SAPS specific projects and identified transversal IJS projects
Purpose of funding - IJS modernization Expenditure trends and estimates:
2004/05 R133 million 2005/062005/06 R178 millionR178 million 2006/072006/07 R213,7 millionR213,7 million 2007/082007/08 R224,3 millionR224,3 million 2008/092008/09 R235,1 millionR235,1 million 2009/102009/10 R249,2 millionR249,2 million 2010/112010/11 R264,1 million R264,1 million

44
IJS main programmes SAPS specific
Action Request for Service Delivery of a response service and command and
control capability Investigation Case Docket Management System
Project to replace the current CAS system in use by the SAPS, inclusive of content elements (e-docket, e-filing etc.)
ID Services Establishment Establishment of the NPIS, facial compilation and
recognition and live scan capabilities Detention Management
Automate the detention process of individuals Exhibit Management
Automate the found property and exhibit management process of SAPS (FSL, CRC)
SAPS Infrastructure upgrades LAN / WAN Upgrades (2005 – 2007) Service Integration bus (2007 – 2010)

45
IJS main programmes
Transversal IJS projects Interoperability
Establishment and maintenance of a shared interoperability framework and infrastructure
IJS Codes Establishment and maintenance of a
standardized shared codes database IJS BI / GIS
Establishment and maintenance of a shared BI / GIS capability for the IJS
Transversal infrastructure Server and network infrastructure for the
IJS

46
Establishment of the Division:Protection and Security Services
During July 2002, Cabinet approved the expansion of the VIP Protection Service and certain new functions, the latter that realized the establishment of the Division: Protection and Security Services Core responsibilities of the Division are to:
Provide a VIP Protection (In-Transit) Service Provide a Static Protection Service to approved venues Provide a Security Service to the Rail Transport Sector Provide a Security Service to all Ports of Entry Provide a Government Security Regulatory Service (National Key Points and Security Advisory Service)
Four initial projects were approved by Cabinet and funded over and above the baseline allocation: Policing of Rail Transport Harbor Security (Durban Harbor) Airports (OR Tambo International Airport) Land Ports (Beit Bridge)
Expenditure trends and estimates for the above purpose are the following:

47
Port of Entry Security 2004/05 – R165,4 m 2005/06 – R242,2 m 2006/07 – R363,7 m 2007/08 – R569,8 m 2008/09 – R734,6 m 2009/10 – R900,9 m 2010/11 – R1 017,5 m
Rail Police 2004/05 – R31,7 m 2005/06 – R80,7 m 2006/07 – R118,7 m 2007/08 – R221,7 m 2008/09 – R308,4 m 2009/10 – R374,0 m 2010/11 – R421,7 m
Establishment of the Division:Protection and Security Services
Government Security Regulator 2004/05 – R7,8 m 2005/06 – R16,5 m 2006/07 – R23,3 m 2007/08 – R30,3 m 2008/09 – R33,0 m 2009/10 – R40,9 m 2010/11 – R44,2 m
Personnel numbers Establishment increased
from 3 359 in 2003/04 to an estimated 16 021 by March 2010
Expansion focused on these newly assigned functions

48
Forensic Science Laboratory (FSL)
2007/082007/08
R’000R’000
R271 427R271 427
2008/092008/09
R’000R’000
R441 878R441 878
2009/102009/10
R’000R’000
R373 455R373 455
2010/112010/11
R’000R’000
R397 277R397 277
Included in the baseline allocations over the medium term, additional funding will be allocated for forensic equipment in the FSL environment, and to the following extent:
2008/09 - R150 million 2009/10 - R50 million 2010/11 - R50 million

49
Forensic Science Laboratory
The importance of scientific evidence has become essential in the investigation of cases
In this specific regard, the SA Police Service will increase the capacity of the Forensic Science Laboratories even more
As part of the decentralized focus of the Laboratory, a new building is in the process of construction for the Western Cape province, the equipment of the latter that requires replacement, upgrading and expansion

50
Upgrade of hosting and network infrastructure
2008/092008/09
R’000R’000
R150 000R150 000
2009/102009/10
R’000R’000
R400 000R400 000
2010/112010/11
R’000R’000
700 000700 000
SAPS is dependant on a secure dissemination of information Information processing in turn, is dependant on computer applications The deployment of these applications requires an underlying network and
hosting infrastructure Current network infrastructure needs to be upgraded and increased in
capacity, with features to accommodate new generation applications as well (Additional funding)

51
Multi-year overview of capacity building(main spending priorities)
Compensation related payments ✔
Establishment of the Division: Protection and Sec Services ✔
Aircraft ✔
Elections ✔
Death Grants ✔
Training ✔
Reservists ✔
New policing infrastructure, property leases, maintenance ✔
IJS programmes ✔
Modernization and expansion of vehicle fleet ✔
(Accomplished / Maintained / Expanded / Introduced)

52
Multi-year overview of capacity building(main spending priorities continue)
IT / ICT Plan – end user equipment ✔
Firearm Control System ✔
Borderline security ✔
General equipment e.g bullet resistant vests, weapons etc. ✔
Radio Communication System Gauteng ✔
Operational Deployment System for vehicles (AVL) ✔
Upgrading of resource capacity of the FSL ✔
Upgrading of the network and hosting infrastructure ✔
Preparation for the Soccer World Cup 2010 ✔
(Accomplished / Maintained / Expanded / Introduced)