1 u.s. army materiel command ndia 2004 tactical wheeled vehicles conference general paul kern
TRANSCRIPT
1
U.S. Army Materiel Command
NDIA
2004 Tactical Wheeled Vehicles Conference
General Paul Kern

2
HMMWV
•OPTEMPO is 1 year for every 30 days•Average age of HMMWV =13.9 years

3
Medium Trucks
•Average age of Medium Fleet is 19 years

4
HET/HEMMTT
•Average age of HET = 9.2 years•Average age of HEMTT = 14.8 years

5
Maintaining Readiness
•Replacing cannibalized and battle-lost equipment is one of our major challenges.

6
• ARMY PLANARMY PLAN• The Army will conduct an orderly reconstitution to restore
combat power.
• Implement lessons from Desert Storm, OEF, OIF, and operations in the Balkans.
ARMY / INDUSTRY PARTNERSHIPARMY / INDUSTRY PARTNERSHIP• Coordinate AMC & PEO / PM logistics plan
• 12B + price tag to repair or replace equipment
CHALLENGESCHALLENGES• Timely evacuation of equipment back to
CONUS repair facilities
• Continuing to support current operations.
WAY AHEADWAY AHEAD• Set the Force to support National Defense priorities
• Provide cost effective technology upgrades
• Rapidly restore Army fleet to support readiness goals
6
Setting the Force
1555 Tracked vehicles9426 HMMWV7074 Wheeled vehicles3579 Trailers
1555 Tracked vehicles9426 HMMWV7074 Wheeled vehicles3579 Trailers
248 AH-64204 CH-47431 UH-60
248 AH-64204 CH-47431 UH-60
9 Patriot Battalions82 MLRS125,000 ST of Ammo
9 Patriot Battalions82 MLRS125,000 ST of Ammo

7HEMTT Propulse
Smart Distribution
HE FMTVHE HMMWV
• 4 Phase I FTTS ACTD contracts awarded (M&S and demonstrator option)– General Purpose Vehicles, Oshkosh, Stewart and Stevenson, United Defense LP
• Phase II FTTS ACTD draft solicitation released• Two Major Contract Strategy Changes
– Contractors will demonstrate the UV or MSV or Both– Reduced MSV quantity from 7 to 5 and will compare to upgraded HMMWV, FMTV,
HEMTT.– Currently addressing industry questions/comments to draft solicitation release
Maneuver Sustainment Vehicle
Utility Vehicle
FTTS ACTD Update
8
0
25000
50000
75000
100000
125000
150000
175000
200000
225000
250000
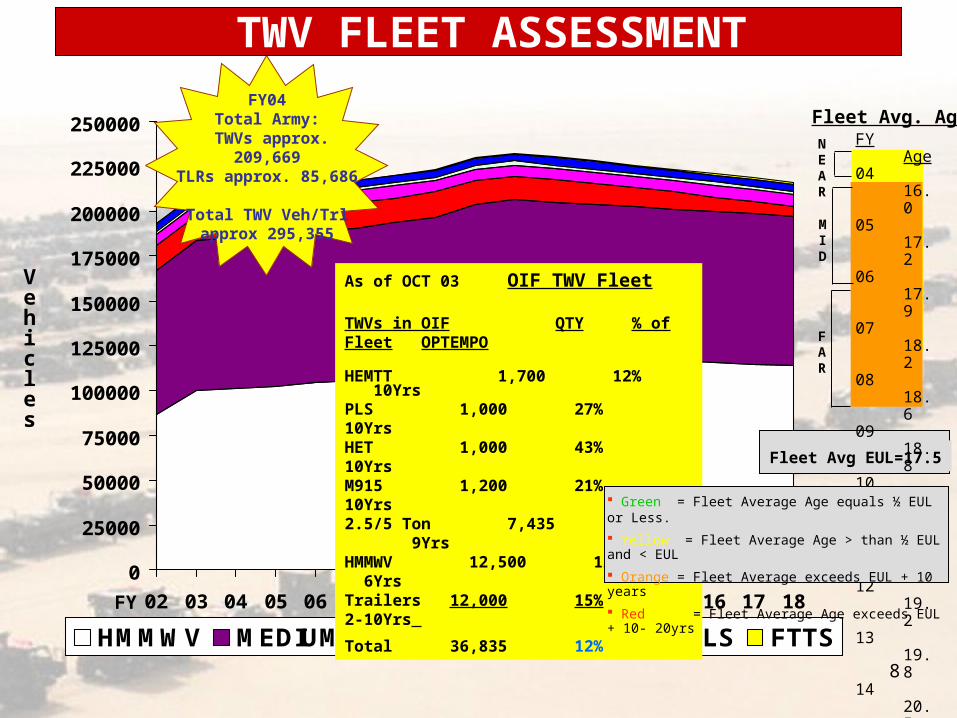
02 03 04 05 06 07 08 09 10 11 12 13 14 15 16 17 18
HMMWV MEDIUM HEMTT M915 HET PLS FTTS
Vehicles
Fleet Avg EUL=17.5
FY04Total Army:
TWVs approx. 209,669TLRs approx. 85,686
Total TWV Veh/Trl approx 295,355
FY
Fleet Avg. AgeFY Age04 16.005 17.206 17.907 18.208 18.609 18.810 18.811 18.612 19.213 19.814 20.515 21.216 22.117 22.918 23.7
MID
NEAR
FAR
As of OCT 03 OIF TWV Fleet
TWVs in OIF QTY % of Fleet OPTEMPO
HEMTT 1,700 12% 10YrsPLS 1,000 27% 10YrsHET 1,000 43% 10YrsM915 1,200 21% 10Yrs2.5/5 Ton 7,435 9% 9YrsHMMWV 12,500 12% 6YrsTrailers 12,000 15% 2-10Yrs
Total 36,835 12%
TWV FLEET ASSESSMENT
Green = Fleet Average Age equals ½ EUL or Less.
Yellow = Fleet Average Age > than ½ EUL and < EUL
Orange = Fleet Average exceeds EUL + 10 years
Red = Fleet Average Age exceeds EUL + 10- 20yrs

9
0
25000
50000
75000
100000
125000
150000
175000
200000
225000
250000
02 03 04 05 06 07 08 09 10 11 12 13 14 15 16 17 18
HMMWV FMTV HEMTT M915 HET PLS FTTS Over Age
Fiscal YearFiscal Year
VVeehhiicclleess
Fleet Av. Age
FY AGE02 14.403 14.804 15.505 16.106 16.607 16.808 17.009 17.310 17.511 17.812 18.413 19.114 19.815 20.716 21.617 22.518 23.4
EUL =17.5
Over Age Fleet
10
• Intense use of wheel vehicles will continue/increase.
• We must maintain deployed fleet at high readiness rates > 90%.
• Successful ACTD essential to Future Force.
• Need a Team approach to develop an affordable solution.
Conclusion

11
Facing the Future …Together