1. understanding concept arrangement patterns, member
TRANSCRIPT

INTELLIGENT DIGITAL FINANCIAL REPORTING – PART 2: CONCEPTUAL MODEL OF A DIGITAL FINANCIAL REPORT –
UNDERSTANDING CONCEPT ARRANGEMENT PATTERNS, MEMBER ARRANGEMENT PATTERNS, AND REPORT FRAGMENT
ARRANGEMENT PATTERNS – CHARLES HOFFMAN, CPA AND RENE VAN EGMOND
CC0 1.0 Universal (CC0 1.0) Public Domain Dedication https://creativecommons.org/publicdomain/zero/1.0/ 1
1. Understanding Concept Arrangement Patterns, Member Arrangement Patterns, and Fragment Arrangement Patterns
A list of report elements, by itself, is not sufficient to describe a model for a digital
financial report. A digital financial report contains both things that exist within that
model (things that exist, report elements) and relationships between those report
elements (how they interact with one another).
In the prior section, Financial Report Model Elements, we discussed the elements
which make up the digital financial report model. In this section we discuss the
relations between those report elements in additional detail.
1.1. Overview or relations between report elements
We have discussed model structure relations, pointing out that there are specific
categories of report elements that work together to make up a report and that there
are specific relations between Networks, Tables, Axes, Members, Line Items,
Abstracts and Concepts. This section describes specifically how those report
elements can be related to one another to convey meaning.
There are exactly three types of structural relationships within an XBRL-based
conceptual model for a digital financial report:
1. Some set of Concepts can be organized within a [Line Items]
2. Some set of [Member]s can be organized within an [Axis].
3. Some set of Networks, Tables and Blocks (report fragments) can be organized
within a report.
These report elements can be related:
Concept arrangement patterns: relations between Concepts within [Line
Items]
Member arrangement patterns: relations between the [Member]s of an
[Axis]
Fragment arrangement patterns: relations between financial report
fragments (Networks, Tables, Components, Blocks) within a report, the
ordering or sequencing of the report fragments.
All of these types of relations are important and we cover each in this section.
1.2. Understanding the utility and leverage of patterns
The world is full of patterns and information technology engineers and architects
leverage these patterns when trying to get a computer to do something effectively
and efficiently for humans. Understanding the patterns which exist can help make
both building and using software easier.

INTELLIGENT DIGITAL FINANCIAL REPORTING – PART 2: CONCEPTUAL MODEL OF A DIGITAL FINANCIAL REPORT –
UNDERSTANDING CONCEPT ARRANGEMENT PATTERNS, MEMBER ARRANGEMENT PATTERNS, AND REPORT FRAGMENT
ARRANGEMENT PATTERNS – CHARLES HOFFMAN, CPA AND RENE VAN EGMOND
CC0 1.0 Universal (CC0 1.0) Public Domain Dedication https://creativecommons.org/publicdomain/zero/1.0/ 2
Business reports, including financial reports, have patterns. Another way of saying
this is that financial reports are not random. There are not an infinite number of
patterns in financial reporting.
Business Reporting Use Cases, introduces a set of approximately 30 financial
reporting use cases collected over a number of years. That set of 30 business use
cases was condensed from many, many different financial reporting use cases
examined in order to understand how to model financial information using XBRL.
These business use cases were also used within the USFRTF Patterns Guide which
was created in order to help understand how to construct the US GAAP XBRL
Taxonomy.
These 30 business use cases were distilled down further, basically to their essence.
This distilled version is referred to here as a Concept Arrangement Patterns and
Member Arrangement Patterns. Basically, every financial reporting use case follows
one or a combination of these patterns. While it is hard to say if these patterns will
cover 100% of all financial reporting use cases, it is hard to dispute that any of these
9 patterns. If some pattern is deemed missing, that pattern can be added to the
inventory of patterns.
The US GAAP Taxonomy Architecture refers to these patterns as compact pattern
definitions and documents a number of these patterns in what it refers to as style
guides. These style guides were never released publicly but they are referred to in
the US GAAP Taxonomy Architecture. Everything within the US GAAP Taxonomy fits
into one or a combination of these patterns.
1.3. Concept arrangement patterns
Remember that a concept arrangement pattern explains how some set of Concepts is
represented within a [Line Items]. The following is a summary of the identified
financial reporting related concept arrangement patterns1.
1.3.1. Set (or Hierarchy)
A set (or hierarchy) concept arrangement pattern denotes a hierarchy of concepts
with no numeric relations. If no numeric relations exist, then the concept
arrangement pattern of the report fragment is a set (hierarchy). Basically, anything
can be represented as a hierarchy. It is the addition of additional relations, typically
mathematical computations, which turns a hierarchy into some other concept
arrangement pattern.
A set (hierarchy) can be detected because there are no XBRL calculation relations or
XBRL Formulas related to mathematical computations.
1 Concept Arrangement Pattern Examples,
http://xbrlsite.azurewebsites.net/DigitalFinancialReporting/ConceptArrangementPatterns/2017-05-07/

INTELLIGENT DIGITAL FINANCIAL REPORTING – PART 2: CONCEPTUAL MODEL OF A DIGITAL FINANCIAL REPORT –
UNDERSTANDING CONCEPT ARRANGEMENT PATTERNS, MEMBER ARRANGEMENT PATTERNS, AND REPORT FRAGMENT
ARRANGEMENT PATTERNS – CHARLES HOFFMAN, CPA AND RENE VAN EGMOND
CC0 1.0 Universal (CC0 1.0) Public Domain Dedication https://creativecommons.org/publicdomain/zero/1.0/ 3
1.3.2. Roll up
A roll up concept arrangement pattern represents a total, or roll up, and some set of
other Concepts that aggregate to that total. This concept arrangement pattern is
commonly referred to a “roll up”, or the equation A + B + n = Total. All concepts
involved in this concept arrangement pattern have the same set of characteristics
and all must be numeric and of the same period type.
A roll up concept arrangement pattern is detected by the existence of XBRL
calculation relations.

INTELLIGENT DIGITAL FINANCIAL REPORTING – PART 2: CONCEPTUAL MODEL OF A DIGITAL FINANCIAL REPORT –
UNDERSTANDING CONCEPT ARRANGEMENT PATTERNS, MEMBER ARRANGEMENT PATTERNS, AND REPORT FRAGMENT
ARRANGEMENT PATTERNS – CHARLES HOFFMAN, CPA AND RENE VAN EGMOND
CC0 1.0 Universal (CC0 1.0) Public Domain Dedication https://creativecommons.org/publicdomain/zero/1.0/ 4
1.3.3. Roll forward
A roll forward concept arrangement pattern reconciles the balance of a concept
between two points in time. This concept arrangement pattern is commonly referred
to a “roll forward” or “movement analysis” or the equation: beginning balance +
additions – subtractions = ending balance. In this equation the Period [Axis] is as of
two different points in time and the changes (additions/subtractions) occur during
the period between those two points in time.
A roll forward can be detected because (a) it always has in instant as the first and
last concept in the presentation relations, (b) the first instant has a periodStart label
role, (c) the second instant concept is the same as the first and has the periodEnd
label, and (d) XBRL Formulas exist the represent the roll forward mathematical
relation.
1.3.4. Roll forward info
A roll forward info concept arrangement pattern looks like a roll forward, but is not
really a roll forward. While a roll forward reconciles the balance of a concept
between two points in time; the roll forward info is really just a hierarchy which
shows a beginning and ending balance. A roll forward info concept arrangement
pattern is generally shown with a roll forward.
INTELLIGENT DIGITAL FINANCIAL REPORTING – PART 2: CONCEPTUAL MODEL OF A DIGITAL FINANCIAL REPORT –
UNDERSTANDING CONCEPT ARRANGEMENT PATTERNS, MEMBER ARRANGEMENT PATTERNS, AND REPORT FRAGMENT
ARRANGEMENT PATTERNS – CHARLES HOFFMAN, CPA AND RENE VAN EGMOND
CC0 1.0 Universal (CC0 1.0) Public Domain Dedication https://creativecommons.org/publicdomain/zero/1.0/ 5
A roll forward info pattern can be detected because (a) the first concept has a
periodStart label, (b) the last concept in the presentation relations has a periodEnd
label.
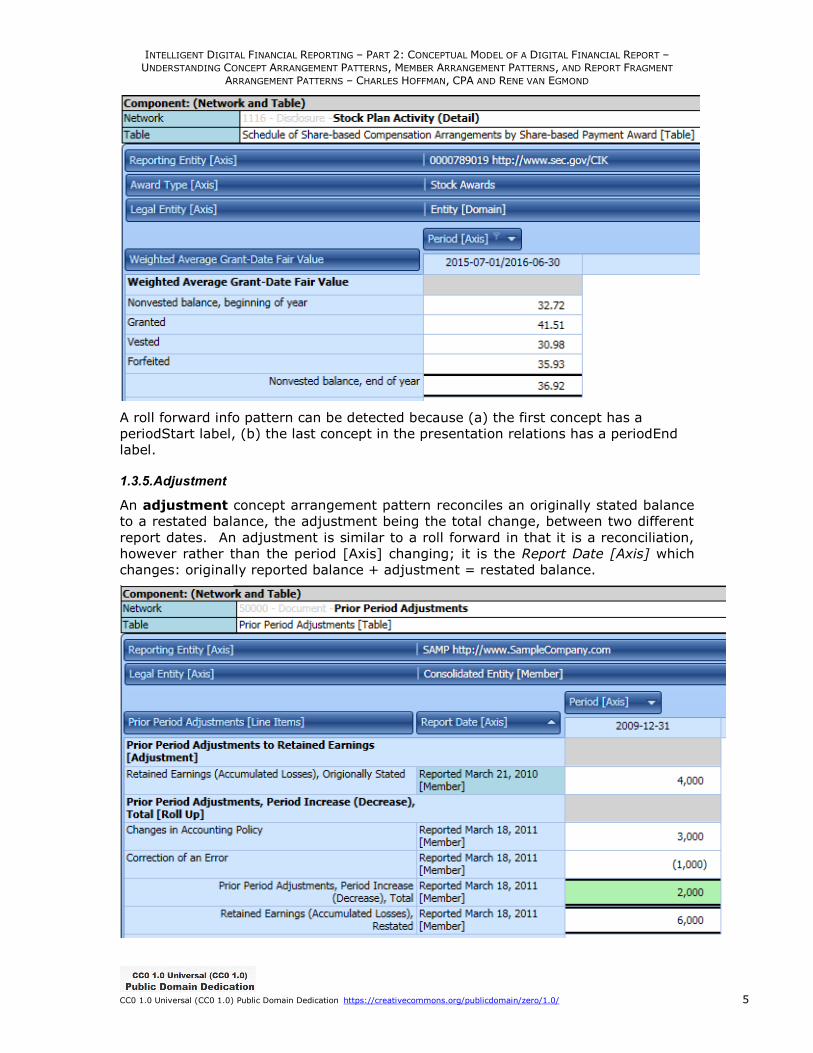
1.3.5. Adjustment
An adjustment concept arrangement pattern reconciles an originally stated balance
to a restated balance, the adjustment being the total change, between two different
report dates. An adjustment is similar to a roll forward in that it is a reconciliation,
however rather than the period [Axis] changing; it is the Report Date [Axis] which
changes: originally reported balance + adjustment = restated balance.

INTELLIGENT DIGITAL FINANCIAL REPORTING – PART 2: CONCEPTUAL MODEL OF A DIGITAL FINANCIAL REPORT –
UNDERSTANDING CONCEPT ARRANGEMENT PATTERNS, MEMBER ARRANGEMENT PATTERNS, AND REPORT FRAGMENT
ARRANGEMENT PATTERNS – CHARLES HOFFMAN, CPA AND RENE VAN EGMOND
CC0 1.0 Universal (CC0 1.0) Public Domain Dedication https://creativecommons.org/publicdomain/zero/1.0/ 6
An adjustment always has a Report Date [Axis] that is generally specific to the
profile of the XBRL instance, the first concept in the presentation relations is an
instant and uses the origionallyStated label role appropriate for the profile, the last
concept in the presentation relations is an instant and uses the restated label role
(which is published by XBRL International). Concepts for Report Creation Date
[Axis]: us-gaap:CreationDateAxis, ifrs-full:CreationDateAxis, frm:ReportDateAxis.
1.3.6. Variance
A variance concept arrangement pattern reconciles some reporting scenario with
another reporting scenario, the variance between reporting scenarios being the
variance or changes. For example, an analysis which reconciles the concept sales for
the reporting scenarios of actual and budgeted is a variance. The equation is: actual
– budget = variance. Note that the actual member is represented as the dimension
default because the actual would tie to the income statement.
A variance can be a specialization of other concept arrangement patterns such as a
[Hierarchy] as shown above, a [Roll Up] if the [Line Items] rolled up, or even a [Roll
Forward].
A variance can always be discovered because it uses the Reporting Scenario [Axis]
that is related to the reporting profile. Concepts for Reporting Scenario [Axis]:us-
gaap:StatementScenarioAxis, frm:ReportingScenarioAxis. (Seems missing from
IFRS).
1.3.7. Complex computation
A complex computation concept arrangement pattern can be thought of as a
hierarchy plus a set of commutations between different concepts within that
hierarchy which are challenging to model as the parent/child relations of a graph.
The type of computations can vary significantly, thus the challenging in modelling.
For example, the computation of earnings per share is a complex computation.

INTELLIGENT DIGITAL FINANCIAL REPORTING – PART 2: CONCEPTUAL MODEL OF A DIGITAL FINANCIAL REPORT –
UNDERSTANDING CONCEPT ARRANGEMENT PATTERNS, MEMBER ARRANGEMENT PATTERNS, AND REPORT FRAGMENT
ARRANGEMENT PATTERNS – CHARLES HOFFMAN, CPA AND RENE VAN EGMOND
CC0 1.0 Universal (CC0 1.0) Public Domain Dedication https://creativecommons.org/publicdomain/zero/1.0/ 7
A complex computation pattern can be identified because (a) there are numeric
relations and those relations do not follow any of the other mathematical patterns,
(b) there is an XBRL formula that represents a mathematical relation other than one
of the other mathematical computation patterns.
1.3.8. Text block
A text block concept arrangement pattern is an concept arrangement pattern which
contains, by definition, only one concept and that concept expresses what amounts
to a narrative or prose as escaped HTML within that one concept. For example, the
narrative associated with a set of accounting policies expressed as a list or a table
presentation format is a text block. As there is only one concept, there can be no
relations within the concept arrangement pattern.
A text block can always be identified by the data type used to represent the text
block.

INTELLIGENT DIGITAL FINANCIAL REPORTING – PART 2: CONCEPTUAL MODEL OF A DIGITAL FINANCIAL REPORT –
UNDERSTANDING CONCEPT ARRANGEMENT PATTERNS, MEMBER ARRANGEMENT PATTERNS, AND REPORT FRAGMENT
ARRANGEMENT PATTERNS – CHARLES HOFFMAN, CPA AND RENE VAN EGMOND
CC0 1.0 Universal (CC0 1.0) Public Domain Dedication https://creativecommons.org/publicdomain/zero/1.0/ 8
1.4. Concept arrangement patterns (pseudo patterns)
The following are not really concept arrangement patterns but they are worth
pointing out and understanding.
1.4.1. Grid (not really a pattern)
A grid pattern which uses the presentation characteristics of the columns and rows
of a table to represent information is a pseudo concept arrangement pattern.
Because the grid models presentation information and not business semantics, it
cannot be considered a metapattern. However, the grid is included in this list
because the US GAAP Taxonomy uses a grid concept arrangement pattern to model
the statement of changes in equity.
1.4.2. Compound fact (not really a pattern)
A compound fact is a pseudo pattern were a concept arrangement pattern that is
further characterized by one or more additional [Axis]. For example, the salary
information for the directors of an entity shown below is a [Hierarchy] of concepts
that is further characterized by the name of the director which receives the
compensation. The salary information is made up of salary, bonuses, director fees
and this set of information (or compound facts) can be expressed for any number of
directors, the director being the characteristic or axis of the compound fact.

INTELLIGENT DIGITAL FINANCIAL REPORTING – PART 2: CONCEPTUAL MODEL OF A DIGITAL FINANCIAL REPORT –
UNDERSTANDING CONCEPT ARRANGEMENT PATTERNS, MEMBER ARRANGEMENT PATTERNS, AND REPORT FRAGMENT
ARRANGEMENT PATTERNS – CHARLES HOFFMAN, CPA AND RENE VAN EGMOND
CC0 1.0 Universal (CC0 1.0) Public Domain Dedication https://creativecommons.org/publicdomain/zero/1.0/ 9
1.5. Member arrangement patterns
Member arrangement patterns explain how a set of [Member]s relate to one another
within an [Axis]2.
Before we explain the member arrangement patterns, we need to clarify some
terminology which is often confused or used incorrectly.
A domain is a cohesive set of members. Something important to note is that in the
US GAAP XBRL Taxonomy the way [Domain] is used is different than the standard
definition of domain (i.e. a set of members).
The way [Domain] is used in the US GAAP XBRL Taxonomy is to define the root
[Member] of a set of [Member]s that make up a domain.
Consider the more general example:
Assume that the above trees are the [Member]s of an [Axis]. In the diagram, each
circle represents a domain. In the graphic on the left, A is the root member of a
domain with members A, B, C, D, F, E and F. The middle graphic, the circle shows a
domain with the members B, C and D. The graphic on the right shows three different
domains; the RED circle from the graphic on the right, the GREEN circle from the
graphic in the middle, and another domain which has only one member F.
Domains have partitions. A partition is collectively exhaustive and mutually exclusive
set of members within a domain. Partitions do not overlap. Give a set X, a partition is
a division of X into non-overlapping and non-empty "parts" or "blocks" or "cells" that
cover all of X. More formally, these "cells" are both collectively exhaustive and
mutually exclusive with respect to the set being partitioned. A domain always has at
least one partition and may have many partitions.
While above we provided a very basic example to help you become familiar with the
ideas which we want to discuss, aggregation is a bit more complex. Here is the
spectrum of domain partition or member aggregation models:
Flat non-aggregating set (Is-a): A flat non-aggregating set is a set which
is (a) incomplete so it can never aggregate or (b) a set which describes non-
numeric concepts which could never aggregate or (c) a set of numeric
concepts which could be aggregated but the aggregated value is illogical or
never used. An example of a non-aggregating set is a subsequent events
disclosure which is comprised of one or more subsequent events. Subsequent
2 Member arrangement patterns examples,
http://xbrlsite.azurewebsites.net/DigitalFinancialReporting/MemberArrangementPatterns/2017-05-07/

INTELLIGENT DIGITAL FINANCIAL REPORTING – PART 2: CONCEPTUAL MODEL OF A DIGITAL FINANCIAL REPORT –
UNDERSTANDING CONCEPT ARRANGEMENT PATTERNS, MEMBER ARRANGEMENT PATTERNS, AND REPORT FRAGMENT
ARRANGEMENT PATTERNS – CHARLES HOFFMAN, CPA AND RENE VAN EGMOND
CC0 1.0 Universal (CC0 1.0) Public Domain Dedication https://creativecommons.org/publicdomain/zero/1.0/ 10
events are never aggregated; they are simply a list of events that a non-
aggregating set describes.
Complete flat aggregating set (Whole-part): A complete flat aggregating
set is a set which is both complete and characterizes a numeric concept which
can be mathematically aggregated. A complete flat set is semantically
equivalent to a [Roll Up] concept arrangement pattern. The aggregation
scheme is that the members of the list aggregate to the parent of those
members. A complete flat set has no subdomains. A value of all classes of
property, plant and equipment and the value of each class of property, plant
and equipment is an example of a complete flat aggregating set.
Complete hierarchical aggregating set (Whole-part): A complete
hierarchical aggregating set is a set comprised of a collection of complete flat
sets, basically a domain which has one or more subdomains. A business rule
will always describe the aggregation scheme. A breakdown of revenues by
geographic area whereby the domain of geographic areas has a hierarchy of
geographic regions such as “North America” which makes up one hierarchy
and countries such as “United States” and “Canada” which comprise a second
hierarchy nested within the first hierarchy.
Complex aggregating set (Whole-Part): A complex set is a set which has
some other set of complex relations or set of subdomains expressed within a
business rule.
The reason for providing this list of possible member aggregation models is that
there is no standard way to represent such relations using the XBRL technical
syntax. The relations can be represented, for example using XBRL Formula, but
there is no agreed upon standard approach. There is no “standard” XBRL
terminology at this time for these types of relations, all the terminology is taxonomy
specific. This is because XBRL Dimensions does not address aggregation of domain
members.
However, although XBRL Dimensions does not define how members of a domain
aggregate or if they aggregate at all, you can use XBRL Formulas to clearly define
such aggregation if they exist. This XBRL Formulas definition both articulates the
aggregation scheme and can also be used to validate XBRL instances against that
scheme. XBRL Formulas can handle quite complex models.
But, since the SEC does not allow XBRL Formulas to be submitted with an XBRL-
based public company financial filing to the SEC, these filings can have aggregation
schemes which are inconsistent with aggregation schemes you may come up with or
different than how you might interpret the XBRL taxonomy. Public companies
creating XBRL-based digital financial reports which will be submitted to the SEC can
still create a valid scheme of aggregation, test any XBRL instances created against it
in their XBRL-based financial report but not submit that XBRL Formula set with their
XBRL-based financial filing. One way or another, SEC XBRL filers should prove that
their XBRL instances do in fact follow their defined scheme by validating their XBRL
instance.
1.5.1. Whole-part
A whole-part member arrangement pattern is semantically equivalent to the roll up
concept arrangement pattern. Recall that the concept arrangement pattern
computes a total, or roll up, from a set of other concepts. This concept arrangement

INTELLIGENT DIGITAL FINANCIAL REPORTING – PART 2: CONCEPTUAL MODEL OF A DIGITAL FINANCIAL REPORT –
UNDERSTANDING CONCEPT ARRANGEMENT PATTERNS, MEMBER ARRANGEMENT PATTERNS, AND REPORT FRAGMENT
ARRANGEMENT PATTERNS – CHARLES HOFFMAN, CPA AND RENE VAN EGMOND
CC0 1.0 Universal (CC0 1.0) Public Domain Dedication https://creativecommons.org/publicdomain/zero/1.0/ 11
pattern is commonly referred to a “roll up”, or the equation A + B = C. All concepts
involved in this concept arrangement pattern have the same set of characteristics
and all must be numeric.
The whole-part member arrangement pattern represents the same roll up
relationship; however, what is being rolled up is each of the [Member]s of an [Axis].
And so, it is the [Member] of the [Axis] which changes, the Concept characteristic is
constant for all facts.
Characteristics can represent a whole or some part of a whole. Parts may be related
in different ways. The following is a summary of subclasses of whole-part types of
relations which may, or may not, be applicable to financial reporting. Other
subclasses of whole-part relations may exist.
Component-integral object: Indicates that a component contains some
integral object. For example, the component handle is part of the integral
object cup; wheels are a component part of a car; a refrigerator is a
component of a kitchen.
Member-collection: Indicates that some member is part of some collection.
For example a ship is part of a fleet. Or, a subsidiary is part of an economic
entity.
Portion-mass: Indicates that some portion is part of some mass. For
example a slice is part of a pie.
Stuff-object: Indicates that some "stuff" is part of some object. For example
steel is part of a car.
Feature-activity: Indicates that some feature is part of some activity. For
example the feature "paying" is part of the activity "shopping".
Place-area: Indicates that some physical place is part of some area. For
example the place "Everglades" is part of the area "Florida".
The primary point of these examples is to point out that similar type of whole-part
relations can be provided for financial reporting.
1.5.2. Is-a
An Is-a member arrangement pattern simply describes and uniquely identifies a fact
so that one fact can be distinguished from another fact. An Is-a member
arrangement pattern is semantically equivalent to a [Hierarchy] in that it has no
mathematical relations. However, rather than one single concept describing a fact,
both a Concept and a [Member] is used to describe a fact.

INTELLIGENT DIGITAL FINANCIAL REPORTING – PART 2: CONCEPTUAL MODEL OF A DIGITAL FINANCIAL REPORT –
UNDERSTANDING CONCEPT ARRANGEMENT PATTERNS, MEMBER ARRANGEMENT PATTERNS, AND REPORT FRAGMENT
ARRANGEMENT PATTERNS – CHARLES HOFFMAN, CPA AND RENE VAN EGMOND
CC0 1.0 Universal (CC0 1.0) Public Domain Dedication https://creativecommons.org/publicdomain/zero/1.0/ 12
1.6. Fragment arrangement patterns
Flow is the notion of relations between Networks and/or [Table]s for the purpose of
ordering or sequencing information contained in a digital financial report. Creating
schemes for generating the desired flow of information contained by a digital
financial report can be impacted by metadata available. Fragment arrangement
patterns3 explain different approaches to representing the flow of a digital financial
report.
1.6.1. XBRL-based financial reports to SEC report fragment ordering scheme
One example of using networks to order or sequence the contents of an XBRL-based
digital financial report can be seen in how the SEC achieves sequencing. Consider the
following example:
3 Fragment arrangement pattern examples,
http://xbrlsite.azurewebsites.net/DigitalFinancialReporting/FragmentArrangementPatterns/2017-05-07/
INTELLIGENT DIGITAL FINANCIAL REPORTING – PART 2: CONCEPTUAL MODEL OF A DIGITAL FINANCIAL REPORT –
UNDERSTANDING CONCEPT ARRANGEMENT PATTERNS, MEMBER ARRANGEMENT PATTERNS, AND REPORT FRAGMENT
ARRANGEMENT PATTERNS – CHARLES HOFFMAN, CPA AND RENE VAN EGMOND
CC0 1.0 Universal (CC0 1.0) Public Domain Dedication https://creativecommons.org/publicdomain/zero/1.0/ 13
The above is a fragment of a model financial report rendered within the SEC
interactive data previewer. The XBRL extension taxonomy created by the public
company drives the SEC interactive data viewer.
Networks drive the rendering of the table of contents on the left. Each network can
be broken into three components which drive the sequencing of the rendering
framework:
Number such as “101000” within the first network.
Sort Category such as “Document”, “Statement” or “Disclosure”
Title or other part of the networks definition.
The category is used to put the different networks into one of the yellow categories
in the SEC example, the number determines the order within the category, and the
balance of the description is the label that a user sees.
This approach is workable, but it means that all information must be broken out by
network and anything smaller than the network itself cannot be broken out any
further. For example, table information is not used for rendering information at all.
You can examine this in more detail by examining the reference or model
implementation of an SEC XBRL financial filing.
1.6.2. Metadata provided impacts ordering
Certain metadata is required by the XBRL technical syntax. Other metadata is
determined by how a taxonomy is expressed. The following is a summary of the
constraints imposed by approaches used to express metadata within a taxonomy and
how those constraints impact ordering.
Networks – Networks are always required to be unique so as such, networks
can always be used to order a taxonomy. However, if networks alone are
used many times not enough granularity is achievable. Also networks cannot
be articulated within a hierarchy.
Networks plus Non-unique Tables – Tables can be used with networks to
order information. However, depending on whether the tables are expressed
are unique governs the role a network must play in allowing a table to be
specifically identified.
Unique Tables – If every table within a taxonomy is unique, then networks
no longer need to be relied upon to uniquely identify and locate a table, the
table alone will allow such identification.
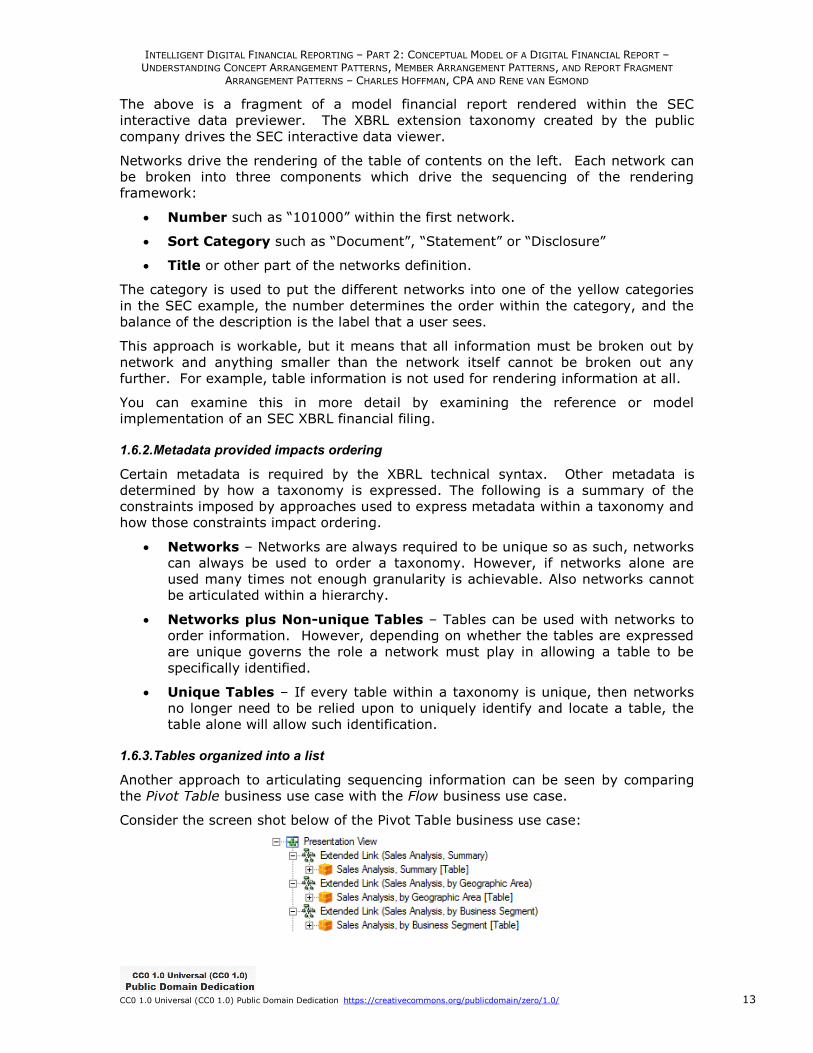
1.6.3. Tables organized into a list
Another approach to articulating sequencing information can be seen by comparing
the Pivot Table business use case with the Flow business use case.
Consider the screen shot below of the Pivot Table business use case:
INTELLIGENT DIGITAL FINANCIAL REPORTING – PART 2: CONCEPTUAL MODEL OF A DIGITAL FINANCIAL REPORT –
UNDERSTANDING CONCEPT ARRANGEMENT PATTERNS, MEMBER ARRANGEMENT PATTERNS, AND REPORT FRAGMENT
ARRANGEMENT PATTERNS – CHARLES HOFFMAN, CPA AND RENE VAN EGMOND
CC0 1.0 Universal (CC0 1.0) Public Domain Dedication https://creativecommons.org/publicdomain/zero/1.0/ 14
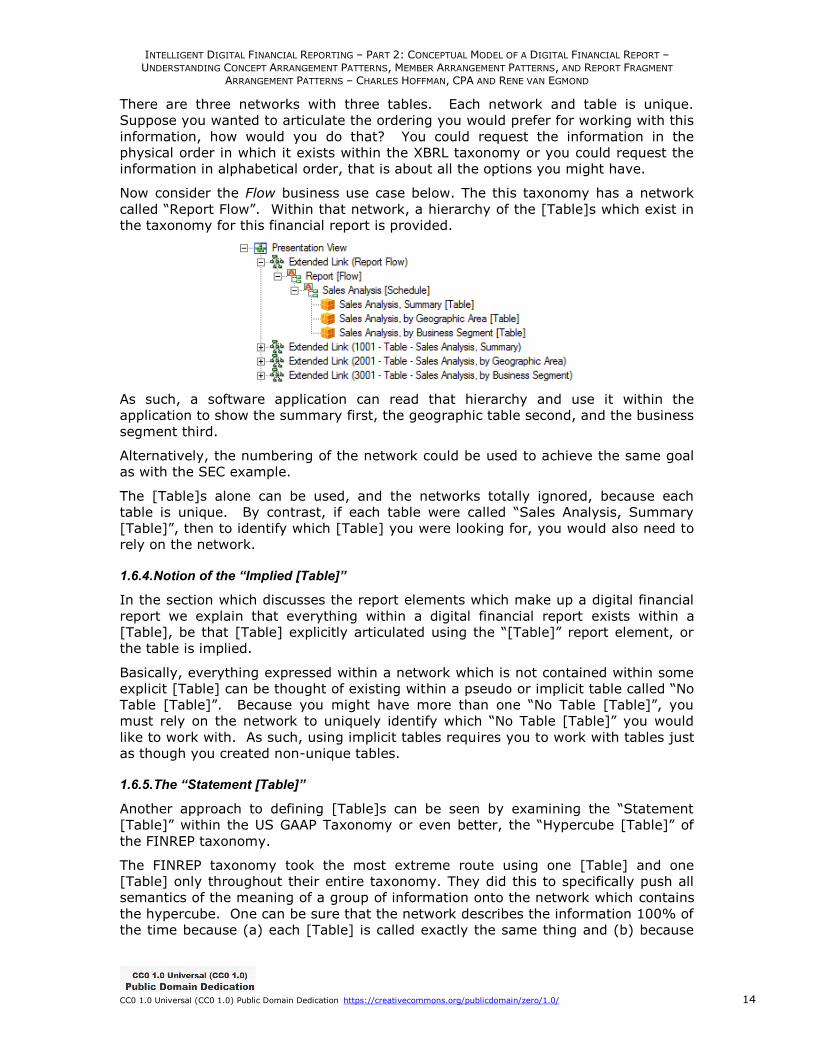
There are three networks with three tables. Each network and table is unique.
Suppose you wanted to articulate the ordering you would prefer for working with this
information, how would you do that? You could request the information in the
physical order in which it exists within the XBRL taxonomy or you could request the
information in alphabetical order, that is about all the options you might have.
Now consider the Flow business use case below. The this taxonomy has a network
called “Report Flow”. Within that network, a hierarchy of the [Table]s which exist in
the taxonomy for this financial report is provided.
As such, a software application can read that hierarchy and use it within the
application to show the summary first, the geographic table second, and the business
segment third.
Alternatively, the numbering of the network could be used to achieve the same goal
as with the SEC example.
The [Table]s alone can be used, and the networks totally ignored, because each
table is unique. By contrast, if each table were called “Sales Analysis, Summary
[Table]”, then to identify which [Table] you were looking for, you would also need to
rely on the network.
1.6.4. Notion of the “Implied [Table]”
In the section which discusses the report elements which make up a digital financial
report we explain that everything within a digital financial report exists within a
[Table], be that [Table] explicitly articulated using the “[Table]” report element, or
the table is implied.
Basically, everything expressed within a network which is not contained within some
explicit [Table] can be thought of existing within a pseudo or implicit table called “No
Table [Table]”. Because you might have more than one “No Table [Table]”, you
must rely on the network to uniquely identify which “No Table [Table]” you would
like to work with. As such, using implicit tables requires you to work with tables just
as though you created non-unique tables.
1.6.5. The “Statement [Table]”
Another approach to defining [Table]s can be seen by examining the “Statement
[Table]” within the US GAAP Taxonomy or even better, the “Hypercube [Table]” of
the FINREP taxonomy.
The FINREP taxonomy took the most extreme route using one [Table] and one
[Table] only throughout their entire taxonomy. They did this to specifically push all
semantics of the meaning of a group of information onto the network which contains
the hypercube. One can be sure that the network describes the information 100% of
the time because (a) each [Table] is called exactly the same thing and (b) because

INTELLIGENT DIGITAL FINANCIAL REPORTING – PART 2: CONCEPTUAL MODEL OF A DIGITAL FINANCIAL REPORT –
UNDERSTANDING CONCEPT ARRANGEMENT PATTERNS, MEMBER ARRANGEMENT PATTERNS, AND REPORT FRAGMENT
ARRANGEMENT PATTERNS – CHARLES HOFFMAN, CPA AND RENE VAN EGMOND
CC0 1.0 Universal (CC0 1.0) Public Domain Dedication https://creativecommons.org/publicdomain/zero/1.0/ 15
each network could only possibly contain one [Table] because using the same
[Table] name within a network would cause modelling conflicts (and remember, all
[Table]s have the same name). The bottom line here is that the network carries all
semantics for describing the information, there is no confusion.
By contrast, the US GAAP Taxonomy has the “Statement [Table]” which is used on
the balance sheet, the income statement, the cash flow statement, and the
statement of changes in equity. As such, one can only know which “Statement
[Table]” you are working with by using the network.
Further, most but not all other [Table]s in the US GAAP Taxonomy are unique. What
is more, not everything is modelled as an explicit [Table] and therefore there are
many “No Table [Table]s” (see the preceding section).
1.6.6. Which Approach is Best?
All this distils down into three possible options:
Use explicit unique [Tables]. This option works well, and in fact it is the
option which I believe is the most reasonable. By taking this approach you
can ignore networks altogether, relegating networks to the role of syntax
needed only for avoiding modelling conflicts. And because you can ignore the
network, you can be sure the [Table] describes the information set and each
[Table] being unique, each information set is unique.
Use explicit but only one [Table] for everything. This option works well
also because it is clear that the network carries all semantics for describing a
set of information. The down side is that you have to create metadata such as
the “number” and “category” used by the SEC to help organize those
networks.
Mixed model. If [Tables] are not unique and if [Table]s are not explicit (i.e.
you have “No Table [Table]”s), you have to rely on both networks and tables
to identify which information you need to work with. This can be both
cumbersome for software and for users. A mixed model such as this does not
appear to make much sense and should be avoided, all things considered.
There are no real benefits of having [Table]s names which can be used in more than
one place, yet there are significant benefits of unique [Table] names.