1 title: understanding and controlling the work function
TRANSCRIPT
1
Title: Understanding and controlling the work function of perovskite oxides using Density Functional Theory 1 Authors: Ryan Jacobs1, John Booske2, and Dane Morgan1,* 2
1Department of Materials Science and Engineering, University of Wisconsin- Madison, Madison, Wisconsin, 3 USA 4 5 2Department of Electrical and Computer Engineering, University of Wisconsin- Madison, Madison, Wisconsin, 6 USA 7 8 *Corresponding author e-mail: [email protected] 9 10
ABSTRACT 11
Perovskite oxides containing transition metals are promising materials in a wide range of electronic and 12 electrochemical applications. However, neither their work function values nor an understanding of their work 13 function physics have been established. Here, we predict the work function trends of a series of perovskite 14 (ABO3 formula) materials using Density Functional Theory, and show that the work functions of (001)-15 terminated AO- and BO2-oriented surfaces can be described using concepts of electronic band filling, bond 16 hybridization, and surface dipoles. The calculated range of AO (BO2) work functions are 1.60-3.57 eV (2.99-17 6.87 eV). We find an approximately linear correlation (R2 between 0.77-0.86, depending on surface 18 termination) between work function and position of the oxygen 2p band center, which correlation enables both 19 understanding and rapid prediction of work function trends. Furthermore, we identify SrVO3 as a stable, low 20 work function, highly conductive material. Undoped (Ba-doped) SrVO3 has an intrinsically low AO-terminated 21 work function of 1.86 eV (1.07 eV). These properties make SrVO3 a promising candidate material for a new 22 electron emission cathode for application in high power microwave devices, and as a potential electron emissive 23 material for thermionic energy conversion technologies. 24 25 26

2
Table of Contents Figure: 1
2 3 4
Table of Contents Caption: The work function values and trends of twenty technologically important 5 perovskite oxides were investigated using Density Functional Theory. The governing work function physics 6 were developed using concepts of bonding ionicity, hybridization, band filling, surface dipoles, and the oxygen 7 band center as an electronic structure descriptor. SrVO3 was found to be a new promising, low work function 8 electron emission material. 9 10
11 12

3
1. Introduction 1 2
Research into the basic science and applications of perovskite oxides is extremely active and very 3
relevant for a number of technological applications. These applications include at least oxide electronics,[1-3] 4
catalysis and solid oxide fuel cells,[4-7] transistor dielectrics,[8, 9] field emission coatings,[10-13] magnetic tunnel 5
junctions,[14, 15] and solid state memory.[16, 17] Perovskite materials are relevant to a wide variety of applications 6
in part due to their stable incorporation of ~90% of the elements in the periodic table. This high degree of 7
compositional flexibility allows for tunable properties to fit the needs of many possible applications, including 8
the tuning of the work function. The perovskite bulk and surface structures used in this work are shown in 9
Figure 1, as well as described in the Computational Methods (Section 6) and Section 1 of the Supplementary 10
Information (SI). We note that we use ideal (001) surfaces without defects or atomic position reconstructions, 11
and we discuss the impacts of this approximation in our discussion of errors between experiment and simulation 12
in Section 3.1 of the main paper and also in Section 3 of the SI. 13

4
1
Figure 1: Crystal structures for (A) ideal cubic perovskite and (B) pseudocubic perovskite phases. In both (A) and (B) the 2 green (largest, corner atoms) are the A site cations, the blue/purple atoms at the center of the octahedra are the B site 3 cations, and the red atoms are O. These structures depict high temperature pseudocubic phases that were derived from 4
experimental (A) Pm3m (cubic) and (B) Pbnm (orthorhombic) and R3c (rhombohedral) symmetries. Structure 5 models of ABO3 surface slabs are (C): asymmetric, stoichiometric, (D): symmetric and AO terminated, nonstoichiometric, 6 and (E) symmetric and BO2 terminated, nonstoichiometric. 7
8
Knowledge of a material’s work function provides an absolute electron energy level reference relative to 9
the vacuum energy, which is important for device applications where the discontinuities of energy levels 10
between different materials have a large effect on the device properties and performance. Absolute electron 11

5
levels often play a critical role for devices with hetero-structured interfaces or active surfaces, such as solar 1
cells, oxide electronics, electrocatalysts, and applications utilizing thermionic electron or field emission physics 2
such as Schottky junctions, thermionic energy converters, and vacuum cathodes for high power microwave 3
sources. Accurate work function values and an understanding of their origins and trends are critical for 4
materials development and optimization for these classes of technologies. 5
In this work we provide a database and trends in work function with respect to composition changes of 6
the A- and B-site cations of a representative set of ABO3 perovskite materials, many of which may have 7
practical value for the above applications in either pure or doped forms. Furthermore, we provide fundamental 8
understanding of these work function trends by relating them to an electronic structure descriptor and known 9
trends in transition metal chemistry. We use the HSE functional of Heyd, Scuseria and Ernzerhof[18] within 10
Density Functional Theory (DFT) with Hartree-Fock exchange fractions obtained from Refs. [19, 20], which fit 11
the exchange fractions specifically to yield correct bulk electronic properties for these materials. Use of these 12
fitted Hartree-Fock exchange fractions ensures that the band levels and work functions are the most quantitative 13
calculated values reported to date. 14
We also apply the methods and understanding gained in this work to discover a low work function 15
perovskite material, SrVO3, for efficient electron emission into vacuum (thermionic, field, or photo-emission). 16
The main electron emission applications considered here are high power electron beam applications (such as 17
high power microwave or millimeter-wave source technologies) and thermionic energy conversion devices. A 18
low work function is important for electron emitters as the most facile electron removal will result in high 19
emitted electron current densities at lower temperatures, electric fields, or light intensity in the context of 20
thermionic, field, or photo- emission, respectively. In the rest of this paper, we specifically discuss and compare 21
perovskite emission property predictions with conventional thermionic emitters, but the advantages are 22
understood to apply more generally to all forms of electron emission. 23
Historically, thermionic electron emitters are comprised of a refractory metal such as W coated with an 24
oxide or diffusing oxide species that lowers the work function via electrostatic surface dipoles. The coating is 25

6
necessary because the refractory metals tend to have high work functions (on the order of 4.5 eV), and are 1
therefore poor electron emitters unless a coating is included to lower their work function. Examples of 2
thermionic emitters include impregnated W cathodes that have a low work function due to the formation of Ba-3
O dipoles[21] and scandate cathodes where the complex interplay between dipole formation and electron doping 4
of Ba-O on Sc2O3 also creates a low work function.[21-23] These types of thermionic emitters are currently 5
employed in many high power electron beam applications.[24, 25] Even thermionic energy conversion emitting 6
layers rely on the same type of volatile surface dipole layers, such as Cs-O adsorbed on GaAs or InGaAs.[26, 27] 7
Replacing these current emission materials which contain volatile surface species with a new material with an 8
intrinsically low work function would simplify the architecture and increase the lifetime of electronic devices 9
which use thermionic electron emission processes. In this work we propose that SrVO3, due to its intrinsic 10
stability, high conductivity, and low work function, is a very promising material for next generation thermionic 11
electron emitters. 12
There has been some experimental and computational work related to measuring the work functions of 13
some perovskite materials. These studies include Kelvin probe microscopy of LaAlO3[2] and A1-xBxMnO3 (A = 14
La, Pr, Nd, B = Sr, Ca, Pb),[28] UPS measurements of Nb-doped SrTiO3,[29] a combination of photoemission and 15
redox potential measurements of LaMnO3,[30, 31] and X-ray absorption and emission measurements on a series 16
of transition metal-containing LaBO3 (B = Cr, Mn, Fe, Co, Ni) perovskites.[32] DFT work function calculations 17
of BaTiO3,[33] SrTiO3,[16] and La2/3Sr1/3MnO3[34] have been performed by other research groups. However, none 18
of these studies provide enough data to establish the physics and trends governing true surface work functions. 19
Summary tables of these experimental and calculated work functions from other research groups are provided in 20
Section 3 of the SI along with a discussion of their comparison to our values. Generally, our calculated results 21
agree with previous experimental and calculated values to the extent that comparison is possible. 22
23
24

7
2. Results: ABO3 work function data and trends 1 2 3
2.1. ABO3 calculated work functions 4 5 6
Figure 2 is a plot of the calculated work functions for the AO- and BO2- surface terminations versus 7
composition of the B-site for all 20 materials considered in this work. These materials were chosen because 8
their pure or slightly defected (doped and/or off-stoichiometric) variants have already been the subject of 9
intense research in the areas of oxide electronics,[1-3] catalysis and solid oxide fuel cells,[4-7] transistor 10
dielectrics,[8, 9] field emission coatings,[10-13] magnetic tunnel junctions,[14, 15] and solid state memory.[16, 17] 11
Furthermore, these materials can exhibit the stable incorporation of many transition metals, resulting in a range 12
of physical properties (e.g., from heavily insulating to metallic electronic conductivity), making them an ideal 13
set of materials in which to study compositional trends in the work function. Looking from left to right, Figure 14
2 shows how the AO and BO2 work functions for perovskite materials change as B-site cations move across the 15
3d series of the periodic table from Sc through Ni. Table 1 contains the calculated work functions for the AO- 16
and BO2-terminated (001) surfaces for all ABO3 materials considered in this study. The O-bond ionicities are 17
also provided, where the ionicity is defined by the ratio of the computed atomic charge on oxygen to the value 18
of -2 expected for a perfectly ionic system (for example, an O atomic charge of -1.5 yields a bond ionicity of -19
1.5/-2 = 0.75, and a perfectly ionic system would yields a bond ionicity of -2/-2 = 1). The atomic charges were 20
calculated using Bader charge analysis of atomic charges of bulk ABO3 materials.[35, 36] Finally, we have also 21
included in Table 1 ranges of experimentally measured work functions for select materials. Generally, chemical 22
bonding has mixed covalent and ionic character, therefore the calculated atomic charges on oxygen from the 23
Bader analysis will be less than (i.e., more positive than) -2. The O-bond ionicities in Table 1 will be referenced 24
in upcoming qualitative discussions of work function trends for these materials in Section 3.1. For the LaBO3 25
series, the LaO work functions range from 1.60 eV (LaRuO3) to 3.57 eV (LaScO3) while the BO2 work 26
functions range from 2.99 eV (LaTiO3) to 6.87 eV (LaAlO3), and tend to increase in magnitude for Ti through 27

8
Ni. For the SrBO3 series, the SrO work functions range from roughly 1.86 eV (SrVO3) to 3.42 eV (SrCoO3) 1
while the BO2 work functions range from 5.09 eV (SrVO3) to 6.68 eV (SrFeO3). 2
3
Figure 2: Trend of (001) AO- and BO2-terminated surface work functions for the 20 perovskite materials studied in this 4 work as a function of B-site element across the periodic table. The solid (open) symbols connected with a solid (dashed) 5 line are the BO2 (AO) work functions, respectively. Red, blue, purple, black, green, orange and pink symbols signify the 6 LaBO3 series, SrBO3 series, La1-xSrxMnO3, x= 0.0625, 0.125, 0.25, 0.375 (LSM), LaAlO3, Ba0.5Sr0.5Co0.75Fe0.25O3 (BSCF), 7 LaRuO3 and SrRuO3 materials, respectively. Note that the data points of BO2 LaFeO3 and SrRuO3 work functions lie on 8 top of each other. 9
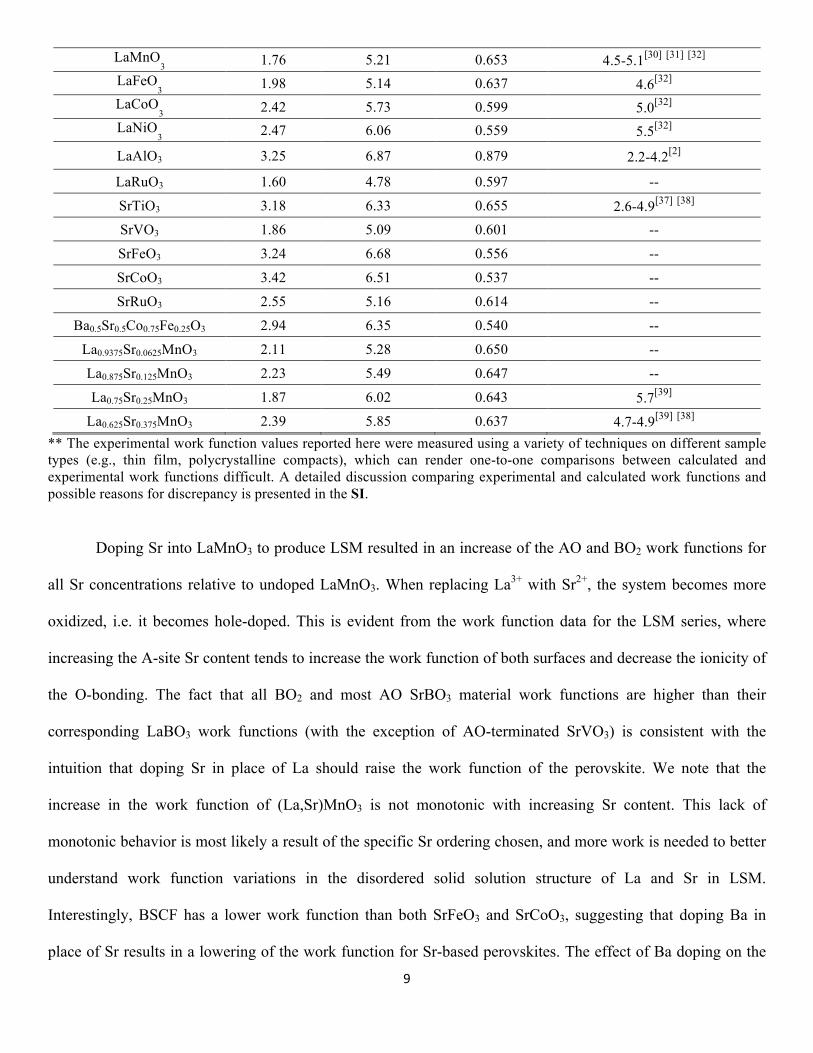
10 Table 1: Summary of HSE calculated work functions for all (001) surfaces of ABO3 materials considered in this study. 11 Also listed are the ionicities (see text for definition) of the O-bonds for each material, which were calculated from Bader 12 charge analysis of the bulk materials. A decrease in bonding ionicity is indicative of greater hybridization of the B 3d 13 bands and O 2p bands. The range of reported experimental work functions for select materials is also provided. Additional 14 discussion comparing calculated and experimental work functions is available in the SI. 15
Material AO WF (eV) BO2 WF (eV) O bond ionicity Experimental WF range (eV)**
LaScO3 3.57 6.32 0.716 -- LaTiO
3 2.59 2.99 0.684 --
LaVO3 2.97 3.60 0.664 --
LaCrO3 2.77 5.27 0.665 4.3[32]
9
LaMnO3 1.76 5.21 0.653 4.5-5.1[30] [31] [32]
LaFeO3 1.98 5.14 0.637 4.6[32]
LaCoO3 2.42 5.73 0.599 5.0[32]
LaNiO3 2.47 6.06 0.559 5.5[32]
LaAlO3 3.25 6.87 0.879 2.2-4.2[2]
LaRuO3 1.60 4.78 0.597 --
SrTiO3 3.18 6.33 0.655 2.6-4.9[37] [38] SrVO3 1.86 5.09 0.601 --
SrFeO3 3.24 6.68 0.556 --
SrCoO3 3.42 6.51 0.537 --
SrRuO3 2.55 5.16 0.614 --
Ba0.5Sr0.5Co0.75Fe0.25O3 2.94 6.35 0.540 --
La0.9375Sr0.0625MnO3 2.11 5.28 0.650 --
La0.875Sr0.125MnO3 2.23 5.49 0.647 --
La0.75Sr0.25MnO3 1.87 6.02 0.643 5.7[39] La0.625Sr0.375MnO3 2.39 5.85 0.637 4.7-4.9[39] [38]
** The experimental work function values reported here were measured using a variety of techniques on different sample 1 types (e.g., thin film, polycrystalline compacts), which can render one-to-one comparisons between calculated and 2 experimental work functions difficult. A detailed discussion comparing experimental and calculated work functions and 3 possible reasons for discrepancy is presented in the SI. 4
5
Doping Sr into LaMnO3 to produce LSM resulted in an increase of the AO and BO2 work functions for 6
all Sr concentrations relative to undoped LaMnO3. When replacing La3+ with Sr2+, the system becomes more 7
oxidized, i.e. it becomes hole-doped. This is evident from the work function data for the LSM series, where 8
increasing the A-site Sr content tends to increase the work function of both surfaces and decrease the ionicity of 9
the O-bonding. The fact that all BO2 and most AO SrBO3 material work functions are higher than their 10
corresponding LaBO3 work functions (with the exception of AO-terminated SrVO3) is consistent with the 11
intuition that doping Sr in place of La should raise the work function of the perovskite. We note that the 12
increase in the work function of (La,Sr)MnO3 is not monotonic with increasing Sr content. This lack of 13
monotonic behavior is most likely a result of the specific Sr ordering chosen, and more work is needed to better 14
understand work function variations in the disordered solid solution structure of La and Sr in LSM. 15
Interestingly, BSCF has a lower work function than both SrFeO3 and SrCoO3, suggesting that doping Ba in 16
place of Sr results in a lowering of the work function for Sr-based perovskites. The effect of Ba doping on the 17

10
SrVO3 work functions will be examined further in Section 4. The AO-terminations of SrVO3, LaMnO3 and 1
LaRuO3 have the lowest calculated work functions of 1.86 eV and 1.76 eV, and 1.60 eV respectively. By virtue 2
of these low work functions, SrVO3, LaMnO3, and LaRuO3 may be suitable candidates for low-work-function, 3
electron-emission cathode materials. Of these candidate materials, SrVO3 is a particularly promising material to 4
explore for the emission applications discussed in the introduction section by virtue of its low work function, 5
metallic conductivity, ability to be synthesized as both a bulk powder[40, 41] and (001)-oriented thin film,[42] and 6
structural stability at high temperatures.[40, 41, 43] We therefore study SrVO3 in more detail in Section 4. 7
2.2. 2p-band center as an electronic structure descriptor 8 9 10
Having demonstrated qualitative work function trends with changing A- and B-site composition for the 11
ABO3 materials investigated here, we turned our focus to developing a greater understanding of the physics 12
governing the value of the work function in these perovskite materials. To accomplish this, we used the O 2p-13
band center (see Section 2 of the SI for details) as an electronic structure descriptor, as this variable has proved 14
useful for correlating with a number of perovskite properties.[6, 44-46] The B-site cation 3d-band center and the 15
La/Sr A-site band centers (both calculated with respect to EFermi) were also investigated as possible descriptors. 16
However, no useful physical trends emerged from their analysis. Therefore, we focused on the bulk O 2p-band 17
center. 18
Figure 3 demonstrates the relationship between the calculated (001) work functions and the value of the 19
bulk O 2p-band center. Figure 3A (Figure 3B) is a plot of BO2 work function (AO work function) as a function 20
of the O 2p-band center energy. In both plots, the blue symbols refer to insulating perovskites while red 21
symbols refer to metallic perovskites. In the present case, “insulating” refers to any material we calculated to 22
have a finite bulk and surface band gap, whether due to band-insulating or Mott-Hubbard insulating behavior. 23
The materials which compose the set of insulating perovskites are: LaScO3, LaTiO3, LaVO3, LaCrO3, SrTiO3 24
and LaAlO3. The remaining perovskite materials are referred to as “metallic” perovskites. Although the bulk 25
ground states of some of these materials, for example LaMnO3 and LaFeO3, are also insulating, the 26

11
ferromagnetic near-surface electronic structure is metallic.[47] Our inclusion of these materials in the category of 1
“metallic” perovskites is appropriate as these materials demonstrate fundamentally different electronic structure 2
behavior than prototypical Mott-Hubbard insulators such as LaTiO3 and LaVO3 near their surfaces. The 3
influence of band positions and the O 2p-band center relationship of Figure 3 are discussed in Section 3.1. 4
5
Figure 3: Plots of calculated work functions for the BO2 (A) and AO-terminated surfaces (B) of ABO3 6 materials as a function of the O 2p-band center of bulk ABO3 materials. In both plots, the blue symbols 7 represent insulating perovskites while the red symbols represent metallic perovskites. In (A) and (B) there is a 8 semi-quantitative linear relationship between the work function and the O 2p-band center. 9
10

12
1
3. Discussion: ABO3 work function data and trends 2 3 4
3.1. ABO3 work function trends 5 6 7
Perhaps the most striking feature of the calculated work functions in Figure 2 is that the AO surfaces 8
generally have dramatically lower work function values than BO2 surfaces in all cases. Qualitatively, this can be 9
understood in terms of the surface dipoles. The alternating layers of the (001) orientation are AO/BO2/AO/BO2, 10
which, when considering formal charges for A3+B3+O36- compounds, alternates +/-/+/-. A positive surface dipole 11
is a dipole with an outwardly pointing positive charge, while a negative surface dipole has an outwardly 12
pointing negative charge. Thus we see that the AO termination forms a positive surface dipole that decreases the 13
work function, and the BO2 surface forms a negative surface dipole that increases the work function. It is 14
evident that the same trend of high BO2 work functions and low AO work functions also occurs for the SrBO3 15
(and BSCF) materials. Considering formal charges for these A2+B4+O36- compounds, one should expect no 16
difference in surface dipole as the A2+O2- and B4+O22- surfaces both sum to zero charge. However, a number of 17
previous studies have shown that surfaces of A2+B4+O36- compounds are in fact polar due to enrichment or 18
deficiency of electrons relative to their formal valence. [47, 48] 19
The trend of increasing BO2 work function when proceeding from left to right on the periodic table 20
along the 3d row as shown in Figure 2 can be understood in terms of the transition metal electronegativities. 21
When proceeding from Ti to Ni, the electronegativity of the transition metal ion is increasing as the 3d band 22
fills. As a result, when proceeding from Ti to Ni, the 3d bands fill with more electrons, the 3d bands shift lower 23
in energy, and the work function increases. For the materials LaScO3, LaAlO3 and SrTiO3, the 3d bands are 24
nearly empty and these materials behave as band insulators. Interestingly, these band insulator materials have 25
nearly the same BO2 and AO work function values within a few tenths of an eV. For the case of these band 26
insulators, the absence of 3d electrons means the Fermi level resides at the top of the O 2p band. Thus, for 27
materials with no 3d electrons, it is the O 2p band which sets the value of the work function. 28

13
From Table 1, it is evident that as the 3d bands fill, the bonding ionicity decreases, which implies that 1
the B 3d and O 2p bands are becoming more hybridized. In addition, for the SrBO3 materials where the B 2
element is in the 4+ oxidation state, the bond ionicities are lower and thus the B 3d and O 2p bands are more 3
hybridized than the corresponding LaBO3 systems where the B element is in the 3+ oxidation state. These 4
trends of B 3d - O 2p band hybridization are consistent with a joint experimental and computational work by 5
Suntivich and coworkers that showed how B 3d - O 2p band hybridization changes as a function of 3d band 6
filling using O K-edge X-ray absorption and DFT calculations on a series of perovskite and Ruddlesden-Popper 7
materials.[49] The increased B 3d - O 2p band hybridization means there is greater overlap of the B 3d and O 2p 8
bands, and the O 2p band center becomes closer to EFermi. The above trends in hybridization with 3d band filling 9
illustrate that materials with higher 3d band filling will have increased band hybridization. This increased band 10
hybridization will result in O 2p bands that are closer to EFermi , which will result in higher BO2 work functions. 11
Based on this discussion, if one were interested in creating a perovskite with a higher work function, one 12
strategy would be to increase the band hybridization by doping the A-site with alkaline earths to further oxidize 13
the B-site, for example Sr doping in LaMnO3 to create LSM or Sr and Ba doping in La(Co, Fe)O3 to create 14
BSCF. 15
Both plots in Figure 3 show a linear trend of the calculated work function versus the bulk O 2p-band 16
center, although the trend is more consistently linear (e.g., it has a higher R2 value) in the case of BO2 work 17
functions. In general, these results demonstrate that the bulk O 2p-band center provides an approximate 18
predictor of the work function. Interestingly, in Figure 3A, the slopes of the BO2 work function versus O 2p-19
band center are approximately 0.7 and 1, which is generally close to one, while in Figure 3B the slopes of the 20
AO work functions are approximately 0.2 and 0.6. Since the work function is controlled by a combination of the 21
energy band positions and the magnitude of the surface dipole, the slope of BO2 work function versus O 2p-22
band center being nearly equal to one implies that the BO2 work function changes are dominated by the band 23
positions and are thus relatively insensitive to the magnitude of the surface dipole. In the case of the AO work 24
functions, where the work function doesn’t change as rapidly in proportion to the movement of the O 2p-band 25

14
center, we conclude that the AO work functions are dominated by surface dipoles and are relatively insensitive 1
to the band positions. 2
Unfortunately, direct comparison with experimental values is difficult as there are no experiments that 3
measure the work function of a specific perovskite surface termination, as we are calculating here. However, 4
because DFT has been shown to accurately reproduce work functions of metal surfaces[21] and the ability of 5
HSE to accurately reproduce the electronic structure of these materials,[19, 20] it is reasonable to expect that the 6
calculated work functions are within a few tenths of an eV of the true work function for the surface being 7
modeled. Some additional errors are introduced due to the use of idealized surfaces without defects or 8
reconstructions, but we expect those effects to also be within a couple of tenths of an eV for most surfaces, as 9
discussed in Section 3 of the SI. Encouragingly, our calculated work function values follow the same 10
compositional trend as the surface averaged work function values for La(Cr, Mn, Fe, Co, Ni)O3 materials 11
obtained with X-ray absorption and emission spectroscopy.[32] Additional discussion regarding causes of 12
quantitative differences between experimental and calculated work functions is provided in Section 3 of the SI. 13
14
3.2. Density of States Pictures of Work Function Trends 15 16 17
As discussed in Section 3.1, the band positions are the dominant contribution setting the value of the 18
BO2 work functions. Here, we illustrate the connection between the band structure and work function using 19
schematic density of states diagrams. Figure 4 is a density of states schematic that illustrates the trend of BO2 20
work functions from Figure 2 by comparing the density of states of an insulating material with an empty 3d 21
band and high ionicity (small amount of B 3d- O 2p hybridization) such as LaScO3 (Figure 4A), a less ionic 22
material (large amount of B 3d- O 2p hybridization) with half or mostly filled 3d band such as LaNiO3 (Figure 23
4B) and a metallic, medium ionicity material (medium amount of B 3d- O 2p hybridization) with a minimally 24
occupied 3d band such as SrVO3 (Figure 4C). The vacuum level, Fermi level and O 2p-band center are denoted 25
as Evac, EFermi, and 2 ( )pO E , respectively. Following the convention of DFT calculations, the position of EFermi is 26

15
at the energy of the highest filled electronic state. The O 2p states are shown in red and the B 3d states are 1
shown in blue. The states that are shaded are filled states. In Figure 4, we made the simplifying approximation 2
that for a fixed surface dipole the O 2p bands remain at a fixed energy level relative to vacuum. Maintaining a 3
constant level of the O 2p band provides us with a straightforward and intuitive way to demonstrate how the 4
work function varies with the band positions and associated properties such as bond ionicity/hybridization and 5
also how the value of the O 2p-band center (x-axis in Figure 3) physically relates to our calculated work 6
function values. While our calculated results are most consistent with a fixed position for the O 2p-band center 7
relative to vacuum under a fixed surface dipole, it is difficult to prove that this rigorously occurs, and some 8
movement of O 2p-band center relative to vacuum is certainly possible between materials. We note that results 9
of X-ray absorption and emission measurements of La(Cr, Mn, Fe, Co, Ni)O3 polycrystalline samples show that 10
the occupied O 2p states may move relative to the vacuum level by approximately +/- 1 eV for varying B-site 11
composition.[32] When we averaged our calculated bulk O 2p-band centers relative to the vacuum level for the 12
BO2- and AO-terminated surfaces we found the standard deviation of O 2p-band center was 0.4 and 1 eV, 13
respectively, which is qualitatively consistent with the spectroscopy results of Ref. [32]. However, these 14
measured and calculated changes mix both movement of the O 2p-band center and changes in the surface 15
dipoles, and we believe that for fixed dipoles the O 2p-band center position relative to vacuum may be quite 16
stable. The Δ values indicate the energy difference between the O 2p-band center and EFermi, equivalent to the x-17
axis of Figure 3. In Figure 4A, the insulating perovskite with empty 3d band has very deep O 2p bands which 18
results in a deep EFermi (relative to the vacuum level), an O 2p-band center close to EFermi and high work 19
function. Because we use the DFT convention with EFermi located at the valence band maximum, the diagram in 20
Figure 4A shows the p-type limit of the work function (i.e., ionization potential) for an insulating perovskite. In 21
Figure 4B, the perovskite with partially filled 3d band has a large amount of band hybridization (i.e. lower 22
ionicity) which results in higher occupied electron energy states, an O 2p-band center further from EFermi 23
compared to Figure 4A, and a slightly lower work function. In Figure 4C, the metallic perovskite with 24
minimally filled 3d band has less band hybridization than the case in Figure 4B, which results in an occupied 25

16
portion of the B 3d band that is more empty, less hybridized and is higher in energy. Since the occupied portion 1
of the B 3d band is higher in energy, EFermi is also higher. Overall, this leads to an O 2p-band center that is 2
further from EFermi and a lower work function. 3
4
Figure 4: Schematic density of states plots for (A) insulating perovskite with empty 3d band such as LaScO3, (B) 5 perovskite with partially or mostly filled 3d band such as LaNiO3, and (C) metallic perovskite with minimally filled 3d 6 band such as SrVO3. The red regions denote O 2p states while the blue regions denote B 3d states. Shaded regions 7 indicate filled states while unshaded regions denote empty states. The labels and symbols are defined in the main text. The 8 case in plot (C) of a material with minimally filled 3d band results in an O 2p-band center furthest below EFermi and a low 9 work function. The Δ values are defined as the difference between the O 2p-band center and EFermi, equivalent to the x-axis 10 of Figure 3. 11 12
The insensitivity of the BO2 work functions to surface dipoles can be understood qualitatively by 13
considering the origin and path of emitted electrons. These densities of states in Figure 4 show that for 14
materials containing 3d electrons the states at EFermi are dominated by hybridized B 3d and O 2p states. 15
Therefore, we can think of the emitted electrons as emerging from the BO2 layers. Thus, the electrons being 16

17
emitted from the BO2 surface are already at the surface and can be directly emitted into vacuum. Recall that, in 1
contrast to the BO2 work function, the AO work functions are dominated by large surface dipoles. Emission 2
from the AO surface involves electrons moving from the subsurface BO2 layer through the AO layer and being 3
emitted. This difference in pathway makes the BO2 surface work function largely insensitive to the surface 4
dipole but the AO surface work function very sensitive to the surface dipole. This explanation of a surface-5
emitting electron experiencing a large, work function-lowering surface dipole via the AO-surface is shown in 6
Figure 5. 7
8
Figure 5: Schematic demonstrating why the BO2 work functions are insensitive to surface dipoles, and the AO work 9 functions are dominated by surface dipoles. (A) Density of states representative of a transition metal perovskite with 10 partially occupied 3d band. The colors and labels are the same as Figure 4. The Fermi level is dominated by B 3d states 11 for both the AO- and BO2-terminated surfaces. Electrons emitting from the surfaces of these materials will originate at the 12 Fermi level, which are predominantly from the BO2 layers. In (B), the emission of surface electrons from the BO2 surface 13 originates from the terminating surface layer. The BO2 work function is dominated by the band positions relative to 14 vacuum, and relatively insensitive to the surface dipoles. In (C), the emission of a surface electron again originates from 15 the BO2 layer, which is now present in the subsurface layer. The terminating surface layer is now an AO-plane, which 16 does not appreciably contribute to the density of states near the Fermi level. Here, the AO surface acts as a large dipole 17 layer, lowering the AO work function. In this way, the work function of the AO surface is dominated by surface dipoles, 18 and is relatively insensitive to the band positions. 19

18
1
From the above discussions we can summarize our understanding of the trend in O 2p band with the 2
work function as follows: The location of the O 2p band relative to EFermi is highly dependent on the number of 3
3d electrons in the system and the hybridization between the B 3d levels and O 2p levels. When proceeding 4
from Ti through Ni, more 3d electrons are added to the system, the bond hybridization increases, the 3d bands 5
fill and move lower in energy, and thus EFermi is lower in energy and closer to the O 2p-band center. Because 6
EFermi is lower in energy, the work function of BO2 surfaces increases as more 3d electrons are added. 7
Furthermore, for the same B-site transition metal element, if the B-site is more oxidized (e.g. comparing Co3+ in 8
LaCoO3 with Co4+ in SrCoO3), the material containing the more oxidized transition metal will exhibit greater 9
hybridization between the B 3d and O 2p bands, thus resulting in higher work functions. From Table 1 and 10
Figure 2, one can see that all SrBO3 materials have higher work functions than their analogous LaBO3 11
materials, except for AO-terminated SrVO3. These hybridization trends with 3d electron filling are consistent 12
with experimental and computational findings of Suntivich and coworkers.[49] Broadly, the band structure 13
progression shown in Figure 4 is a close representation of how the BO2 work function changes with 14
composition and 3d band filling. In the case of the AO work function, the portion of the work function due to 15
surface dipoles is strong enough such that it overwhelms the band physics contributions of Figure 4. This yields 16
a weaker relationship between work function and O 2p-band center (slope significantly less than one, see 17
Figure 3B). 18
19
4. Results and Discussion: SrVO3 as a low work function, metallic perovskite 20 21 22
Our earlier analysis in Section 2.1 has demonstrated that of the 18 perovskite materials considered here, 23
SrVO3 is one of the most promising materials for electron emitting applications, in particular for high power 24
electron beam devices used in defense, scientific research and communications, and as an electron-emitting 25
layer in the renewable energy technology of photon-enhanced thermionic energy conversion devices. The 26
19
metallic perovskite SrVO3 has been successfully synthesized both as a bulk polycrystalline powder[40, 41] and as 1
a controlled (001)-oriented thin film grown with MBE.[42] SrVO3 possesses a very high conductivity of about 2
105 Ω-1cm-1 at room temperature, higher than SrRuO3 (a prototypical metallic perovskite) and on par with 3
elemental metals such as Pt.[42] SrVO3 maintains its structural stability even up to high temperatures of 1300 ºC 4
and under reducing conditions during annealing with an H2/N2 or H2/Ar gas atmosphere.[40, 41, 43] Because 5
perovskites are receptive to compositional modification, there are opportunities with doping SrVO3 to lower its 6
work function further. In this section, we consider alkaline earth metal doping in SrVO3. We also consider the 7
pristine (011) and (111) surface terminations to ascertain the full work function range of SrVO3 and also obtain 8
a more quantitative understanding of which surface terminations should be stable (and thus present in the 9
highest quantity) in a real device. In addition, we consider the effect of surface segregation in SrVO3 as a 10
number of studies have suggested that A-site alloyed perovskites can show significant cation segregation.[47, 50-11
58] 12
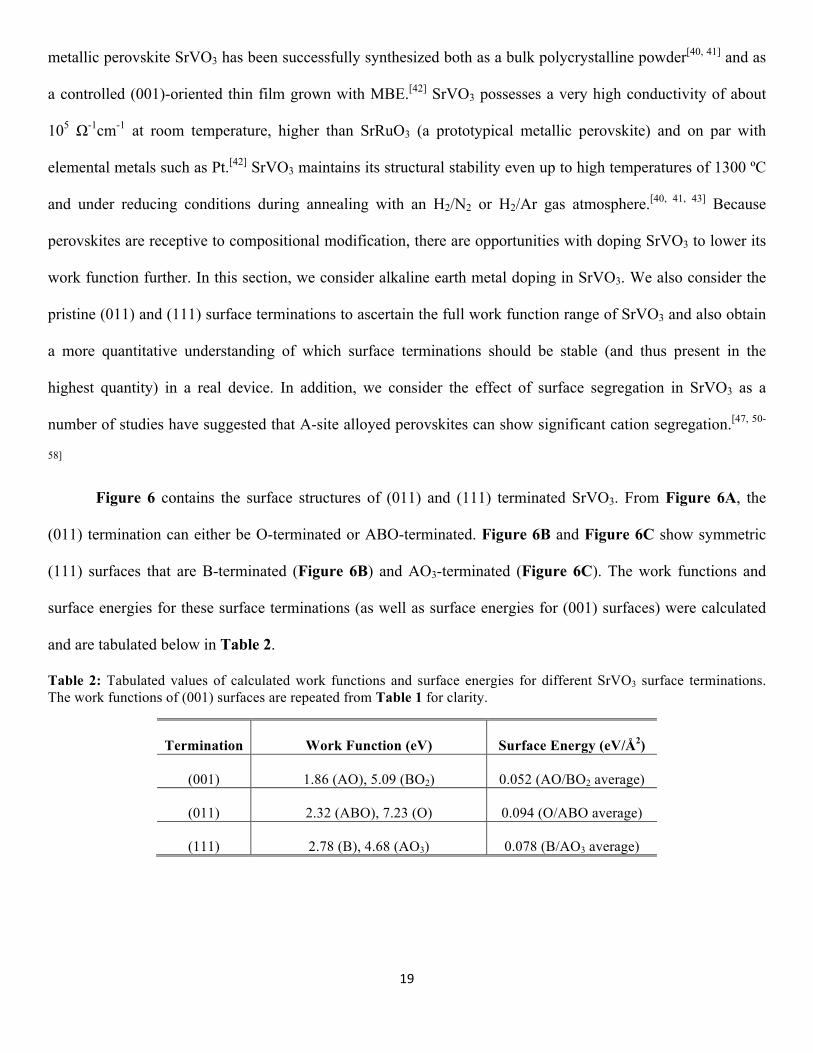
Figure 6 contains the surface structures of (011) and (111) terminated SrVO3. From Figure 6A, the 13
(011) termination can either be O-terminated or ABO-terminated. Figure 6B and Figure 6C show symmetric 14
(111) surfaces that are B-terminated (Figure 6B) and AO3-terminated (Figure 6C). The work functions and 15
surface energies for these surface terminations (as well as surface energies for (001) surfaces) were calculated 16
and are tabulated below in Table 2. 17
Table 2: Tabulated values of calculated work functions and surface energies for different SrVO3 surface terminations. 18 The work functions of (001) surfaces are repeated from Table 1 for clarity. 19
Termination Work Function (eV) Surface Energy (eV/Å2)
(001) 1.86 (AO), 5.09 (BO2) 0.052 (AO/BO2 average)
(011) 2.32 (ABO), 7.23 (O) 0.094 (O/ABO average)
(111) 2.78 (B), 4.68 (AO3) 0.078 (B/AO3 average)

20
1 Figure 6: SrVO3 surface slabs of (011) and (111) orientations. (A) The (011) orientation, whereby the top surface is O-2 terminated and the bottom surface is ABO-terminated. (B) The (111) orientation, with both surfaces terminated as AO3. 3 (C) The (111) orientation, now with both surfaces B-terminated. The large green spheres are Sr, medium-sized red spheres 4 are V (in the middle of the octahedra), and the small red spheres are O. 5
From Table 2, one can see that the pristine (001) surfaces have a lower surface energy and thus more 6
stable than (011) and (111) surfaces, consistent with previous DFT studies.[47, 51, 59] Recent experimental[60-64] 7
and computational studies[57, 64, 65] show that numerous perovskite materials exhibit segregation of alkaline earth 8
elements such as Sr and Ba. From our current calculations, the overall order of stability is: γ(001) < γ(111) < 9
γ(011). The ABO-terminated (011) surface has a reasonably low work function of 2.32 eV, but overall the (011) 10
and (111) surfaces possess higher work functions than AO-terminated (001). The fact that the (001) 11
terminations of SrVO3 are predicted to be the stable terminations, together with the fact that AO-terminated 12
(001) SrVO3 exhibits the lowest work function of the surfaces explored here, further reinforces the choice of 13
SrVO3 as a potentially new low work function material. 14
We now turn to examining the effect of doping the alkaline earth metals Mg, Ca and Ba in SrVO3. From 15
Figure 2, it was suggested from comparing the work function values of SrFeO3, SrCoO3, and BSCF that doping 16
Ba onto the A-site of Sr-based perovskites may result in a lowering of the work function. Here, we focus solely 17
on the AO-terminated (001) surface of SrVO3 since this is the low work function surface termination of interest. 18
The AO-terminated (001) surface was simulated with concentrations of 25%, 50% and 100% (this is equivalent 19

21
to replacing one SrO row with a (Mg, Ca, Ba)O row) site fraction Mg, Ca and Ba on the surface of the AO 1
(001) slab (see Figure 7C). As shown in Figure 7, it was found that surface doping of Mg and Ca raised the 2
work function for all concentrations, while doping Ba lowered the work function for all concentrations. In 3
particular, a site fraction of 100% Ba on the surface resulted in a very low work function of just 1.07 eV. 4
To better understand the role of Ba doping in lowering the work function (i.e. bulk doping versus 5
surface dipole formation), we also simulated a full layer of BaO in place of SrO in the middle of the AO (001) 6
slab. It was found that placement of Ba in the middle of the slab resulted in a barely increased work function of 7
1.90 eV, which is 0.04 eV higher than pure SrVO3. However, placement of the Ba in the top surface layer 8
resulted in a significant lowering of the work function down to 1.07 eV, which is 0.79 eV lower than pure 9
SrVO3. This indicates that the work function lowering from Ba doping is due entirely to altering the surface 10
dipole, rather than altering the Fermi level. By comparing the atomic positions of a pristine SrVO3 surface and 11
SrVO3 with Ba in the surface layer, it is clear that the bond lengths between Ba and sub-surface O (the O in the 12
BO2 layer beneath the surface) is about 0.2 Å longer than the bond length between Sr and the same sub-surface 13
O. This longer bond length is most likely the result of the larger ionic radius of Ba (1.75 Å) over Sr (1.58 Å). [66] 14
This bond lengthening is expected to increase the size of the dipole for Ba at the surface in a direction that will 15
lower the work function compared to Sr, and this bond lengthening is likely a major reason for the work 16
function change with Ba doping. The work function reduction of 0.79 eV amounts to a surface dipole change of 17
approximately 0.26 eV-Å with the addition of a full Ba surface layer, which can be obtained directly from 18
VASP simulations and is also calculable using the Helmholtz equation.[21, 22] 19
20

22
1
Figure 7: Simulated AO-terminated (001) SrVO3 surfaces with a single SrO layer replaced by AO (A=Mg, Ca, Ba), with 2 a focus on Ba. (A) Ba doping in the middle of the surface slab, resulting in a work function of 1.90 eV. (B) Ba doping at 3 the surface of the slab, resulting in an extremely low work function of 1.07 eV. The Ba segregation energy is calculated to 4 be -0.64 eV/Ba, and indicates that Ba will preferentially segregate to the surface. The large green spheres are Sr, the large 5 blue spheres are Ba, medium-sized red spheres are V (in the middle of the octahedra), and the small red spheres are O. 6 The plot in (C) shows how the calculated AO-terminated SrVO3 work function changes when the top surface layer is 7 alloyed with Mg, Ca, and Ba for different concentrations. The only dopant expected to lower the work function is Ba. 8
9

23
Because Ba2+ is a larger cation than Sr2+, it was worth investigating whether cation segregation may 1
occur in doped SrVO3. As discussed previously, cation segregation has been observed in many perovskite 2
materials.[50-57, 60-66] To ascertain if Ba segregation may occur in SrVO3, we calculated the formation energy of 3
substituting Ba in place of Sr for the two cases illustrated in Figure 7, and also calculated the segregation 4
energy of dilute Ba (25% Ba substitution in the middle of the surface slab) to the surface of SrVO3. The energy 5
to substitute Sr for Ba, ΔEsub, was calculated using the equation ( )sub defected perfect BaO SrOE E E x E EΔ = − − − , where 6
Edefected is the total energy of the SrVO3 surface slab with Ba substituting for Sr, Eperfect is the energy of the 7
undefected SrVO3 slab, x is the number of Ba substitutions (in this case x=1 Ba atom in our dilute calculation), 8
and EBaO and ESrO are the total energies of rocksalt BaO and rocksalt SrO, respectively, which are taken as the 9
reference states for Ba and Sr atoms. We found that the energy to substitute Ba for Sr in the middle of the 10
SrVO3 slab (Figure 7A) was 0.26 eV/Ba, while to substitute Ba for Sr on the surface (Figure 7B) was -0.38 11
eV/Ba. The energetic driving force for Ba surface segregation is just the difference of these energies, and is 12
equal to -0.64 eV/Ba. Note that while the value of ΔEsub is, in principle, dependent on temperature, pressure, and 13
choice of reference state, the energy difference reported by calculating the segregation energy is the more 14
physically insightful quantity, and its value is independent of the chosen reference state. The magnitude of this 15
segregation energy is consistent with DFT calculations of cation surface segregation in other systems.[67] 16
Therefore, if Ba is doped into SrVO3, one may expect that over time Ba will diffuse to the surface and can 17
dramatically lower the value of the work function. Analogous calculations for Mg and Ca doping indicate there 18
is essentially no driving force (-0.07 eV/atom for Mg, -0.05 eV/atom for Ca) to segregate these species to the 19
SrVO3 surface compared to the Ba case. A combined experimental and DFT study of Ca, Sr, and Ba doping in 20
(La, Sm)MnO3 has suggested that cation segregation is a combination of both elastic (via lattice strain of 21
mismatched cation sizes) and electrostatic effects attributed to the differing valences of alkaline earth and 22
lanthanide elements as well as interaction with charged defects in doped LaMnO3.[57] In our case of alkaline 23
earth doping in SrVO3 the predicted Ba cation segregation is presumably due primarily to lattice strain, as Mg, 24
Ca, Sr and Ba are all 2+ cations and no charged defects or vacancies have been considered. 25

24
An important consideration of Ba doping in SrVO3 is whether or not the surface-segregated Ba atoms 1
are stable on the surface. To investigate this stability, we compared the adsorption energy of the Ba-O species 2
present on the surface relative to bulk rocksalt BaO using standard GGA-based DFT methods for three cases: 3
1/4 monolayer Ba-O coverage on W(001) following Ref. [21], 7/8 monolayer Ba-O coverage on Sc2O3(011) 4
following Ref. [22], and the present case of 1 monolayer Ba-O coverage on SrVO3 (001). We use GGA-DFT 5
methods here so that direct comparison with previous work can be made. These materials were chosen for 6
comparison with SrVO3 because W(001) with BaO is the dominant emitting surface of typical commercial 7
thermionic cathode devices and Sc2O3(011) with BaO was found to be the most likely candidate for low work 8
function surfaces in scandate cathode devices.[21, 22] We found that the adsorption energy (per Ba-O formula 9
unit) for W(001), Sc2O3(011) and SrVO3(001) are: 0.71 eV/Ba, -0.27 eV/Ba and -1.19 eV/Ba, respectively. 10
Because the time to desorb an atom from a material surface scales exponentially with the adsorption energy, it 11
is evident from the above calculations that at T = 1000 K, which is an approximate temperature used in 12
thermionic emission devices, Ba will reside on the SrVO3(001) surface approximately 5 orders of magnitude 13
longer than on Sc2O3(011), and approximately 9 orders of magnitude longer than on W(001). Overall, the 14
surface-segregated Ba atoms in SrVO3 are much more strongly bonded to the SrVO3 surface than the volatile 15
Ba-O surface dipole layers present in W- and Sc2O3-based electron sources. This may provide a method of 16
obtaining an electron emission source that simultaneously exhibits an ultra-low work function of 1.07 eV and 17
operating lifetime orders of magnitude longer than current dispenser cathode technologies. 18
As we have only considered a small representative set of perovskite materials in this study, it is possible 19
that other low work function perovskite materials besides SrVO3 exist. The O 2p-band center provides an 20
approximate way to predict the work function of either the AO- or BO2-terminated surface from strictly a bulk 21
materials property. In general, surface supercell calculations are quite computationally expensive (especially 22
with HSE functionals), while bulk calculations are many times faster as a result of fewer atoms per supercell 23
and higher supercell symmetry. Thus, the correlation between bulk O 2p-band center and surface work function 24
may enable fast, bulk materials screening of the O 2p-band center to predict work function values of perovskite 25

25
alloys. Calculation of the bulk O 2p-band center is roughly a factor of 25 times faster than calculating the work 1
function (a factor of 50 considering both the AO- and BO2-terminated surfaces), and thus provides a useful 2
estimate of a perovskite work function with comparatively minimal computational time. By high-throughput 3
calculation of perovskite band gaps and O 2p-band centers one could screen for low work function materials.[68-4
70] In particular, any material that meets the conditions of zero (or near-zero) band gap and low O 2p-band 5
center may warrant further investigation by way of surface calculations for quantitative work function values. 6
Some preliminary high-throughput DFT screening using GGA+U has indicated that perovskites within the 7
family of (La, Pr, Y)(Ti, V)O3 and SrVO3 have deep O 2p band centers and a partially filled 3d band, and thus 8
should have low work functions, consistent with the trends in Figure 2. While many of the (La, Pr, Y)(Ti, V)O3 9
materials are Mott-Hubbard insulators and thus may not be sufficiently conducting for low work function 10
cathode applications, further A-site alloying of alkaline earths and B-site alloying with other transition metals 11
within this low O 2p-band composition space may potentially yield smaller (or zero) bandgap materials that are 12
worth further investigation. 13
14
5. Conclusions 15 16 17
In this study, we have computationally explored 20 technologically relevant perovskite materials at 18
idealized undefected compositions to understand how their chemistry influences the value of the work function, 19
and then use this new understanding to search for a new, low work function material for electron emission 20
applications. We have explained compositional trends in the work function using concepts of bonding ionicity, 21
hybridization, band filling, and surface dipoles. We found that the bulk O 2p-band center can function as a 22
semi-quantitative descriptor of the work function for both AO- and BO2-terminated (001) perovskite surfaces. 23
Our usage of the O 2p-band center descriptor has provided both further understanding of the work function 24
physics for these materials and may enable fast computational screening of perovskite materials with a 25
particular work function value. Broadly, the work function depends both on the bulk electronic band filling 26

26
(EFermi position) and the influence of surface dipoles. Based on our analysis, the value of the BO2 surface work 1
function is dominated by bulk band positions while the work function of the AO surfaces is dominated by 2
surface dipoles. Understanding the work function trends in perovskites as well as the physics governing these 3
trends (e.g., band filling versus surface dipoles) is pivotal for the rational design of perovskite-containing 4
devices involving electron transport at interfaces or surfaces. 5
We have computationally predicted SrVO3 to be a new, promising low work function material for 6
electron emission applications such as high power microwave tubes, satellite communications, and possibly as 7
an emissive layer for photon-enhanced thermionic energy converters. SrVO3 is not only predicted to have a low 8
work function, but has been experimentally shown to be stable in reducing environments and exhibit a high 9
electrical conductivity. When doped with Ba, we have shown that Ba will preferentially segregate to the surface 10
and result in an ultra-low work function down to nearly 1 eV. The Ba contained in the SrVO3 surface-emitting 11
layer is significantly more stable than the Ba-containing dipole layers used in conventional thermionic electron 12
emission cathodes such as the B-type W dispenser and scandate cathodes, which should thus produce a stable, 13
highly-emissive, long lifetime electron emitter. 14
15 16
6. Computational Methods 17 18 19
Perovskite structures generally form in the Pm3m (cubic, space group 221), P4mm (tetragonal, space 20
group 99), Pbnm/Pnma (orthorhombic, space group 62), and R3c (rhombohedral, space group 167) 21
symmetries.[71] In this study, we used idealized, undefected 2x2x2 pseudocubic structure lattice constants 22
adopted from full relaxation of the ideal cubic ABO3 symmetry ( Pm3m , SrTiO3, SrVO3, SrFeO3, SrCoO3, 23
SrRuO3, Ba0.5Sr0.5Co0.75Fe0.25O3), orthorhombic symmetry ( Pbnm , LaScO3, LaTiO3, LaVO3, LaCrO3, LaMnO3, 24
La1-xSrxMnO3, LaFeO3, LaRuO3), and rhombohedral symmetry ( R3c , LaCoO3, LaNiO3), and the structures are 25
shown in Figure 1. Our use of pseudocubic structures provides a good approximation to the average cubic 26

27
symmetry exhibited by many of these materials at elevated temperatures of T > 500 K,[5] and provides a 1
structurally consistent set of materials to investigate compositional trends in the surface work function. We 2
expect the compositional trends in work function and physics described in this work to also hold under room 3
temperature conditions. However, some quantitative differences in work function should be expected. Figure 1 4
also provides examples of the asymmetric (Figure 1C, used for La1-xSrxMnO3) and symmetric (Figure 1D and 5
Figure 1E, used for all other materials besides La1-xSrxMnO3) surface slabs used for the work function 6
calculations. Additional details on perovskite bulk and surface calculations are provided in Section 1 of the 7
Supplementary Information (SI). 8
We performed all of our calculations using Density Functional Theory (DFT) as implemented by the 9
Vienna ab initio simulation package (VASP)[72] with a plane wave basis set. We used the hybrid HSE exchange 10
and correlation functional of Heyd, Scuseria and Ernzerhof[18] with Perdew-Burke-Ernzerhof (PBE)-type 11
pseudopotentials[73] utilizing the projector augmented wave (PAW)[74] method for La, Ca, Mg, Ba, Sr, Sc, Ti, V, 12
Cr, Mn, Fe, Co, Ni, Ru and O atoms. The fraction of Hartree-Fock (HF) exchange in the HSE method for each 13
material was obtained from Refs. [20] and [19]. In Refs. [20] and [19], the fraction of HF exchange was fitted to 14
reproduce the experimentally-measured bulk band gap and densities of states from ultraviolet photoemission 15
spectroscopy (UPS) measurements. Thus, the fractions of Hartree-Fock exchange used in our HSE calculations 16
were 0.25 (LaScO3), 0.15 (LaTiO3, LaCrO3, LaMnO3, LaFeO3), 0.125 (LaVO3), 0.05 (LaCoO3) and 0 17
(LaNiO3). For the band insulators SrTiO3 and LaAlO3, a value of 0.25 is used for the HF exchange fraction.[75, 18
76] For the remaining materials, the HF exchange values used were the same as the respective transition metal-19
containing lanthanide perovskite. Therefore, for SrVO3, SrFeO3, SrCoO3, Ba0.5Sr0.5Co0.75Fe0.25O3 (BSCF) and 20
La1-xSrxMnO3 (LSM), the HF values used were 0.125, 0.15, 0.05, 0.05 and 0.15, respectively. This method of 21
tuning the amount of HF exchange to reproduce experimental bulk electronic structure properties such as the 22
band gap has recently been shown to provide more accurate Li insertion voltages (a quantity that depends 23
sensitively on the electronic structure near the Fermi level) than the default HF exchange of 0.25 for a wide 24
range of transition metal oxide materials.[77] Lastly, the HF exchanges for LaRuO3 and SrRuO3 have, to our 25

28
knowledge, not been thoroughly characterized in the same manner as the other perovskites studied here. 1
Therefore, we use an HF value equal to that of LaFeO3 (HF exchange of 0.15) because Fe and Ru are in the 2
same column of the periodic table and thus can be expected to exhibit similar chemistry. Because LaRuO3 and 3
SrRuO3 have not been as widely studied computationally with hybrid functionals, their calculated work 4
functions may show larger errors than the other systems studied here. 5
The valence electron configurations of the atoms utilized in the calculations were La: 5s25p66s25d1, Ca: 6
3s23p64s2, Mg: 2s22p63s2, Ba: 5s25p66s2, Sr: 3s23p64s2, Sc: 3s23p64s23d1, Ti: 3s23p64s23d2, V: 3p64s13d4, Cr: 7
3p64s13d5, Mn: 3p64s23d5, Fe: 3s23p64s13d7, Co: 4s13d8, Ni: 3p64s23d8, Al: 3s23p1, Ru: 4p65s14d7 and O: 2s22p4 8
respectively. The plane wave cutoff energies were, at a minimum, 30% larger than the maximum plane wave 9
energy of the chosen pseudopotentials, and equal to a minimum of 405 eV for all systems. We performed all 10
calculations with spin polarization. The Monkhorst-Pack scheme was used for reciprocal space integration in 11
the Brillouin Zone for bulk perovskite materials.[78] For surface calculations we used a Γ-centered reciprocal 12
space integration scheme instead of Monkhorst-Pack as we use only one k-point, and the electronic 13
minimization was performed simultaneously for all energy bands. A 2x2x2 k-point mesh was used for the 14
2x2x2 bulk supercells of all LaBO3 materials (40 atoms per cell), with total energy convergence (ionic and 15
electronic degrees of freedom) of 3 meV per formula unit. For surface slab calculations, we reduced the k-point 16
mesh to 1x1x1 and maintained a minimum vacuum distance of 15 Å. We verified that all calculated work 17
functions were well-converged (error of approximately +/- 0.1 eV) with respect to both slab thickness and 18
vacuum region thickness, with the exception of LaAlO3 and LaScO3, which are highly polar materials and with 19
work functions which converge very slowly with slab thickness. Therefore, work function results for LaScO3 20
and LaAlO3 have a larger error of approximately +/- 0.4 eV, based on GGA calculations of symmetric (001) 21
surface slabs of LaAlO3 between 5 and 17 layers. Lastly, we implemented the dipole correction in VASP to 22
ensure vacuum level convergence, and the dipole correction was calculated only in the axial direction normal to 23
the terminating surface. Additional details regarding the bulk and surface calculations of the perovskite 24
materials considered here can be found in Section 1 and Section 2 of the SI. 25

29
1
Supporting Information 2
Supporting Information is available from the Wiley Online Library or from the author 3
4
Acknowledgements 5
This work was supported by the US Air Force Office of Scientific Research through grants No. FA9550-6
08-0052 and No. FA9550-11-0299. Computational support was provided by the Extreme Science and 7
Engineering Discovery Environment (XSEDE), which is supported by National Science Foundation Grant No. 8
OCI-1053575. This research was performed using the compute resources and assistance of the UW-Madison 9
Center For High Throughput Computing (CHTC) in the Department of Computer Sciences. 10
11
12
13
14
__________________________________________________________________________________________ 15
16
References 17 18
[1] J. Luo, Z.-J. Qiu, J. Deng, C. Zhao, J. Li, W. Wang, D. Chen, D. Wu, M. Östling, T. Ye, S.-L. Zhang, 19 Microelectronic Engineering 2013. 20 [2] T. Susaki, A. Makishima, H. Hosono, Physical Review B 2011, 84, 115456. 21 [3] P. Zubko, S. Gariglio, M. Gabay, P. Ghosez, J.-M. Triscone, Annual Review of Condensed Matter 22 Physics 2011, 2, 141. 23 [4] J. Suntivich, H. A. Gasteiger, N. Yabuuchi, H. Nakanishi, J. B. Goodenough, Y. Shao-Horn, Nat Chem 24 2011, 3, 546. 25 [5] Y.-L. Lee, J. Kleis, J. Rossmeisl, D. Morgan, Physical Review B 2009, 80, 224101. 26 [6] Y.-L. Lee, J. Kleis, J. Rossmeisl, Y. Shao-Horn, D. Morgan, Energy & Environmental Science 2011, 4, 27 3966. 28 [7] J. Suntivich, K. J. May, H. A. Gasteiger, J. B. Goodenough, Y. Shao-Horn, Science 2011, 334, 1383. 29 [8] A. M. Kolpak, S. Ismail-Beigi, Physical Review B 2012, 85, 195318. 30 [9] K. Garrity, A. Kolpak, S. Ismail-Beigi, Journal of Materials Science 2012, 47, 7417. 31

30
[10] X. F. Chen, H. Lu, W. G. Zhu, O. K. Tan, Surface and Coatings Technology 2005, 198, 266. 1 [11] X. Chen, H. Lu, H. Bian, W. Zhu, C. Sun, O. Tan, Journal of Electroceramics 2006, 16, 419. 2 [12] T.-H. Yang, Y.-W. Harn, K.-C. Chiu, C.-L. Fan, J.-M. Wu, Journal of Materials Chemistry 2012, 22, 3 17071. 4 [13] H. J. Bian, X. F. Chen, J. S. Pan, C. Q. Sun, W. Zhu, Journal of Vacuum Science and Technology B 5 2007, 25, 817. 6 [14] X. W. Li, A. Gupta, G. Xiao, G. Q. Gong, Applied Physics Letters 1997, 71, 1124. 7 [15] J. Teresa, A. Barthelemy, A. Fert, J. Contour, F. Montaigne, P. Seneor, Science 1999, 286. 8 [16] M. Mrovec, J. M. Albina, B. Meyer, C. Elsässer, Physical Review B 2009, 79, 245121. 9 [17] N. Horiuchi, T. Hoshina, H. Takeda, T. Tsurumi, Journal of the Ceramic Society of Japan 2010, 118, 10 664. 11 [18] J. Heyd, G. E. Scuseria, M. Ernzerhof, The Journal of Chemical Physics 2003, 118, 8207. 12 [19] F. Cesare, Journal of Physics: Condensed Matter 2014, 26, 253202. 13 [20] J. He, C. Franchini, Physical Review B 2012, 86, 235117. 14 [21] V. Vlahos, J. H. Booske, D. Morgan, Physical Review B 2010, 81, 054207. 15 [22] R. M. Jacobs, J. H. Booske, D. Morgan, The Journal of Physical Chemistry C 2014, 118, 19742. 16 [23] P. M. Zagwijn, J. W. M. Frenken, U. van Slooten, P. A. Duine, Applied Surface Science 1997, 111, 35. 17 [24] J. H. Booske, Physics of Plasmas 2008, 15, 055502. 18 [25] A. S. Gilmour, Principles of Traveling Wave Tubes, Artech House, Norwood, MA 1994. 19 [26] J. W. Schwede, I. Bargatin, D. C. Riley, B. E. Hardin, S. J. Rosenthal, Y. Sun, F. Schmitt, P. Pianetta, R. 20 T. Howe, Z.-X. Shen, N. A. Melosh, Nature Materials 2010, 9, 762. 21 [27] J. W. Schwede, T. Sarmiento, V. K. Narasimhan, S. J. Rosenthal, D. C. Riley, F. Schmitt, I. Bargatin, K. 22 Sahasrabuddhe, R. T. Howe, J. S. Harris, N. A. Melosh, Z. X. Shen, Nature Communications 2013, 4, 1576. 23 [28] D. W. Reagor, S. Y. Lee, Y. Li, Q. X. Jia, Journal of Applied Physics 2004, 95, 7971. 24 [29] G. M. Vanacore, L. F. Zagonel, N. Barrett, Surface Science 2010, 604, 1674. 25 [30] T. Kida, G. Guan, A. Yoshida, Chemical Physics Letters 2003, 371, 563. 26 [31] K. A. Stoerzinger, M. Risch, J. Suntivich, W. M. Lu, J. Zhou, M. D. Biegalski, H. M. Christen, Ariando, 27 T. Venkatesan, Y. Shao-Horn, Energy & Environmental Science 2013, 6, 1582. 28 [32] W. T. Hong, K. A. Stoerzinger, B. Moritz, T. P. Devereaux, W. Yang, Y. Shao-Horn, The Journal of 29 Physical Chemistry C 2015, 119, 2063. 30 [33] M. Krčmar, C. L. Fu, Physical Review B 2003, 68, 115404. 31 [34] B. Zheng, N. Binggeli, Physical Review B 2010, 82, 245311. 32 [35] W. Tang, E. Sanville, G. Henkelman, Journal of Physics: Condensed Matter 2009, 21, 084204. 33 [36] G. Henkelman, A. Arnaldsson, H. Jónsson, Computational Materials Science 2006, 36, 354. 34 [37] W. Maus-Friedrichs, M. Frerichs, A. Gunhold, S. Krischok, V. Kempter, G. Bihlmayer, Surface Science 35 2002, 515, 499. 36 [38] M. Minohara, R. Yasuhara, H. Kumigashira, M. Oshima, Physical Review B 2010, 81, 235322. 37 [39] S. P. S. Badwal, T. Bak, S. P. Jiang, J. Love, J. Nowotny, M. Rekas, C. C. Sorrell, E. R. Vance, Journal 38 of Physics and Chemistry of Solids 2001, 62, 723. 39 [40] T. Maekawa, K. Kurosaki, S. Yamanaka, Journal of Alloys and Compounds 2006, 426, 46. 40 [41] M. Onoda, H. Ohta, H. Nagasawa, Solid State Communications 1991, 79, 281. 41 [42] J. A. Moyer, C. Eaton, R. Engel-Herbert, Advanced Materials 2013, 25, 3578. 42 [43] S. Hui, A. Petric, Solid State Ionics 2001, 143, 275. 43 [44] Y.-L. Lee, D. Lee, X. R. Wang, H. N. Lee, D. Morgan, Y. Shao-Horn, The Journal of Physical 44 Chemistry Letters 2016, 7, 244. 45 [45] A. Grimaud, K. J. May, C. E. Carlton, Y.-L. Lee, M. Risch, W. T. Hong, J. Zhou, Y. Shao-Horn, Nat 46 Commun 2013, 4. 47 [46] W. T. Hong, M. Risch, K. A. Stoerzinger, A. Grimaud, J. Suntivich, Y. Shao-Horn, Energy & 48 Environmental Science 2015. 49 [47] Y.-L. Lee, D. Morgan, Physical Review B 2015, 91, 195430. 50

31
[48] G. Jacek, F. Fabio, N. Claudine, Reports on Progress in Physics 2008, 71, 016501. 1 [49] J. Suntivich, W. T. Hong, Y.-L. Lee, J. M. Rondinelli, W. Yang, J. B. Goodenough, B. Dabrowski, J. W. 2 Freeland, Y. Shao-Horn, The Journal of Physical Chemistry C 2014, 118, 1856. 3 [50] Z. Cai, M. Kubicek, J. Fleig, B. Yildiz, Chemistry of Materials 2012, 24, 1116. 4 [51] H. Ding, A. V. Virkar, M. Liu, F. Liu, Physical Chemistry Chemical Physics 2013, 15, 489. 5 [52] Y. Orikasa, E. J. Crumlin, S. Sako, K. Amezawa, T. Uruga, M. D. Biegalski, H. M. Christen, Y. 6 Uchimoto, Y. Shao-Horn, ECS Electrochemistry Letters 2014, 3, F23. 7 [53] Z. Cai, Y. Kuru, J. W. Han, Y. Chen, B. Yildiz, Journal of the American Chemical Society 2011, 133, 8 17696. 9 [54] Z. Feng, Y. Yacoby, W. T. Hong, H. Zhou, M. D. Biegalski, H. M. Christen, Y. Shao-Horn, Energy & 10 Environmental Science 2014, 7, 1166. 11 [55] J. Druce, T. Ishihara, J. Kilner, Solid State Ionics 2014, 262, 893. 12 [56] M. Burriel, S. Wilkins, J. P. Hill, M. A. Munoz-Marquez, H. H. Brongersma, J. A. Kilner, M. P. Ryan, 13 S. J. Skinner, Energy & Environmental Science 2014, 7, 311. 14 [57] W. Lee, J. W. Han, Y. Chen, Z. Cai, B. Yildiz, Journal of the American Chemical Society 2013, 135, 15 7909. 16 [58] T. T. Fister, D. D. Fong, J. A. Eastman, P. M. Baldo, M. J. Highland, P. H. Fuoss, K. R. 17 Balasubramaniam, J. C. Meador, P. A. Salvador, Applied Physics Letters 2008, 93, 151904. 18 [59] Y. Choi, D. S. Mebane, M. C. Lin, M. Liu, Chemistry of Materials 2007, 19, 1690. 19 [60] J. Druce, H. Tellez, M. Burriel, M. D. Sharp, L. J. Fawcett, S. N. Cook, D. S. McPhail, T. Ishihara, H. 20 H. Brongersma, J. A. Kilner, Energy & Environmental Science 2014. 21 [61] J. Kilner, S. Skinner, H. Brongersma, J Solid State Electrochem 2011, 15, 861. 22 [62] I. C. Fullarton, J. P. Jacobs, H. E. van Benthem, J. A. Kilner, H. H. Brongersma, P. J. Scanlon, B. C. H. 23 Steele, Ionics 1995, 1, 51. 24 [63] Z. Feng, Y. Yacoby, W. T. Hong, H. Zhou, M. D. Biegalski, H. M. Christen, Y. Shao-Horn, Energy & 25 Environmental Science 2014, 7, 1166. 26 [64] D. Lee, Y.-L. Lee, W. T. Hong, M. D. Biegalski, D. Morgan, Y. Shao-Horn, Journal of Materials 27 Chemistry A 2015, 3, 2144. 28 [65] Y.-L. Lee, M. J. Gadre, Y. Shao-Horn, D. Morgan, Physical Chemistry Chemical Physics 2015, 17, 29 21643. 30 [66] R. Shannon, Acta Crystallographica Section A 1976, 32, 751. 31 [67] M. J. Gadre, Y.-L. Lee, D. Morgan, Physical Chemistry Chemical Physics 2012, 14, 2606. 32 [68] S. Curtarolo, G. L. W. Hart, M. B. Nardelli, N. Mingo, S. Sanvito, O. Levy, Nat Mater 2013, 12, 191. 33 [69] A. Jain, G. Hautier, C. J. Moore, S. Ping Ong, C. C. Fischer, T. Mueller, K. A. Persson, G. Ceder, 34 Computational Materials Science 2011, 50, 2295. 35 [70] T. Angsten, T. Mayeshiba, H. Wu, D. Morgan, New Journal of Physics 2014, 16, 015018. 36 [71] M. A. Pena, J. L. G. Fierro, Chem. Rev. 2001, 101. 37 [72] G. Kresse, J. Furthmuller, Physical Review B 1996, 54, 11169. 38 [73] J. P. Perdew, K. Burke, M. Ernzerhof, Physical Review Letters 1996, 77, 3865. 39 [74] G. Kresse, D. Joubert, Physical Review B 1999, 59, 1758. 40 [75] R. Wahl, D. Vogtenhuber, G. Kresse, Physical Review B 2008, 78, 104116. 41 [76] M. Choi, F. Oba, Y. Kumagai, I. Tanaka, Advanced Materials 2013, 25, 86. 42 [77] D.-H. Seo, A. Urban, G. Ceder, Physical Review B 2015, 92, 115118. 43 [78] H. J. Monkhorst, J. D. Pack, Physical Review B 1976, 13, 5188. 44
45
46
47

32
1