1 the quality chasm in the behavioral health treatment for america's youth michael l. dennis,...
TRANSCRIPT

1
The Quality Chasm in the Behavioral Health Treatment For America's Youth
Michael L. Dennis, Ph.D. Chestnut Health Systems
Normal, IL
Presentation for the 26th Annual Children’s Mental Health Research & Policy Conference, Tampa, FL, Mark 3-6, 2013. Hosted by the University of South Florida’s The Department of
Child & Family Studies and The Institute for Translational Research in Adolescent Behavioral Health (National Institute of Drug Abuse Grant no. R25DA031103). This presentation uses
data from NIDA grants no. R01 DA15523, R37-DA11323, R01 DA021174,, CSAT contract no. 270-12-0397, Library of Congress contract no. LCFRD11C0007 and several public data sets.
The author would like to thank Christy Scott, Barb Estrada, Rodney Funk, Lilia Hristova, , Brook Hunter, Rachel Kohlbecker, Lisa Nicholson, and Belinda Willis for their assistance in
preparing this presentation. The opinions expressed are those of the author and do not reflect positions of the government. The presentation is available electronically at
www.chestnut.org/li/posters . Please address comments or questions to the author at [email protected] or 309-451-7801.
.p

2
The Goals of this Presentation are to Examine:
1. The quality chasm in behavioral health care, including the low rates of treatment access and engagement, including evidence of health disparities by gender, race, age and involvement in the juvenile justice system.
2. The prevalence and co-morbidity of internalizing and externalizing mental health disorders, substance use disorders, and crime/violence including how they vary with age
3. The general factors associated with better outcomes in terms of reduced mental health, substance use and illegal activities

Size & Overlaps of Mental Health and Substance Use Disorder Populations (in millions)
3
Any Comor-bid
Severe Treat-ment
Any Comor-bid
Severe Treat-ment
Mental Health
58 15 14 25
Substance
21 15 7 2
% MH
1 0.2586206896551
72
0.2413793103448
28
0.4310344827586
21
% SUD
1 0.7142857142857
14
0.3333333333333
33
0.0952380952380
952
1030507090
10%30%50%70%90%
Source: Institute of Medicine (2005) Improving the quality of health care for mental health and substance-use conditions. Crossing the Quality Chasm Series. Washington, DC: Author
Comorbidity 15% of those with MH but 71% of those with SUD
Very Low Rates of Treatment Participation
More MH than SUD

Quality Chasm in Treatment (in millions)
4
AnyTreatment
TreatmentCompliant
ActualComorbid
Identifiedin Practice
Getting ContinuingCare
AnyTreatment
TreatmentCompliant
ActualComorbid
Identifiedin Practice
Getting ContinuingCare
Mental Health
25 7.5 9.125 4.25 3.5
Substance
2 1 1.4 0.38 0.36
% MH
1 0.3 0.365 0.17 0.14
% SUD
1 0.5 0.7 0.19 0.18
5
15
25
35
45
10%
30%
50%
70%
90%
Source: Institute of Medicine (2005) Improving the quality of health care for mental health and substance-use conditions. Crossing the Quality Chasm Series. Washington, DC: Author
Low rates of Treatment Compliance
Low rates of Identifying Comorbidity
Low rates of Cont. Care

12 to 17 18 to 25 26 or older0%
5%
10%
15%
20%
25%
7.4%
20.1%
7.0%
0.4% 1.1% 0.6%
Abuse or Dependence in past yearTreatment in past year
Problems and Treatment Participation Rates Vary by Age
Source: SAMHSA 2010. National Survey On Drug Use And Health, 2010 [Computer file]
Over 88% of adolescent and young adult treatment and over 50% of adult treatment is publicly funded
Few Get Treatment: 1 in 20 adolescents, 1 in 18 young adults, 1 in 11 adults

Potential to Improve Identification by Screening for SUD in more sites
Source: SAMHSA 2010. National Survey On Drug Use And Health, 2010 [Computer file]
SUD Tx
Det./Ja
il
Prob/
Parol
e
Hospt
ial
MH T
x
Emer
. Dep
t.
Wor
k
Schoo
l 0%
20%
40%
60%
80%
100%10
%
8%
15%
11% 23
%
49%
46%
95%
10%
8% 11%
11% 23
%
38%
80%
Adolescents Adults
% A
ny
Con
tact
ACA’s expansion of School Based Health Centers present a major opportunity to close the gap
Rise of Workplace Wellness programs with health risk assessments

Less than 80% of the Clients Engage in Treatment for 45 days or more (ONC measure of quality)
Total Outpatient Intensive Outpatient
Residential0%
10%
20%
30%
40%
50%
60%
70%
80%
90%
100%
68%74%
68%
48%
59%
72%
58%
28%
58%
73%
59%
29%
Adolescents Young Adults Adults
Source: Office of Applied Studies 2009 Discharge – Treatment Episode Data Set (TEDS)

Less than Half of the Clients Stay in Treatment the 90 days Recommended by Research
Source: Office of Applied Studies 2009 Discharge – Treatment Episode Data Set (TEDS)
Total Outpatient Intensive Outpatient
Residential0%
10%
20%
30%
40%
50%
60%
70%
80%
90%
100%
44%50%
40%
24%
38%
50%
32%
14%
39%
53%
34%
16%
Adolescents Young Adults Adults

Data on 29,782 clients from 230 local evaluations in2011 SAMHSA/CSAT GAIN Data Set
(89% with 1+ follow-up)
AK
AL
ARAZ
CA CO
CTDC
DE
FL
GA
HI
IA
ID
IL IN
KS KY
LA
MA
MD
ME
MI
MN
MO
MS
MT
NC
ND
NE
NH
NJ
NM
NV
NY
OH
OK
OR
PARI
SC
SD
TN
TX
UTVA
VT
WA
WI
WV
WY
PR
VI
GU
AAFTARTATDCATMBIRTCYTDCEATFDC
JTDCOJJDPORPRF-JDCSCYTCEYORP
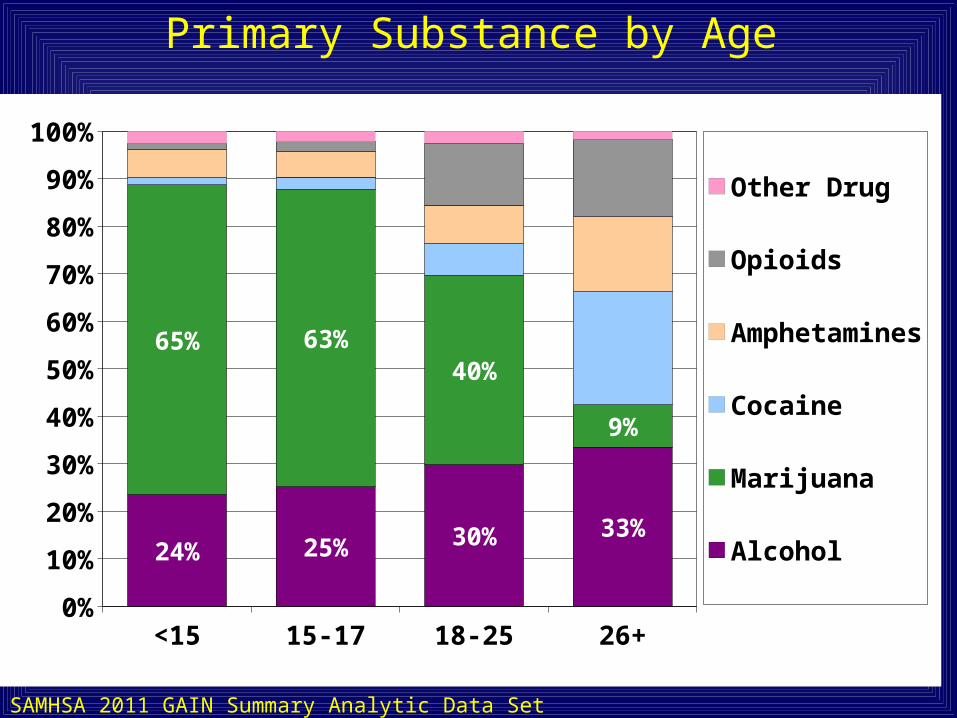
Primary Substance by Age
<15 15-17 18-25 26+0%
10%
20%
30%
40%
50%
60%
70%
80%
90%
100%
24% 25% 30% 33%
65% 63%40%
9%
Other Drug
Opioids
Amphetamines
Cocaine
Marijuana
Alcohol
SAMHSA 2011 GAIN Summary Analytic Data Set (n=27,716)

Past Year Substance Severity by Age
<15 15-17 18-25 26+0%
10%
20%
30%
40%
50%
60%
70%
80%
90%
100%
41%49% 51% 48%
PY De-pendence
PY Abuse
PY Use
No PY Use
SAMHSA 2011 GAIN Summary Analytic Data Set (n=29,358)
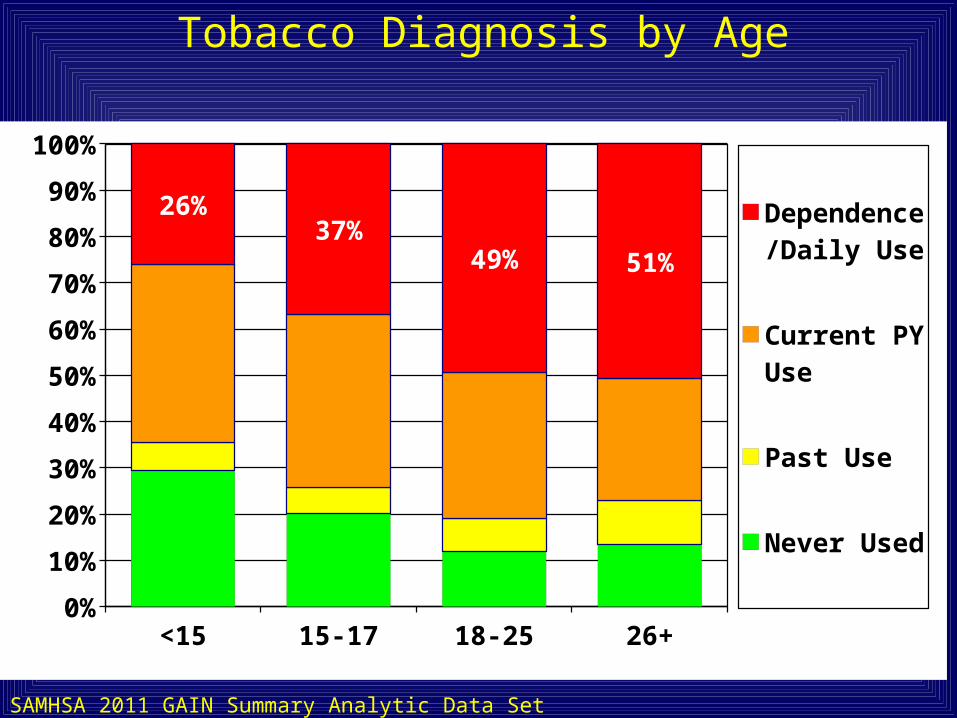
Tobacco Diagnosis by Age
<15 15-17 18-25 26+0%
10%
20%
30%
40%
50%
60%
70%
80%
90%
100%
26%37%
49% 51%
Dependence/Daily Use
Current PY Use
Past Use
Never Used
SAMHSA 2011 GAIN Summary Analytic Data Set (n=27,384)

Mental Health Disorders by Age
<15 15-17 18-25 26+0%
10%
20%
30%
40%
50%
60%
70%
80%
90%
100%
33% 34% 31% 26% Both
Internalizing Disorders Only
Externalizing Disorders Only
Neither
SAMHSA 2011 GAIN Summary Analytic Data Set (n=29,684)

Type of Crime by Age
<15 15-17 18-25 26+0%
10%
20%
30%
40%
50%
60%
70%
80%
90%
100%
45% 43%
27%
9%
Violent Crime*
Other Crime**
Drug Use only
SAMHSA 2011 GAIN Summary Analytic Data Set (n=29,377)
* Violent crime includes assault, rape, murder, and arson.** Other crime includes vandalism, possession of stolen goods, forgery, and theft.

Severity of Victimization by Age
<15 15-17 18-25 26+0%
10%
20%
30%
40%
50%
60%
70%
80%
90%
100%
39% 44%53% 59%
High Severity (4-15)
Moderate Severity (1-3)
Low Severity (0)
SAMHSA 2011 GAIN Summary Analytic Data Set (n=29,501)

Homicidal/Suicidal Thoughts by Age
<15 15-17 18-25 26+0%
10%
20%
30%
40%
50%
60%
70%
80%
90%
100% 3% 3%2% 3%
#REF!
#REF!
#REF!
SAMHSA 2011 GAIN Summary Analytic Data Set (n=29,469)

Count of Major Clinical Problems at Intake
Other drug disorder
Cannabis disorder
Alcohol disorder
CD
ADHD
Depression
Trauma
Anxiety
Violence/ illegal activity
Victimization
Suicidial Thoughts
Major Clinical Problems*
0% 20% 40% 60% 80% 100%
34%
33%
21%
50%
43%
35%
25%
14%
79%62%
12%48% 13% 13% 11% 9% 6%
East
Five to Twelve
Four
Three
Two
One
Source: CSAT 2010 AT Summary Analytic Data Set (n=17,978)

Multiple Problems are the Norm Across All age Groups
<15 15-17 18-25 26+0%
10%
20%
30%
40%
50%
60%
70%
80%
90%
100%
45% 48% 46% 42%
Five to Twelve
Four
Three
Two
One
None
SAMHSA 2011 GAIN Summary Analytic Data Set (n=29,782)
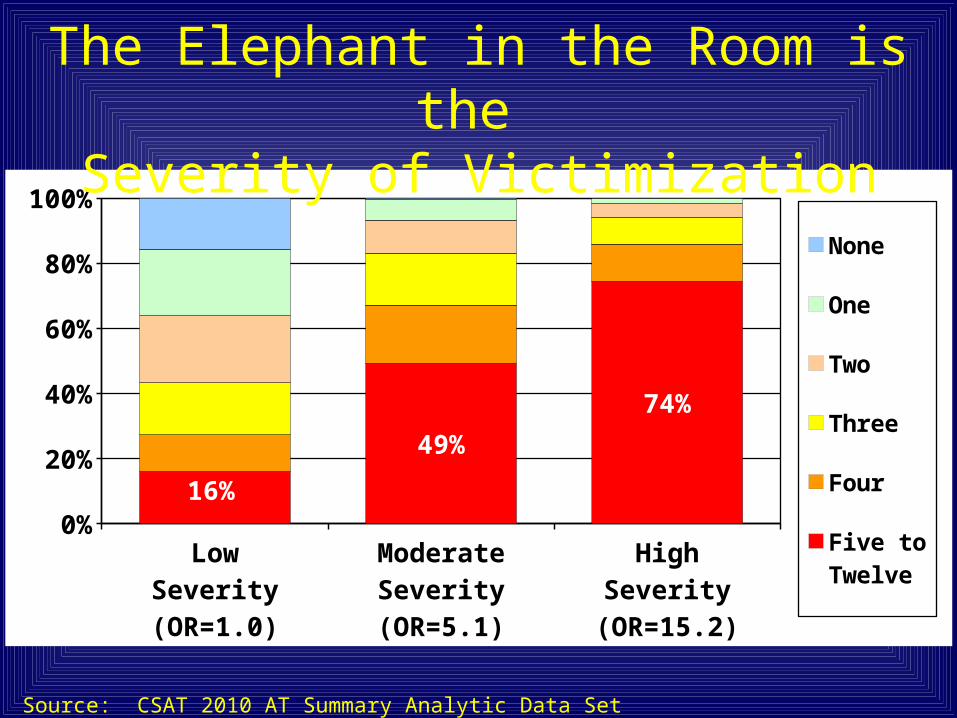
LowSeverity(OR=1.0)
ModerateSeverity(OR=5.1)
HighSeverity
(OR=15.2)
0%10%20%30%40%50%60%70%80%90%
100%
16%
49%
74%
None
One
Two
Three
Four
Five to Twelve
The Elephant in the Room is the Severity of Victimization
Source: CSAT 2010 AT Summary Analytic Data Set (n=18,120)

Environmental Strengths Index by Age
<15 15-17 18-25 26+0%
10%
20%
30%
40%
50%
60%
70%
80%
90%
100% 5% 6% 11% 16%Low Strength(0-2)
Moderate Strength (3-5)
High Strength(12-16)
SAMHSA 2011 GAIN Summary Analytic Data Set (n=27,625)

Unmet Need for Mental Health Treatment by 3 Months
<15 15-17 18-26 26+0%
10%20%30%40%50%60%70%80%90%
100%
72% 71%74%
53%
* p<.05
Age*
SAMHSA 2011 GAIN SA Data Set subset to has 3m Follow up (n=14,358)
Higher for Adolescents and
Young Adults
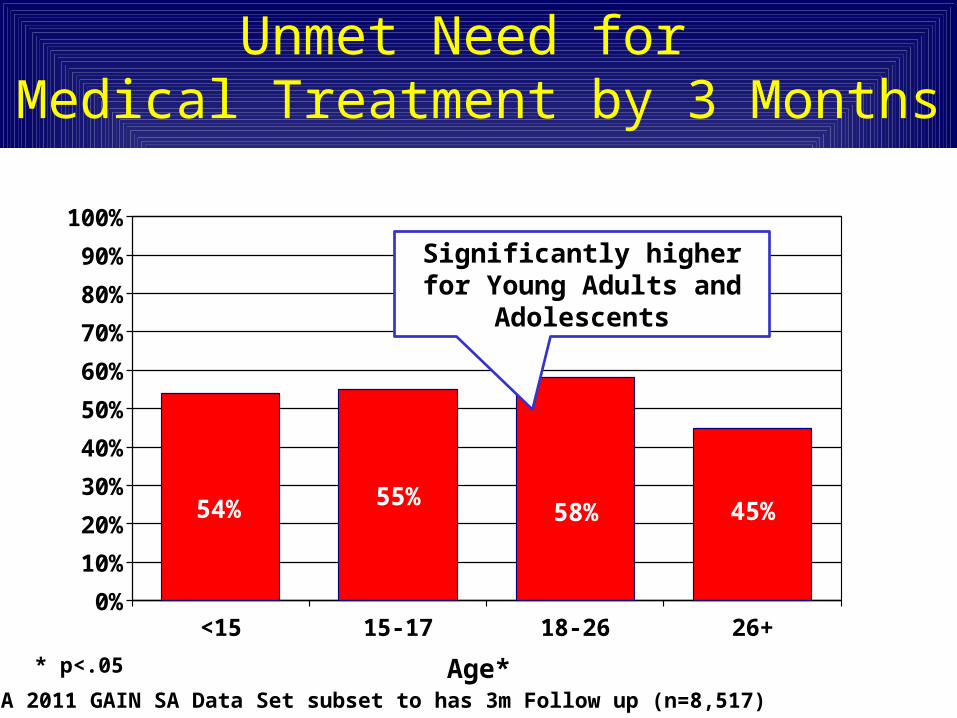
Unmet Need for Medical Treatment by 3 Months
<15 15-17 18-26 26+0%
10%
20%
30%
40%
50%
60%
70%
80%
90%
100%
54% 55%58% 45%
* p<.05 Age*SAMHSA 2011 GAIN SA Data Set subset to has 3m Follow up (n=8,517)
Significantly higher for Young Adults and Adolescents

Relative Percent Change in Abstinence (6 months minus intake/intake) by Age
<15 15-17 18-25 26+0%
10%20%30%40%50%60%70%80%90%
100%
62%51%
32%24%
SAMHSA 2011 GAIN SA Data Set subset to 6 Month Follow up (n=20,181)

Inta
ke
Las
t W
ave
Inta
ke
Las
t W
ave
Inta
ke
Las
t W
ave
Abstinence No Social Conseq.
No Justice Involv.
0%10%20%30%40%50%60%70%80%90%
100%
26+
18-25
15-17
<15
Change in GPRA Outcomes by Age (Intake to Last Wave*)
*Last wave is the last follow-up
SAMHSA 2011 GAIN SA Data Set subset to 1+ Follow ups

Inta
ke
Las
t W
ave
Inta
ke
Las
t W
ave
Inta
ke
Las
t W
ave
Housing Vocationally Engaged
Socially Connected
0%10%20%30%40%50%60%70%80%90%
100%
26+
18-25
15-17
<15
Change in GPRA Outcomes by Age (Intake to Last Wave*)
*Last wave is the last follow-up
SAMHSA 2011 GAIN SA Data Set subset to 1+ Follow ups
26
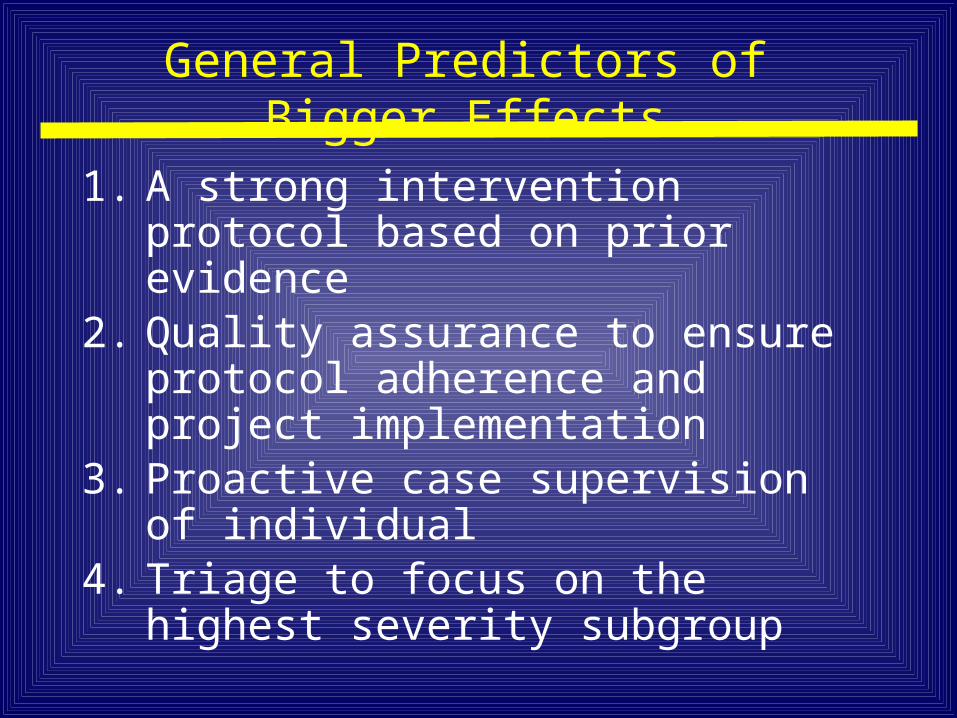
General Predictors of Bigger Effects
1. A strong intervention protocol based on prior evidence
2. Quality assurance to ensure protocol adherence and project implementation
3. Proactive case supervision of individual4. Triage to focus on the highest severity
subgroup

27
Impact of the numbers of these Favorable features on Recidivism in 509 Juvenile Justice
Studies in Lipsey Meta Analysis
Source: Adapted from Lipsey, 1997, 2005
Average Practice
The more features, the lower the recidivism
28
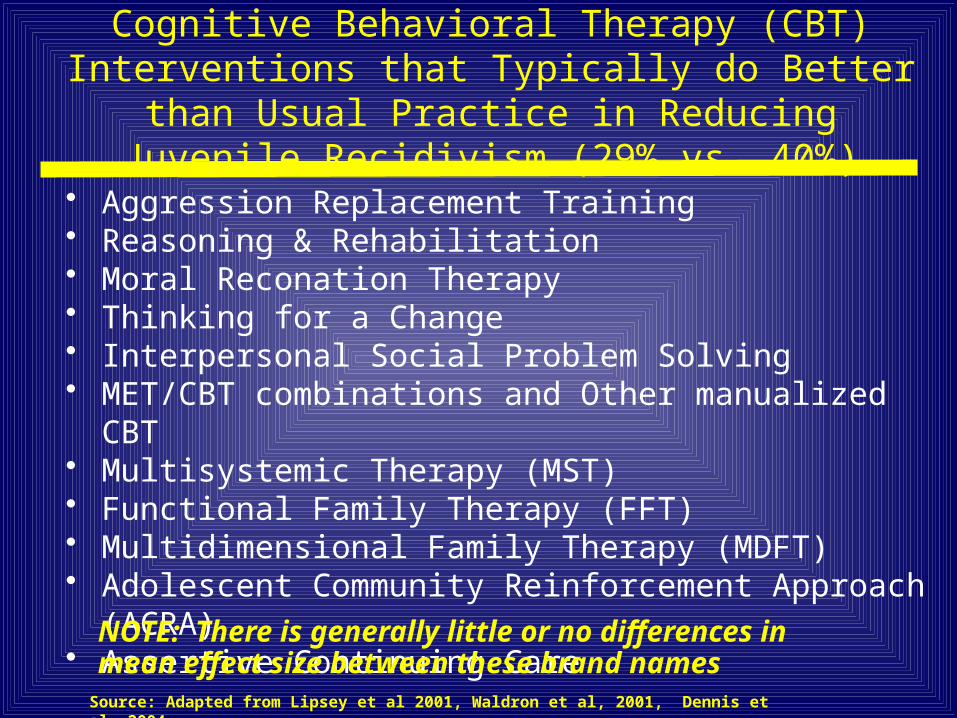
Cognitive Behavioral Therapy (CBT) Interventions that Typically do Better than Usual Practice in Reducing
Juvenile Recidivism (29% vs. 40%)
• Aggression Replacement Training• Reasoning & Rehabilitation• Moral Reconation Therapy• Thinking for a Change• Interpersonal Social Problem Solving• MET/CBT combinations and Other manualized CBT• Multisystemic Therapy (MST)• Functional Family Therapy (FFT)• Multidimensional Family Therapy (MDFT)• Adolescent Community Reinforcement Approach (ACRA)• Assertive Continuing Care
Source: Adapted from Lipsey et al 2001, Waldron et al, 2001, Dennis et al, 2004
NOTE: There is generally little or no differences in mean effect size between these brand names

29
Implementation is Essential (Reduction in Recidivism from .50 Control Group Rate)
The effect of a well implemented weak program is as big as a strong program implemented poorly
The best is to have a strong program implemented well
Thus one should optimally pick the strongest intervention that one can implement well
Source: Adapted from Lipsey, 1997, 2005

30
Change in Abstinence by level of Support: Adolescent Community Reinforcement
Approach (A-CRA)
4%
24%
0%
10%
20%
30%
40%
50%
60%
70%
80%
90%
100%
Training Only Training, Coaching,Certification, Monitoring
% P
oin
t C
han
ge in
Ab
stin
ence
Source: CSAT 2008 SA Dataset subset to 6 Month Follow up (n=1,961)
Effects associated with Coaching, Certification
and Monitoring (OR=7.6)

Key Points to Take Away
• There is a major quality chasm in current practice that are even worse for adolescents and young adults
• Multiple co-occurring problems are the norm, vary in mix by age and heavily related to victimization and trauma
• The best predictors of outcome are the use of evidenced based assessment and practice that have worked for others, have strong quality assurance, strong case supervision, and good triage of services to well defined problems.