1 the net generation facts and e-lusions. 2 presenters ms. patricia cuocco – senior director its...
Post on 18-Dec-2015
215 views
TRANSCRIPT
1
The Net Generation
Facts and E-Lusions
2
Presenters
• Ms. Patricia Cuocco – Senior Director ITS
• Dr. Stephen Daigle – Sr. Research Associate – ITS
• Dr. Gordon Smith – Director. Library Initiatives - ITS
3
What We Will Discuss
• How CSU got into the measurement business• What we know about the “net gen”• What CSU data tells us about our students
and technology and faculty vs. Student perceptions
• Illusions about the “net gen”• How to use all of this to help students

4
How Did CSU Get in This?
• We needed $$ for infrastructure (lots of it – ¼ billion $ for 23 campuses over 5 yrs.)
• Money comes with strings• The string was accountability• Data collection, surveys are part of the
annual reporting process
5
Who’s Who
• Baby Boomers – 1946 to 1961
• Generation X – 1961 to 1981
• Generation Y – 1981 – 1995 (at least) – aka Net Generation
6
Net Generation Facts
• Students are:– Digital – Connected– Experiential– Immediate– Social
• (Thanks to Diana Oblinger)
7
Media Exposure
• 10,000 hours video games• 200,000 emails• 20,000 hours TV• 10,000 hours
cell phone• Under 5,000 hours reading
• Copyright Diana Oblinger – permission granted for educational use only

8
Net Gen
• Digital Natives – can’t imagine life without it -
• Always connected; hundreds of names on their buddy lists
• Multi – taskers – at least electronically• Want activity rather than lecture• Like team work
9
How They’re Different
• Accept their parents views
• Rely on parental guidance
• Not as independent
• Happiest in groups
10
What They Accept (and Expect)
• Pervasiveness of technology• Immediate feedback• Convenience – academic and
administrative• Faculty are the experts• Faculty SHOULD use technology
effectively and efficiently
11
Observations – Oblinger & ECAR
• NET GEN: CONNECTED; CONVENIENCE; INTERACTIVE; SOCIAL
• FACULTY: DEFERENCE AND DISCONNECT
12
STEVE DAIGLE
13
ECAR Findings - 1
• OVERALL, BELL-SHAPED CURVE: STUDENTS PREFER MODERATE AMOUNT OF IT
• OLDER STUDENTS PREFER MORE IT IN COURSES• IT FOR COMMUNICATION OR LEARNING? LITTLE OF BOTH? • CORE VERSUS SPECIALIZED TECHNOLOGIES • IT AS SUPPLEMENTAL, NOT TRANSFORMATIVE: BOLT ON?• LMS: CONTROL, PREDICTABILITY, TRANSPARENCY,
FACULTY-CENTRIC
• CURRICULUM REQUIREMENTS KEY TO DEVELOPING SKILLS
14
ECAR Findings - 2
• Students who perceive their instructors to be effective users of IT in the course report: – More engagement in the course– More interest in the subject matter– Better understanding of complex concepts
15
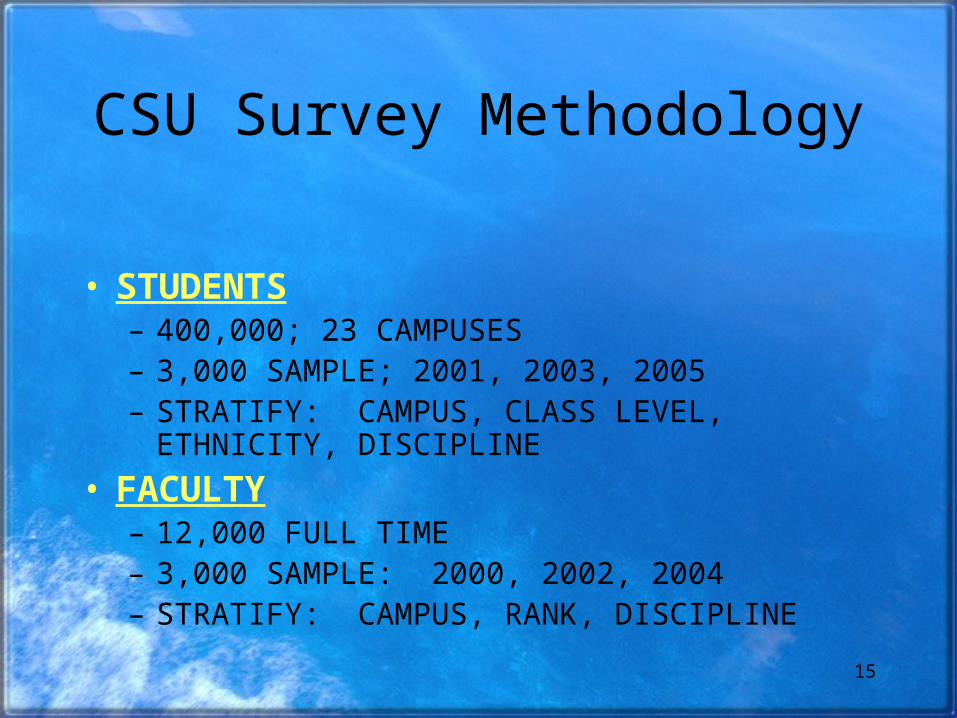
CSU Survey Methodology
• STUDENTS– 400,000; 23 CAMPUSES– 3,000 SAMPLE; 2001, 2003, 2005– STRATIFY: CAMPUS, CLASS LEVEL,
ETHNICITY, DISCIPLINE
• FACULTY– 12,000 FULL TIME– 3,000 SAMPLE: 2000, 2002, 2004– STRATIFY: CAMPUS, RANK, DISCIPLINE
16
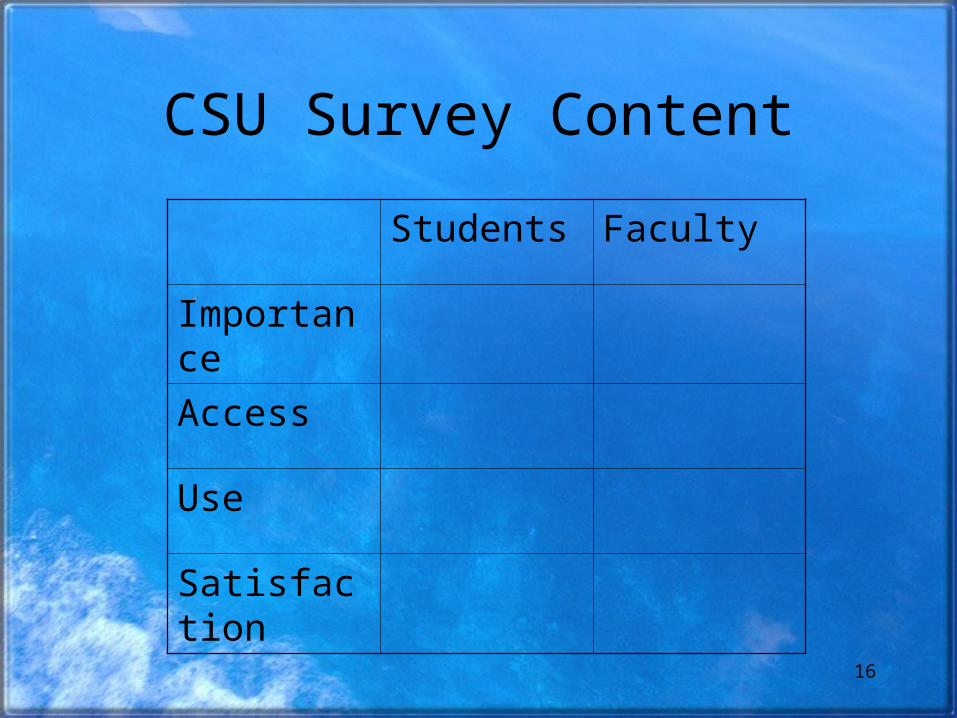
CSU Survey Content
Students Faculty
Importance
Access
Use
Satisfaction
17
Access - Connected
• In 2005, 87 percent of students access the campus network from off-campus, a dramatic increase from 2001 when only one-half did so. Four out of five of these students used a high speed internet connection (DSL or cable). Eighty-five percent report using the campus wireless network and their satisfaction with it received a 7.5 rating.
18
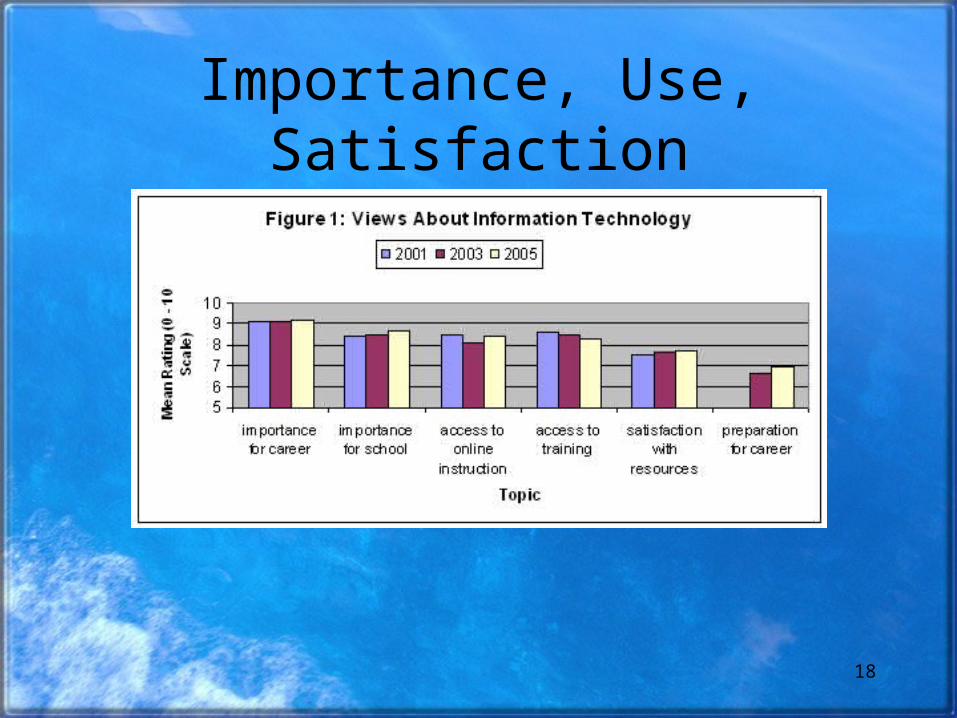
Importance, Use, Satisfaction
19
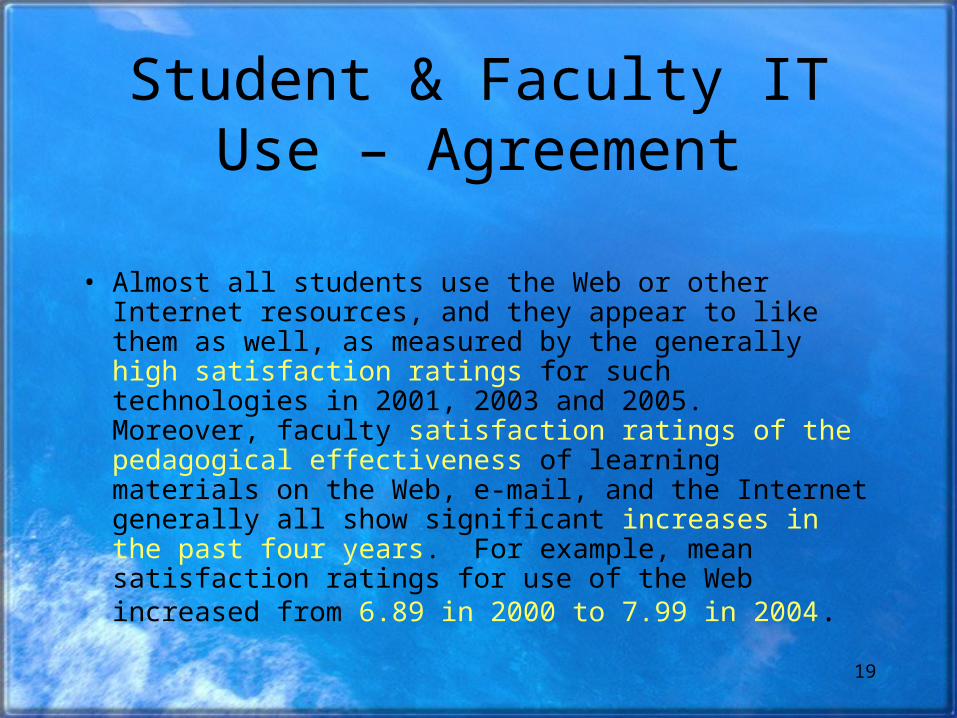
Student & Faculty IT Use – Agreement
• Almost all students use the Web or other Internet resources, and they appear to like them as well, as measured by the generally high satisfaction ratings for such technologies in 2001, 2003 and 2005. Moreover, faculty satisfaction ratings of the pedagogical effectiveness of learning materials on the Web, e-mail, and the Internet generally all show significant increases in the past four years. For example, mean satisfaction ratings for use of the Web increased from 6.89 in 2000 to 7.99 in 2004.
20
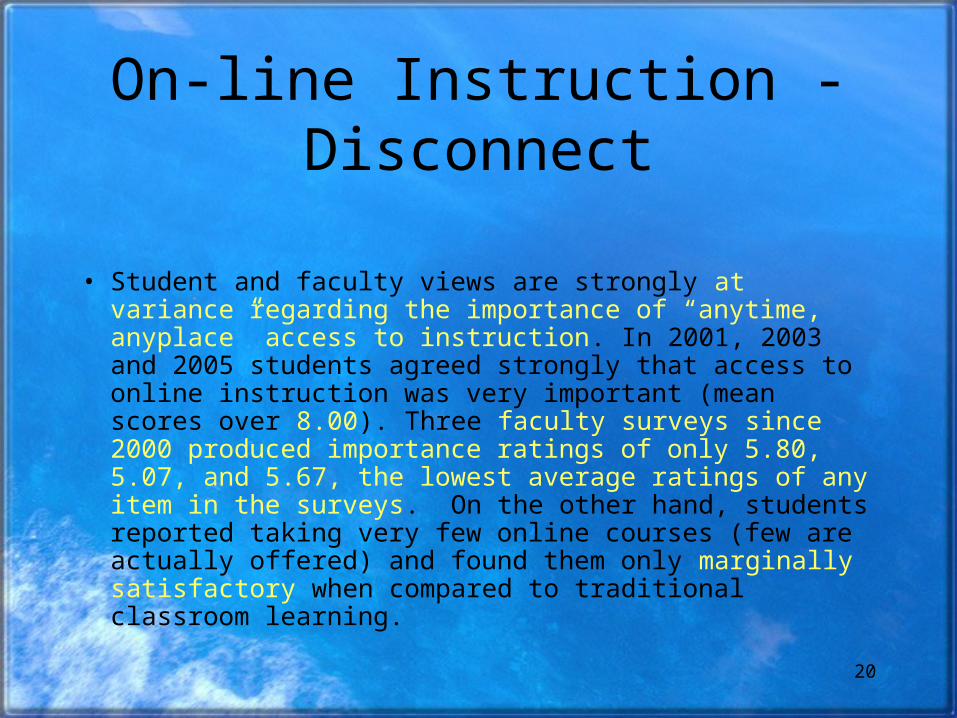
On-line Instruction - Disconnect
• Student and faculty views are strongly at variance regarding the importance of “anytime, anyplace” access to instruction. In 2001, 2003 and 2005 students agreed strongly that access to online instruction was very important (mean scores over 8.00). Three faculty surveys since 2000 produced importance ratings of only 5.80, 5.07, and 5.67, the lowest average ratings of any item in the surveys. On the other hand, students reported taking very few online courses (few are actually offered) and found them only marginally satisfactory when compared to traditional classroom learning.

21
GORDON SMITH

22
What is ICT Literacy?
• Ability to use digital technology, communication tools, and/or networks to access, manage, integrate, evaluate, create, and communicate information ethically and legally in order to function in a knowledge society
23
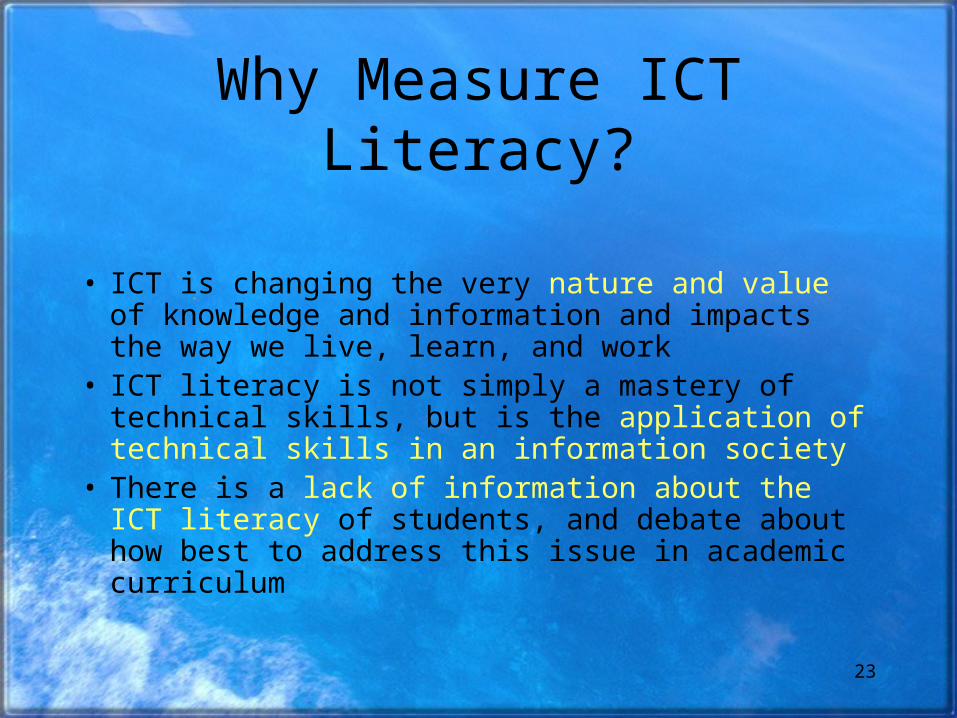
Why Measure ICT Literacy?
• ICT is changing the very nature and value of knowledge and information and impacts the way we live, learn, and work
• ICT literacy is not simply a mastery of technical skills, but is the application of technical skills in an information society
• There is a lack of information about the ICT literacy of students, and debate about how best to address this issue in academic curriculum
24
Current Higher Education Partners
• The California State University • Oklahoma State University • Portland State University• Purdue University• University of California, Los Angeles• University of Louisville• University of Memphis• University of Washington
25
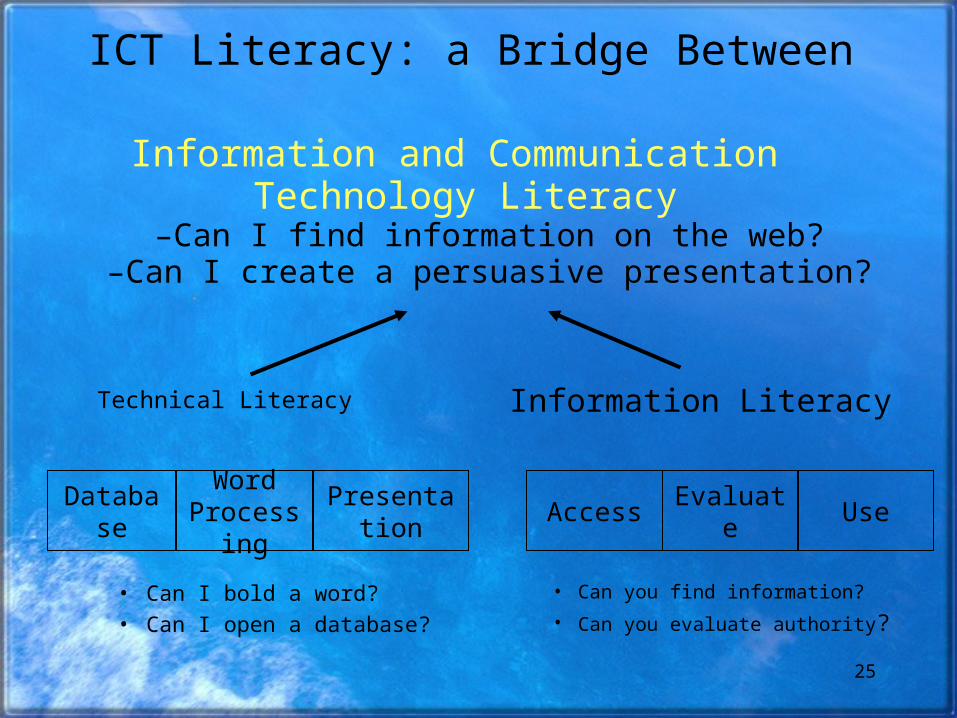
ICT Literacy: a Bridge Between
Technical Literacy
DatabaseWord
ProcessingPresentation
• Can I bold a word?• Can I open a database?
Access Evaluate Use
• Can you find information?
• Can you evaluate authority?
Information and Communication Technology Literacy
–Can I find information on the web?–Can I create a persuasive presentation?
Information Literacy
26
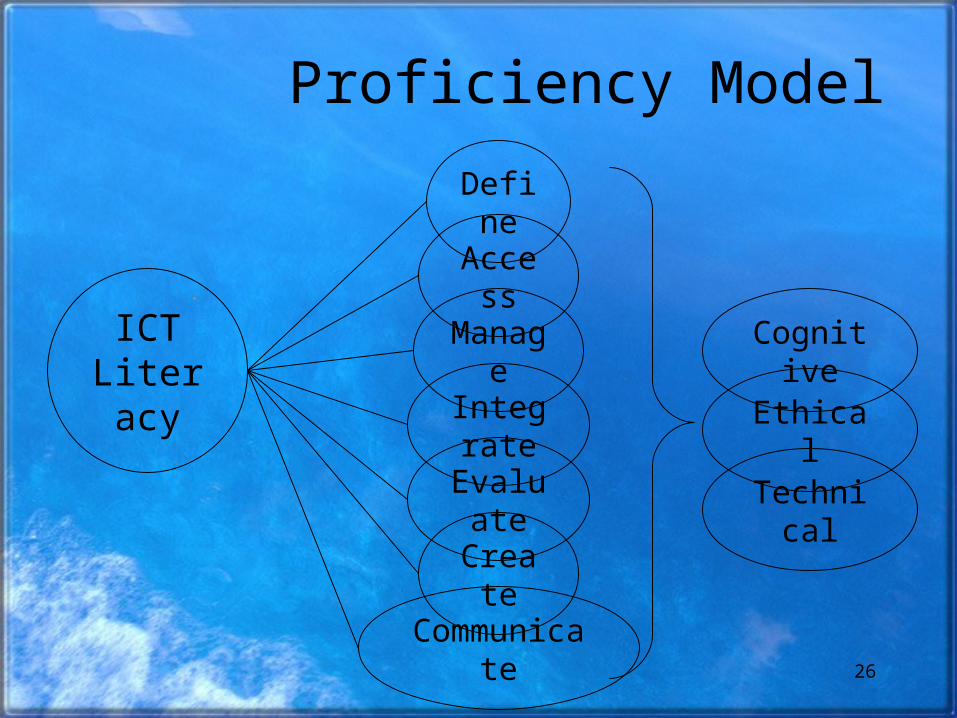
Proficiency Model
ICT Literac
y
Define
Access
Manage
Integrate
Evaluate
Create
Communicate
Cognitive
Ethical
Technical
27
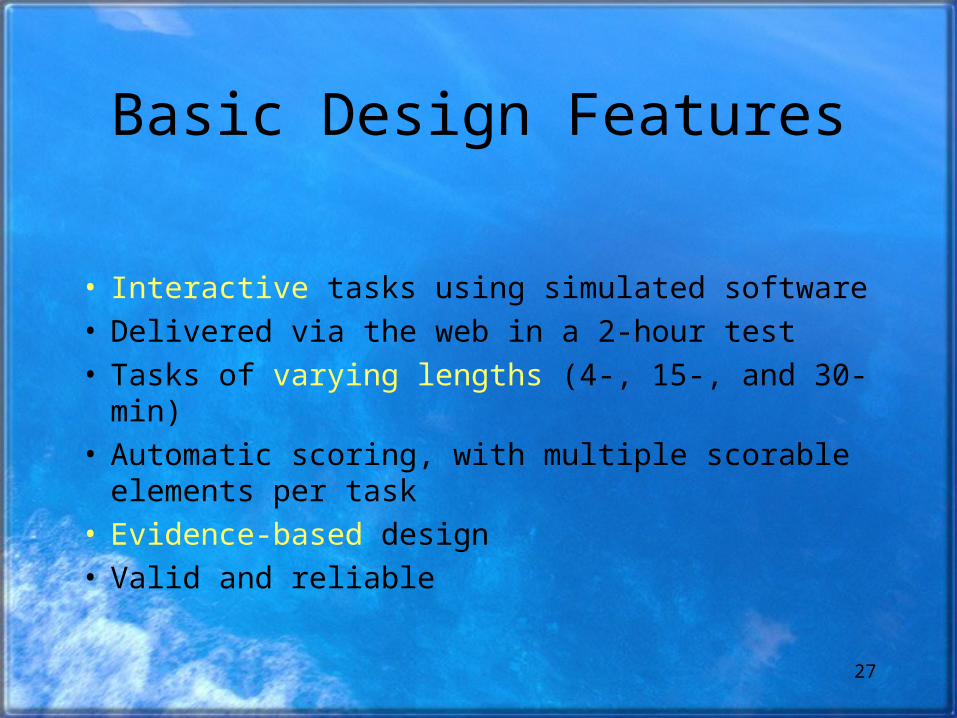
Basic Design Features
• Interactive tasks using simulated software• Delivered via the web in a 2-hour test• Tasks of varying lengths (4-, 15-, and 30-min)• Automatic scoring, with multiple scorable
elements per task• Evidence-based design• Valid and reliable

28Copyright © 2005 by Educational Testing Service. All rights reserved. ETS and the ETS logo are registered trademarks of Educational Testing Service.
Web Search
29Copyright © 2005 by Educational Testing Service. All rights reserved. ETS and the ETS logo are registered trademarks of Educational Testing Service.
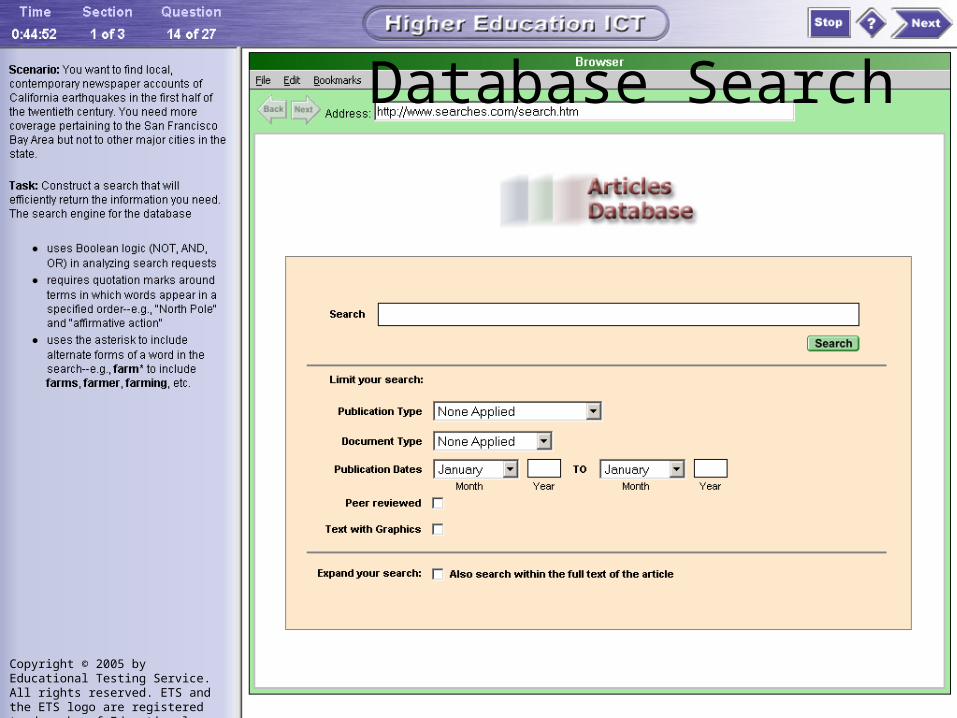
Database Search
30
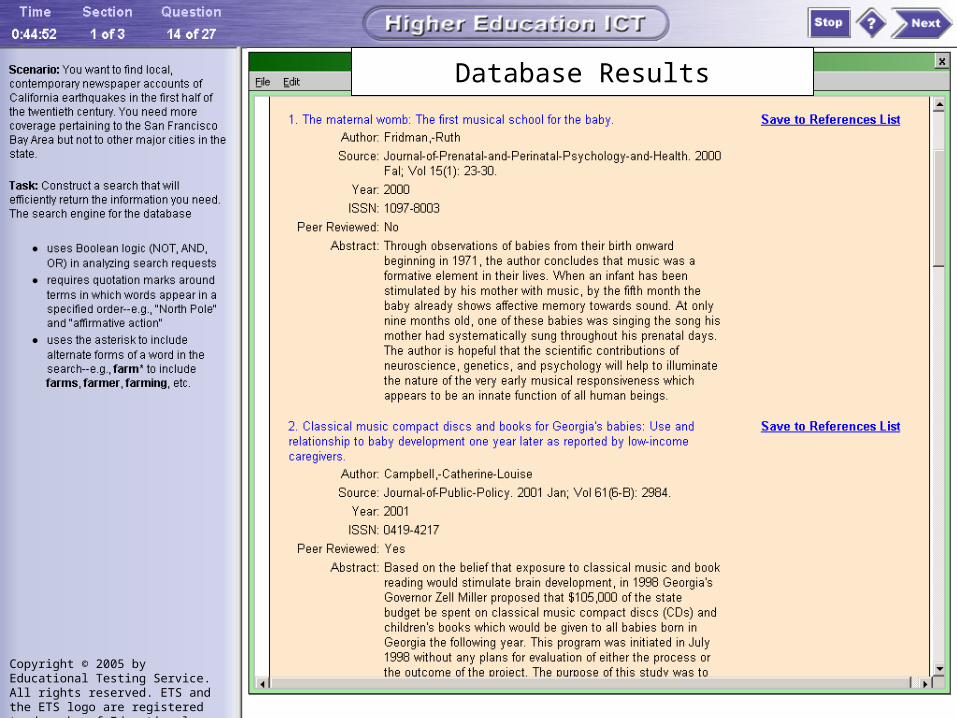
Database Results
Copyright © 2005 by Educational Testing Service. All rights reserved. ETS and the ETS logo are registered trademarks of Educational Testing Service.
Copyright © 2005 by Educational Testing Service.
31
Copyright © 2005 by Educational Testing Service.
32
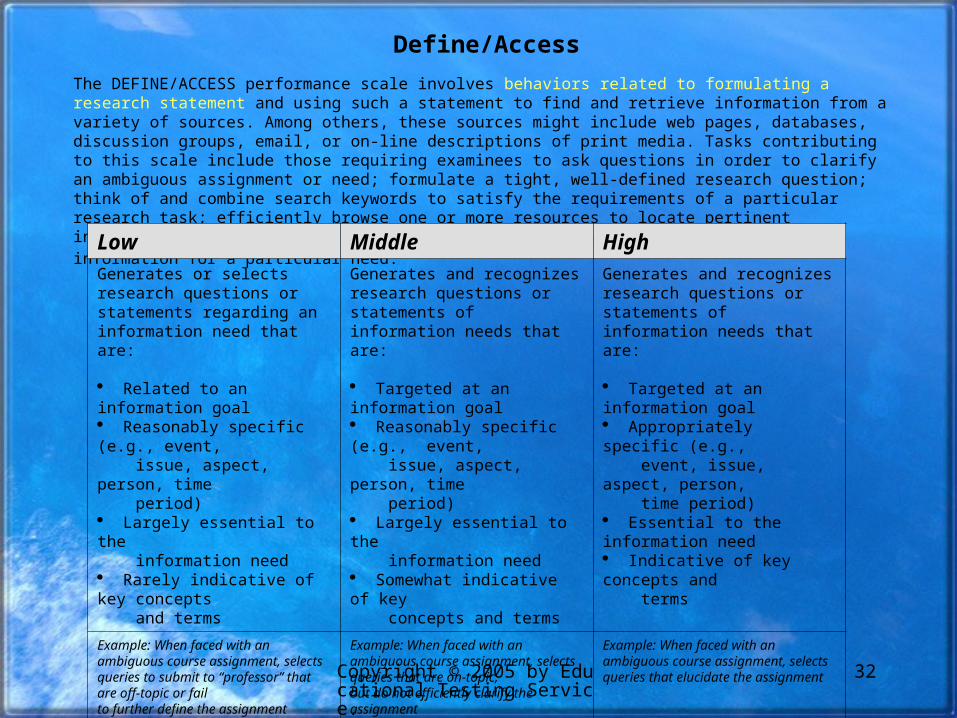
Define/Access
The DEFINE/ACCESS performance scale involves behaviors related to formulating a research statement and using such a statement to find and retrieve information from a variety of sources. Among others, these sources might include web pages, databases, discussion groups, email, or on-line descriptions of print media. Tasks contributing to this scale include those requiring examinees to ask questions in order to clarify an ambiguous assignment or need; formulate a tight, well-defined research question; think of and combine search keywords to satisfy the requirements of a particular research task; efficiently browse one or more resources to locate pertinent information; and decide what types of resources might yield the most useful information for a particular need.
Low Middle High
Generates or selects research questions or statements regarding an information need that are:
Related to an information goal Reasonably specific (e.g., event, issue, aspect, person, time period) Largely essential to the information need Rarely indicative of key concepts and terms
Generates and recognizes research questions or statements of information needs that are:
Targeted at an information goal Reasonably specific (e.g., event, issue, aspect, person, time period) Largely essential to the information need Somewhat indicative of key concepts and terms
Generates and recognizes research questions or statements of information needs that are:
Targeted at an information goal Appropriately specific (e.g., event, issue, aspect, person, time period) Essential to the information need Indicative of key concepts and terms
Example: When faced with an ambiguous course assignment, selects queries to submit to “professor” that are off-topic or fail to further define the assignment
Example: When faced with an ambiguous course assignment, selects queries that are on-topic, but do not efficiently clarify the assignment
Example: When faced with an ambiguous course assignment, selects queries that elucidate the assignment
33
Conclusions About ICT
• IT skills do not translate to ICT literacy
• Need to raise faculty awareness
• Instructional interventions need to be designed, implemented and evaluated
34
Summary

35
How Do We Help Our Students
• Faculty are the Key• Don’t be fooled by “media savvy”• Don’t assume they love technology• Do challenge them with creative,
experiential learning• Try teamwork; encourage
independence

36
How To Help Our Students
• Higher Education can not help students to learn with information technology unless faculty know how to use IT as more than a BOLT-ON.
• Unbundling
37
Discussion
• Your observations
• Your challenges
• Other insights
38
Find Us
• http://its.calstate.edu
• Measures of Success:
http://its.calstate.edu/documents/Data_Collection/I_Reports_MOS/Measure_of_Success.shtml
ICT – http://www.calstate.edu/LS/