1. the global financial environment - rba.gov.au · spending. macroprudential ... not relate to...
TRANSCRIPT

F I N A N C I A L S TA B I L I T Y R E V I E W | A P R I L 2018 3
The global economy has experienced widespread solid growth, which has reduced some financial stability risks but may with time promote others. Persistent very low interest rates and stable growth in recent years have led to high asset prices and low compensation for risk in a range of markets. This raises the possibility of a sharp correction in asset prices in response to an adverse shock. Investors have also taken on more risk in recent years, making them more susceptible to large losses if there were a generalised fall in asset prices. The falls in global equity prices in recent months have provided a timely reminder that asset prices can fall quickly, with price movements exacerbated by pro-cyclical investor behaviour.
Global debt levels are high and continue to rise. Low interest rates have encouraged households and corporations in a range of countries to increase debt, often from already elevated levels in the case of households. Government debt also remains high in many countries. The higher debt levels raise concerns about the resilience of a range of borrowers to any adverse shocks, particularly as global monetary policy accommodation starts to be unwound.
The Chinese financial system remains a focus. Addressing risks in the financial system has been a priority for the Chinese authorities with regulatory reforms backed by strong political support. Debt levels are high, especially in the corporate sector, and a sizeable share of debt has been provided through less regulated ‘shadow banking’ channels. This has exposed the financial system to considerable credit, liquidity and contagion risks.
1. The Global FinancialEnvironment
Major Advanced EconomiesAsset valuations in a range of advanced economy financial markets remain elevated. Over the past decade, long-term government bond yields, which underpin the valuation of most assets, have fallen contributing to higher prices for riskier assets (Graph 1.1). Despite some recent increases in bond yields, they remain low. Compensation for risk is also low; spreads on investment-grade and high-yield corporate bonds are at or near record lows despite an easing in non-price lending standards for wholesale corporate debt. There has been some pull-back in equity markets in recent months, initially in response to inflation concerns and more recently due to the direction of trade policy in the United States and developments in the technology sector. Equity valuations nonetheless remain high in the United States, but are less so in other countries.
Bond Yields and SpreadsMonthly averages
10-year governmentbond yields
20112004 2018-1.5
0.0
1.5
3.0
4.5
6.0
%
US
UK
Germany
Japan
Non-investment gradecorporate bond spreads*
20112004 20180
500
1 000
1 500
2 000
2 500
bps
US dollar
Euro
* Spreads to government bonds with equivalent maturitySource: Bloomberg
Graph 1.1

R E S E R V E B A N K O F AU S T R A L I A4
There are risks to a broad range of asset prices from a sharp rise in interest rates that is not accompanied by stronger growth. The impact could be compounded by simultaneous price falls across a range of asset classes (see ‘Box A: Low Interest Rates and Asset Price Risk’). Such a repricing could, for instance, be triggered by a reappraisal of the expected path of inflation or a shock that undermined global growth and investors’ risk appetite.
On a positive note, long-term government bond yields have already risen noticeably from the record lows seen in mid 2016 without significant disruption to financial markets. The sharp equity market falls in early February, in response to inflation concerns, were partly retraced before other factors led to another round of falls in March. After a long period of low volatility these movements have served as a reminder that price falls and higher volatility are possible. It is notable however that higher volatility has been largely confined to equity markets with bond markets remaining relatively calm (Graph 1.2). Nonetheless, the February episode showed that prices can fall sharply in response to changes in market expectations for inflation and interest rates. It remains to be seen whether these events presage a period of greater uncertainty and so ongoing higher volatility.
A range of investment vehicles and strategies could exacerbate a fall in asset prices. For example, investments that pay off if volatility stays low, that target a fixed level of volatility (including ‘risk-parity’ funds), or that rely on algorithms to trade automatically have become increasingly popular. There is some evidence that such strategies can lead to increased selling as prices fall, as seen during the February equity market sell-off.1 Price falls
1 For example, see Sushko V and G Turner (2018), ‘The equity market turbulence of 5 February - the role of exchange-traded volatility products’, BIS Quarterly Review, March, pp 4–6.
could also be exacerbated if negative returns trigger investor redemptions from open-ended bond investment funds, leading to forced selling. Bond funds have become increasingly large holders of corporate bonds and often are exposed to a mismatch between the relatively low secondary market liquidity of such bonds and the easy redemption terms these funds offer to investors. As a result of the post-crisis reforms process, these funds increasingly have tools that limit fire-sale risks, including options to suspend redemptions. However, the availability of these tools differs across jurisdictions, and they have not been broadly tested in stressed conditions.
Moderate falls in asset prices or upticks in volatility seem unlikely to threaten the solvency of systemic financial institutions given regulatory and management measures taken since the financial crisis. But some other institutions and investors may be more vulnerable to asset price falls and higher interest rates, having taken on greater credit, liquidity and interest rate risk in the low-yield environment. With imperfect visibility of exposures, leverage and interconnections within the global financial system, there is always the risk that some large concentrated losses could have systemic consequences or that
US VolatilityEquity*
20061994 20180
20
40
60
index Treasury bond**
20061994 20180
75
150
225
index
* Implied volatility from options on the S&P500 index (VIX index)** Implied volatility from options on US Treasury securities (MOVE index)Source: Bloomberg
Graph 1.2

F I N A N C I A L S TA B I L I T Y R E V I E W | A P R I L 2018 5
could see this slowdown develop into a more harmful correction.
Commercial property prices have also risen relatively quickly in major centres in the United States, Canada, New Zealand and Europe in recent years. As with other asset prices, declining long-term sovereign yields have been a factor. Accordingly, some leveraged investors and their creditors may be vulnerable to price falls given the highly cyclical nature of commercial property markets, particularly if long-term interest rates continue to rise from their current levels without increases in income. The recent interest rate increases may have already put some downward pressure on listed commercial real estate investment trust prices (Graph 1.4). In the United States, bank lending for commercial property has been growing relatively strongly, at an average annual rate of around 9 per cent over recent years. Regulators there have expressed concerns about lending standards and the high share of commercial property lending at particular institutions.
Conditions in advanced economy banking systems have generally continued to improve. Bank share prices have risen significantly over
uncertainty could cause market participants to cut counterparty credit lines.
Low interest rates in the post-crisis period have encouraged corporations in some countries to increase debt levels, which leaves them more vulnerable to negative shocks. In the United States, leverage in the listed non-financial sector is around historical highs. In part, this reflects strong growth of riskier ‘leveraged loans’ in recent years. At the same time, contractual protections for these creditors have weakened substantially.
As in Australia, low interest rates have also contributed to strong growth in household debt and housing prices in some small open advanced economies that did not have housing downturns in the financial crisis. In New Zealand (discussed below), Canada, Norway and Sweden, housing credit and price growth has exceeded that in incomes and rents over recent years, with some evidence of an increase in riskier lending.2 There is potential for a shock to the economy to be amplified by households and the housing market, as was the case in some economies in the financial crisis. Large housing price falls could see banks incur losses on recent and high-risk loans. Higher interest rates, falls in incomes and lower housing prices could also see highly indebted households substantially curtail their spending. Macroprudential policies have been implemented in these and other countries, stemming the growing risk in the balance sheets of banks and households, and these policies appear to have contributed to a slowing of credit and housing price growth (Graph 1.3). While these developments are welcome, there is always the risk of a mis-calibration of untried macroprudential tools, or of other shocks that
2 See RBA (2017), ‘Box A: Risks in International Housing Markets’, Financial Stability Review, October, pp 13–16.
M M M MJ J JS S SD D D2016 20172015 2018
0
5
10
15
%
0
5
10
15
%
Housing Price GrowthSelected advanced economies, year-ended
Australia
Sweden
Canada
Norway
NZ
Sources: BIS; Corelogic; RBA; REINZ
Graph 1.3

R E S E R V E B A N K O F AU S T R A L I A6
their regulatory minimums. The finalisation of Basel III regulatory capital requirements in December 2017 is estimated to have little effect on aggregate global minimum capital requirements, but the impact will vary by country and bank (see ‘Box E: Reforms to the Basel III Capital Framework’). Regulators in the United States continue to review post-crisis reforms. Proposals to date have mainly focused on easing the regulatory burden for small and medium-sized banks and easing requirements in areas where US regulations exceed international standards.
In the United States, in recent months spreads on short-term bank debt have spiked to their highest level since 2009 (Graph 1.6). Since the onset of the financial crisis, higher money market spreads have typically been an indicator of market stress or a perception that the near-term credit risk of banks had risen. However, the recent spike does not relate to major market stress or concerns about bank credit risk. Indeed, spreads on long-term bank funding and credit-default swaps (CDS) remain very narrow. Rather, increased spreads appear to be due to changes in the demand for and supply of money-market securities. In particular, issuance of US Treasury bills has increased significantly following the suspension
the past two years, but recent movements have been mixed (Graph 1.5). Profit expectations are being supported by stronger economic conditions – which should lead to increased credit demand – as well as higher interest rates and further improvements in asset performance. Lower corporate tax rates in the United States are also expected to boost the profits of banks operating there over the medium term, despite some negative short-term effects (reflecting a reduction in tax benefits from past losses). Banks’ regulatory capital ratios in the advanced economies also remain well above
2017201620152014 201880
100
120
140
index
80
100
120
140
index
Real Estate Investment Trust Prices*1 January 2014 = 100
US
Europe
UK
* Predominantly commercial REITsSources: Bloomberg; RBA
Banks’ Share-price-to-book-value RatiosQuarterly*
Advanced economy banks
20142010 20180
1
2
ratio
Australia
JapanEuro area
USUK
Canada
Euro area banks
2014 20180
1
2
ratio
France
Italy
Spain
Portugal Germany
* End of quarter; March and June 2018 observations use latestavailable data
Sources: Bloomberg; RBA
Graph 1.4
Graph 1.5Bank Funding Conditions
Interbank market spreads*
20142010 2018-50
0
50
100
150
bps
US
Five-year seniorCDS spreads
20142010 20180
100
200
300
400
bps
UK
* Three-month LIBOR-OIS spreadSources: Bloomberg; Thomson Reuters
Graph 1.6

F I N A N C I A L S TA B I L I T Y R E V I E W | A P R I L 2018 7
of the debt ceiling in February and because of seasonal factors associated with tax payments. Demand for Treasury bills has also seemingly declined as a few very large US corporations have reallocated their assets following US tax changes that encourage them to repatriate offshore dollars to the United States. Other tax changes have simultaneously encouraged foreign banks operating in the United States to borrow directly, rather than seek offshore funding from their parents. This rise in borrowing costs has spilled over to some other markets, including in the United Kingdom and Australia (for further details on developments in Australia, see ‘The Australian Financial System’ chapter).
In Europe, banks have continued to bolster their resilience, aided by the ongoing economic upswing. Profitability has generally been improving, which has enabled banks to increase their loss-absorbing capital buffers. Banks have continued to cut costs and adjust their business models. Non-performing loan (NPL) ratios have fallen further, partly due to some large banks selling NPL portfolios (Graph 1.7). European authorities have proposed that banks should provision for new NPLs more rapidly and to a greater extent, and reportedly may extend
Large Banks’ NPLsShare of loans
20132009 20170
2
4
6
8
%
AustraliaJapan
Germany
France
USUK
20132009 20170
10
20
30
40
%Greece
Portugal
Italy Spain
Ireland
Sources: APRA; Banks’ annual and interim reports; Bloomberg; FSA;RBA; S&P Global Market Intelligence
Graph 1.7
these plans to existing bad loans as part of a broader push to accelerate the cleanup of banks’ balance sheets.
Despite these improvements, banking systems in some European jurisdictions remain vulnerable to negative shocks. Stocks of NPLs are still high in several European banking sectors and, in some cases, are expected to remain high in coming years. NPL sales to date have been at prices significantly below those implied by provisioning levels. This means that banks’ effective capital buffers could be smaller than reported capital ratios suggest. Structural factors such as high cost bases, legacy loss-making exposures and excess capacity continue to constrain banks’ profitability, while restructuring costs also remain high for some banks. These factors will need to be resolved if banks are to raise long-term profitability and improve their ability to build up capital buffers.
Debt sustainability concerns remain for some highly indebted European sovereigns, although near-term risks have continued to recede over the past six months (Graph 1.8). Government bond spreads to German Bunds have narrowed
Sovereign Debt*Per cent to GDP
20091999 20190
50
100
150
%
Germany
FranceNetherlands
SwedenUK
20091999 20190
50
100
150
%
Greece
Italy
SpainPortugal
Ireland
* Debt-to-GDP ratios for 2018 and 2019 are European Commissionforecasts
Source: European Commission
Graph 1.8

R E S E R V E B A N K O F AU S T R A L I A8
stability in Europe. Negotiations to define the future relationship between the European Union (EU) and the United Kingdom are in progress, but there remains significant uncertainty about the nature of a final agreement or whether an agreement will even be reached. A disorderly Brexit process – such as the failure to reach a post-exit UK-EU trade deal, a significant delay in reaching an agreement or a late change in political course – could be disruptive for UK financial institutions that provide services to continental Europe, as well as EU firms that rely heavily on those services.
Increasing use of technology in the financial system, and the associated increase in linkages with and reliance on third parties, has heightened the risk to financial stability posed by cyber-attacks. Such attacks have the potential to affect the financial system through a variety of channels; for instance, through an interruption in the availability of core financial services or the corruption of trade or transaction records. Of particular concern is the possibility of an attack having knock-on effects to other parts of the financial system. Given the systemic risk posed by cyber-attacks, international regulatory bodies are increasing their focus on monitoring cybersecurity in the financial system, although information on the scale and nature of attacks remains incomplete (see the ‘Regulatory Developments’ chapter for further information).
New ZealandFinancial stress in New Zealand would affect the Australian banks due to the strong economic and financial links between the two countries. New Zealand’s four largest banks are each owned by one of the Australian major banks. In its latest Financial Stability Report the Reserve Bank of New Zealand (RBNZ) assessed that near-term financial stability risks had receded, but high debt levels in the household and dairy sectors
Euro Area 10-year Government Bond SpreadsTo German Bunds
20142010 20180
200
400
600
bps
France
Spain
Italy
20142010 20180
1 000
2 000
3 000
bps
Portugal
Greece
Sources: Bloomberg; RBA
Graph 1.9
further, reflecting stronger economic conditions and improving fiscal positions (Graph 1.9). However a sharp increase in yields – for instance due to a change in global risk sentiment or political developments – could increase concerns around the sustainability of some European countries’ debt. While actions by the European Central Bank could limit any rise in government bond yields, sizeable increases are still possible, which could pose risks to financial and macroeconomic stability given banks’ large holdings of European government bonds relative to their capital bases.
In Greece, the economy has continued to strengthen and near-term funding pressures on the government have receded despite the high debt stock. Greece’s sovereign credit rating was upgraded by two rating agencies and Greece has again raised funds in international bond markets. Its European creditors also agreed to disburse the latest round of bailout funding in March, but an agreement on debt restructuring may be important to Greece’s ability to fund itself after the bailout program ends in August.
The United Kingdom’s exit from the European Union (Brexit) could pose risks to financial

F I N A N C I A L S TA B I L I T Y R E V I E W | A P R I L 2018 9
New Zealand Dairy SectorDairy prices
4
8
NZ$/kg
4
8
NZ$/kg
Dairy prices**
Farmgate milk price*
Dairy sector NPL ratio
201420102006 20180
2
4
%
0
2
4
%
* Dashed line indicates latest Fonterra price forecast per kg of ‘milk solids’** Weighted average of whole milk powder, skim milk powder andbutter prices
Sources: Bloomberg; Fonterra; RBA; RBNZ; USDA
Graph 1.11
201620142012 2018-10
0
10
20
30
%
-10
0
10
20
30
%
New Zealand Housing Credit and PricesSix-month-ended annualised growth
Tax changes
Housing credit*
Aucklandprices*
Rest of NewZealand prices*
LVR policytightening**
LVRpolicy
easing
High-LVR speedlimit introduced
* To latest three months** Refers to tighter restrictions introduced in November 2015, mainlytargeting Auckland investors, which were subsequently tightenedfurther and extended to investors in the rest of New Zealand in October2016
Sources: RBNZ; REINZ
Graph 1.10
leave borrowers and banks vulnerable to adverse shocks.
In the housing market, the tightening of loan-to-valuation ratio (LVR) requirements in October 2016, a general tightening in lending standards, and higher mortgage interest rates (a flow-on from higher deposit rates) have slowed credit and housing price growth (Graph 1.10). These changes have also improved the quality of new lending, particularly to investors. This modest reduction in housing market vulnerabilities led the RBNZ to marginally ease the LVR restrictions from the beginning of 2018. Specifically, it raised the LVR threshold, above which a 5 per cent cap on the share of new investor loans applies, from 60 per cent to 65 per cent. It also increased the share of new owner-occupier loans that can have an LVR above 80 per cent, from 10 per cent to 15 per cent. The RBNZ is considering the case for developing a lending constraint based on debt serviceability as a macroprudential measure that could be used if financial stability risks intensify.
Risks from the dairy sector, which accounts for around 10 per cent of total bank lending in New Zealand, have eased given that dairy prices have been at somewhat higher levels over the past year or so (Graph 1.11). Growth in lending to the dairy sector has slowed and the proportion of banks’ dairy loans that is non-performing has declined slightly. However, the sector remains highly indebted, which leaves it vulnerable to falls in sometimes volatile dairy prices.
ChinaChinese policymakers continue to implement reforms to address financial stability risks, backed by strong political support. These actions have had some success in containing the build-up of risks and have the potential to curb risks over the longer term, but much will depend on how they are implemented and enforced. For now, the accumulated financial stability risks in China remain high.
Concerns about risks to the financial system in China reflect several inter-related factors. First, there has been a large build-up of debt over the past decade (Graph 1.12). The high leverage of the corporate sector, both private

R E S E R V E B A N K O F AU S T R A L I A1 0
banks’ proactive use of loan write-offs and NPL sales. To some extent NPL ratios may understate banks’ exposure to non-performing assets. For example, in some circumstances banks in China reportedly still have exposure to NPLs they have sold, for instance because the loans sit in an off-balance sheet vehicle financed by the bank. Also, some banks are reported to have used various other means to avoid recognising problem loans, including loan forbearance.
Over recent years authorities in China have worked to facilitate the restructuring of corporate debt and help banks to repair their balance sheets. This includes launching a debt-to-equity swap program, establishing firm-level creditor committees to manage debt workouts, and creating regional asset management companies to purchase NPLs.
Implicit guarantees of loans and other financial products in China are also likely to have resulted in weaker lending standards. Low credit spreads on debt securities issued by SOEs and local governments suggest that investors assume they are effectively guaranteed by the central government. Similarly, many investors in the wide range of asset management products (AMPs) sold by banks and non-bank financial institutions (NBFIs) reportedly believe they are implicitly guaranteed by the issuer – a belief in part based on recent experience where issuers have paid out distressed AMPs. Such guarantees can reduce the incentive for lenders to adhere to prudent lending standards. This increases the likelihood of poor quality loans, and thus the risk of repayment problems.
Third, a significant part of the run-up in corporate debt has been provided through less regulated and less transparent shadow banking channels (even though this debt is largely funded or otherwise facilitated by the banking sector). Shadow lending has improved firms’ access to
and public, makes firms less resilient to negative shocks. While the growth of debt has slowed over recent years, China’s non-financial corporate debt relative to GDP exceeds that of most advanced economies, and is several times higher than in economies with comparable per capita income levels.
Second, a range of factors have reduced lending standards and asset quality in China, raising credit risks further. The speed of the increase in debt suggests that some lending may have been of poor quality as has often been the case in rapid credit expansions in other countries. Despite noticeable improvements in aggregate profitability over the past year or so, excess capacity in parts of the industrial sector has resulted in some unprofitable companies that are highly leveraged and rely on loan forbearance to survive. Many of these are state-owned enterprises (SOEs). China’s local governments have also borrowed heavily in the post-crisis period to fund infrastructure projects, despite limited net revenue streams. While banks’ reported NPL ratios remain low, the flow of new NPLs is quite large, which is being offset by
201320092005 20170
50
100
150
200
250
%
0
50
100
150
200
250
%
China – Non-financial Sector DebtPer cent of nominal GDP
Total debt*
Bank credit
Shadow financing**
* Total debt is the sum of bank credit, shadow financing and bondfinancing (both corporate and public)** RBA estimate
Sources: CEIC Data; RBA; Wind Information
Graph 1.12

F I N A N C I A L S TA B I L I T Y R E V I E W | A P R I L 2018 1 1
Chinese authorities have avoided a sharp housing correction by using a range of policy tools to actively manage the housing cycle. However, household debt has been growing rapidly from a low level alongside strong growth in housing prices over recent years. Household indebtedness is low relative to advanced economies, but high relative to many emerging market economies. Housing loan-to-valuation ratios appear moderate, suggesting a buffer against any decline in housing prices. A downturn in the housing market could also adversely affect other sectors, such as highly leveraged property developers and local governments.
The Chinese authorities are well aware of these various risks and have continued to implement measures to address them. Senior officials have publicly expressed concerns about financial risks, including President Xi, indicating a strong political commitment to curtail risk. Several significant measures have been announced over the past year or so. Importantly, a cross-agency Financial Stability and Development Committee has been established under the State Council, to boost coordination between the main Chinese financial regulators and increase their authority. Further, the China Banking Regulatory Commission and the China Insurance Regulatory Commission are to be merged into a single regulatory agency, and some additional aspects of policy design will be transferred to the People’s Bank of China. Guidelines for unified regulation of AMPs – regardless of their type, issuer or main regulator – have also been announced, including rules on leverage, liquidity, disclosure and investment scope. Limits on interbank borrowing and lending, and restrictions on ‘entrusted loans’ (a key type of shadow lending), have also been introduced or announced. Scrutiny of the insurance sector has also increased. The regulator has recently taken control of Anbang Insurance, a very large
finance and enabled more lending to occur on market terms that account for risk. However, it also enables banks to circumvent regulation in various ways, adds to liquidity risk and increases and obscures interconnections in the financial system.3
Many smaller banks have increased their issuance of short-term wholesale debt over recent years, including interbank loans, to invest in NBFIs (Graph 1.13). The resulting opacity, interconnection and reliance on short-term funding can amplify and spread financial stress, because uncertainty about counterparties’ exposures can lead to a broad-based withdrawal of funding in a period of heightened uncertainty. However, given the ongoing heavy influence of the state in the financial system – notwithstanding significant reform over the past decade – contagion is unlikely to play out in the same way as in more market-based systems.
Vulnerabilities in the Chinese household sector continue to rise, although they appear less than those in the corporate sector. To date the
3 For a more complete discussion of these risks see Bowman J, M Hack and M Waring (2018), ‘Non-bank Financing in China’, RBA Bulletin, March. Available at <http://www.rba.gov.au/publications/bulletin/2018/mar/non-bank-financing-in-china.html>
Banks’ Claims on NBFIsValue
20132008 20180
10
20
30
CNYtr Share of banks’ assets
20132008 20180
5
10
15
%
Large banks
Smaller banks
Sources: CEIC Data; RBA
Graph 1.13

R E S E R V E B A N K O F AU S T R A L I A1 2
The Chinese banking system reports adequate levels of capital overall, although some small and medium-sized banks have relatively thin buffers over their minimum requirements (Graph 1.15). As noted above, reported capital may overstate the true position due to under-provisioning for NPLs. Aggregate profitability is quite strong, although it has declined in recent years, partly due to greater losses on lending. More recently, the slowing in shadow banking activity has started to weigh on smaller banks’ balance sheet growth and profitability, because they have been active in funding and facilitating this activity.
and acquisitive financial conglomerate that has grown rapidly, largely funded by strong issuance of non-traditional AMPs. Together these measures have resulted in a marked slowing in some types of shadow lending and AMP issuance (including banks’ ‘wealth management products’) (Graph 1.14).4
If sustained, calibrated appropriately and not circumvented, these regulatory measures should help to curb financial stability risks over the longer term. However, in the near term if applied too forcefully, measures to boost financial stability have the potential to cause a contraction in financial intermediation. This risk is mitigated somewhat by a favourable economic environment in which to pursue regulatory reform. But in future the authorities may face a difficult trade-off between restraining financial risks and supporting economic growth to achieve targets. Market and investor sentiment may also weaken significantly if currently assumed implicit guarantees were seen to no longer apply.
4 See Perry E and F Weltewitz (2015), ‘Wealth Management Products in China’, RBA Bulletin, June, pp 59–68.
20162015201420132012 20170
10
20
30
CNYtr
0
20
40
60
%
China – Wealth Management ProductsAssets under management
Year-ended growth(RHS)
Levels(LHS)
Sources: RBA; Wind Information
Graph 1.14
China’s Banking SystemReturn on equity
10
20
% CET1 capital ratio
5
10
%
Non-performing loansStock
20132009 20170
1
2
CNYtr Non-performing loansShare of loans
2013 20170
5
10
%
Incl. specialmention loans
Sources: CEIC Data; RBA; S&P Global Market Intelligence
Graph 1.15
The Chinese authorities retain a wide range of economic and financial policy tools to use in any financial disruption. The state retains a large role in both the corporate sector and the financial system which enables some policy actions that are more complex or not possible in other economic systems. The authorities have also proven to be willing and able to respond quickly to potential instability, as demonstrated by their intervention with Anbang Insurance. Nevertheless, given the risks, maintaining stability in a large, complex and opaque financial system will be challenging. And policies designed to minimise losses and maintain stability will often reinforce perceptions of implicit guarantees.

F I N A N C I A L S TA B I L I T Y R E V I E W | A P R I L 2018 1 3
risk sentiment and capital flight, particularly in an environment of rising interest rates in advanced economies, trade tensions and heightened geopolitical risk. This could reveal or exacerbate underlying weaknesses.
The increase in corporate sector indebtedness in EMEs remains an area of concern because higher leverage reduces firms’ resilience to adverse shocks. The speed of this rise since the financial crisis may also indicate there has been some lower quality lending. A shift in risk sentiment could expose some EMEs to currency depreciations which would inflate the value of any unhedged foreign currency borrowing and interest costs, while also reducing firms’ access to offshore funding. More generally, rising global interest rates, particularly in the US, will increase the cost of servicing unhedged foreign currency debt. These risks are somewhat mitigated by the large proportion of listed EME firms that have at least some foreign currency earnings, as well as the general decline in EME firms’ reliance on foreign currency borrowing.
Banking systems in most large EMEs have been fairly resilient in the face of earlier challenging economic conditions and deteriorating asset
If financial risks were to materialise in China, the negative effect on China’s economy could be substantial. Direct financial linkages between China and the rest of the world are generally still small, limiting the spill-overs through this channel. Rather, a financial disruption would likely be transmitted through China’s strong trade links, including to Australia, with possible second-round effects on a broad range of countries through weaker global growth. Weaker sentiment in global financial markets could also cause and transmit significant financial stress.
Other Emerging Market EconomiesRisks in other emerging market economies (EMEs) have eased further over the past six months. Economic growth is broadening and is expected to continue. Corporate debt-to-GDP ratios have stabilised or fallen in many economies following earlier strong growth (Graph 1.16). Capital inflows to EMEs have been relatively strong over the past two years as risk sentiment has remained positive, supporting asset prices and currencies (Graph 1.17). Nevertheless, some EMEs remain vulnerable to a change in global
Emerging Financial Markets
100
200
indexShare prices*
75
150
%Flows into equity funds***
20132008 20185
7
9
%Government bond yields**
20132008 2018-500
0
500
%
Flows into bond funds***
* 1 January 2005 = 100** Local-currency denominated*** Cumulative since end 2004; share of initial assets under managementSources: Bloomberg; EPFR Global; JP Morgan; Thomson Reuters
Graph 1.17
Total Credit to PrivateNon-financial Corporations
Per cent to GDP
Commodity-exportingeconomies
20122007 20170
20
40
60
%
Russia
Brazil
South Africa
Indonesia
Malaysia
Other economies
20122007 20170
20
40
60
%
Turkey
India
Mexico
Thailand
Sources: BIS; CEIC Data; RBA; Thomson Reuters
Graph 1.16
R E S E R V E B A N K O F AU S T R A L I A1 4
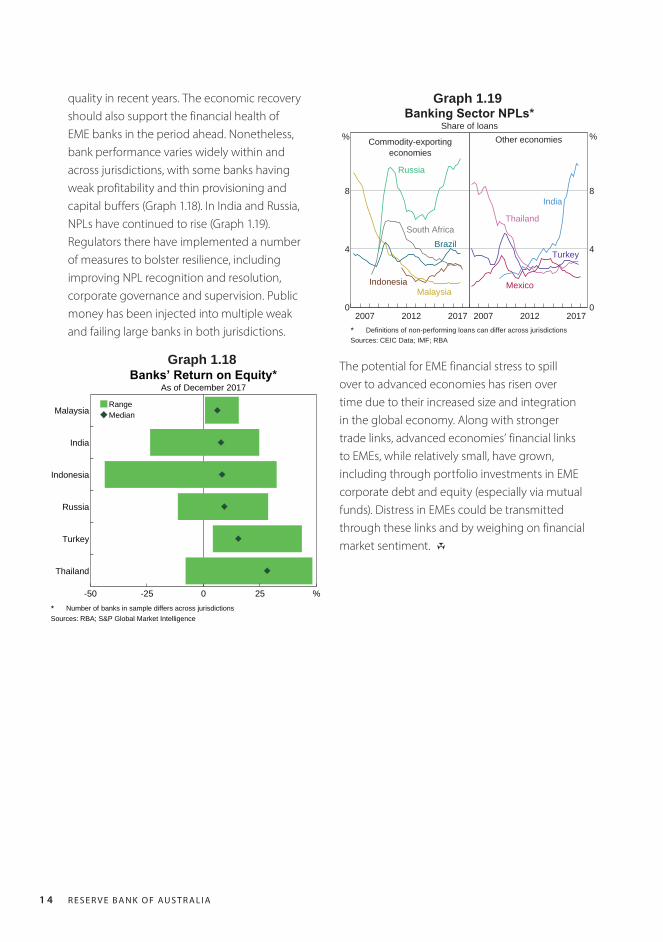
The potential for EME financial stress to spill over to advanced economies has risen over time due to their increased size and integration in the global economy. Along with stronger trade links, advanced economies’ financial links to EMEs, while relatively small, have grown, including through portfolio investments in EME corporate debt and equity (especially via mutual funds). Distress in EMEs could be transmitted through these links and by weighing on financial market sentiment. R
quality in recent years. The economic recovery should also support the financial health of EME banks in the period ahead. Nonetheless, bank performance varies widely within and across jurisdictions, with some banks having weak profitability and thin provisioning and capital buffers (Graph 1.18). In India and Russia, NPLs have continued to rise (Graph 1.19). Regulators there have implemented a number of measures to bolster resilience, including improving NPL recognition and resolution, corporate governance and supervision. Public money has been injected into multiple weak and failing large banks in both jurisdictions.
RangeMedian
-50 -25 0 25 %
Thailand
Turkey
Russia
Indonesia
India
Malaysia
Banks’ Return on Equity*As of December 2017
* Number of banks in sample differs across jurisdictionsSources: RBA; S&P Global Market Intelligence
Graph 1.18
Banking Sector NPLs*Share of loans
Commodity-exportingeconomies
20122007 20170
4
8
%
Russia
Brazil
Malaysia
South Africa
Indonesia
Other economies
20122007 20170
4
8
%
India
Turkey
Thailand
Mexico
* Definitions of non-performing loans can differ across jurisdictionsSources: CEIC Data; IMF; RBA
Graph 1.19