1 the games economists play: interactive public policy capital campus texas july 9, 2008 copies of...
TRANSCRIPT

1
The Games Economists Play: Interactive Public Policy
Capital Campus TexasJuly 9, 2008
copies of this presentation can be found atwww.antolin-davies.com

Please sit as follows:
1. One person at each consumer station.
2. Two people at each insurer station.
Ideally, we need one person who is comfortable with basic math at each insurer station.
2

The purpose of this simulation is to create a competitive market and to observe the market as it achieves equilibrium.
In this simulation, you will experience real market forces. The same human traits and behaviors that govern real markets exist in the simulation.
What are artificial are your surroundings. The market forces are real.
3

The Players and the Goals
In this experiment, there are CONSUMERS and INSURERS.
INSURERS sell INSURANCE.
CONSUMERS buy FOOD and INSURANCE.
4

Consumers
Each consumer has $20 to spend.
A unit of food costs $1.
5
$20
Food Eaten Happiness0 01 1002 1413 1734 2005 2246 2457 2658 2839 300
10 316
The more food the consumer eats, the happier the consumer becomes.

Consumers: The Catch
Each consumer faces some risk of badness.
6
vs.
If badness befalls the consumer, the consumer loses all of the purchased food.

Consumers: The Insurance
But, consumers can purchase insurance contracts from the insurance companies.
7
Each contract pays the consumer one unit of food if badness befalls that consumer.

Consumers: Example
Suppose a consumer can purchase insurance contracts at a price of $0.50 each (the price of food is always $1 each).
8
$20
Suppose that the consumer spends $5 on insurance contracts. The remaining $15 is automatically spent on food.
10 insurance contracts
15 food

Consumers: Example
If badness does not befall the consumer, the consumer eats 15 units of food and receives 387 happiness.
9
Food Eaten Happiness10 31611 33212 34613 36114 37415 38716 40017 41218 42419 43620 447

Food Eaten Happiness10 31611 33212 34613 36114 37415 38716 40017 41218 42419 43620 447
Consumers: Example
If badness does befall the consumer, the 15 units of food disappear, each insurance contract pays $1.00 (which buys 1 unit of food), and the consumer receives 316 happiness.
10

Consumers
Each consumer’s goal: Maximize expected happiness
More insurance means
More food when badness befalls.
Less food when badness does not befall.
Too little insurance is bad. Too much insurance is also bad.
11

Insurers
Each insurer can write as many insurance contracts as liked and charge any price.
12

Insurers
If badness does not befall the consumer, the insurer walks away with the money the consumer paid for the contracts.
13
$ $ $
$ $ $

Insurers
If badness does befall the consumer, the insurer pays the consumer $1.00 for each contract the insurer sold the consumer.
14

Insurers: Example
Suppose an insurer sells Consumer A six contracts for $0.60 each, and sells Consumer B five contracts for $0.30 each.
15
The insurer collects $3.60 from Consumer A and $1.50 from Consumer B.
$3.60
$1.50
$5.10
Revenue =

Insurers: Example
Suppose badness befalls Consumer B but not Consumer A.
16
The insurer owes Consumer B $1.00 for each contract Consumer B purchased.
$5.00
$5.10
Revenue =
$5.00
Cost =
$0.10
Profit =

Insurers: Example
Suppose badness befalls Consumer A but not Consumer B.
17
The insurer owes Consumer A $1.00 for each contract Consumer A purchased.
$6.00
$5.10
Revenue =
$6.00
Cost =
$0.90
Loss =
(Insurers do not need a cash reserve to cover policies.)

Insurers
Each insurer’s goal: Maximize expected profit
Insurers can ask whatever prices they like for contracts
Too low a price is bad. Too high a price is also bad.
18

19
Type 1
10%
Consumer Types
There are five types of consumer. Each faces a different probability of badness.
Type 2
20%
Type 3
30%
Type 4
40%
Type 5
50%

20
Type ?
?
Consumer Types
Each consumer knows which type he/she is, but insurers don’t.
The average probability of badness is 30%.

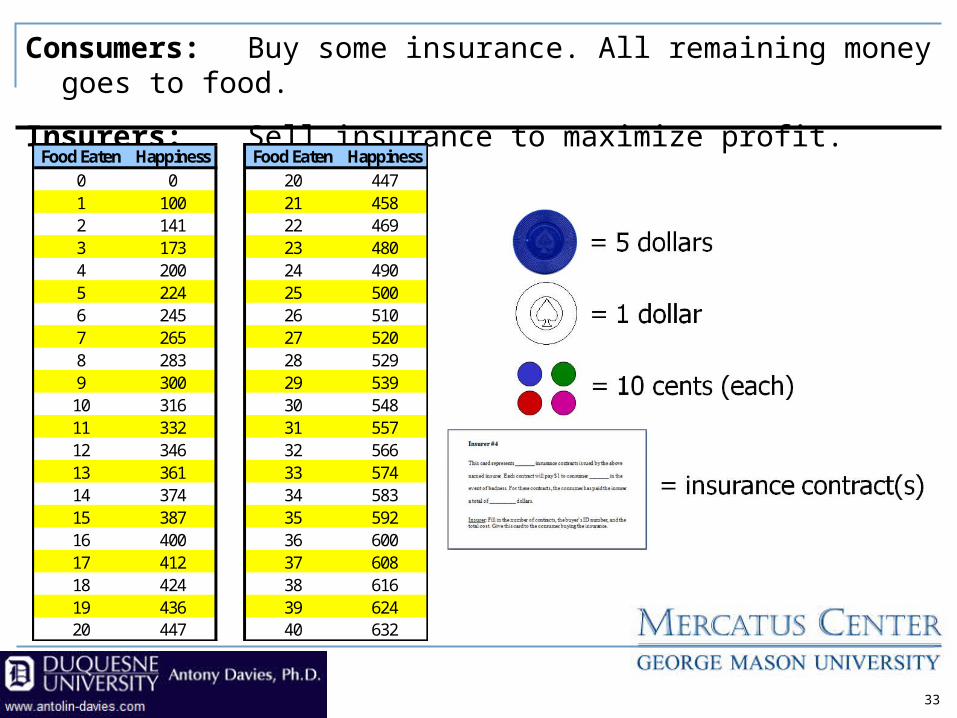
The Objects
21
= 1 dollar
= 10 cents (each)
= insurance contract(s)
= 5 dollars

Contracts
22
12 6
$4.80

The Mechanics
23
Agent
Insurers Consumers
Head Office
$0.30Yes

The Mechanics
24
Agent
Insurers Consumers
Head Office

The Mechanics
25
Agent
Insurers Consumers
Head Office

Ready to begin…
26

Consumers: Buy some insurance. All remaining money goes to food.
Insurers: Sell insurance to maximize profit.
27
Food Eaten Happiness Food Eaten Happiness0 0 20 4471 100 21 4582 141 22 4693 173 23 4804 200 24 4905 224 25 5006 245 26 5107 265 27 5208 283 28 5299 300 29 539
10 316 30 54811 332 31 55712 346 32 56613 361 33 57414 374 34 58315 387 35 59216 400 36 60017 412 37 60818 424 38 61619 436 39 62420 447 40 632

Accounting Phase
Consumers report:
• Contracts purchased, cost, and from which insurer(s)
28

29
1 no2 YES3 no4 YES5 no6 no7 no8 YES9 no10 YES11 no12 YES13 no14 no15 no16 YES17 no18 no19 no20 no
BadnessConsumer
0
5
10
15
20
25
30
1 2 3 4 5 6 7 8 9 10 11 12 13 14 15 16 17 18 19 20
Consumer #
Food Purchased Contracts Purchased Food Consumed

30
1 no2 YES3 no4 YES5 no6 no7 no8 YES9 no10 YES11 no12 YES13 no14 no15 no16 YES17 no18 no19 no20 no
BadnessConsumer
-$20.00
-$15.00
-$10.00
-$5.00
$0.00
$5.00
$10.00
$15.00
$20.00
$25.00
$30.00
1 2 3 4 5 6 7 8 9 10
Insurer #
Revenue Indemnities Profit

Mandated Insurance
Concerned that some consumers do not have enough insurance coverage, the law stipulates that an insurer may not sell less than 35 contracts to a buyer unless the buyer has already purchased at least 35 contracts (from any insurer) this round.
31

Ready to begin…
32
Consumers: Buy some insurance. All remaining money goes to food.
Insurers: Sell insurance to maximize profit.
33
Food Eaten Happiness Food Eaten Happiness0 0 20 4471 100 21 4582 141 22 4693 173 23 4804 200 24 4905 224 25 5006 245 26 5107 265 27 5208 283 28 5299 300 29 539
10 316 30 54811 332 31 55712 346 32 56613 361 33 57414 374 34 58315 387 35 59216 400 36 60017 412 37 60818 424 38 61619 436 39 62420 447 40 632

34
Accounting Phase
Consumers report:
• Contracts purchased, cost, and from which insurer(s)

35
1 no2 no3 no4 no5 no6 YES7 no8 YES9 YES
10 no11 no12 no13 no14 YES15 no16 no17 no18 YES19 no20 YES
BadnessConsumer
0
20
40
60
80
100
120
140
160
1 2 3 4 5 6 7 8 9 10 11 12 13 14 15 16 17 18 19 20
Consumer #
Food Purchased Contracts Purchased Food Consumed

36
1 no2 no3 no4 no5 no6 YES7 no8 YES9 YES
10 no11 no12 no13 no14 YES15 no16 no17 no18 YES19 no20 YES
BadnessConsumer
-$100.00
-$50.00
$0.00
$50.00
$100.00
$150.00
1 2 3 4 5 6 7 8 9 10
Insurer #
Revenue Indemnities Profit

Mandatory Insurance
Concerned that some consumers do not have any insurance, the law requires that all consumers buy a total of no less than 35 contracts this round.
37

Ready to begin…
38

Consumers: Buy some insurance. All remaining money goes to food.
Insurers: Sell insurance to maximize profit.
39
Food Eaten Happiness Food Eaten Happiness0 0 20 4471 100 21 4582 141 22 4693 173 23 4804 200 24 4905 224 25 5006 245 26 5107 265 27 5208 283 28 5299 300 29 539
10 316 30 54811 332 31 55712 346 32 56613 361 33 57414 374 34 58315 387 35 59216 400 36 60017 412 37 60818 424 38 61619 436 39 62420 447 40 632

40
Accounting Phase
Consumers report:
• Contracts purchased, cost, and from which insurer(s)

41
1 no2 YES3 no4 no5 YES6 no7 no8 no9 no
10 no11 YES12 no13 no14 YES15 YES16 no17 no18 no19 no20 YES
BadnessConsumer
0
10
20
30
40
50
60
70
80
90
1 2 3 4 5 6 7 8 9 10 11 12 13 14 15 16 17 18 19 20
Consumer #
Food Purchased Contracts Purchased Food Consumed

42
1 no2 YES3 no4 no5 YES6 no7 no8 no9 no
10 no11 YES12 no13 no14 YES15 YES16 no17 no18 no19 no20 YES
BadnessConsumer
-$40.00
-$20.00
$0.00
$20.00
$40.00
$60.00
$80.00
$100.00
1 2 3 4 5 6 7 8 9 10
Insurer #
Revenue Indemnities Profit

Results…
43

44
Insurance Contracts Purchased
0
100200
300400
500
600700
800
Type 1 Type 2 Type 3 Type 4 Type 5
Free Market Required Minimum Required PurchaseMandatoryMandated

45
Food Purchased
0
50100
150
200250
300
350400
450
Type 1 Type 2 Type 3 Type 4 Type 5
Free Market Mandated Mandatory

46
Happiness
0
2000
4000
6000
8000
10000
Type 1 Type 2 Type 3 Type 4 Type 5
Free Market Mandated Mandatory

47
Insurance Price per Contract
$0.00
$0.05
$0.10
$0.15
$0.20
$0.25
$0.30
$0.35
$0.40
$0.45
Free Market Mandated Mandatory

48
Insurance Profits
($200.00)
($150.00)
($100.00)
($50.00)
$0.00
$50.00
$100.00
$150.00
$200.00
Type 1 Type 2 Type 3 Type 4 Type 5
Free Market Required Minimum Required PurchaseMandatoryMandated

49
Happiness
0
2000
4000
6000
8000
10000
Type 1 Type 2 Type 3 Type 4 Type 5
Free Market (full info) Free Market Mandated Mandatory

50
Insurance Contracts Purchased
0
100
200
300
400
500
600
700
800
Type 1 Type 2 Type 3 Type 4 Type 5
Free Market (full info) Free Market Mandated Mandatory

51
Food Purchased
0
50100
150
200250
300
350400
450
Type 1 Type 2 Type 3 Type 4 Type 5
Free Market (full info) Free Market Mandated Mandatory

52
Insurance Price per Contract
$0.00
$0.05
$0.10
$0.15
$0.20
$0.25
$0.30
$0.35
$0.40
$0.45
Free Market (full info) Free Market Mandated Mandatory

• Forces lower risk people to consume quantities of goods that they may not want to consume.
• End result is a transfer of wealth from low risk to high risk people.
• A better solution is simply to tax the low risk people, give the money to the high risk people and let them buy what they want.
53
What is the effect of insurance mandates?

But, we have to do something!
Look at what has been happening to the cost of health care over time!
54

0.0
50.0
100.0
150.0
200.0
250.0
300.0
350.0
400.0
1980
1981
1982
1983
1984
1985
1986
1987
1988
19
8919
9019
9119
9219
9319
9419
9519
9619
9719
9819
9920
0020
0120
0220
0320
0420
0520
06
Price of Medical Care Consumer Prices Excluding Medical Care
55
Source: Bureau of Labor Statistics (www.economy.com)
Price of medical care has increased 349% since 1980 versus 135% for other consumer prices.

0.0
50.0
100.0
150.0
200.0
250.0
300.0
350.0
400.0
450.0
500.0
1980
1981
1982
1983
1984
1985
1986
1987
1988
19
8919
9019
9119
9219
9319
9419
9519
9619
9719
9819
9920
0020
0120
0220
0320
0420
0520
06
Price of Physicians Services
Price of Hospital Services
Price of Prescription Drugs and Medical Supplies
56
Source: Bureau of Labor Statistics (www.economy.com)
Hospital services + 576%
Drugs and supplies + 402%
Physician services + 282%
Other consumer prices+ 135%

57
Source: Bureau of Labor Statistics (www.economy.com)
-800%
-600%
-400%
-200%
0%
200%
400%
600%
Co
lle
ge
Tu
itio
n
Me
dic
al C
are
Sta
te/L
oca
l Go
v't
(pe
r-c
ap
ita
)
Fed
era
l Go
v't
(pe
r-c
ap
ita
)
Ho
usi
ng
Foo
d
Ga
soli
ne
Ne
w C
ars
1 G
Hz
of
Co
mp
uti
ng
Po
we
r
Gro
wth
in P
rice
s 1
98
0
-20
06

But, the cost of health care is only half of the picture.
What has been happening to the quality of health care?
58
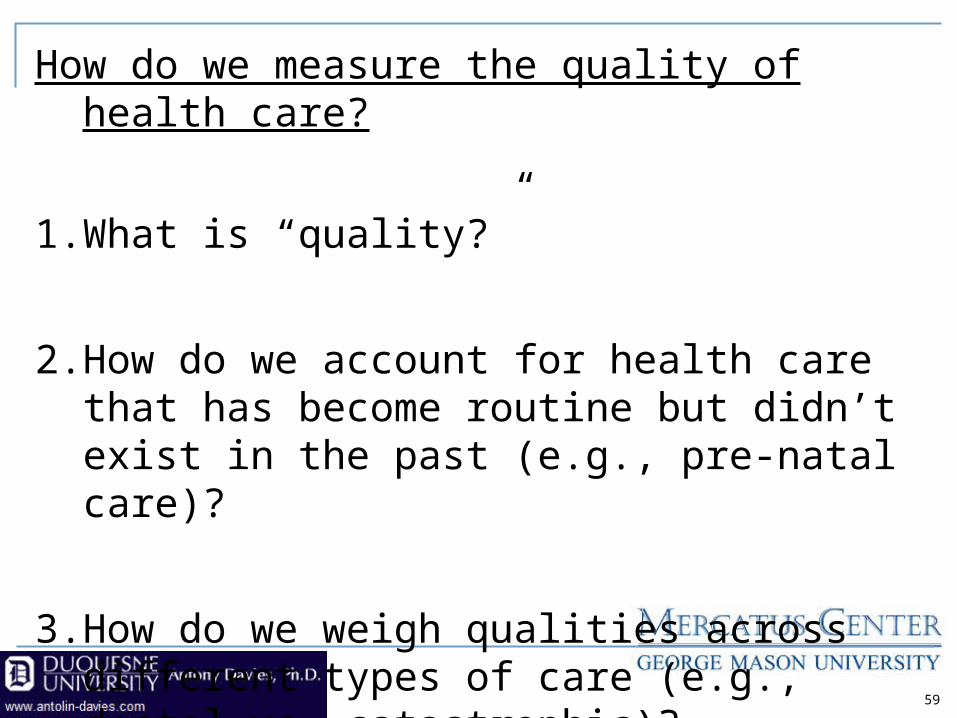
How do we measure the quality of health care?
1. What is “quality?”
2. How do we account for health care that has become routine but didn’t exist in the past (e.g., pre-natal care)?
3. How do we weigh qualities across different types of care (e.g., dental vs. catastrophic)?
59

How does one measure the quality of health care?
An easy measure of the effectiveness of health care is the mortality rate.
Some health care may have little or no impact on the mortality rate (e.g., orthodonture).
But, it is not unreasonable to assume that the qualities of other types of health care grow at similar rates. 60

61
7.5
8.0
8.5
9.0
9.5
10.0
1960
1970
1972
1974
1976
1978
1980
1982
1984
1986
1988
1990
1992
1994
1996
1998
2000
2002
2004
2006
Deaths per 1,000 People
Source: Statistical Abstract of the United States, 2008, Table 77.

0.0
5.0
10.0
15.0
20.0
25.0
30.0
1960
1970
1972
1974
1976
1978
1980
1982
1984
1986
1988
1990
1992
1994
1996
1998
2000
2002
2004
2006
Infant Mortality per 1,000 Live Births
62
Source: Statistical Abstract of the United States, 2008, Table 77.

63
Source: Statistical Abstract of the United States, 2008, Table 110.
0.0
10.0
20.0
30.0
40.0
50.0
60.0
1960
1962
1964
1966
1968
1970
1972
1974
1976
1978
1980
1982
1984
1986
1988
1990
1992
1994
1996
1998
2000
2002
2004
Deaths by Influence and Pneumonia (per 100,000 population)Deaths by Influenza and Pneumonia (per 100,000 population)

1.5
1.7
1.9
2.1
2.3
2.5
2.7
2.9
1960
1970
1972
1974
1976
1978
1980
1982
1984
1986
1988
1990
1992
1994
1996
1998
2000
2002
2004
2006
Mill
ions
Actual Deaths in the Current Year Deaths at the 1960 Mortality Rate
64
Source: Derived from Statistical Abstract of the United States, and the Bureau of Economic Analysis.
What does increased cost of health care buy us?
400,000 lives saved annually

But, what about the uninsured?
They aren’t sharing in this increased quality of health care.
65

0%
2%
4%
6%
8%
10%
12%
14%
16%
18%
1987
1988
1989
1990
1991
1992
1993
1994
1995
1996
1997
1998
1999
2000
2001
2002
2003
2004
2005
2006
2007
66
Source: Income, Poverty, and Health Insurance Coverage in the U.S.: 2006, US Census Bureau.
The percentage of the population that is uninsured has remained stable over time.

0.0%
5.0%
10.0%
15.0%
20.0%
25.0%
30.0%
35.0%
1999 2000 2001 2002 2003 2004 2005 2006
Under 18 18 to 24 25 to 34 35 to 44 45 to 54 55 to 64
67
Source: Income, Poverty, and Health Insurance Coverage in the U.S.: 2006, US Census Bureau.
Percentage of uninsured has remained relatively constant for the young and the old – the two groups for whom there is the least incentive to tradeoff health care for spending on other things.
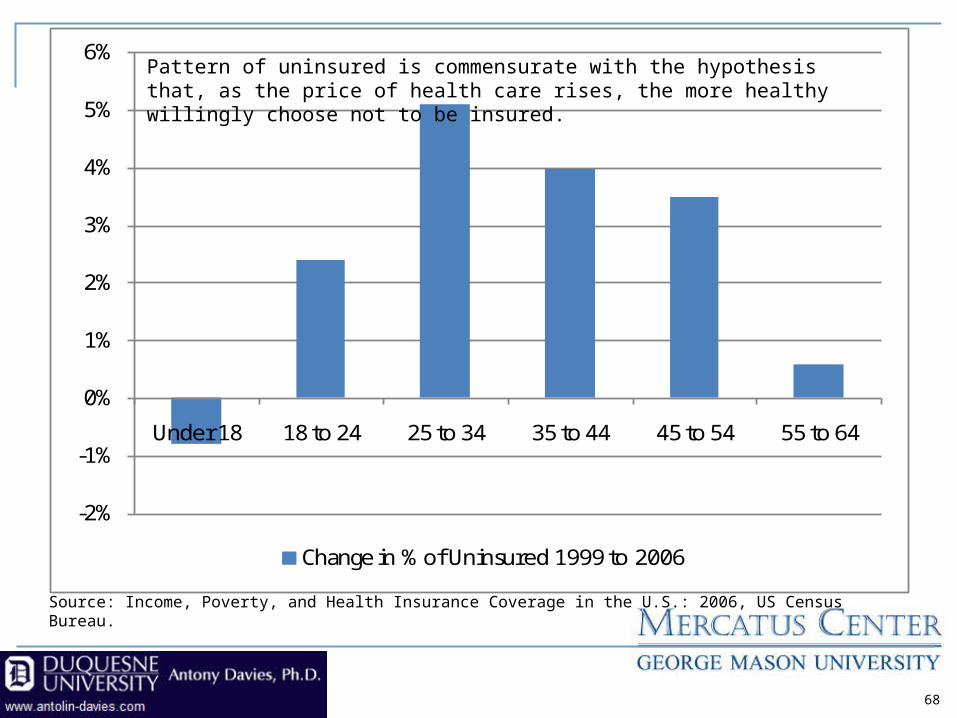
-2%
-1%
0%
1%
2%
3%
4%
5%
6%
Under 18 18 to 24 25 to 34 35 to 44 45 to 54 55 to 64
Change in % of Uninsured 1999 to 2006
68
Source: Income, Poverty, and Health Insurance Coverage in the U.S.: 2006, US Census Bureau.
Pattern of uninsured is commensurate with the hypothesis that, as the price of health care rises, the more healthy willingly choose not to be insured.

A free choice to purchase is a vote, but with three important differences.
Political vote: One size fits all.
Free market vote: Multiple sizes for multiple recipients.
Political vote: Speed of change is driven by the election cycle.
Free market vote: Speed of change is driven by the accounting cycle.
Political vote: Signal is distorted because the vote is for a “bundle” of issues embodied by one candidate.
Free market vote: Signal is clear because the vote is for a specific issue. 69
Voting for the “right” amount of insurance

70
The Games Economists Play: Interactive Public Policy
Capital Campus TexasJuly 9, 2008
copies of this presentation can be found atwww.antolin-davies.com