1 “the dawn came late and breakfast had to wait when the gales of november came slashing when...
TRANSCRIPT

1
“The dawn came late and breakfast had to wait
When the gales of November came slashing
When afternoon came it was freezing rain
In the face of a hurricane west wind”
Gordon Lightfoot
The Wreck of the Edmund Fitzgerald

METEOROLOGY 2008
SEVERE STORMS

3
PRESENTED BY:
MARK A. VAN HECKE
EARTH-SPACE SCIENCE EVENT TRAINER
ANCHOR BAY HIGH SCHOOL
FAIR HAVEN, MICHIGAN

4
PRESENTATION OBJECTIVES
• Define ‘Severe Weather’
• Identify representative tasks students may be asked to complete in the Science Olympiad Meteorology event.
• Identify resources to help Coaches prepare their students for competition in the Science Olympiad Meteorology event.

5
SCIENCE PROCESS SKILLS
• Observation
• Inference
• Data and diagram analysis
• Predictions
• Conclusions

6
WHAT IS SEVERE WEATHER?Severe weather refers to any weather event that is disruptive or destructive to human life and property

7
SEVERE WEATHER EVENTS
The World Meteorological Organization at its 2004 conference identified severe weather events that are common throughout the world.

8
HEAVY RAIN

9
STRONG WINDS AND GUSTS

10
HAIL

11
LIGHTNING
12
TORNADOES

13
FLASH FLOODS

14
EXTREME TEMPERATURES

15
REGIONAL SEVERE WEATHER EVENTS
The World Meteorological Organization has also identified forms of severe weather that are localized in specific regions of the world. These include:

16
SNOW STORMS

17
DUST AND SAND STORMS

18
SEA SWELLS/TSUNAMIS

19
HURRICANES-TROPICAL STORMS

20
EXTENDED AREAS OF FOG

21
The 2008 Science Olympiad Meteorology competition will emphasize severe weather events that are common to the United States and North America. Participants may be asked to complete one or more of the following representative tasks:
REPRESENTATIVE TASKS
2008 SCIENCE OLYMPIAD METEOROLOGY EVENT
•Use weather station data, isobar maps, fronts, radar data, or meteograms alone or in conjunction with one another to interpret weather data.
•Demonstrate knowledge of the life cycle of different severe storms and be able to associate those conditions with radar and frontal data.
•Relate specific hazardous conditions of severe storms and interpret their significance.
•Complete storm tracking and prediction using provided weather data

22
WEATHER STATION DATA
23
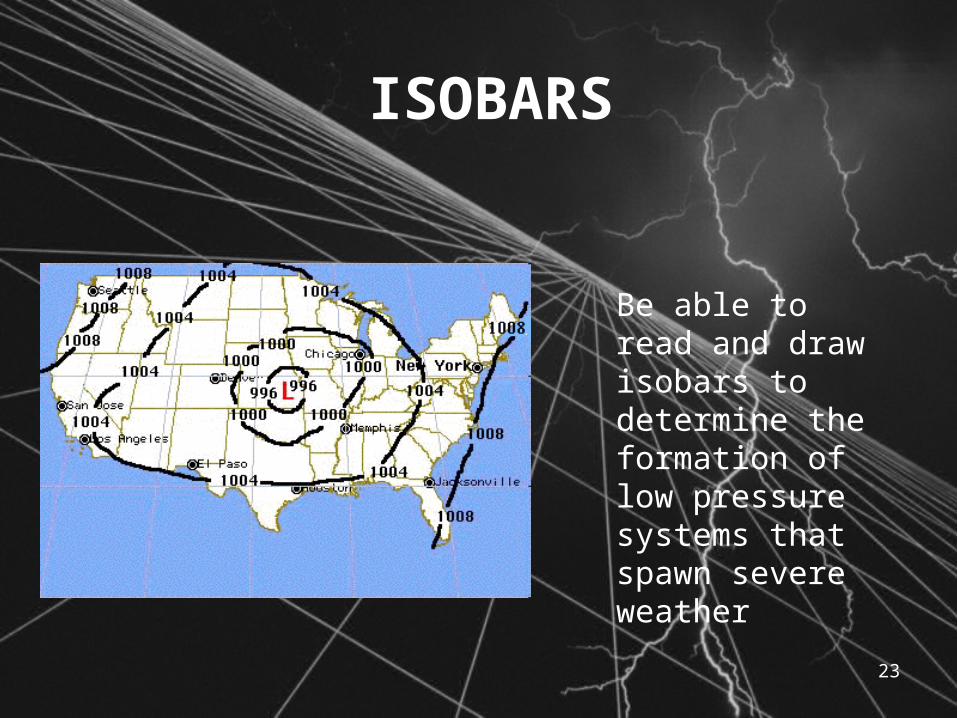
ISOBARS
Be able to read and draw isobars to determine the formation of low pressure systems that spawn severe weather

24
FRONTS

25
RADAR DATA

26
METEOGRAMS
27

28
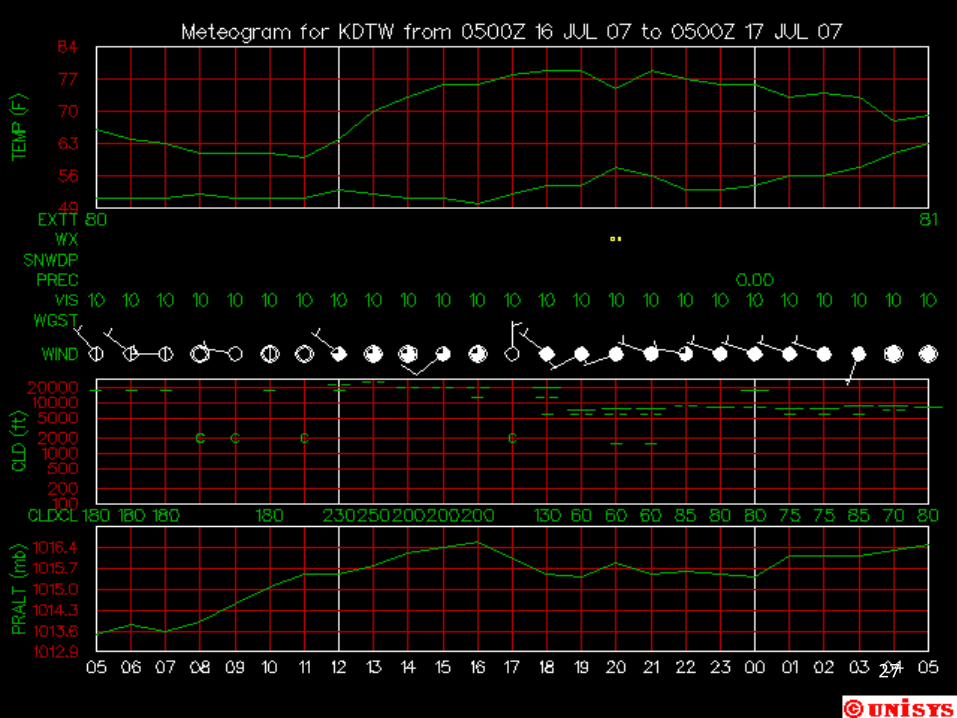
MeteogramsThis is a 25 hour time series for a particular station location. The plot is divided up into several subplots described top to bottom:* Temperature and dewpoint chart - This shows temperature as the top line and dewpoint as the bottom line. * EXTT (extreme temperature) - The maximum and minimum temperatures are plotted below the chart at specific reporting times. 12Z and 18Z are generally low temperatures and 0Z and 6Z are high temperatures.* WX (present weather data) - This shows the weather being reported at that time as a weather symbol.* SNWDP (snow depth) - This shows reported snow cover in inches.* PREC (precipitation) - This shows precipitation totals in inches. The values are 24 hour totals generally at 12Z, 6 hour totals at 0Z, 6Z and 18Z, 3 hour totals elsewhere.* VIS (visibility) - This shows the horizontal visibility in miles.* WGST (wind gusts) - This reports wind gusts in knots if the winds are strong and gusty. This is generally the maximum wind reported over a several minute period during the observation of data.* WIND (winds and cloud cover) - This is the standard wind and cloud cover symbols used in the surface data plots. Up is north.* Cloud chart - This chart gives cloud layer information. The vertical axis is height of cloud base in feet and is logarithmic. The layers are plotted as horizontal lines. Clear skies are plotted as a 'C'. Scattered cloud layers (1/8th to 3/8th coverage) are plotted as a single short dash. Broken cloud layers (4/8th to 7/8th coverage) are plotted as two short dashes. Overcast layers are plotted as a single long dash. The actual cloud ceiling is displayed below the chart in 100s of feet if the ceiling is below 10,000 feet.* Pressure chart - This chart plots sea level pressure (or altimeter setting if pressure not reported) in millibars.* Time - This is the reporting time in universal time.

29
CONDITIONS OF SEVERE STORMS

30
CONDITIONS OF SEVERE STORMS
Thunderstorms are often a precursor to other forms of severe weather. They develop in three stages:
•Developing
•Mature
•Dissipating

31
Stages of Thunderstorm Development

32
STAGE ONE: DEVELOPING

33
STAGE TWO: MATURE

34
TORNADO FORMATION

35
STORM TRACKING AND PREDICTION

36
HURRICANE TRACKING

37
TROPICAL DEPRESSIONS

38
TROPICAL STORMS

39
HURRICANES

40
OTHER RESOURCES

41
ON YOUR CD
2008 Science Olympiad Meteorology Text. An expanded and updated version of the 2007 Text with Severe storm information
Weather indicators guide using wind direction and barometric pressure changes to forecast weather
NOAA Publication Hurricane Basics
Sample Science Olympiad Meteorology Events from past competitions with Severe Weather themes