1. summary of key findings - home - maroondah city … · web viewthe greatest period of population...
TRANSCRIPT
Maroondah City Council Health and Wellbeing Statistical ProfileAugust 2017
Contents1. Summary of Key Findings................................................................................3
1.1 Population Profile........................................................................................................................3
1.2 Population Health........................................................................................................................3
1.3 Community Safety.......................................................................................................................4
1.4 Liveability.....................................................................................................................................5
2 Population Profile.............................................................................................62.1 Population.............................................................................................................................6
2.2. Age Structure.........................................................................................................................8
2.3. Gender.................................................................................................................................10
2.4 Cultural Heritage & Diversity...............................................................................................11
2.5 Housing Profile.....................................................................................................................13
2.5.1 Household Types..........................................................................................................13
2.5.2 Housing Tenure............................................................................................................14
2.5.3 Maroondah Housing Stress, 2011................................................................................15
2.5.4 Cost of Housing............................................................................................................17
2.5.5. Forecast Dwellings and Development..........................................................................17
2.5.6 Social Housing and Homelessness...............................................................................18
2.6 SEIFA....................................................................................................................................19
2.7 Education, Employment and Income...................................................................................21
2.7.1 Education.....................................................................................................................21
2.7.2 Employment.................................................................................................................21
2.7.3 Income.........................................................................................................................24
3. Population Health.......................................................................................273.1 Self-reported Health............................................................................................................28
3.2 Avoidable Death Rate..........................................................................................................29
3.3 Life Expectancy at Birth.......................................................................................................30
3.4 Burden of Disease................................................................................................................30
3.5. Lifecourse............................................................................................................................31
3.5.1 Infants and children.....................................................................................................31
3.5.2 Young people...............................................................................................................33
1
3.5.3 Older adults and disability...........................................................................................35
3.6 Modifiable Risk Factors Contributing to Chronic Disease....................................................42
3.6.1 Healthy Eating..............................................................................................................43
3.6.2 Mental Wellbeing........................................................................................................44
3.6.3 Physical Activity...........................................................................................................45
3.7 Sexual & Reproductive Health.............................................................................................47
3.8 Health and Wellbeing, Chronic Conditions, Screening and Eye Health................................50
3.8 Social Capital........................................................................................................................51
3.9. Health Service Access & Utilisation......................................................................................52
4. Community Safety....................................................................................554.1 Perceptions of Safety...........................................................................................................55
4.2 Crime Rates..........................................................................................................................56
4.3 Family Violence....................................................................................................................59
4.4 Child Abuse & Neglect.........................................................................................................59
4.5 Tobacco, Alcohol, and Other Drugs.....................................................................................60
4.6 Gambling..............................................................................................................................64
5. Liveability....................................................................................................655.1 Green Space.........................................................................................................................65
5.2 Transport.............................................................................................................................67
5.3 Walkability...........................................................................................................................68
5.4 Food.....................................................................................................................................69
5.5 Environmental Sustainability...............................................................................................70
6. References.....................................................................................................74
2

1. Summary of Key Findings
1.1 Population ProfileSummaryKey findings - Population Profile include:
Increase in population requires an integrated planning approach to consider and account for increased demand on infrastructure, housing and services.
The greatest period of population increase is forecast during 2017 -2021 (the lifecycle of the upcoming Maroondah Health and Wellbeing Plan) and consideration must be given to how this will be serviced.
Maroondah has a lower level of young workforce than Greater Melbourne The largest proportional increase to a service age group between 2016 and 2026 is
forecast to be Seniors aged 70 to 84, which is expected to increase from 8.7% to 10.4% of the total population.
Inequality in health outcomes for Indigenous & CALD persons need to be addressed Maroondah’s percentage of humanitarian new settler arrivals (50.8%) is the highest in the
state (9.3%). The percentages of social housing and rental housing that is affordable (4.1%) are below
the state measures (19.1%), Lone person households account for a quarter of Maroondah’s dwellings, highlighting the
need for adequate consideration to isolation and social inclusion initiatives. The five areas with Maroondah with the highest level of disadvantage are: Ringwood Metropolitan Activity Centre Croydon Town Centre Kilsyth Ringwood Bayswater North Setting based initiatives required to target pockets of disadvantage within Maroondah
1.2 Population HealthSummaryKey findings - Population Health include:
High level of older females living alone Lower than EMR average for male life expectancy Health promotion initiatives to be undertaken to assist in addressing avoidable mortality
and top 10 burden of disease findings Maroondah has the highest rate of suicide in the EMR and is above the avoidable
mortality rate (suicide) for Greater Melbourne. Maroondah has the highest rate in the EMR of persons aged 60-69 years experiencing
elder abuse and the second highest rate of person 70-79 years experiencing elder abuse Maroondah and Monash have the equal highest percentage of people with a profound or
severe disability in the EMR. Accessibility, inclusiveness, and adequate service provision is required in planning for beneficial health and wellbeing outcomes for this cohort.
There will be an estimated increase of 4,160 persons, in Maroondah, with dementia between the years of 2016 and 2050.
Maroondah has a significantly higher estimate to both the EMR and Victoria for persons
3

consuming sugar sweetened drinks daily. Maroondah has a below EMR and Victoria estimated participation in both 2 yearly
cholesterol checks and blood sugar or diabetes checks. The percentage of people reporting high/very high psychological distress is above the
state measure. Maroondah has the second highest rate of hospital admissions for mental health related
causes in the EMR and a higher rate than both Greater Melbourne and Victoria. Chlamydia notification rates in Maroondah are markedly higher than the EMR and State
average. Maroondah has a very high rate compared to the EMR average of mothers under 20 years
of age.
1.3 Community SafetySummaryKey findings – Community Safety include:
Crime rates in Maroondah are the third highest in the EMR, behind Knox and Monash. Maroondah’s crime rate has increased by 16.4% between 2016 and 2017. In the EMR Maroondah has the second lowest perception of safety, after dark Maroondah has the third highest rate per 100,000 population of family violence incidents
in the EMR. Second highest proportion of adult population with lifetime risk from alcohol use Second highest rate of persons who consumed alcohol at least weekly at levels likely to
cause short-term harm Third highest rate of alcohol related hospital admissions across both ‘all persons’ and
persons aged 15-24 years Highest rate of high alcohol hours (Fri & Sat 8pm – 6am) alcohol related assaults across
both ‘all persons’ and persons aged 18-24 years Third highest rate of alcohol related family violence Highest rate of alcohol related family violence by persons, 18-24 years Third highest percentage in EMR of persons smoking Highest rate of ambulance attendance due to Crystal Methamphetamine Highest rate of Illicit drug Emergency Department presentations Maroondah has highest EGM expenditure per adult in the EMR. The rates of child protection investigations and substantiations are below the state
measures.
1.4 LiveabilitySummary
4

Key findings - Liveability include:
New open space land opportunities within Maroondah will need to come from existing site redevelopments, land swap negotiations or from planned acquisition utilising open space contributions as the investment mechanism
Maroondah has the second highest percentage of persons visiting green space on a weekly basis or more than the EMR and higher than Victorian percentage.
10.5% of Maroondah residents travelling to work use public transport which is lower than the EMR 12.7%
88.4% of households in Maroondah are within 400m of a bus stop. The majority of Maroondah suburbs are car dependant Maroondah has a higher incidents of food insecurity than both the EMR and Victoria. The percentage of Maroondah households engaging in waste water recycling is lower
than the EMR percentage. Maroondah is ranked lowest in the in the EMR for installation of solar water heaters The suburbs of Warranwood, Ringwood North, Ringwood, Croydon North and Croydon
are areas with a high heat vulnerability index. As with Greater Melbourne the EMR is expected to experience increasingly hotter drier
conditions, resulting in; increased frequency, duration and severity of heat waves, decreased average rainfall and more severe, prolonged drought conditions, less regular but more intense rainfall and storm events and significant increase in bushfire danger days
5

2 Population Profile
2.1 PopulationThe City of Maroondah includes the suburbs of Bayswater North, Croydon, Croydon Hills, Croydon North, Croydon South, Heathmont, Kilsyth (part), Kilsyth South, Park Orchards (part), Ringwood, Ringwood East, Ringwood North (part), Vermont (part), Warranwood and Wonga Park (part).
The 2016 Estimated Resident Population for the City of Maroondah is 114,979 with a population density of 18.57 persons per hectare.
Since 2011, Maroondah’s population has increased by 7,656 individuals with a 1.4% increase (1,701 individuals) between 2015- 2016.
Over the next 10 years (2016-2026), Maroondah’s population is expected to increase by 8,584 people to a total of 123,563 by 2026, at an average annual growth rate of 0.7%. The number of households in Maroondah is forecast to grow from 43,663 in 2016 to 48,680 in 2026, an increase of 5,017 during this period. The average number of persons per household is anticipated to fall from 2.55 in 2016 to 2.50 in 2026.
Graph 1: Maroondah ERP Change in number of people, 2006-2016
Source: Australian Bureau of Statistics, Regional Population Growth, Australia (3218.0). Compiled and presented by .id , the population experts, August 2017.
6

Table 1. Forecast population, households and dwellings, 2011-2036Maroondah City Forecast yearSummary 2011 2016 2021 2026 2031 2036Population 107,322 112,901 118,631 123,563 128,429 133,526Change in population (5yrs) 5,579 5,730 4,932 4,866 5,097Average annual change 1.02% 1.00% 0.82% 0.78% 0.78%Households 41,011 43,663 46,366 48,680 50,850 53,045Average household size 2.58 2.55 2.52 2.50 2.48 2.48Population in non private dwellings 1,683 1,761 1,862 1,952 2,102 2,202Dwellings 42,336 45,105 47,940 50,371 52,650 54,953Dwelling occupancy rate 96.87 96.80 96.72 96.64 96.58 96.53
Source: Population and household forecasts, 2011 to 2036, prepared by .id , the population experts, January 2015.
In 2016, the population density in the City of Maroondah was 18.57 per hectare. This figure was higher compared to Greater Melbourne, which had a population density of 4.73 persons per hectare (the Greater Melbourne however, does include very large areas of non-residential land). It is important to note that population density varies across the municipality.
Whilst 2016 population density data is not yet available, the population density in 2011 within Maroondah ranged from a low of 9.06 persons per hectare in Kilsyth South to a high of 21.71 persons per hectare in Croydon Hills.
The five suburbs with the highest population densities were:
Croydon Hills (21.71 persons per hectare) Ringwood East (20.46 persons per hectare) Heathmont (19.72 persons per hectare) Ringwood North (19.12 persons per hectare) Croydon North (18.83 persons per hectare)
The greatest population change for the Maroondah City over the next 20 years is forecast for the period from 2017 to 2021. This period is expected to have a net increase of 5,730 people.
Table 2. Components of population changeMaroondah City Forecast period
Component 2017 to 2021 2022 to 2026 2027 to 2031 2032 to 2036Births 7,812 8,029 8,157 8,399Deaths 4,395 4,592 4,848 5,132Natural increase/decrease 3,417 3,437 3,309 3,267Net migration 2,213 1,405 1,407 1,731Change in persons in non-private dwellings 101 90 150 100Total population change 5,730 4,932 4,866 5,097
Source: Population and household forecasts, 2011 to 2036, prepared by .id , the population experts, January 2015.
7

2.2. Age Structure
Analysis of the service age groups of the City of Maroondah in 2016 compared to Greater Melbourne shows that there was a similar proportion of people in the younger age groups (0 to 17 years) and a higher proportion of people in the older age groups (60+ years).
Overall, 22.2% of the population was aged between 0 and 17, and 21.5% were aged 60 years and over, compared with 21.7% and 19.0% respectively for Greater Melbourne.
The major differences between the age structure of the City of Maroondah and Greater Melbourne were:
A larger percentage of 'Empty nesters and retirees' (10.3% compared to 9.3%) A smaller percentage of 'Young workforce' (13.8% compared to 16.3%) A smaller percentage of 'Tertiary education & independence' (8.5% compared to 10.0%)
Graph 2. Age Structure – service age groups, 2016
Source: Australian Bureau of Statistics, Census of Population and Housing 2016. Compiled and presented by .id , the population experts, August 2017.
The largest proportional increase to a service age group between 2016 and 2026 is forecast to be Seniors aged 70 to 84, which is expected to increase from 8.7% to 10.4% of the total population.
The largest service age group in 2026 is forecast to be the Parents and homebuilders aged 35 to 49 years, with a total of 26,217 persons.
8

Table 3. Forecast Age Structure – Service age groups, 2016
Maroondah City - Total persons 2016 2026 2036 Change between
2016 and 2036Age group (years) Number % Number % Number % Number
Babies and pre-schoolers (0 to 4) 7,451 6.6 8,020 6.5 8,471 6.3 1,019
Primary schoolers (5 to 11) 9,465 8.4 10,539 8.5 11,196 8.4 1,731Secondary schoolers (12 to 17) 7,920 7.0 8,554 6.9 9,255 6.9 1,334
Tertiary education and independence (18 to 24) 10,155 9.0 10,288 8.3 11,187 8.4 1,032
Young workforce (25 to 34) 16,262 14.4 17,093 13.8 18,083 13.5 1,821Parents and homebuilders (35 to 49) 23,936 21.2 26,217 21.2 28,222 21.1 4,286
Older workers and pre-retirees (50 to 59) 13,986 12.4 14,817 12.0 15,892 11.9 1,906
Empty nesters and retirees (60 to 69) 11,248 10.0 12,252 9.9 13,078 9.8 1,830
Seniors (70 to 84) 9,877 8.7 12,833 10.4 14,430 10.8 4,553Elderly aged (85 and over) 2,600 2.3 2,950 2.4 3,712 2.8 1,113Total persons 112,901 100.0 123,563 100.0 133,526 100.0 20,625
Source: Population and household forecasts, 2011 to 2036, prepared by .id , the population experts, January 2015.
9

2.3. Gender
Current official population estimates show that females in Maroondah comprise 51.6% of the population and males comprise 48.4%.
Across the age groups for females and males, there are higher proportions of females compared with males in the older years. This pattern in respective age distributions reflects the longer life expectancies of women and is consistent with Victorian and Australian trends. It also suggests specific approaches by health planners to support the health and wellbeing of women who generally live longer than men but can also experience higher rates of morbidities associated with the older years.
Graph 3: Age Distribution of Females and Males in Maroondah, 2016
0-4 5-9 10-14
15-19
20-24
25-29
30-34
35-39
40-44
45-49
50-54
55-59
60-64
65-69
70-74
75-79
80-84
85+0.0
1.0
2.0
3.0
4.0
5.0
6.0
7.0
8.0
Males Females
Source: Australian Bureau of Statistics, Census of Population and Housing 2016. Compiled by Maroondah City Council, August 2017.
10

2.4 Cultural Heritage & DiversityAt the 2016 Census, 566 residents of Maroondah identified as Aboriginal or Torres Strait Islander (ATSI). The median age being 25 years and the dominant family type being couples with children, as per the non-Indigenous dominant family type.
ATSI-identified females have a younger age profile compared with their non-ATSI counterparts, with relatively lower proportions aged 55 years and over. This pattern reflects the higher birth rates and lower life expectances of the ATSI-identifying population generally.
Within the context of this document and in alignment with the ABS, ancestry is being defined as the cultural association and ethnic background of an individual going back three generations.
An analysis of the ancestry responses of the population of Maroondah in 2016, shows that the top five ancestries nominated were;
English (41,324 people or 37.4%)
Australian (37,481 people or 34.0%)
Irish (12,621 people or 11.4%)
Scottish (11,345 people or 10.3%)
Chinese (6,473 people or 5.9%)
In combination these five ancestries account for 109,244 responses in total, or 98.98% of all
responses.
The largest change in reported ancestries between 2011-2016 was an increase of +2,671 persons identifying as being of Chinese ancestry.
However, when considering country of birth and recent arrivals of overseas migrants to Maroondah in the last 5 years, the most significant countries of origin have been China 1,501 persons, Burma (Myanmar) 921 persons, India 572 persons and Malaysia 399 persons.
81.8% of recent overseas arrivals in Maroondah come from countries where English was not their first language, where as 16% of the total Maroondah population, came from countries where English was not their first language.
11

Graph 4: Maroondah Ancestry, 2016
Source: Australian Bureau of Statistics, Census of Population and Housing 2016. Compiled and presented by .id , the population experts, August 2017.
Graph 5: Birthplace Maroondah, 2016
Source: Australian Bureau of Statistics, Census of Population and Housing 2016. Compiled and presented by .id , the population experts, August 2017.
From a health and wellbeing perspective it is essential that culturally sensitive and appropriate initiatives are undertaken so as to assist in striving towards equity in health outcomes.
Within Maroondah 17.0% of residents speak a language other than English at home, with the most common languages other than English being Mandarin and Cantonese.
Maroondah’s percentage of humanitarian new settler arrivals (50.8%) is the highest in the state (9.3%).
12

2.5 Housing Profile
2.5.1Household Types
Household and family structure are some of the most important demographic indicators. They reveal an areas residential role and function, era of settlement and provide key insights into the level of demand for services and facilities as most are related to age and household types’
Analysis of the household/family types in the City of Maroondah in 2016 compared to Greater Melbourne shows that there was a similar proportion of couple families with child(ren) as well as a higher proportion of one-parent families. Overall, 34.7% of total families were couple families with child(ren), and 11.0% were one-parent families, compared with 33.5% and 10.1% respectively for Greater Melbourne.
There was a lower proportion of lone person households and a higher proportion of couples without children. Overall, the proportion of lone person households was 23.3% compared to 22.0% in Greater Melbourne while the proportion of couples without children was 23.8% compared to 22.9% in Greater Melbourne. (id. The Population Experts 2016)
Table 4: Maroondah Household Types, 2016City of Maroondah - Total households 2016 2011 Change
Households by type Number % Greater Melbourne % Number % Greater
Melbourne %2011 to
2016Couples with children 14,332 34.7 33.5 13,323 34.0 33.6 +1,009
Couples without children 9,854 23.8 22.9 9,507 24.2 23.5 +347
One parent families 4,544 11.0 10.1 4,545 11.6 10.4 -1Other families 448 1.1 1.4 432 1.1 1.4 +16Group household 1,141 2.8 4.7 1,087 2.8 4.5 +54Lone person 9,643 23.3 22.0 9,489 24.2 22.3 +154Other not classifiable household
1,205 2.9 4.5 638 1.6 3.4 +567
Visitor only households 194 0.5 0.9 214 0.5 0.9 -20
Total households 41,361 100.0 100.0 39,235 100.0 100.0 +2,126Source: Australian Bureau of Statistics, Census of Population and Housing 2011 and 2016. Compiled and presented in profile.id by .id, the population experts.(Enumerated data), August 2017.
Table 5: Maroondah Forecast Household Types, 2016
13

Maroondah City 2016 2026 2036 Change between 2016 and 2036
Type Number % Number % Number % NumberCouple families with dependents 14,429 33.0 15,372 31.6 16,393 30.9 +1,964
Couples without dependents 11,228 25.7 12,764 26.2 13,887 26.2 +2,659
Group households 1,252 2.9 1,398 2.9 1,533 2.9 +281
Lone person households 11,021 25.2 12,746 26.2 14,225 26.8 +3,204
One parent family 4,948 11.3 5,531 11.4 6,066 11.4 +1,118
Other families 786 1.8 868 1.8 944 1.8 +158Source: Population and household forecasts, 2011 to 2036, prepared by .id , the population experts, 2015.
In 2016, the dominant household type in the Maroondah City was Couple families with dependents, which accounted for 34.7% of all households.
The largest forecast increase between 2016 and 2026 is forecast to Lone Person households, which will increase by 1,725 households and account for 26.2% of all households. (id. The Population Experts 2011)
It is also very important to note that by 2026, Couples without dependent households are forecast to have increased by 1,536 to account for 25.7% of all households.
2.5.2Housing TenureAnalysis of the housing tenure of the population in Maroondah in 2011 compared to Greater Melbourne shows that there was a larger proportion of households who owned their dwelling (31.7%); a larger proportions purchasing their dwelling (39.4%); and a smaller proportion who were renters (23.2%), Greater Melbourne’s figures being 29.0%, 34.3% and 28.8% respectively.
Table 6: Maroondah Housing Tenure, 2016City of Maroondah - Households (Enumerated)
2016 2011 Change
Tenure type Number % Greater Melbourne % Number % Greater
Melbourne %2011 to
2016Fully owned 13,099 31.7 29.0 13,031 33.2 31.5 +68Mortgage 16,274 39.4 34.3 15,906 40.5 35.3 +368Renting 9,605 23.2 28.8 8,616 22.0 26.5 +989Renting - Social housing 1,047 2.5 2.6 1,104 2.8 2.9 -57
Renting - Private 8,441 20.4 25.8 7,364 18.8 23.1 +1,077Renting - Not stated 117 0.3 0.4 148 0.4 0.5 -31Other tenure type 258 0.6 0.8 227 0.6 0.7 +31Not stated 2,118 5.1 7.1 1,457 3.7 5.9 +661
Total households 41,354 100.0 100.0 39,237 100.0 100.0 +2,117Source: Australian Bureau of Statistics, Census of Population and Housing 2011 and 2016. Compiled and presented in profile.id by .id, the population experts.(Enumerated data), August 2017.
The number of persons in non-private dwellings in Maroondah in 2016 is estimated at 1,761. This is expected to increase to 1,952 in 2026 and then 2,202 persons in 2036.
14

Between 2016 and 2036, Ringwood is forecast to experience the greatest change, with a gain of 140 persons in non-private dwellings, followed by Croydon North (50 persons) and Ringwood North (37 persons). This is due to an increase of persons aged 75 years and over, in non-private dwellings, which will predominantly be aged care.
2.5.3Maroondah Housing Stress, 2011
Housing stress is defined as per the NATSEM (National Centre for Social and economic Modeling) model as households in the lowest 40% of incomes who are paying more than 30% of their usual gross weekly income on housing costs.
In 2011, 9.5% of Maroondah households, were experiencing housing stress compared to 10.7% in greater Melbourne.
While Maroondah had a lower proportion of households experiencing stress, it is important to note that this varied across the municipality. Proportions ranged from a low 5.3% in Warranwood to a high of 22.1% in Ringwood Metropolitan Activity Centre. The five areas with the highest percentages were:Ringwood Metropolitan Activity centre (22.1%) Croydon town centre (16.2%)Ringwood (12.2%) Kilysyth (11.2%)Bayswater North (10.7%)
Table 7: Maroondah Housing stress, 2011City of Maroondah - Enumerated
Area Number Total households Percent %Bayswater North 351 3,269 10.7Croydon 976 9,725 10.0Croydon Hills 102 1,721 5.9Croydon North 228 2,616 8.7Croydon South 154 1,660 9.3Heathmont 242 3,355 7.2Kilsyth 72 648 11.2Kilsyth South 62 946 6.6Ringwood 835 6,850 12.2Ringwood East 389 3,850 10.1Ringwood North 198 3,170 6.2Warranwood 77 1,457 5.3Bayswater North Community Renewal Area 234 2,279 10.3Ringwood Metropolitan Activity Centre 154 697 22.1Croydon Town Centre 143 878 16.2City of Maroondah 3,714 39,235 9.5Greater Melbourne 160,510 1,494,633 10.7City of Knox 4,755 53,111 9.0City of Manningham 2,867 39,517 7.3Yarra Ranges Shire 5,152 52,274 9.9Eastern Metropolitan Region 32,494 362,233 9.0Victoria 215,220 2,031,211 10.6Australia 878,404 8,181,750 10.7
Source: Australian Bureau of Statistics, Census of Population and Housing 2011. Compiled and presented in atlas.id by .id, the population experts.
An analysis of the monthly housing loan repayments of households in Maroondah compared to greater Melbourne from the 2016 Census of Population and Housing shows that there was a smaller
15

proportion of households paying high mortgage repayments ($2,600 per month or more), and a larger proportion of households with low mortgage repayments (less than $1000 per month).
Overall, 20.0% of households were paying high mortgage repayments, and 23.3% were paying low repayments, compared with 22.4% and 22.2% respectively in Greater Melbourne.
Analysis of weekly housing rental payments of households in Maroondah compared to greater Melbourne in 2016 shows that there were a smaller proportion of households paying high rental repayments of $450 per week of more (11.4% compared with 23.0%), and a similar proportion of households with low rental payments of less than $250 per week (16.3% compared with 17.0%).
16

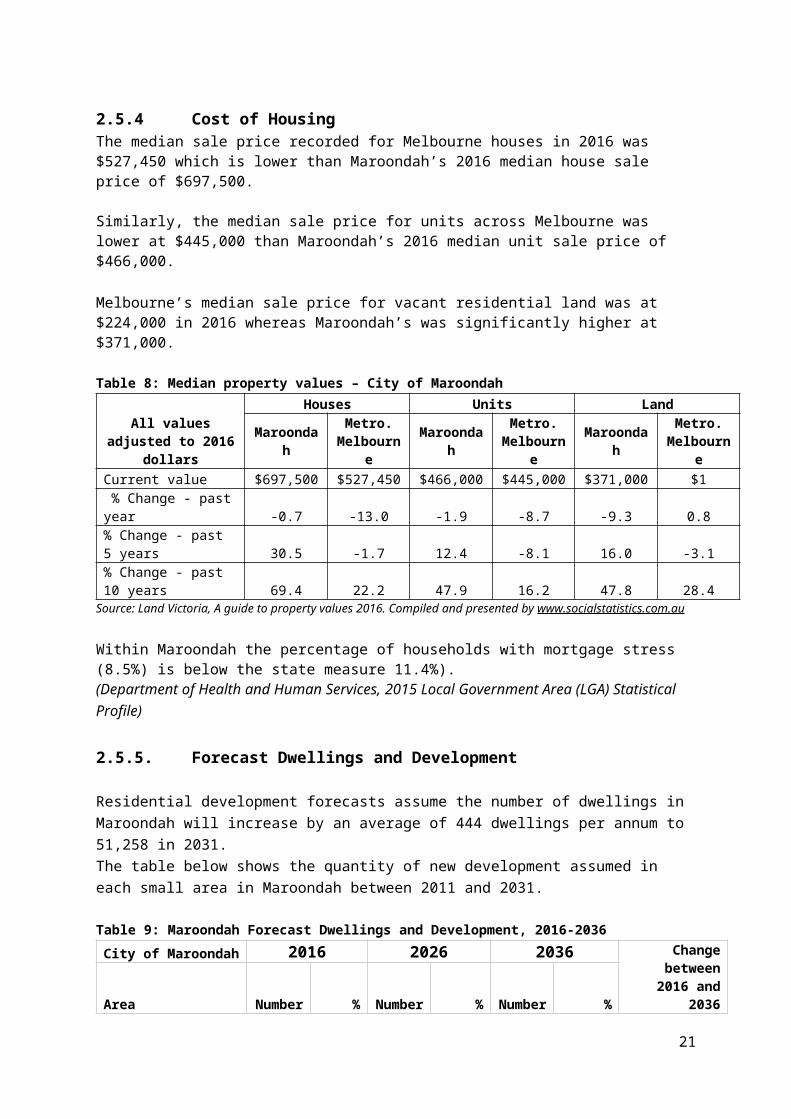
2.5.4Cost of HousingThe median sale price recorded for Melbourne houses in 2016 was $527,450 which is lower than Maroondah’s 2016 median house sale price of $697,500.
Similarly, the median sale price for units across Melbourne was lower at $445,000 than Maroondah’s 2016 median unit sale price of $466,000.
Melbourne’s median sale price for vacant residential land was at $224,000 in 2016 whereas Maroondah’s was significantly higher at $371,000.
Table 8: Median property values – City of Maroondah
All values adjusted to 2016 dollars
Houses Units Land
Maroondah Metro. Melbourne Maroondah Metro.
Melbourne Maroondah Metro. Melbourne
Current value $697,500 $527,450 $466,000 $445,000 $371,000 $1 % Change - past year -0.7 -13.0 -1.9 -8.7 -9.3 0.8% Change - past 5 years 30.5 -1.7 12.4 -8.1 16.0 -3.1% Change - past 10 years 69.4 22.2 47.9 16.2 47.8 28.4
Source: Land Victoria, A guide to property values 2016. Compiled and presented by www.socialstatistics.com.au
Within Maroondah the percentage of households with mortgage stress (8.5%) is below the state measure 11.4%).(Department of Health and Human Services, 2015 Local Government Area (LGA) Statistical Profile)
2.5.5. Forecast Dwellings and Development
Residential development forecasts assume the number of dwellings in Maroondah will increase by an average of 444 dwellings per annum to 51,258 in 2031.The table below shows the quantity of new development assumed in each small area in Maroondah between 2011 and 2031.
Table 9: Maroondah Forecast Dwellings and Development, 2016-2036City of Maroondah 2016 2026 2036 Change between
2016 and 2036Area Number % Number % Number %City of Maroondah 45,105 100.0% 50,371 100.0% 54,953 100.0% +9,848 Bayswater North 3,615 8.0% 3,835 7.6% 4,070 7.4% +455 Croydon 11,835 26.2% 13,398 26.6% 14,745 26.8% +2,910 Croydon Hills 1,840 4.1% 1,881 3.7% 1,960 3.6% +120 Croydon North 2,965 6.6% 3,229 6.4% 3,472 6.3% +507 Croydon South - Kilsyth 2,641 5.9% 2,929 5.8% 3,185 5.8% +544 Heathmont 3,832 8.5% 4,286 8.5% 4,738 8.6% +906 Kilsyth South 986 2.2% 1,038 2.1% 1,114 2.0% +128 Ringwood 7,934 17.6% 9,699 19.3% 10,899 19.8% +2,965 Ringwood East 4,376 9.7% 4,689 9.3% 5,033 9.2% +657 Ringwood North 3,509 7.8% 3,715 7.4% 3,965 7.2% +456 Warranwood 1,572 3.5% 1,672 3.3% 1,772 3.2% +200
Source: Population and household forecasts, 2016 to 2036, prepared by .id the population experts, January 2015.
17

2.5.6Social Housing and Homelessness
‘Secure and affordable housing is fundamental to the wellbeing of Australians. It provides a platform for a range of benefits, including stable employment, connection to the community and a sense of home. Unfortunately, a large number of Australians are not able to access affordable, suitable housing’. (AIHW 2016)
Social housing initiatives are designed to assist in meeting the needs of individuals who do not have access to affordable and suitable housing. The Australian Institute of Health and Welfare define social housing as:
‘rental housing that government or non-government organisations (including not-for-profit organisations) provide to assist people who are unable to access alternative suitable housing options.’ (AIHW 2016)
A selection of key social housing facts for Australia and Maroondah include:
Table 10: Social Housing, Affordable Rent, Homelessness, 2015-2017Australia
817,300 Australians lived in social housing (2015)62% of main tenants are women (2015)200,000 households were on social housing waiting lists (2015)More than half of tenants are older (55+) or children (<14) (2015)MaroondahThere are 1,347 social housing dwellings in Maroondah (2015)Social housing as a % of Maroondah’s total dwellings 3.3% (2015)880 Maroondah dwellings are rented from the government housing authority5,573 households in Maroondah receive rent assistance from the Australian Government (2017)Maroondah’s percentages of social housing and rental housing that is affordable (4.1%) are below the state measures (19.1%), while the median weekly rent ($390) is above the state measure ($340).(2015)Maroondah’s estimated homeless persons, per 1,000 of population 3.9% (2015)
Source/s: Australian Institute of Health and Welfare, Housing Assistance in Australia, 2016, Department of Health and Human Services, 2015 Local Government Area (LGA) Statistical Profile and Population Health Information Development Group (AIHW), Social Health Atlases of Australia: Local Government Areas, 2017, Compiled by Maroondah City Council
2.6 SEIFAThe SEIFA Index of Disadvantage measures the relative level of socio-economic disadvantage based on a range of Census characteristics. It is a good place to start to get a general view of the relative
18

level of disadvantage in one area compared to others and is used to advocate for an area based on its level of disadvantage. At the time of publication, no information was yet available on SEIFA data arising from the 2016 Census of Population and Housing.
The index is derived from attributes that reflect disadvantage such as low income, low educational attainment, high unemployment, and jobs in relatively unskilled occupations. When targeting services to disadvantaged communities, it is important to also look at these underlying characteristics as they can differ markedly between areas with similar SEIFA scores and shed light on the type of disadvantage being experienced.
A higher score on the index means a lower level of disadvantage. A lower score on the index means a higher level of disadvantage. (.id The Population Experts)
Table 11: Index of Relative Socio-economic Disadvantage, 2011City of Maroondah's small areas and benchmark areas
Area 2011 index PercentileWarranwood 1,109.2 97Croydon Hills 1,098.7 95Ringwood North 1,094.1 94Kilsyth South 1,080.5 89City of Manningham 1,071.4 85Croydon North 1,071.2 85Heathmont 1,069.2 84Eastern Metropolitan Region 1,056.8 78City of Knox 1,049.3 74Croydon South 1,044.5 71City of Maroondah 1,043.9 71Yarra Ranges Shire 1,037.1 67Ringwood East 1,036.3 67Greater Melbourne 1,020.3 57Croydon 1,017.4 56Bayswater North 1,011.1 52Bayswater North Community Renewal Area 1,010.8 52Victoria 1,009.6 51Ringwood 1,008.2 50Australia 1,002.0 47Kilsyth 995.7 43Croydon Activity Centre 954.0 26Ringwood Metropolitan Activity Centre 919.0 15
Source: Australian Bureau of Statistics, Census of Population and Housing (opens a new window) 2011. Compiled and presented in profile.id by .id (opens a new window) , the population experts.
In 2011, the level of relative socio-economic disadvantage in Maroondah is lower than the state average. Warranwood had the lowest level of disadvantage in the City of Maroondah.
The five areas with Maroondah with the highest level of disadvantage are: Ringwood Metropolitan Activity Centre Croydon Activity Square
19

Kilsyth Ringwood Bayswater North
20
2.7 Education, Employment and Income
2.7.1EducationEducational Qualifications in this context relates to education outside of primary and secondary school and together with workforce participation rates are highly significant indicators of socio-economic status. At the time of publication, no information was yet available on post-secondary school qualifications arising from the 2016 Census of Population and Housing.
In 2011, 24,964 people in Maroondah, aged 15 and over, had a tertiary qualification (48.8%), which is a higher proportion in comparison to Greater Melbourne at 47.3%, whilst the comparison between those with no qualification is very similar at 42.5% and 42.4% respectively.
The table below demonstrates that over a 5 year period there was an increase in the number of individuals with tertiary qualifications and a decrease of individuals with no qualification or not stating qualification level.
Table 12: Maroondah Highest Educational Qualification Achieved, 2011City of Maroondah - Total persons (Usual residence)
2011 2006
Change
Qualification levelNumbe
r%
Greater Melbourne %
Number %Greater
Melbourne %2006 to
2011Bachelor or Higher degree
16,647 19.7 23.6 12,406 15.5 19.6 +4,241
Advanced Diploma or Diploma
8,317 9.9 8.8 7,024 8.8 7.7 41,293
Vocational 16,155 19.2 15.0 14,469 18.1 14.2 +1,686No qualification 35,880 42.5 42.4 36,978 46.3 45.8 -1,098Not stated 7,355 8.7 10.3 8,942 11.2 12.8 -1,587Total persons aged 15+ 84,354 100.0 100.0 79,819 100.0 100.0 +4,535
Source: Australian Bureau of Statistics, Census of Population and Housing 2006 and 2011. Compiled and presented in profile.id by .id, the population experts.(Usual residence data), August 2017.
2.7.2Employment
The level of full or part time employment, unemployment and labour force participation indicate the strength of a local economy, social characteristics of the population and likelihood of inequalities in health and wellbeing outcomes. At the time of publication, no information was yet available on employment and labour force characteristics arising from the 2016 Census of Population and Housing.
In 2011 Maroondah had 52,977 individuals living within the municipality who were employed, of which 59.5% worked full time and 34.4% part time
21

Table 13: Maroondah Employment Status, 2011City of Maroondah - Total persons (Usual residence)
2011 2006
Change
Employment statusNumbe
r%
Greater Melbourne %
Number
%Greater
Melbourne %2006 to
2011Employed 52,977 95.7 94.5 49,355 96.1 94.7 +3,622Employed full-time 32,935 59.5 60.1 31,130 60.6 61.0 +1,805Employed part-time 19,051 34.4 32.3 17,006 33.1 31.0 +2,045Hours worked not stated 991 1.8 2.1 1,219 2.4 2.7 -228Unemployed (Unemployment rate)
2,386 4.3 5.5 1,998 3.9 5.3 +388
Looking for full-time work
1,259 2.3 3.1 1,135 2.2 3.2 +124
Looking for part-time work
1,127 2.0 2.4 863 1.7 2.1 +264
Total Labour Force 55,363 100.0 100.0 51,353 100.0 100.0 +4,010Source: Australian Bureau of Statistics, Census of Population and Housing 2006 and 2011. Compiled and presented in profile.id by .id, the population experts.(Usual residence data), August 2017.
Map 1: Maroondah Unemployment Rate, 2011
22

Analysis of the employment status (as a percentage of the labour force) in Maroondah, in 2011 in comparison with Greater Melbourne, shows that there were a higher proportion in employment and a lower proportion unemployed. Overall, 95.7% of the labour force was employed (62.8% of the population aged 15+), and 4.3% unemployed (2.8% of the population aged 15+), compared with 94.5% and 5.5% respectively for Greater Melbourne.
It also revealed that female labour force participation in Maroondah is 59.6% which is higher than both the Greater Melbourne and Victorian percentage at 56.8% and 55.8% respectively. (Population Health Information Development Group (AIHW), Social Health Atlases of Australia: Local Government Areas, 2017)
Graph 6. Commute to Work, Maroondah, 2011The pie chart below depicts how many workers live locally and how many commute to and from other areas. In 2011, 36.3% of people who lived in Maroondah also worked in the area.
An analysis of employment by industry, in Maroondah 2011, shows that the five most popular industry sectors were;
Health care and social assistance (12.1%) Retail Trade (11.6%) Manufacturing (11.5%) Construction (10.4%) Education & Training (8.5%)
(Australian Bureau of Statistic, Data by Region, Local Government Areas, Maroondah (C), 2011)
23

. Table 14. Maroondah Unpaid Domestic Work, 2016
Hours per week Females Males
< 30 63.5% 67.4%
30+ 13.9% 2.9%
None 16.4% 24.0%
Not stated 6.2% 5.7%
Total 47,058 40281Source: Australian Bureau of Statistics, Census of Population and Housing, 2016, Compiled and by Maroondah City Council, August 2017
In Maroondah males are more likely than females to spend less than 30 hours each week on unpaid domestic work. Males are more likely than females to do no unpaid domestic work during the week. And females are much more likely than males to spend 30 hours our more on unpaid domestic work each week.
2.7.3 Income
Analysis of individual income levels in Maroondah in 2016 compared to Greater Melbourne shows that there was a lower proportion of people earning a high income (those earning $1,750 per week or more) as well as a lower proportion of low income people (those earning less than $500 per week).
Overall, 11.2% of the population earned a high individual income, and 36.5% earned a low income, compared with 11.9% and 37.8% respectively for Greater Melbourne.
Consistent with individual incomes an analysis of household income levels for Maroondah in 2016
compared to Greater Melbourne shows that there was a slightly smaller proportion of high income
households (those earning $2,500 per week or more) and a lower proportion of low income
households (those earning less than $650 per week).
Overall, 22.4% of the households earned a high income and 16.0% were low income households,
compared with 22.9% and 16.7% respectively for Greater Melbourne.
24

Graph 7. Maroondah Weekly Household Income, 2016
Source: Australian Bureau of Statistics, Census of Population and Housing 2016. Compiled and presented by .id , the population experts, August 2017.
Map 2: Maroondah Low Income households, 2011
25

As noted within section 2.6. SEIFA, Maroondah scored 1,043.9 on the SEIFA index of disadvantage therefore reflecting a relatively low level of social-economic disadvantage. However, it must be noted (as demonstrated above on the Low Income Household distribution map) that there are significant pockets of disadvantage within Maroondah and the needs of the residents within these areas need to be accounted for in planning and development schemes.
Table 15. Percentage of Low Income, Welfare-dependent Families (with Children), EMR Comparison, 2014
AREA % Low income, welfare-dependent families (with children)
Boroondara (C) 2.9Knox (C) 7.1Manningham (C) 4.8Maroondah (C) 7.5Monash (C) 5.6Whitehorse (C) 5.3Yarra Ranges (S) 8.1Greater Melbourne 9.1Victoria 9.8
Source: Population Health Information Development Group (AIHW), Social Health Atlases of Australia: Local Government Areas, 2017. Complied by Maroondah City Council
Maroondah has the second highest percentage of low income, welfare dependent families in the EMR.
SummaryKey findings - Population Profile include:
Increase in population requires an integrated planning approach to consider and account for increased demand on infrastructure, housing and services.
The greatest period of population increase is forecast during 2017 -2021 (the lifecycle of the upcoming Maroondah Health and Wellbeing Plan) and consideration must be given to how this will be serviced.
Maroondah has a lower level of young workforce than Greater Melbourne The largest proportional increase to a service age group between 2016 and 2026 is
forecast to be Seniors aged 70 to 84, which is expected to increase from 8.7% to 10.4% of the total population.
Inequality in health outcomes for Indigenous & CALD persons need to be addressed Maroondah’s percentage of humanitarian new settler arrivals (50.8%) is the highest in the
state (9.3%). The percentages of social housing and rental housing that is affordable (4.1%) are below
the state measures (19.1%), Lone person households account for almost a quarter of Maroondah’s dwellings,
highlighting the need for adequate consideration to isolation and social inclusion initiatives.
The five areas with Maroondah with the highest level of disadvantage are: Ringwood Metropolitan Activity Centre Croydon Town Centre Kilsyth Ringwood Bayswater North
26

Setting based initiatives required to target pockets of disadvantage within Maroondah
27

3. Population Health
The study of population health is focused on understanding health and disease in community, and on improving health and well-being through priority health approaches addressing the disparities in health status between social groups.
There are a number of population subgroups who do not enjoy the same level of health as the general population and identified as priority population groups. (Australian Institute of Health and Welfare)
Socioeconomic disadvantage is the greatest cause of health inequality in Victoria and while the greatest relative difference in health status for population groups is between Aboriginal Victorian and non- Aboriginal Victorians, there are also health inequalities between other population groups. (Health and wellbeing status of Victoria, Department of Health and Human Services, 2015)
There are several groups in Australia with worse health than the general population due to a range of environmental and socio-economic factors. These are described as priority population groups for health interventions. They include the following:
Indigenous people People in rural and remote areas Socioeconomically disadvantaged people Veterans Prisoners Overseas born people
There are a number of key indicators to consider in order to identify the population health of Maroondah and which subpopulations form Maroondah’s priority populations.
Self-reported health Avoidable death rate Life expectancy at birth Burden of disease due to risk factors
28

3.1 Self-reported Health
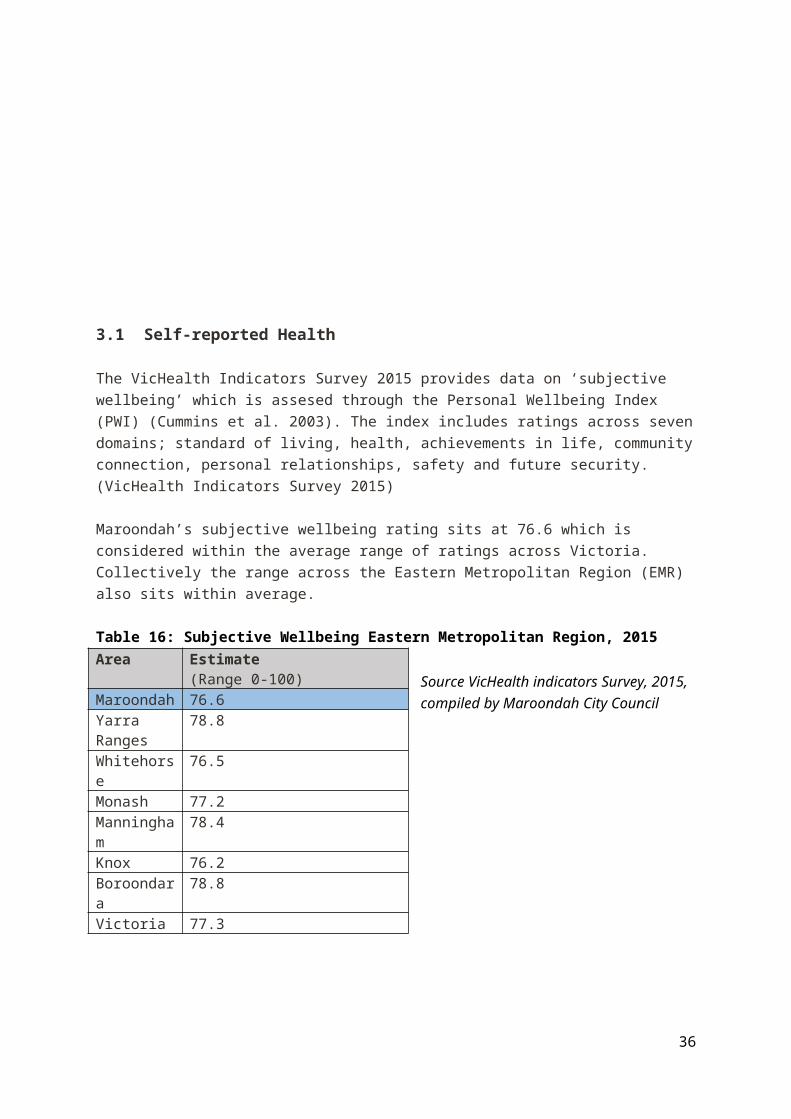
The VicHealth Indicators Survey 2015 provides data on ‘subjective wellbeing’ which is assesed through the Personal Wellbeing Index (PWI) (Cummins et al. 2003). The index includes ratings across seven domains; standard of living, health, achievements in life, community connection, personal relationships, safety and future security. (VicHealth Indicators Survey 2015)
Maroondah’s subjective wellbeing rating sits at 76.6 which is considered within the average range of ratings across Victoria. Collectively the range across the Eastern Metropolitan Region (EMR) also sits within average.
Table 16: Subjective Wellbeing Eastern Metropolitan Region, 2015
Source VicHealth indicators Survey, 2015, compiled by Maroondah City Council
29
Area Estimate(Range 0-100)
Maroondah 76.6Yarra Ranges 78.8Whitehorse 76.5Monash 77.2Manningham 78.4Knox 76.2Boroondara 78.8Victoria 77.3

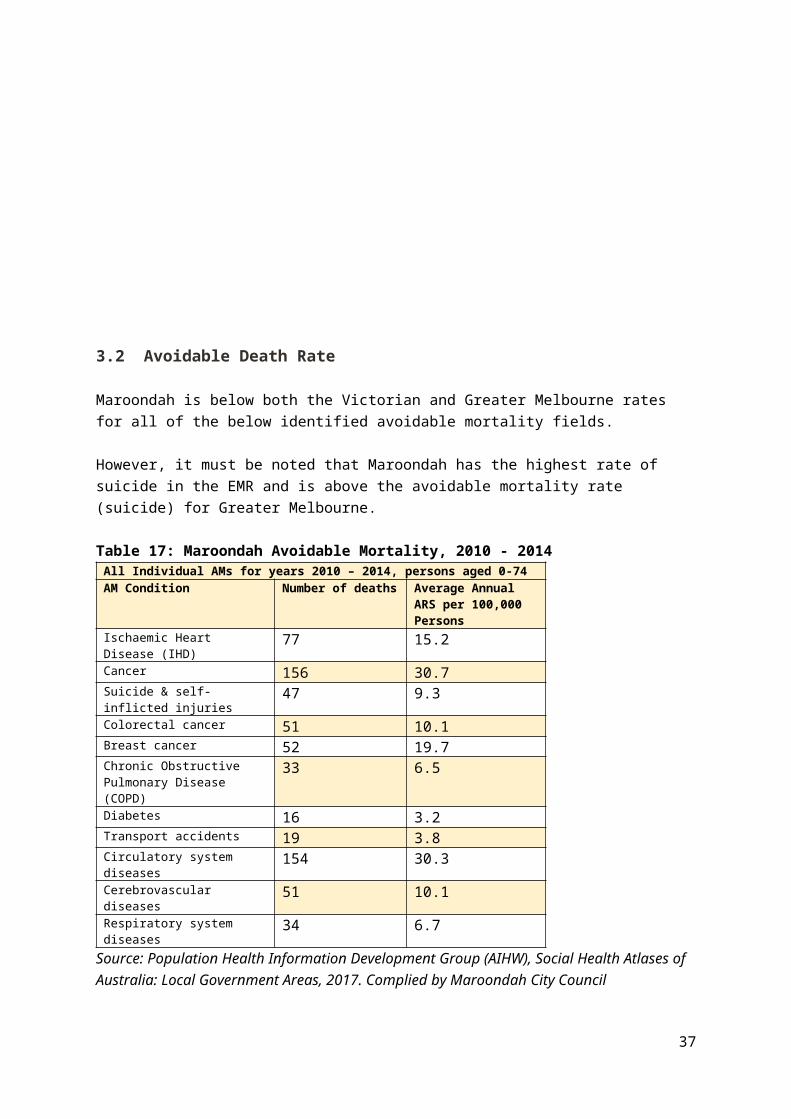
3.2 Avoidable Death Rate
Maroondah is below both the Victorian and Greater Melbourne rates for all of the below identified avoidable mortality fields.
However, it must be noted that Maroondah has the highest rate of suicide in the EMR and is above the avoidable mortality rate (suicide) for Greater Melbourne.
Table 17: Maroondah Avoidable Mortality, 2010 - 2014All Individual AMs for years 2010 – 2014, persons aged 0-74AM Condition Number of
deathsAverage Annual ARS per 100,000 Persons
Ischaemic Heart Disease (IHD)
77 15.2
Cancer 156 30.7Suicide & self-inflicted injuries
47 9.3
Colorectal cancer 51 10.1Breast cancer 52 19.7Chronic Obstructive Pulmonary Disease (COPD)
33 6.5
Diabetes 16 3.2Transport accidents 19 3.8Circulatory system diseases
154 30.3
Cerebrovascular diseases 51 10.1Respiratory system diseases
34 6.7
Source: Population Health Information Development Group (AIHW), Social Health Atlases of Australia: Local Government Areas, 2017. Complied by Maroondah City Council
Table 18: Avoidable Mortality Rate, Suicide and self-inflicted injury 2010-2014, EMR ComparisonAREA Average Annual ARS per
100,000 Persons, 0-74 years
Maroondah (C) 9.3Boroondara (C) 7.0Knox (C) 9.0Manningham (C) 6.4Monash (C) 5.4Whitehorse (C) 7.1Yarra Ranges (S) 9.2Victoria 9.6Greater Melbourne 8.6
Source: Population Health Information Development Group (AIHW), Social Health Atlases of Australia: Local Government Areas, 2017. Complied by Maroondah City Council
30

3.3 Life Expectancy at Birth
Table 19. Life Expectancy, 2007Life Expectancy at Birth (years)
Female MaleMaroondah 84.8 80.6EMR 85.5 80.1Vic 84.5 80.4
Source: Department. Health & Human Services, Health Atlas, 2014
Maroondah’s life expectancy for both females and males is higher than the Victorian average, however is lower than then the EMR average for males and higher than the EMR average for females.
3.4 Burden of Disease
The 2001, Department of Health and Human Services Victorian Burden of Disease Study, provides a comprehensive assessment of the health status of the Victorian population. It quantifies the contribution to the ‘burden of disease’ of mortality, disability, impairment, illness and injury arising, from 176 diseases, injuries and risk factors in a single indicator, the Disability-Adjusted Life Year or DALY. The burden of disease, therefore, is a measurement of the gap between current health status and an ideal situation where everyone lives into old age free of disease and disability. (Department of Health and Human Services, 2001, Victorian Burden of Disease Study).
The top 10 causes of years lost due to ill health, disability or death for males and females in Maroondah are as follows
Table 20. DISABILITY ADJUSTED LIFE YEARS (DALY), 2001 AND TOP 10 CAUSESAdjusted Life Years (DALY), Maroondah, 2001 Female Male Person
Cancer colon/rectum 159 176.7 335.7
Cancer lung 168.7 253.2 421.9
Cancer breast 338.1 1.5 339.6
Diabetes mellitus-NIDDM 222.1 301.9 524
Depression 343.3 336.8 680.1
Dementia 309.2 189.2 498.4
Ischaemic heart disease 492.3 614.3 1106.6
Stroke 387.2 273.5 660.7
COPD (emphysema and chronic bronchitis) 171 213.9 385
Asthma 161.3 171.8 333.1
Source: DHHS Victorian Health Information Surveillance System (VHISS), compiled by Maroondah City Council
31

3.5. Lifecourse
Lifecourse must also be considered when planning for our community. The following research details outcomes across a range of health and wellbeing indicators for:
Infants and Children Young people Older adults and disability
3.5.1 Infants and children
In 2010 Australia saw a record number of 297,900 births registered, with a fertility rate of 1.89 births per woman. Women continue to delay child birth with the median age being 30.7 years, up from 28.3 years in1990. Noteworthy is the decline in fertility rates of teenagers from 22 babies per 1000 teenage females in 1990 to 15.5 in 2010.
This is contrasted with a tripling of fertility rates for women in the 40 44 age range, rising from‐5.5 babies per 1000 women in 1990 to 14.8 babies in 2010.There is increasing demand for Assisted Reproduction Treatment (ART) in Australia, with 65,180 treatment cycles in 2010, up from 35,810 in 2005. Of these treatments, 17.2% resulted in live births, with 8.2% of these being multiple births and 48.2% resulting in deliveries by caesarean section. The average age of ART assisted mothers was 35.8 years.
Whilst the EMR holds about 20% of Victorian residents, it contributed 15.7% of Victorian births in 2011. Within the EMR, Whitehorse had the largest proportion of births, with 2.62% of Victorian births, and Manningham had the smallest with 1.44%. The number of new mothers in 2007 aged under 20 ranged from 1 for Boroondara (contributing 0.1% to births to women under 20) to 48 for Yarra Ranges (2.6%).Mothers aged 30 years and older comprised 70% of all births during 2007 and 2008 in the EMR, with the majority being born to mothers aged 30 34 years (39%). Mothers 40‐ years + were significantly higher at 5% than mothers under 20 years at 1.2%. This reflects the National data trend.(Women’s Health East Women’s Sexual & Reproductive Health Fact Sheet, 2014)
In 2011, Maroondah had a total number of 1,394 births and a total of fertility rate of 1.88% which is the second highest in the EMR, behind Yarra Ranges (1.94%) and higher than the Victorian rate (1.8). Population Health Information Development Group (AIHW), Social Health Atlases of Australia: Local Government Areas, 2017.
Table 21. Maroondah Fertility Rate, 2015_________________________________________________________________________________
LGA measure LGA rank State measureTotal fertility rate 1.9 60 1.8Teenage fertility rate 6.0 51 10.4__________________________________________________________________________________Source: Department of Health and Human Services, 2015 Local Government Area (LGA) Statistical Profile
32

Table 22. Antenatal Smoking, Low Birthweight & Breastfeeding, 2017AREA % fully breastfed at 3
months(modelled estimates)
% low birth weight babies
% smoking during pregnancy
Maroondah (C) 68.3 6.2 8.1Knox (C) 70.1 6.2 11.0Manningham (C) 66.6 6.0 4.0Monash (C) 68.2 6.4 5.7Whitehorse (C) 68.3 5.6 4.4Yarra Ranges (S) 66.5 5.3 13.7Victoria 63.4 6.3 15.0Greater Melbourne 63.7 6.3 11.2
Source: Population Health Information Development Group (AIHW), Social Health Atlases of Australia: Local Government Areas, 2017, compiled by Maroondah City Council
Maroondah has the third highest percentage of persons smoking during pregnancy in the EMR however was below both the Greater Melbourne and Victorian percentages.
Maroondah has the equal second highest percentage of low birth weight babies in the EMR, equal to Knox. However, again this was lower than both the Greater Melbourne and Victorian percentages.
Table 23. Children and Young Person Characteristics, 2015Characteristic LGA measure State measureBabies with low birth weight 6.3% 6.6%Infants fully breastfed at 3 months 56.6% 51.8%Children fully immunised between 24 and 27 months
89.6% 90.5%
Children attending 3.5 year old maternal and child health checks
66.9% 66.1%
Kindergarten participation 95.4% 98.1%Children with kindergarten fee subsidy 21.6% 26.8%Children with emotional or behavioural problems at school entry
4.1% 4.6%
Children with speech or language problems at school entry
15.2% 14.2%
Children developmentally vulnerable in one or more domains
14.7% 19.5%
Children developmentally vulnerable in two or more domains
5.7% 9.5%
Source: Department of Health and Human Services, 2015 Local Government Area (LGA) Statistical Profile
33

3.5.2Young people
Youth is a crucial period for establishing positive health and social behaviours. It is a time when young people are undergoing rapid emotional, physical and intellectual changes, and when they begin the transition from childhood to adolescence to independent adulthood.
Timely, accurate and comprehensive information on the health and wellbeing of young people is therefore essential. (Australian Institute of Health and Welfare, Youth Health and Wellbeing)
Table 24: Key Statistics for 12-25 year olds in the City of Maroondah
2011 2006
Number
% of 12 to 25 year olds in Maroondah
Number % of 12 to 25 year olds in Maroondah
Total population of young people 12-25
18,592 100 18,450 100
Males 9,546 51.3 9,403 51.0
Females 9,046 48.7 9,047 49.0
Born in non-English speaking country
1,520 4.1 1,017 2.8
Speaks language other than English at home
1,951 5.2 1,421 3.9
Tertiary (University and TAFE)
3,984 21.4 3,385 18.3
University 2,046 13.9 1,814 12.6
Other post-school 2,127 14.5 1,911 13.2
No qualification 9,564 65.1 9,457 65.4
Unemployed 968 9.4 800 7.9
Source: ID Consulting: profile.id, 2011, Maroondah Youth Profile 2016
34

Table 25: Youth Wellbeing Indicators, Maroondah 2010Indicator Maroondah
(C)EMR VIC
Physical health & wellbeing % % %Proportion of adolescents who eat the minimum recommended serves of fruit and vegetables every day
17.5 20.4 19.0
Proportion of adolescents who describe themselves as having good health
90.5 90.5 89.2
Proportion of adolescents who do the recommended amount of physical activity every day
14.9 12.3 12.3
Proportion of adolescents who use electronic media for more than two hours per day
53.3 59.3 58.7
Behaviour & mental healthProportion of adolescents with the highest level of psychological distress
13.1 14.1 13.0
Proportion of adolescents who reported being recently bullied
42.7 44.4 44.6
Proportion of adolescents who have positive psychological development
71.5 64.1 61.1
LearningPercentage of Year 9 students at or above the national minimum standard for reading
95.1 96.0 93.0
Percentage of Year 9 students at or above the national minimum standard for numeracy
96.6 96.9 94.4
Year 12 or equivalent attainment rates at age 19 82.7 87.2 79.8SafetyNumber of adolescents in Maroondah and Victoria who were victims of crime against the person
10.7Rate per 1000 adolescents
11.1Rate per 1000 adolescents
Crime against the person in Maroondah and Victoria where the offender was an adolescent
10.9Rate per 1000 adolescents
12.5Rate per 1000 adolescents
LifestyleProportion of adolescents, aged 15-17 years who have ever used marijuana, 2009.
26.3 16.0
Proportion of adolescents, aged 15-17years, who drank alcohol in the last 30 days
58.3% 50.6%
Proportion of adolescents aged 15-17years, who smoked cigarettes in the last 30 days
25.5% 18.4%
Proportion of sexually active adolescents who practice safe sex by using a condom
63.7 55.6 58.1
Proportion of adolescents who have a trusted adult in their life in Maroondah,
73.8 71.8 70.8
Source: ID: Department of Education and Early Childhood Development, Adolescent Community Profile, City of Maroondah,2010
35
In 2009, 14.9 per cent of adolescents surveyed in Maroondah did the recommended amount of physical activity every day. This was higher than the proportion reported across Eastern Metropolitan Region (12.3 per cent), with the difference being non significant.
In 2009, 71.5 per cent of adolescents surveyed in Maroondah had positive psychological development. This was higher than the proportion reported across Eastern Metropolitan Region (64.1 per cent), with the difference being non significant.
In 2010, 95.1 per cent of Year 9 students in Maroondah were at or above the NMS in reading. This was lower than the percentage in the Eastern Metropolitan region (95.4 per cent) and higher than the percentage across Victoria (92.3 per cent)
In Maroondah, 26.3 per cent of 15 to 17 year olds had used marijuana in their lifetime, which was higher than, but not significantly different to the proportion in Victoria (16.0 per cent).
In 2009, 63.7 per cent of sexually active adolescents surveyed in Maroondah reported that they practiced safe sex by using a condom. This was significantly higher than that reported in Eastern Metropolitan Region (55.6 per cent) and higher than, but not significantly different to that reported across Victoria (58.1 per cent). (Department of Education and Early Childhood Development, Adolescent Community Profile, City of Maroondah,2010)
3.5.3Older adults and disability
According to the Australian Bureau of Statistics (ABS) on the night of the Census 2011,
Maroondah’s population aged 60+ was higher than the metropolitan average. Maroondah had the highest proportion of persons aged 85+ in the Eastern Metropolitan
Region The largest age group in Maroondah was in the 40-44 year olds which accounted for 7.4% of
the total population(Maroondah City Council Active & Healthy Ageing Initiative, Towards an Age-friendly Maroondah, 2015-202)
It is estimated that the number of people aged over 65 years in the EMR in 2015 was 180,407, or 16.5% of the total EMR population, compared with an estimated 15.1% of the Victorian population. Based on population forecasts, it is expected that this will increase to 22.5% for the EMR catchment by 2025, compared to an estimated 17.5% in Victoria (Public Health Information Development Unit, 2015).
In addition, the EMR is currently ranked 3rd out of 8 regions in Victoria for the prevalence of dementia and is forecasted to have the 3rd highest prevalence in 2050(National Centre for Social and Economic Modelling, 2016b).
In 2016, five of the EMR’s LGAs were ranked in the top 15 for the prevalence of dementia (National Centre for Social and Economic Modelling, 2016a). Maroondah is ranked lowest in the EMR for estimated number of people with dementia in 2016 and forecast for 2050. (Inner East Primary Care Partnership, Health and Wellbeing Needs of Older People Living in the Eastern Region of Melbourne, 2017)
36
Planning adequately for the strengths and challenges an ageing population presents is essential According to the World Health Organisation (WHO) there are eight age-friendly domains that influence the health and quality of life of people as they age:
1. Outdoor spaces and buildings2. Transportation3. Housing4. Social participation5. Respect and social inclusion6. Civic participation and employment7. Communication and Information8. Community support and health services
The following data provides insights into Maroondah’s aging population.
Graph 8: ABS 2014 ERP Persons aged 60+ years, EMR
Boroondara Manningham Monash Whitehorse Knox Maroondah Yarra Ranges
9.8%
11.8%
9.5% 9.5%
10.8%10.0%
11.5%
5.9%
9.3%
7.5% 7.2%
5.9% 6.2% 5.8%4.9% 5.2% 5.1% 5.6%
3.5%4.3%
3.2%
60-69 70-79 80+
Source: Inner East Primary Care Partnership, Health and Wellbeing Needs of Older People Living in the Eastern Region of Melbourne, 2017
37

Graph 9: Self-Assessed Health Status Fair/Poor self-reported Health Status
Boroondara Manningham Monash Whitehorse Knox Maroondah Yarra Ranges
14%
18%
22%
28%
24%
21%
15%15%
26%
22%
18%
21%
17%
24%
15%
34%
29%
19% 20%
33%
13%
18% 17%19%
21%
17%19% 18%
60-69 70-79 80+ Average 18+
Source: Inner East Primary Care Partnership, Health and Wellbeing Needs of Older People Living in the Eastern Region of Melbourne, 2017
Graph 10: Aged Pension Recipients, Rate per 1,000
Eastern
Yarra Ranges
Maroondah
Knox
Outer East
Whitehorse
Monash
Manningham
Boroondara
Inner East
631
704
683
719
704
619
630
554
369
547
Source: Inner East Primary Care Partnership, Health and Wellbeing Needs of Older People Living in the Eastern Region of Melbourne, 2017
38

Graph 11: Projected % of population that needs assistance with 3 or more activities in 2015
Boroondara Manningham Monash Whitehorse Knox Maroondah Yarra Ranges
16% 16%19% 20% 19% 19%
16%
21% 20%23% 24% 25% 25%
22%
34%35%
39% 39%42% 41%
39%
65 years plus 70 years plus 80 years plus
Source: Inner East Primary Care Partnership, Health and Wellbeing Needs of Older People Living in the Eastern Region of Melbourne, 2017
Graph 12: Percentage of EMR Population aged 75+ living alone
Boroondara Manningham Monash Whitehorse Knox Maroondah Yarra Ranges
38.9%
26.7%29.7%
37.0%33.8%
39.0%33.8%
79.0% 76.8% 74.7% 77.4% 75.3% 75.8%72.7%
Percentage of total population aged 75+ living alone Percentage of females aged 75+ living alone
Source: Inner East Primary Care Partnership, Health and Wellbeing Needs of Older People Living in the Eastern Region of Melbourne, 2017
39

Graph 13. Percentage of persons aged 65+ that provided unpaid assistance 2011, EMR
Boroondara Manningham Monash Whitehorse Knox Maroondah Yarra Ranges
19%17%
16%17%
16%17%
16%
13% 13%12% 12%
11% 11% 11%
8% 8% 8% 8%6% 6% 6%
60-69 years 70-79 years 80 years plus
Source: Inner East Primary Care Partnership, Health and Wellbeing Needs of Older People Living in the Eastern Region of Melbourne, 2017
Graph 14. Elder Abuse EMR, rate per 1000 people
Boroondara Manningham Monash Whitehorse Knox Maroondah Yarra Ranges
2.2
2.73.0
2.4
3.53.7
3.1
1.2 1.4
2.22.0
2.72.5
1.21.0
1.9
1.5 1.5
2.0
0.6 0.7
60-69 70-79 80+
Source: Inner East Primary Care Partnership, Health and Wellbeing Needs of Older People Living in the Eastern Region of Melbourne, 2017
Maroondah has the highest rate in the EMR of persons aged 60-69 years experiencing elder abuse and the second highest rate of person 70-79 years experiencing elder abuse.
40

Table 26. Percentage of Population with a severe and profound disability living in the community who are 65 years plus Percentage
AREA Percentage of People 65+ with severe and profound disability living in the community
Inner East 12.10%Boroondara 10.90%Manningham 12.10%Monash 13.20%Whitehorse 12.00%Outer East 11.30%Knox 12.60%Maroondah 10.50%Yarra Ranges 10.60%EMR 11.80%Victoria 13.70
Source: Inner East Primary Care Partnership, Health and Wellbeing Needs of Older People Living in the Eastern Region of Melbourne, 2017
Graph 15. Percentage of persons aged 60+ years who volunteer, Maroondah 2011
Boroondara Manningham Monash Whitehorse Knox Maroondah Yarra Ranges
27%
20% 19%
24%
18%
21%24%
26%
19% 19%
24%
18%
23%21%
14%
10% 11%
15%
10%11% 11%
5%3% 4%
5% 4% 3% 3%
60-69 years 70-79 years 80-89 years 90 yrs plus
Source: Inner East Primary Care Partnership, Health and Wellbeing Needs of Older People Living in the Eastern Region of Melbourne, 2017
41

Graph 16. Estimated number of people with dementia in 2016 and 2050 by LGA
Source: Inner East Primary Care Partnership, Health and Wellbeing Needs of Older People Living in the Eastern Region of Melbourne, 2017
There will be an estimated increase of 4,160 persons, in Maroondah, with dementia between the years of 2016 1nd 2050.
Table 27. Percentage of people with a profound or severe disability (includes people in long-term accommodation), All ages, EMR, 2011
AREA % of people with a profound or severe disability (includes people in long-term accommodation), All ages, EMR, 2011
Maroondah (C) 4.6Knox (C) 4.2Manningham (C) 4.5Monash (C) 4.6Whitehorse (C) 4.3Yarra Ranges (S) 3.8Victoria 4.7Greater Melbourne 4.5
Source: Population Health Information Development Group (AIHW), Social Health Atlases of Australia: Local Government Areas, 2017, compiled by Maroondah City Council
Maroondah and Monash have the equal highest percentage of people with a profound or severe disability in the EMR. Accessibility, inclusiveness, and adequate service provision is required in planning for beneficial health and wellbeing outcomes for this cohort.
42

3.6 Modifiable Risk Factors Contributing to Chronic Disease
The Victorian Population Health Survey has been conducted annually, by the Department of Health and Human Services, since 2001.The aim of the survey is to provide quality, timely indicators of population health to inform evidence-based policy development and strategic planning across Victoria.
The following information details the survey’s findings for modifiable risk factors which contribute to chronic disease in Maroondah, the EMR and Victoria.
Information is presented on modifiable risk factors which include physical inactivity, smoking prevalence, alcohol consumption, fruit and vegetable intake, intake of sugar-sweetened drinks, overweight and obesity, hypertension and psychological distress.
Table 28. Modifiable Risk Factors, EMR 2014Modifiable Risk Factors (point estimate %) SES
Area Obese(BMI>_30kg/m2)
Sedentary behaviour
Met NHMRC vegetable consumption guidelines
Met NHMRCFruit consumption guidelines
Daily consumer of sugar sweetened soft drinks
Current smoker
At Increased risk of alcohol related harm on a single occasion, either yearly, monthly or weekly
High, or very high level of psychological distress
Total annual household income <$40,000.00
EMR 15.1 3.6 6.0 48.1 9.8 9.8 42.0 11.6 12.9Boroondara (C) 12.5 3.2 5.8 44.7 5.2 7.2 48.8 10.5 7.8Knox (C) 18.2 3.1 3.4 48.9 8.5 13.3 37.4 7.2 17.4Manningham (C) 13.9 4.2 9.0 52.5 8.2 8.8 36.1 8.7 11.1Maroondah (C) 16.7 2.5 6.3 46.8 21.4 13.4 48.7 15.0 17.0Monash (C) 14.4 5.2 5.7 46.5 10.2 10.8 36.7 12.6 12.8Whitehorse (C) 14.7 3.5 6.8 54.3 7.3 5.2 43.5 8.5 11.5Yarra Ranges (S) 16.4 16.4 5.7 43.9 10.7 8.9 44.8 20.0 13.7Victoria 18.8 3.6 6.4 47.8 11.2 13.1 42.5 12.6 18.7
Estimates that are (statistically) significantly different to the corresponding estimate for Victoria are identified by colours as follows above or belowSource: Department of Health and Human Services, Victorian Population Health Survey 2014, Modifiable risk factors contributing to chronic disease in Victoria. Complied by Maroondah City Council
43

3.6.1Healthy Eating
The weight of epidemiological evidence shows that consumption of sugar-sweetened soft drinks has significantly contributed to the obesityepidemic (Malik, Schulze & Hu 2006; Vartanian, Schwartz & Brownell 2007; Woodward-Lopez, Kao & Ritchis 2011).
Recent public health interest has focused on the associations between consumption of added sugars and adverse health outcomes. The consumption of sugar-sweetened beverages is not only associated with weight gain but also with increased risk of other health problems such as dental caries, high blood pressure, type 2 diabetes and cardiovascular disease. (Department of Health and Human Services, Victorian Population Health Survey 2014, Modifiable risk factors contributing to chronic disease in Victoria.)
Maroondah has a significantly higher estimate to both the EMR and Victoria for persons consuming sugar sweetened soft drinks daily.
Maroondah residents ate an average of 2.5 serves of vegetables per day, which is significantly higher than the Victorian average of 2.2. Maroondah residents reported eating an average of 1.6 serves of fruit each day, which is the same as the Victorian average. On average, Maroondah residents drank 5.3 cups of water per day. This is similar to the Victorian average of 5.4. (Vic Health, VicHealth Indicators Survey 2015 Results)
44

3.6.2Mental Wellbeing
The percentage of people reporting fair or poor health status is below the state measure, and the percentage of people reporting high/very high psychological distress is above the state measure.
Additionally, Maroondah has the second highest rate of hospital admissions for mental health related causes in the EMR and a higher rate than both Greater Melbourne and Victoria.
Table 29. Hospital Admissions for Mental Health Related Conditions,2012/2013AREA Mental Health Related
Admissions, all hospitals ASR per 100,000
Boroondara (C) 1, 852.3Knox (C) 1, 917.4Manningham (C) 1, 280.6Maroondah (C) 1, 946.9Monash (C) 1, 1719.5Whitehorse (C) 2, 484.1Yarra Ranges (S) 1, 317.4Greater Melbourne 1, 363.4Victoria 1, 271.2
Source: Population Health Information Development Group (AIHW), Social Health Atlases of Australia: Local Government Areas, 2017, compiled by Maroondah City Council
45

3.6.3Physical Activity Table 30. Physical Activity Indicators, Maroondah, 2015
Source: Vic Health, VicHealth Indicators Survey 2015 Results
46

Maroondah City Council plays an integral role in the provision and facilitation of physical activity opportunities through both the provision of services and infrastructure and the strategic planning and development of environments that support Active Living . (Maroondah City Council, Physical Activity Strategy 2015-2020)
Compared to all Victorians, a similar proportion of Maroondah residents engaged in no physical activity during the week (14.4%, Victoria = 18.9%).
A similar proportion of Maroondah residents engaged in physical activity four or more days per week compared with the Victorian estimate (40.2%, Victoria = 41.3%). The three most popular non-organised physical activities in Maroondah were walking (51.7%), cycling (13.2%), and gym or fitness (11.6%). (Vic Health, VicHealth Indicators Survey 2015 Results)
47

3.7 Sexual & Reproductive Health
In 2014 and 2015 Women’s Health East lead a regional needs analysis in the Eastern Metropolitan Region (EMR) to identify barriers for women in achieving optimal Sexual and Reproductive Health (SRH).
Analysis of the evidence, demographic data and consultation findings revealed that within the EMR, women who were most likely to experience SRH inequities included young women, those from migrant, newly arrived and culturally diverse backgrounds, Aboriginal women, those who have experienced violence from men, women with disabilities and women of diverse sexual and gender identities. The associated priority needs of these women were explored and recommendations were made regarding each of these priorities. These were endorsed by the Eastern SRH Regional Strategic Reference Group in November 2015 and are as follows:
Table 31. Sexual and reproductive Health Priorities, EMR, 2016
Source: Women’s Health East Women’s Sexual & Reproductive Health Need Analysis, 2016
Maroondah’s findings that speak to each of the identified priority areas are as follows:
Table 32. EMR Chlamydia data, 2013
Source: Women’s Health East Women’s Sexual & Reproductive Health Fact Sheet, Maroondah 2014
Chlamydia notification rates in Maroondah are markedly higher than the EMR and State average.
48

Table 33. Hepatitis B Data, Medicare Local Areas, 2011
Source: Women’s Health East Women’s Sexual & Reproductive Health Fact Sheet, Maroondah 2014
Chronic Hepatitis B is a significant burden of disease – many people don’t know they have it and long term illness can lead to liver cancer and death. Transmission – sexually transmitted, needle sharing, and most commonly through mother to baby transmission at birth. (Women’s Health East Women’s Sexual & Reproductive Health Fact Sheet, Maroondah 2014)
Table 34. Cervical Screening Data, EMR, 2013
Source: Women’s Health East Women’s Sexual & Reproductive Health Fact Sheet, Maroondah 2014
Regular cervical screening is an example of adequate SRH literacy for women- it indicates that women have an understanding of the need for cervical screening, the recommended timing and that they have access to appropriate services.
49

Table 35. Birth Rate (young women)EMR, 2013
Source: Women’s Health East Women’s Sexual & Reproductive Health Fact Sheet, Maroondah 2014
The birth rate for young women is a strong indicator for poor access to long term contraception, emergency contraception, surgical and medication abortion. However, it is important to remember that pregnancies for young women are not always unintended. Maroondah has a very high rate compared to the EMR average – anecdotally, young women face barriers to healthcare access for SRH, particularly around lack of public transport. However, there are also areas of social and economic disadvantage in Maroondah, which correlates with higher teenage pregnancy rates. (Women’s Health East Women’s Sexual & Reproductive Health Fact Sheet, Maroondah 2014)
50

3.8 Health and Wellbeing, Chronic Conditions, Screening and Eye Health
The content of this section includes information on self-reported health and wellbeing, chronic disease prevalence, biomedical checks and screening and eye health in Maroondah, the EMR and Victoria.
Table 36. Health and Wellbeing, Chronic Conditions, Screening and Eye Health, EMR 2014Biomedical checks Health
StatusChronic Disease
Area Last GP visit was 12 months or more ago
Had blood pressure check in previous 2 years
Had a cholesterol check in previous 2 years
Had a blood sugar or diabetes check in previous 2 years
Had an examination for bowel cancer in the previous 5 years(50+ years)
Had a mammogram in the previous 5 years
Had a pap smear in previous 2 years
Fair or poor self-reported health
Type 2 diabetes
Anxiety or Depression
Arthritis Cancer Heart Disease
EMR 10.5 78.6 58.9 52.1 46.8 74.3 74.4 18.5 4.7 21.4 17.5 8.0 6.5Boroondara (C)
11.3 76.8 53.2 47.7 48.8 76.7 63.2 17.9 1.4 17.8 15.8 5.7 7.1
Knox (C) 10.5 74.2 61.0 52.7 43.0 74.0 76.6 17.2 5.5 20.3 20.2 8.8 6.2Manningham (C)
9.7 85.2 61.5 54.4 47.4 79.9 78.8 16.7 3.0 15.2 14.7 9.7 8.6
Maroondah (C)
8.8 81.0 51.0 43.1 46.5 76.8 74.3 18.5 3.2 33.2 19.6 9.2 4.5
Monash (C) 8.8 79.0 64.5 54.4 49.5 72.2 76.3 18.8 5.5 17.6 16.5 7.5 5.9Whitehorse (C)
10.8 80.3 63.2 59.4 48.5 70.2 77.7 20.8 8.6 21.4 16.9 7.5 6.4
Yarra Ranges (S)
12.9 78.3 55.1 49.4 44.3 72.4 74.0 19.4 4.6 27.1 19.3 9.0 6.6
Victoria 10.4 79.9 59.5 53.1 46.1 73.0 72.1 20.3 5.3 24.2 19.8 7.4 7.2Estimates that are (statistically) significantly different to the corresponding estimate for Victoria are identified by colours as follows above or belowSource: Department of Health and Human Services, Victorian Population Health Survey 2014, Health and wellbeing, chronic conditions, screening and eye health. Complied by Maroondah City Council
Maroondah has a below EMR and Vic estimated participation in both 2 yearly cholesterol checks and blood sugar or diabetes checks.
51

3.8 Social Capital
Social capital is defined as the ‘resources that are accessed by individuals as a result of their membership of a network or a group’ (Berkman, Kawachi et al. 2014). Research shows that higher levels of social capital are associated with better health outcomes. (Department of Health and Human Services, Victorian Population Health Survey 2014, Inequalities in the social determinants of health and what it means for the health of Victorians)
The below information details social capital indicators in Maroondah, the EMR and Victoria.
Table 37. Social Capital Indicators, EMR 2014Social & Civic Trust % Social & Support Networks % Community & Civic Engagement % Social Environment %
Area Feel safe walking down street after dark
Agree most people can be trusted
Feel there are opportunities to have a real say on important matters
Able to get help from family
Able to get help from friends
Able to get help from neighbours
Membership of an organized group (sport)
Attendance at a local community group
Volunteerism
Multiculturalism makes life in their area better
Daily social contact (10+ people))
Neighbourhood tenure (<10 years)
Social isolation among adults (high or very high)
EMR 63.9 42.7 36.2 84.1 81.5 51.1 24.7 55.8 24.3 60.7 46.6 59.4 15.8Boroondara (C)
68.9 50.4 45.9 80.1 83.3 47.7 24.2 57.7 24.7 73.2 49.9 62.4 16.5
Knox (C) 63.5 33.4 32.0 83.7 82.8 53.3 19.5 50.9 22.3 55.6 46.0 59.2 16.3Manningham (C)
68.5 39.6 30.2 86.7 78.4 47.2 26.3 54.4 23.5 61.7 44.1 62.1 13.6
Maroondah (C)
56.5 35.0 34.2 85.2 79.9 54.7 21.5 59.6 22.1 45.6 44.2 56.0 13.2
Monash (C) 58.4 44.9 34.1 81.8 78.2 49.1 21.9 45.6 19.7 59.9 43.2 55.5 17.8Whitehorse (C)
65.2 48.0 40.2 87.0 85.3 57.2 32.9 58.2 27.6 70.2 47.4 68.1 12.6
Yarra Ranges (S)
64.5 43.9 33.6 86.7 82.4 48.7 26.9 68.3 30.7 51.1 50.2 51.5 18.4
Victoria 60.8 38.2 35.2 81.6 79.7 51.2 25.7 58.7 23.2 55.4 47.5 56.2 17.3Estimates that are (statistically) significantly different to the corresponding estimate for Victoria are identified by colours as follows above or belowSource: Department of Health and Human Services, Victorian Population Health Survey 2014, Inequalities in the social determinants of health and what it means for the health of Victorians. Complied by Maroondah City Council
It should be noted that findings of the VicHealth Indicators Survey 2015, place Maroondah as significantly less favourable than the Victorian estimate for perceptions of safety – walking alone after dark, 47% and 55.1% respectively.
52

3.9. Health Service Access & Utilisation
Access to and utilisation of health services should be equitable for all, however there are many factors that can impact upon a persons ability to obtain the health services they may require, such as socio-economics, language, cultural sensitivity and infrastructure.
The below information provides a summary of Maroondah’s health service access and utilisation data. Access and utilisation rates of health services in Maroondah are not significantly different to state measures.
Table 38. Maroondah Health Service Access and Utilisation Data, 2015
53

54

Source: Department of Health and Human Services, 2015 Local Government Area (LGA) Statistical Profile
SummaryKey findings - Population Health include:
High level of older females living alone Lower than EMR average for male life expectancy Health promotion initiatives to be undertaken to assist in addressing avoidable mortality
and top 10 burden of disease findings Maroondah has the highest rate of suicide in the EMR and is above the avoidable
mortality rate (suicide) for Greater Melbourne. Maroondah has the highest rate in the EMR of persons aged 60-69 years experiencing
elder abuse and the second highest rate of person 70-79 years experiencing elder abuse Maroondah and Monash have the equal highest percentage of people with a profound or
severe disability in the EMR. Accessibility, inclusiveness, and adequate service provision is required in planning for beneficial health and wellbeing outcomes for this cohort.
There will be an estimated increase of 4,160 persons, in Maroondah, with dementia between the years of 2016 1nd 2050.
Maroondah has a significantly higher estimate to both the EMR and Victoria for persons consuming sugar sweetened drinks daily.
Maroondah has a below EMR and Victoria estimated participation in both 2 yearly cholesterol checks and blood sugar or diabetes checks.
The percentage of people reporting high/very high psychological distress is above the state measure.
Maroondah has the highest rate of hospital admissions for mental health related causes in the EMR and a higher rate than both Greater Melbourne and Victoria.
Chlamydia notification rates in Maroondah are markedly higher than the EMR and State average.
Maroondah has a very high rate compared to the EMR average of mothers under 20 years of age.
55

4. Community Safety
4.1 Perceptions of SafetyNeighbourhoods which are perceived as safe, foster community participation. encourage physical activity, community connectedness and add to the health and well-being of local residents and visitors. Neighbourhood safety can only be achieved through the development and support of partnerships, within local communities, with business, residents, community groups, police, agencies and councils, which identify local solutions to local issues.
The built environment and the way neighbourhoods are designed and maintained, impact greatly on perceptions of safety and are critical factors in any strategy for improving safety in neighbourhoods. (Community Indicators Victoria)
Table 39. Perception of Safety, After Dark, EMR, 2014AREA Estimated number of people
aged 18 years and over who felt very safe/safe walking alone in local area after darkASR per 100
Boroondara (C) 70.8Knox (C) 50.9Manningham (C) 62.9Maroondah (C) 53.0Monash (C) 57.5Whitehorse (C) 59.1Yarra Ranges (S) 61.4Greater Melbourne 51.9Victoria 53.0
Source: Population Health Information Development Group (AIHW), Social Health Atlases of Australia: Local Government Areas, 2017, compiled by Maroondah City Council
Most (91.4%) Maroondah residents agreed that they felt safe walking alone during the day, which is similar to the Victorian estimate (92.5%). (Vic Health, VicHealth Indicators Survey 2015 Results)
However, Maroondah has the second lowest perception of safety, after dark, in the EMR and is equal to the Victoria rate.
56

4.2 Crime Rates
Crime rates in Maroondah are the third highest in the EMR, behind Knox and Monash.
Overall Maroondah’s crime rate has increased by 16.4% between 2016 and 2017.
Property and deception offences are the highest offence division in Maroondah which is consistent across the EMR
Table 40. Recorded Offences, EMR 2016-2017AREA Number of Recorded Offence
2016-2017Boroondara (C) 8, 540Knox (C) 12, 340Manningham (C) 5, 248Maroondah (C) 9, 331Monash (C) 11, 631Whitehorse (C) 8, 359Yarra Ranges (S) 8, 804
Source: Crime Statistics Agency, Crime by Location, Maroondah, 2017, compiled by Maroondah City Council
Graph 17: Maroondah Crime Rate per 100,000 population, 2017
Source: Crime Statistics Agency, Crime by Location, Maroondah, 2017
57

Graph 18: Maroondah Crime, Offence Division, 2017
Source: Crime Statistics Agency, Crime by Location, Maroondah, 2017
58

Table 41. Maroondah Crime Statistics, 2013-2017
Source: Crime Statistics Agency, Crime by Location, Maroondah, 2017
59

4.3 Family Violence
Family violence has long-term health and wellbeing consequences for those affected by it. The experience of family violence has an impact on victims/survivors as well as perpetrators and others exposed to it (e.g. children). Studies show that women subjected to family violence are more likely than other women to experience low self esteem, anxiety, depression, suicidal thoughts and post traumatic stress disorder, and are at higher risk than other women of mental health disorders and physical health conditions. (Women’s Health East Maroondah Demographic Profile, 2012)
Maroondah has the third highest rate per 100,000 population of family violence incidents in the EMR.
Table 42. Family incident rate per 100,000 population by region and local government area - April 2016 to March 2017
AREA Family Incident Rateper 100,000
Boroondara (C) 463.4Knox (C) 1, 045.1Manningham (C) 623.1Maroondah (C) 1, 015.4Monash (C) 725.1Whitehorse (C) 633.8Yarra Ranges (S) 1, 019.2
Source: Crime Statistics Agency Victoria, Family incident rate per 100,000 population by region and local government area, 2017
4.4 Child Abuse & Neglect
Maroondah’s rate of child protection investigations and substantiations are below the state measures, however are the highest in the EMR.
Table 43: Child Protection, Family Service and Youth Justice Utilisation, Maroondah, 2015
Source: Department of Health and Human Services, 2015 Local Government Area (LGA) Statistical Profile
60

4.5 Tobacco, Alcohol, and Other Drugs
The following range of indicators demonstrate that there are a number of domains in which Maroondah would benefit from focusing initiatives towards. Across the EMR Maroondah has the:
Second highest proportion of adult population with lifetime risk from alcohol use Second highest rate of persons who consumed alcohol at least weekly at levels likely to cause short-term harm Third highest rate of alcohol related hospital admissions across both ‘all persons’ and persons aged 15-24 years Highest rate of high alcohol hours (Fri & Sat 8pm – 6am) alcohol related assaults across both ‘all persons’ and persons aged 18-24 years Third highest rate of alcohol related family violence Highest rate of alcohol related family violence by persons, 18-24 years Third highest percentage of persons smoking Highest rate of ambulance attendance due to Crystal Methamphetamine Highest rate of Illicit drug ED presentations
Table 44: Tobacco, Alcohol, and Other Drugs Indicators, EMR, 2012-2016
Indicators Boroondara (C)
Knox (C) Manningham (C)
Maroondah (C)
Monash (C)
Whitehorse (C)
Yarra Ranges (S)
Proportion of adult population with lifetime risk from alcohol use
68.4 56.8 59.0 67.0 48.1 64.5 62.3
Consumed alcohol at least weekly at levels likely to cause short-term harm - persons aged 18+
7.2 6.7 7.0 9.1 5.3 7.4 16.9
Hospital admission per 10,000 alcohol related 57.8 49.4 39.2 53.7 43.6 76.9 38.4Hospital admission per 10,000 aged15-24yrs 20.4 27.1 16.7 35.9 22.9 36.8 23.6Alcohol Assault HAH Rate Total 3.5 9.2 4.0 11.0 4.4 4.8 8.8Alcohol Assault HAH Rate 18-24yrs 10.9 28.9 6.3 39.7 7.1 10.0 16.1Alcohol Family Violence Rate Total 8.1 22.0 8.6 18.9 9.9 8.8 21.4Alcohol Family Violence Rate 18-24yrs 9.3 25.7 6.8 28.7 9.6 8.5 26.5% of adults smoking 9.4 17.6 12.4 13.7 9.3 11.6 19.5Crystal Methamphetamine Ambulance Rate Total 1.2 2.1 0.9 2.5 1.4 1.2 2.4
Source: Inner East Primary Care Partnership, Core Indicator Set for Inner East Catchment Planning, 2017, Compiled by Maroondah City Council
61

Graph 19: Illicit ED Rate, all persons EMR, 2016
Source: Turning Point, Victorian Alcohol and Drug Interactive Statistics and Mapping, 2016, Compiled by Maroondah City Council
Graph 20: Illicit ED Rate, 15-24 years EMR, 2016
Source: Turning Point, Victorian Alcohol and Drug Interactive Statistics and Mapping, 2016, Compiled by Maroondah City Council
62

Graph 21. Alcohol Related Family Violence, all persons, EMR 2016
Source: Turning Point, Victorian Alcohol and Drug Interactive Statistics and Mapping, 2016, Compiled by Maroondah City Council
Graph 22. Alcohol Related Family Violence, 18-24 years, EMR 2016
Source: Turning Point, Victorian Alcohol and Drug Interactive Statistics and Mapping, 2016, Compiled by Maroondah City Council
63

Graph 23. Alcohol Assault HAH Rate, 18-24years, EMR, 2016
Source: Turning Point, Victorian Alcohol and Drug Interactive Statistics and Mapping, 2016, Compiled by Maroondah City Council
64

4.6 Gambling
Maroondah has the third highest number of electronic gaming machines (EGM’s) in the EMR and the highest EGM expenditure per adult in the EMR.
Table 45: Gambling on EGM’s, EMR, 2016-2017
Area # of EGM’s per LGA (April ’17)
# of Venues per LGA (April’17)
Player Losses to EMG’s per LGA (month of April ‘17)
Expenditure per adult per LGA (2016)
Boroondara (C) 162 4 1,536,184.64 141.68Knox (C) 766 11 6,051,833.29 593.54Manningham (C) 519 7 4,298,889.19 576.47Maroondah (C) 759 10 5,256,552.49 730.28Monash (C) 946 15 8,695,564.39 723.28Whitehorse (C) 430 6 4,295,925.37 394.99Yarra Ranges (S) 442 9 2,405,563.80 246.43
Source: Victorian Commission for Gambling and Liquor Regulation, Gambling and Research, Gambling Data, 2017
SummaryKey findings – Community Safety include:
Crime rates in Maroondah are the third highest in the EMR, behind Knox and Monash. Maroondah’s crime rate has increased by 16.4% between 2016 and 2017. In the EMR Maroondah has the second lowest perception of safety, after dark Maroondah has the third highest rate per 100,000 population of family violence incidents
in the EMR. Second highest proportion of adult population with lifetime risk from alcohol use Second highest rate of persons who consumed alcohol at least weekly at levels likely to
cause short-term harm Third highest rate of alcohol related hospital admissions across both ‘all persons’ and
persons aged 15-24 years Highest rate of high alcohol hours (Fri & Sat 8pm – 6am) alcohol related assaults across
both ‘all persons’ and persons aged 18-24 years Third highest rate of alcohol related family violence Highest rate of alcohol related family violence by persons, 18-24 years Third highest percentage in EMR of persons smoking Highest rate of ambulance attendance due to Crystal Methamphetamine Highest rate of Illicit drug Emergency Department presentations Maroondah has highest EGM expenditure per adult in the EMR. The rates of child protection investigations and substantiations are below the state
measures.
65

5. Liveability
5.1 Green Space
Maroondah’s open space network does not include the large state owned regional parkland sites that some other municipalities benefit from.
It also has limited ‘green wedge’ zoned land where development is restricted, as opposed to some other outer ring Councils that have large green wedge areas. This increases the pressure to ensure open spaces are allocated, utilised and improved in accordance with a defined strategy. Decision making must become more strategic and evidence based to ensure the open space assets are equitably provided as resources for the whole community and for the long term preservation of the environment.
The opportunity for new open space land to become available to the Maroondah community through land developments into the future is very limited. Rather, land assets will need to come from existing site redevelopments, land swap negotiations or from planned acquisition utilising open space contributions as the investment mechanism. (Maroondah City Council, Open Space Strategy, 2016)
Maroondah has the second highest percentage of persons visiting green space on a weekly basis or more than the EMR and higher than Victorian percentage.
Map 3. Maroondah Open Space, 2017 (green polygon)
Source: Maroondah City Council, Intramaps
66

Table 46. Proportion of LGA Which is Green (% total area of LGA), EMR Comparison, 2013Area % of LGA total area which is greenBoroondara (C) 37.1Knox (C) 43.7Manningham (C) 49.3Maroondah (C) 42.0Monash (C) 36.6Whitehorse (C) 38.6Yarra Ranges (S) 58.7Victoria
Source: Social Statistics, City of Greater Dandenong, Indicators of Health and Wellbeing, 2013
Table 47. Percentage of Visits to Green Spaces, 2011Area Visits to green spaces greater than or equal to
once a weekBoroondara (C) 65.4%Knox (C) 49.6%Manningham (C) 49.7%Maroondah (C) 55.8%Monash (C) 53.3%Whitehorse (C) 48.5%Yarra Ranges (S) 50.9%Victoria 50.7%
Source: Vic Health, VicHealth Indicators Survey 2011
67

5.2 Transport
A selection of Maroondah’s transport statistics are below:
Table 48. Transport Limitations, Maroondah 2011
Source: Community Indicators Victoria, 2011
Graph 24. Method of Travel to Work, 2011
In 2011, there were 5,465 people who caught public transport to work (train, bus, tram or ferry) in the City of Maroondah, compared with 37,440 who drove in private vehicles (car – as driver, car – as passenger, motorbike, or truck).
Analysis of the method of travel to work of the residents in the City of Maroondah in 2011, compared to Eastern Metropolitan Region, shows that 10.5% used public transport, while 71.7% used a private vehicle, compared with 12.7% and 68.1% respectively in Eastern Metropolitan Region. (.id The Population Experts)
88.4% of households in Maroondah are within 400m of a bus stop. (Booz & Co., Knox/Maroondah/Yarra Ranges Bus Service Review: Final Report 2010)
68

5.3 Walkability
Walkability refers to how well the built environment in different areas supports walking for transport.
Table 49. Maroondah Walk Score, by suburb, 2016Walk Score - Results 2016
SuburbWalk Score Rating
Ringwood 63 Somewhat Walkable
Croydon 60 Somewhat Walkable
Ringwood East 57 Somewhat Walkable
Heathmont 55 Somewhat Walkable
Croydon South 49 Car -Dependent
Ringwood North 48 Car -Dependent
Bayswater North 48 Car -Dependent
Kilsyth 45 Car -Dependent
Croydon Hills 43 Car -Dependent
Croydon North 38 Car -Dependent
Warranwood 30 Car -Dependent
Source: Walk Scores, 2017, Compiled by Maroondah City Council
69

5.4 Food
The extent to which households can reliably maintain a supply of quality food is sometimes termed ‘food security’. A number of inquiries have been made into levels of food security among the general population, chiefly emphasizing the affordability of food. (Social Statistics- Profiles of Health and Wellbeing – Victoria)
The following information provide insight into levels of food security within Maroondah.
Table 50. Experience of Food Insecurity, Maroondah, 2011
Source: Community Indicators Victoria, 2011
Maroondah has higher incidents of food insecurity than both the EMR and Victoria.
70

5.5 Environmental Sustainability
Climate change is a major issue for Australian communities, with many emerging risks, as well as opportunities. The Greater Melbourne metropolitan region has already become warmer and drier, a climate trend likely to continue into the future (Victorian Government 2015). Many of the risks we face are not new. However, the experts suggest that there are likely to be changes to the climate as well as change in duration, frequency and severity of some weather events, including drought, flooding and extreme heat events. We can expect more hot days and warm spells, less rainfall but more intense downpours and storm events, and more bushfire weather conditions.
Adaptation and mitigation are complementary strategies for reducing and managing the risks of climate and change. (Maroondah City Council Climate Change Risk and Adaptation Strategy, 2017)
Information below provides insights into selected indicators for undertaking evidence informed action.
Table 51. Waste Water Recycling, 2011
Source: Community Indicators Victoria, 2011
The percentage of Maroondah households engaging in waste water recycling is lower than the EMR percentage.
71

Table 52. Kerbside Collection Diverted from Landfill, 2015-2016
Source: Department of Land, Water, Environment and Planning, Know Your Council Performance Summary Maroondah 2015-2016
Table 53. Maroondah Solar Panel Installation, 2001-2014Solar Installations Accumulative Total
2001-2014
Solar Installations - Small-scale solar panel system installations (no.)
3778
Solar Installations - Solar water heater installations (no.)
1521
Source: Australian Bureau of Statistic, Data by Region, Local Government Areas, Maroondah (C), 2011
Maroondah is ranked 5th in the EMR for installation of solar panel system installations and lowest in the in the EMR for installation of solar water heaters.
72

The spatial distribution of heat related vulnerability in the Maroondah area suggests that areas of high risk (marked as red on the figure) are concentrated in our municipality. These are areas with a higher concentration of aged persons and households where English is not the primary language.
Map 4: Heat Vulnerability Index, Maroondah, 2010
Source: Monash University, Heat Vulnerability Index 2010
The following map shows the spatial distribution of emergency ambulance callouts between 1 January 2002 and 31 December 2010 on extreme heat days defined using a daily mean temperature threshold of 34 degrees Celsius. The highest numbers of emergency ambulance calls (marked as red on the figure) were in Warranwood, Ringwood North, Ringwood, Croydon North and Croydon.
Map 5: Emergency Ambulance Callouts on Extreme Heat Days, Maroondah 2002 - 2010
Source: Monash University, Heat Vulnerability Index
73

SummaryKey findings - Liveability include:
New open space land opportunities within Maroondah will need to come from existing site redevelopments, land swap negotiations or from planned acquisition utilising open space contributions as the investment mechanism
Maroondah has the second highest percentage of persons visiting green space on a weekly basis or more than the EMR and higher than Victorian percentage.
10.5% of Maroondah residents travelling to work use public transport which is lower than the EMR 12.7%
88.4% of households in Maroondah are within 400m of a bus stop. The majority of Maroondah suburbs are car dependant Maroondah has a higher incidents of food insecurity than both the EMR and Victoria. The percentage of Maroondah households engaging in waste water recycling is lower
than the EMR percentage. Maroondah is ranked lowest in the in the EMR for installation of solar water heaters The suburbs of Warranwood, Ringwood North, Ringwood, Croydon North and Croydon
are areas with a high heat vulnerability index. As with Greater Melbourne the EMR is expected to experience increasingly hotter drier
conditions, resulting in; increased frequency, duration and severity of heat waves, decreased average rainfall and more severe, prolonged drought conditions, less regular but more intense rainfall and storm events and significant increase in bushfire danger days
74

6. References
Australian Bureau of Statistics, Data by Region, Local Government Areas, Maroondah (C), 2011http://stat.abs.gov.au/itt/r.jsp?RegionSummary®ion=24410&dataset=ABS_REGIONAL_LGA&geoconcept=REGION&maplayerid=LGA2014&measure=MEASURE&datasetASGS=ABS_REGIONAL_ASGS&datasetLGA=ABS_REGIONAL_LGA®ionLGA=REGION®ionASGS=REGION
Australian Bureau of Statistics, Estimated Resident Aboriginal and Torres Strait Islander and Non-Indigenous population, SLA and LGA - 30 June 2011
http://www.abs.gov.au/AUSSTATS/[email protected]/DetailsPage/3238.0.55.001June%202011?OpenDocument
Australian Bureau of Statistics, General Community Profile, 2016 Census Community Profiles. http://www.censusdata.abs.gov.au/census_services/getproduct/census/2016/communityprofile/LGA24410?opendocument
Australian Bureau of Statistics, Indigenous Community Profile, 2016 Census Community Profiles. http://www.censusdata.abs.gov.au/census_services/getproduct/census/2016/communityprofile/LGA24410?opendocument
Australian Bureau of Statistics, Time Series Profile, 2016 Census Community Profiles. http://www.censusdata.abs.gov.au/census_services/getproduct/census/2016/communityprofile/LGA24410?opendocument
Australian Institute of Health and Welfare, Population Healthhttp://www.aihw.gov.au/population-health/
Australian Institute of Health and Welfare, Youth Health and Wellbeinghtt,p://www.aihw.gov.au/youth-health-and-wellbeing/
Australian Institute of Health and Welfare, Housing Assistance in Australia, 2016http://www.aihw.gov.au/housing-assistance/haa/2016/http://www.aihw.gov.au/WorkArea/DownloadAsset.aspx?id=60129555384
Booz & Co., Knox/Maroondah/Yarra Ranges Bus Service Review: Final Report 2010
Cummins, RA, Eckersley, R, Pallant, j, Van Vugt, J & R Misajon, 2003, Developing a national index of subjective wellbeing: The Australian Unity Wellbeing Index’, Social Indicators Research, vol.64, no.2, pp. 159-90
Community Indicators Victoria, 2011http://www.communityindicators.net.au/metadata_items/perceptions_of_safetyhttp://www.communityindicators.net.au/wellbeing_reports/maroondah
Crime Statistics Agency Victoria, Crime by Location, Maroondah, 2017https://www.crimestatistics.vic.gov.au/explore-crime-by-location
75

https://www.crimestatistics.vic.gov.au/sites/default/files/embridge_cache/emshare/original/public/2017/06/6b/6200f354b/Family%20incidents%20data%20table%20-%20year%20ending%2031%20March%202017.xlsx
Department of Education and Early Childhood Development, Adolescent Community Profile, City of Maroondah,2010 http://www.education.vic.gov.au/Documents/about/research/acpmaroondah.pdf
Department of Land, Water, Environment and Planning, Know Your Council Performance Summary Maroondah 2015-2016https://knowyourcouncil.vic.gov.au/councils/maroondah/reports/waste-collection
Department of Health and Human Services, 2011, Victorian Burden of Disease Studyfile:///C:/Users/bruff/AppData/Local/morbidity%20-%20PDF.pdf
Department of Health and Human Services, VPHWP Companion Document Health Status of Victoria, 2015
Department of Health and Human Services, Health Status of Victorians, Health Atlas, Interactive Data, 2014http://www.health.vic.gov.au/atlas/atlas/html/Maroondah.html
Department of Health and Human Services, 2015 Local Government Area (LGA) Statistical Profilehttps://www2.health.vic.gov.au/about/reporting-planning-data/gis-and-planning-products/geographical-profiles
Department of Health and Human Services, Victorian Population Health Survey 2014, Modifiable risk factors contributing to chronic disease in Victoria,https://www2.health.vic.gov.au/public-health/population-health-systems/health-status-of-victorians/survey-data-and-reports/victorian-population-health-survey/victorian-population-health-survey-2014
Department of Health and Human Services, Victorian Population Health Survey 2014, Health and wellbeing, chronic conditions, screening and eye health.https://www2.health.vic.gov.au/public-health/population-health-systems/health-status-of-victorians/survey-data-and-reports/victorian-population-health-survey/victorian-population-health-survey-2014
Department of Health and Human Services, Victorian Population Health Survey 2014, Inequalities in the social determinants of health and what it means for the health of Victorianshttps://www2.health.vic.gov.au/public-health/population-health-systems/health-status-of-victorians/survey-data-and-reports/victorian-population-health-survey/victorian-population-health-survey-2014
Department of Transport, Planning and Local Infrastructure (2014), Sheet1. Melbourne Metropolitan Area. Residential price statistics 1985 to 2014 http://dtpli-search.clients.squiz.net/s/cache?collection=external-dtpli-docs1&doc=funnelback-webcrawl.warc&off=2440795&len=229670&url=http%3A%2F%2Fwww.dtpli.vic.gov.au%2F__data%2Fassets%2Fexcel_doc%2F0004%2F222088%2Fyear_summary_2015.xls&profile=_default
76

.id The Population Experts, City of Maroondah Community Profile.http://profile.id.com.au/maroondah
.id The Population Experts, City of Maroondah Population Forecast.http://forecast.id.com.au/maroondah
.id The Population Experts, City of Maroondah Social Atlas.http://atlas.id.com.au/maroondah
Inner East Primary Care Partnership, Health and Wellbeing Needs of Older People Living in the Eastern Region of Melbourne, 2017http://iepcp.org.au/wpcontent/uploads/2017/05/IEPCP_Health_and_wellbeing_needs_of_older_people_FINAL.pd
http://iepcp.org.au/wpcontent/uploads/2016/08/IEPCP_Introduction_and_Major_Findings_003.pdf
Inner East Primary Care Partnership, Core Indicator Set for Inner East Catchment Planning, 2017http://iepcp.org.au/resources/?category=planning-for-preventative-health
Maggolee http://www.maggolee.org.au/wp-content/uploads/2015/09/LGA-Profile-Final-Maroondah.pdf
Maroondah City Council, Maroondah Youth Profile, 2016, Maroondah Youth Serviceshttp://www.maroondah.vic.gov.au/4355.aspx
Monash Universityhttp://www.monash.edu/news/articles/6639
Maroondah City Council Climate Change Risk and Adaptation Strategy, 2017Yet to be released
Maroondah City Council Active & Healthy Ageing Initiative, Towards an Age-friendly Maroondah, 2015-2020http://www.maroondah.vic.gov.au/ActiveHealthyAgeingInit.aspx
Maroondah City Council, Intramaps
Maroondah City Council, Physical Activity Strategy 2015-2020http://www.maroondah.vic.gov.au/6502.aspx
Maroondah City Council, Open Space Strategy, 2016http://www.maroondah.vic.gov.au/OpenSpaceStrategy.aspx
Population Health Information Development Group (AIHW), Social Health Atlases of Australia: Local Government Areas, 2017http://phidu.torrens.edu.au/social-health-atlases/data#social-health-atlases-of-australia-local-government-areas
77

Social Statistics, City of Greater Dandenong, Indicators of Health and Wellbeing, 2013http://www.greaterdandenong.com/document/18464/statistical-data-for-victorian-communities
Social Statistics, City of Greater Dandenong, Profiles of health and Wellbeing- Victoria, 2013http://www.greaterdandenong.com/document/18464/statistical-data-for-victorian-communities
Social Statistics, City of Greater Dandenong, Housing and land purchase prices Victoria, 2016http://www.greaterdandenong.com/document/18512/statistics-vic-house-and-land-purchase-prices
Turning Point, Victorian Alcohol and Drug Interactive Statistics and Mapping, 2016http://www.aodstats.org.au/
Victorian Commission for Gambling and Liquor Regulation, Gambling and Research, Gambling Data, 2017https://www.vcglr.vic.gov.au/resources/data-and-research/gambling-data/population-density-and-gaming-expenditure
Victorian Health Information Surveillance System (VHISS)https://hns.dhs.vic.gov.au/3netapps/vhisspublicsite/ViewContent.aspx?TopicID=1https://hns.dhs.vic.gov.au/3netapps/vhisspublicsite/Report.aspx?ReportBy=1&LGARegionIDs=800&AllLGASelected=0&Sex=&DiseaseIDs=0&AllDiseaseSelected=1&ReportYearIDs=0&ShowAccuracy=0&ReportID=37&BoDReportYearID=3&StatisticName=DAL&IsBoDReport=1&ReportYearID=3&StatisticName=DAL&IsBoDReport=1
Vic Health, VicHealth Indicators Survey 2011https://www.vichealth.vic.gov.au/programs-and-projects/vichealth-indicators-survey-2011
Vic Health, VicHealth Indicators Survey 2015 Resultsfile:///C:/Users/bruff/AppData/Local/Vic161_Maroondah_indicator_v5.pdf
Walk Scores, 2017 https://www.walkscore.com/AU-VIC/Melbourne/Ringwood_East
Women’s Health East Maroondah Demographic Profile, 2012 http://whe.org.au/custom_tag/maroondah/
Women’s Health East Women’s Sexual & Reproductive Health Need Analysis, 2016http://whe.org.au/wp-content/uploads/sites/3/2016/04/2016-04-28-Eastern-SRH-Needs-Analysis-Paper-Final.pdf
Women’s Health East Women’s Sexual & Reproductive Health Fact Sheet, Maroondah 2014http://whe.org.au/wp-content/uploads/sites/3/2014/10/2012_Resource_SRH-Fact-Sheet.pdf
78