1. site 958
TRANSCRIPT

Firth, J.V., et al , 1996Proceedings of the Ocean Drilling Program, Initial Reports, Vol. 159T
1. SITE 9581
John V. Firth,2 Peter Blum,2 Sten Lindblom,3 Klaus Michels,4 William W. Sager,5 and Amelie Winkler6
INTRODUCTION
In December 1994, the JOIDES Resolution entered drydock inFalmouth, England, for routine maintenance and refurbishment, fiveyears after its previous drydock. After drydock, the Resolution sailedsouth to Dakar, Senegal, for the port call that began Ocean DrillingProgram (ODP) Leg 159. The date for arriving at Dakar was fixed,but if drydock work finished earlier than scheduled, or if the transitspeed was faster than estimated, the ship might have had as much asone or two days of extra time before arriving in port. Because of thispossibility, plans were made to take some cores at a site of opportu-nity along the transit, instead of letting the ship sit idle off the coastof Senegal. Because of the short-term planning for this contingency,the site had to be positioned out of any countries' territorial waters,in an area with little chance of encountering hydrocarbon hazards. Inaddition, the site could not be too far off the ship's track to Dakar, andshould preferably be located along or near previously existing seis-mic survey lines. A potential site was located at the crossing point ofGlomar Challenger Line 14 and Vema Line V-2908. It was close topreviously existing ODP sites drilled during Leg 108 (Sites 657 and658), in water depths intermediate between them (Fig. 1). Thus, itcould provide complementary data to Leg 108 sites on paleoceano-graphic and paleoclimatic topics such as the history and nature oftrade winds, surface water currents, and bottom water currents duringthe Neogene. Because only a short time might be available for drill-ing, only advanced hydraulic piston corer (APC) cores were plannedto be taken.
Extra time was indeed available during the transit, so a short pre-site survey was made and 15 APC cores in two holes were taken atSite 958. No scientists were aboard the ship during the transit, andonly 24 hours elapsed before reaching Dakar after finishing the site,so the cores were sectioned, run through the multisensor track, andstored in the core reefer. After Leg 159, they were shipped back to theGulf Coast Repository in College Station, TX, where they were split,described, and analyzed on shore. An announcement was sent out inFebruary 1995, describing the site, and inviting interested scientiststo come and describe and sample the cores. Three scientists attendedthe core description and sampling meeting at ODP on June 13-16,1995. Additional help in doing the basic core analysis came from sci-entists at ODP and Texas A&M University. Samples were taken forthe meeting participants as well as for other shore-based scientists
'Firth, J.V., et al., 1996, Proc. ODP, Init. Repts., 159T: College Station, TX (OceanDrilling Program).
2Ocean Drilling Program, 1000 Discovery Drive, Texas A&M University ResearchPark, College Station, TX 77845, U.S.A. Firth: [email protected];Blum: [email protected]
'Department of Geology and Geochemistry, Stockholm University, S-10691 Stock-holm, Sweden.
-"Sonderforschungsbereich 313, Universitaet Kiel, Olshausenstrasse 40, Kiel, D-24118, Federal Republic of Germany.
5 Department of Oceanography, Texas A&M University, College Station, TX77843, U.S.A. [email protected]
6GEOMAR, Wischholfstrasse 1-3, Kiel, D-24148, Federal Republic of Germany.
who could not make the description meeting. The purp°se of themeeting was to provide the basic analysis that is routinely done onship, in order to produce this site report, as well as to sample the coresfor more detailed studies, which will be published in a future Scien-tific Results volume of the Proceedings of the Ocean Drilling Pro-gram.
Authorship
The different sections of this site chapter were written by the fol-lowing scientists (in alphabetical order, no seniority implied):
Introduction: FirthPrincipal Results: FirthOperations: FirthCore Handling: FirthLithostratigraphy: Firth, Lindblom, Michels, WinklerBiostratigraphy: FirthPaleomagnetics: SagerCarbonate Geochemistry: LindblomPhysical Properties: Blum
SITE SUMMARY
Hole 958A
Date occupied: 29 December 1994, 1328 hr (UTC)
Date departed: 31 December 1994, 1625 hr (UTC)
Time on hole: ~51 hr
Position: 23°59.94'N, 20°00.05'W
Water depth (sea-level; corrected m, echo-sounding): 3728
Bottom felt (rig floor, m, drill pipe): 3795
Distance between rig floor and sea level (m): 10.5
N
24°
20°
COoenevi
Siteo657
Canary Islands j% # ß
. \ • . . . . • . • • • ••
Site^958 /
/ Africa. : : : : - : : - : • • ' • • ' •
Sitei°658
20°W 10c
Figure 1. Map of eastern North Atlantic showing location of ODP Sites 958,657, and 658, and seismic lines GC-14 and V-2908.

SITE 958
Total depth (rig floor, m): 3928
Penetration (m): 133
Number of cores: 14
Total length of cored section (m): 133
Total core recovered (m): 130.99
Core recovery (%): 98.49%
Oldest sediment cored:Depth (mbsf): 133Nature: nannofossil oozeAge: late Miocene
Hole 958B
Date occupied: 31 December 1994, 1625 hr (UTC)
Date departed: 1 January 1995, 0230 hr (UTC)
Time on hole: ~ 10 hr
Position: 23°59.94'N, 20°00.05'W
Water depth (sea-level; corrected m, echo-sounding): 3728
Bottom felt (rig floor, m, drill pipe): 3788.8
Distance between rig floor and sea level (m): 10.5
Total depth (rig floor, m): 3797.5
Penetration (m): 8.7
Number of cores: 1
Total length of cored section (m): 8.7
Total core recovered (m): 8.19
Core recovery (%): 86.21
Oldest sediment cored:Depth (mbsf): 8.7Nature: nannofossil oozeAge: Pleistocene
Principal results: Site 958 comprises 15 APC cores from two holes, penetrat-ing to 133 mbsf with a total recovery of 139.18 m (98.22%). Comparisonof lithologic, biostratigraphic, and physical properties data between thetop two cores, 159-958A-1H and 159-958B-1H, indicates that there is lit-tle or no overlap between them; thus, there is about 7-10 m of sedimentmissing from above Core 159-958A-1H. Core 159-958B-1H establishedthe mud line at 3778.3 mbsl. Because no exact measurement of the miss-
ing interval in Hole 958A can be made, all discussions of data are basedon the top of Core 159-958A-1H as 0.0 mbsf.
The entire section is composed predominantly of nannofossil ooze,with a higher foraminifer content in the upper 30-40 m. Olive gray turbid-ites with higher foraminifer, quartz, biosilica, and organic matter contentoccur down to 29.55 mbsf in Hole 958A, and are the basis for distinguish-ing lithologic Subunit IA from the more nannofossil rich sediments ofSubunit IB. Carbonate analyses also reflect the increasing carbonate con-tent downhole. The upper part of Subunit IB (from about 29 to 45 mbsf)is characterized by low grain densities, bulk densities, and magnetic sus-ceptibility. The sedimentation rate in this interval is also lower (about 1.3cm/k.y.) than above or below, and a possible hiatus or condensed intervalmatches the discontinuity of physical properties at about 45 mbsf. Aslightly higher content of quartz and biosilica between 30 and 45 mbsfmay partly explain the lower densities. Light greenish gray color bandingoccurs throughout Subunit IB, but becomes more regular in band thick-ness and spacing below about Core 159-958A-10H (below 95 mbsf). Thecolor bands have a higher clay content than the surrounding white nanno-fossil ooze. The bottom two cores, Cores 159-958A-13H and 14H, containa few coarse-grained turbidites with higher foraminifer and quartz con-tent.
Calcareous nannofossil biostratigraphy indicates that Site 958 con-tains a nearly complete sequence from Quaternary to upper Miocene (<6.5Ma). Zone NN17 and Subzone NN16b were not recognized, and may beabsent because of a hiatus, or may be condensed. Sedimentation ratesbased on nannofossil datums vary from 2.3 cm/k.y., between 0 and 20 mb-sf, to 1.3 cm/k.y., from 20 to 55 mbsf, and 2.8 cm/k.y., from 55 to 130 mb-sf.
Initial sampling for discrete paleomagnetic measurements was not de-tailed enough to determine a magnetostratigraphy for the site; however,high magnetic intensities correlated with the higher magnetic susceptibil-ities, and weakly magnetized samples correlated to the low magnetic sus-ceptibility interval in the middle of the section.
OPERATIONS
After drydock in Falmouth, England, the JOIDES Resolution de-parted at 1000 hr (local), 23 December 1994, and was underway forport call in Dakar, Senegal, to pick up scientists for the beginning ofLeg 159. At 1200 hr, 29 December, a short pre-site survey was startedfor Site 958 (Figs. 2, 3), with crossing lines over the crossing point ofGlomar Challenger Line 14 and Vema Line V-2908. A Datasonicsbeacon was dropped at 1328 hr, 29 December. After returning to thesite, an APC/XCB bottom-hole assembly (BHA) was rigged up and
1510 1515 1519Time (UTC)
1525 1530 1535 1540
5.1
2 5.2
Ió
5.3
Site 958
Figure 2. 3.5-kHz profile across Site 958.

SITE 958
5.0
5.1
I 5.2CD
5.3
5.4
5.5
1430Time (UTC)1500 1519 1530
fttëfffc•
.>,„,. * Λ * • t ^ ,i,
iSiw W f t 1 •^*"'
•'r<-f#«»! t r ^ • t ^ M V M t V M ^ '. . . •j•• . i '-'••ISPW f ) 7r".| 11T ' > I"! t - - - T - " ^ - " - ^ ! ^ * ^ - - • I . !
^ü^»V
Figure 3. Seismic profile across Site 958.
lowered to the seafloor. A delay occurred when the APC core barreldid not land successfully in the BHA and had to be pulled out. TheBHA had apparently been lowered into the sediment, resulting insome bent pipe, and thus stopped the core barrel from landing inside.After pulling up and rigging up a second BHA, the APC core barrelwas successfully landed and Core 159-958A-1H was taken at 0210hr, 31 December. Cores 159-958A-1H through 14H advanced to133.08 meters below seafloor (mbsf), with 99.65% recovery (Table1). Hole 958A is located at 23O59'94'N, 20°00.05'W. Because Core159-958A-1H had full recovery, a second hole was spudded to estab-lish the mud line. Core 159-958B-1H penetrated 8.7 m, and estab-lished the mud line at 3788.8 meters below rig floor (3778.3 metersbelow seafloor). After this core was taken, the drill pipe was pulledup, ending Site 958. The ship was under way at 0318 hr, 1 January1995, for Dakar.
CORE HANDLING PROCEDURES
When cores arrived on deck, they were cut into 1.5-m sections andtheir ends were capped. Whole round sections of 5 to 10 cm in lengthwere taken from Section 5 of Cores 159-958A-1H, 2H, 3H, 4H, 5H,8H, 11H, and 14H for interstitial pore water (IW) analyses. The IWsamples were sealed and stored with the cores until shipment afterLeg 159. Each section was then run through the multisensor track(MST) to log natural gamma, gamma-ray attenuation porosity evalu-ator (GRAPE) density, P-wave velocity, and magnetic susceptibility.Only Section 159-958A-8H-1 was split, run through the cryogenicmagnetometer, and demagnetized to 20 mT. Routine headspace sam-ples were taken for monitoring hydrocarbon safety, with only traceamounts of methane and ethane found. Numbering of site, holes,cores, and samples follows standard ODP procedures. All cores weresent to the Gulf Coast Repository (GCR) at Texas A&M Universityfor splitting, description, photography, and analyses. When the coresarrived at the GCR, the IW samples were squeezed and the pore wa-ters sealed and stored. These pore waters are available for sampling.
LITHOSTRATIGRAPHY
Sediment Core Description and Classification
Sediment core description followed the standard shipboard proce-dure, using the VCD program to produce barrel sheets. Symbols forsedimentary lithologies, structures, disturbance, and samples follow
Table 1. Coring summary for Site 958.
Core
159-958 A-1H2H3H4H5H6H7H8H9H10HUH12H13H14H
Total cored:
159-958B-1H
Total cored:
Date(December
1994)
3131313131313131313131313131
31
Time(UTC)
02350340043505350635073508400940104511451245133514301543
1810
Depth(mbsf)
0-9.59.5-1919-28.5
28.5-3838-47.5
47.5-5757-66.5
66.5-7676-85.5
85.5-9595-104.5
104.5-114114-123.5
123.5-133
0
Lengthcored (m)
9.59.59.59.59.59.59.59.59.59.59.59.59.59.5
133
8.7
8.7
Lengthrecovered Recovery
(m)
9.869.79.019.929.099.148.959.439.399.519.79.358.359.59
130.99
8.19
8.19
(%)
103.79102.1194.84
104.4295.6896.2194.2199.2698.84
100.11102.1198.4287.89
100.95
98.49
86.21
86.21
the standard ODP scheme as found in, for example, Ruddiman, Sarn-thein, Baldauf, et al. (1988; Leg 108) and the Initial Reports for Leg159 (this volume). The sediment classification scheme of ODP Leg108 (Ruddiman, Sarnthein, Baldauf, et al., 1988) was used for Site958. Color was determined using Munsell Soil Color Charts (MunsellSoil Color Charts, 1971).
Site 958 Holes A and B consist of mainly nannofossil ooze with ahigher foraminifer content in the upper 30-40 m. Coring disturbanceis minor except for the top sections of Cores 159-958A-1H, 7H, andthe bottom section of Core 159-958A-10H. Sediments are generallyslightly bioturbated. The section is assigned to one sedimentary unitwith two subunits that are distinguished mainly on foraminifer con-tent and the occurrence of turbiditic sediments (Fig. 4).
Unit I
Top: 0.0 mbsf, top of Core 159-958B-1HBase: 133.01 mbsf, base of Core 159-958A-14H
Subunit IA
Top: 0.0 mbsf, top of Core 159-958B-1HBase: 29.55 mbsf, interval 159-958A-4H-1, 105 cm

SITE 958
Zone 0Age (Ma)
2 4
4 0 -
8 0 -
1 2 0 -
Figure 4. Summary figure of lithologic components(based on smear-slide analysis), sedimentary units,calcareous nannofossil zonation, age, and sedimenta-tion rate curve.
-2.8 cm/k.y.
Lithology (%)60 80 100
Biosilica [
Quartz |1
Clay ffi
j • j j Foraminifers
^ Nannofossils
• s i Volcanic glass
y i Other
Core 159-958A-1H recovered a full core liner with 9.5 m of sed-iment; thus, the mud line was not adequately established in this core.After Hole 958A was cored, Core 159-958B-1H was taken a fewmeters away from Hole 958A to establish the mud line at 3778.3mbsl. Core 159-958B-1H recovered 8.7 m of sediment. The top foursections of Core 159-958B-1H consist of pink to brownish gray for-aminiferal nannofossil ooze, which does not occur in Core 958A-1H.Only small flecks of this pinkish brown sediment are seen in the topof Section 159-958A-1H-1. This suggests that at least 6 m of the sed-iment column are missing from above Core 159-958A-1H. Nanno-fossil biostratigraphy (see "Biostratigraphy" section, this chapter)also indicates that at least the upper 3.75 m of Core 159-958B-1Hwere not recovered in Hole 958A. Therefore, the top of lithologicUnit I is placed at the top of Core 159-958B-1H rather than Core 159-958A-1H.
Subunit IA consists in the upper 5 m of slightly bioturbated, pinkto brownish gray foraminifer nannofossil ooze with intervals exhib-iting slight variations in color. From 5 to 29.55 mbsf, this subunitconsists of mainly white to light gray, slightly bioturbated foramini-fer-bearing nannofossil ooze. Occurring within this sequence are sev-eral dark olive gray fining-upward sequences, up to 50 cm thick,which display sharp basal contacts, and consist of more silty to sandyquartz-rich lower parts overlain by a finer grained greenish gray dia-tom-bearing nannofossil ooze. The upper contacts appear gradationaland often contain a more or less distinct band of light greenish gray.Below Section 159-958A-2H-2, bands of greenish gray and gray fre-quently occur. The base of Subunit IA is placed at the base of the low-ermost foraminifer-rich olive gray silty layer in Section 159-958A-4H-1.
Subunit IB
Top: 29.55 mbsf, Section 159-958A-4H-1, 105 cmBase: 133.01 mbsf, Section 159-958A-14H-CC, 24 cm
Subunit IB consists mainly of mottled white, slightly bioturbatednannofossil ooze. Light greenish gray color banding of irregularthickness and distribution occurs from Cores 159-958A-4H through9H. From Cores 159-958A-1 OH down to the bottom of the section,distinct light gray layering occurs, with a more regular thickness of
10-20 cm below Core 159-958A-1 OH, and the interval spacing be-tween layers is between 50 and 100 cm. The distinct light gray layersare finer grained and more clayey than the white intervals. Bioturba-tion is more apparent where there are color changes between whiteand light gray. Small black specks and spots are dispersed throughoutthe sediments. Thin, black manganese banding occurs occasionallythroughout the section.
Two thin (3-10 cm) dark gray coarser grained, fining upward lay-ers occur in Cores 159-958A-13H and 14H. Soft sediment deforma-tion (characterized by folded or broken layering) occurs in Section159-958A-4H-1, and also in Sections 159-958A-13H-6 and 13H-7.Occasional elongate pyritized burrows are found in this subunit. InSection 159-958A-4H-5, there are two large (2-3 cm) clasts of finelygranular pyrite, mixed with nannofossil ooze.
Interpretation
The overall sequence at Site 958 is characterized by hemipelagicsedimentation. The olive gray fining upward layers in the upper fourcores of Hole 958A, and in Cores 159-958A-13H and 14H, are simi-lar to those found in Sites 950, 951, and 952 from the Madeira Abys-sal Plain, which are interpreted as organic-rich turbidites.
BIOSTRATIGRAPHY
Calcareous nannofossils were analyzed using smear slides. Thezonation of Martini and Muller (1986) modified by Young (1991)was used. The datums used for calculation of sedimentation rateswere correlated to the geochronologic time scale following Weaver,Schmincke, Firth, et al. (in press). Relative abundances and preserva-tion were recorded according to the scale used in Srivastava, Arthur,Clement, et al. (1987).
Calcareous nannofossil biostratigraphy indicates that Site 958contains a mostly complete sequence from Quaternary to upper Mi-ocene. Nannofossils are abundant and well preserved throughout.Nannofossil datums from this site are listed in Table 2. Zones areshown in Figure 4.

SITE 958
Table 2. Calcareous nannofossil datums and zones from Holes 958A and 958B.
Core, section,interval (cm)
Depth(mbsf)
Age(Ma) Genus Species Datum Zone
159-958B-lH-3,74
159-958A-1H-5, 1112H-CC, 313H-CC, 194H-1, 1064H-5, 895H-3, 1505H-5, 675H-5, 675H-5, 676H-CC, 266H-CC, 267H-3, 1508H-3, 15010H-3, 15010H-CC, 1811H-CC, 2214H-CC, 2614H-CC, 26
Hole 958A
3.74
7.1119.1928.0129.0734.9042.5044.6744.6744.6756.6356.6361.5071.0090.0095.01
104.69133.08133.08
Sample 159-958 A-1H-1,
0.26
0.460.831.471.601.95
2.442.612.763.773.624.014.395.045.345.566.50
0 cm)
Emiliania
PseudoemilianiaReticulofenestraHelicosphaeraCalcidiscusDiscoasterDiscoasterDiscoasterDiscoasterDiscoasterReticulofenestraSphenolithusDiscoasterAmaurolithusCeratolithusTriquetrorhabdulusDiscoasterAmaurolithusAmaurolithus
does not
huxleyi
lacunosaasanoiselliimacintyreibrouweritriradiatuspentaradiatussurculustamalispseudoumbilicaabiestamalistricorniculatusrugosusrugosusquinqueramusamplificusdelicatus
LO
HOHOHOHOHOHO AcmeHOHOHOHOHOLOHOLOHOHOLOLO
BaseNN21
TopNN19F
TopNN19CTopNN19BTopNN18BTopNN18ATopNN17TopNN16BTopNNlóATopNN15
TopNN14TopNN12
TopNNllB
BaseNNllB
Magneticsusceptibility
(S1). 0 10 20contain either Emiliania huxleyi or Pseudoemiliania lacunosa, and is
assigned to Zone NN20. Almost all zones and subzones down to Sub-zone NNllb occur in this hole. Zone NN17 and Subzone NN16bwere not observed, either because they have very narrow age rangesand may have been missed in sampling, or because there is a short hi-atus between Subzone NN16a and NN18a (Fig. 4) between 44.67 and42.5 mbsf (Samples 159-958A-5H-5, 67 cm, and 5H-3, 150 cm).Some other subzones were not differentiated because the markers arerare or have sporadic occurrences. Further shore-based work may re-fine the subzones in this section.
Hole 958B
The lowest occurrence of Emiliania huxleyi is in Sample 159-958B-1H-3, 74 cm. The base of Core 159-958B-1H lies above thehighest occurrence of P. lacunosa, and is assigned to Zone NN20.Because the top of Hole 958 A is in Zone NN20, and because of litho-logic differences between Cores 159-958A-1H and 159-958B-1H(see "Lithostratigraphy" section, this chapter), the most reasonableexplanation of missing Zone NN21 in Core 159-958A-1H is that thetop few meters of sediment were not recovered in this core. Becauseno nannofossil datums are common between Cores 159-958A-1Hand 159-958B-1H, no exact correlation can be made between them.However, the base of E. huxleyi at 3.74 mbsf in Hole 958B indicatesthat at least this much section is missing from the top of Hole 958A.
SEDIMENTATION RATES
Nannofossil datums and depths used for calculation of sedimenta-tion rates are found in Table 2. The top 19 m of Hole 958A has anapproximate sedimentation rate of 2.3 cm/k.y. (Fig. 4). Extrapolatingthe sedimentation rate curve to the top of Hole 958A indicates an ageof about 0.25 Ma at 0 mbsf. This supports the conclusion (above) thatat least 4 m of sediment, representing at least Zone NN21 (0.27 m.y.),was not recovered from the top of Hole 958A, but was recovered inHole 958B. Between 19 and about 61 mbsf, the sedimentation rate isapproximately 1.3 cm/k.y. At about 44.6 mbsf, three nannofossil da-tums coincide, and two short zones are missing between 44.6 and42.5 mbsf. A short hiatus may be represented in this interval, or thesample spacing may not be close enough to differentiate the missing
120
Figure 5. Volume magnetic susceptibility vs. depth from Hole 958A.
zones. Between about 61 and 133 mbsf, the sedimentation rate is ap-proximately 2.8 cm/k.y.
PALEOMAGNETICS
Shipboard paleomagnetic examination of Site 958 cores departedsomewhat from the usual shipboard routine. As usual, magnetic sus-ceptibility measurements were made on whole core sections when thecores were run through the MST track on board ship. Because thecores were not split on board ship, this precluded the usual measure-ments made with the pass-through cryogenic magnetometer. Howev-er, later, on shore, 11 pilot samples were collected in 7-cm3 plasticcubes for analysis of magnetic properties.
Magnetic Susceptibility
Figure 5 shows volume magnetic susceptibility measurementsmade with the Bartington MS-2 susceptibility meter on the MST.

SITE 958
Table 3. Paleomagnetic sample data. 159-958A-2H-6, 126-128 cm 159-958A-12H-4, 83-85 cm
Sample
159-958A-1H-4, 14-162H-4, 96-982H-6, 126-1283H-4, 47-494H-6, 106-1085H-2, 83-856H-4, 88-908H-4, 74-7610H-5, 55-5712H-4, 83-85
159-958B-1H-3, 67-69
Depth(mbsf)
4.6414.9618.2623.9737.0640.3352.8871.7492.05
109.83
3.67
NRM Incl.(mA/M) (degree)
6.905.357.614.130.090.076.90
12.898.577.18
11.31
38.6-45.1-41.5-38.0
61.8-20.1
52.169.954.160.9
34.0
N
7577257757
7
AF steps(mT)
15-6025-5015-6010-505-10
10-3010-5010-5015-4010-50
10-60
MAD(degree)
1.11.30.92.72.26.91.20.94.51.5
1.0
MDF(mT)
28.728.128.021.5
3.210.025.7
8.55.08.1
28.9
SIRM(mA/m)
1188.402052.641665.311102.66
31.2747.11
847.851270.272255.791050.64
2608.61
Notes: NRM = natural remanent magnetization; Incl. = inclination of mean remanentmagnetization determined using a linear least-squares fit tied to origin (see Kirsch-vink, 1980); N = number of measurements used to determine mean magnetizationvector; AF steps = alternating field demagnetization steps used for calculation ofmean magnetization vector; MAD = maximum angle of deflection, an error esti-mate (see Kirschvink, 1980); MDF = mean destructive field (i.e., AF demagnetiza-tion at which magnetization is reduced by half); SIRM = saturation isothermalremanent magnetization (at 1000 mT).
These data are raw and have not been corrected for the difference be-tween the calibration volume and core volume. Nevertheless, they ac-curately reflect relative variations in susceptibility within the sedi-ment column. A broad trend is notable with higher values (10 to 20S1) at the top and bottom of the section and low values (2 to 5 S1) be-tween about 28 to 49 mbsf and 67 and 85 mbsf. Furthermore, evi-dence of shorter wavelength variations, with amplitudes of about 10S1, are seen within the sections having higher susceptibilities. Thelonger wavelength variations probably represent epochal (over mil-lions of years) changes in sedimentary source, whereas the shorterwavelength variations are likely climate fluctuations with periods onthe order of tens of thousands of years, perhaps owing to glacial/in-terglacial cycles. A similar record was obtained from ODP Sites 721and 722, located at nearly the same latitude to the east of Africa (de-Menocal et al., 1991).
Paleomagnetic Properties
Magnetic measurements for the 11 discrete samples (Table 3)were made with a CTF cryogenic magnetometer. After the natural re-manent magnetization (NRM) was measured, each sample was de-magnetized using the alternating field (AF) technique at steps of 5,10, 15, 20, 25, and 30 mT, for all samples, and a subset of 35, 40, 50,60, 70, 80, and 100 mT, depending on the sample magnetizationstrength and the demagnetization performance (Fig. 6). After demag-netization, three samples had stepwise isothermal remanent magneti-zations (IRM) applied using a pulse magnetizer, up to fields of 1000to 1200 mT (Fig. 7). The remainder of samples were treated with anapplied field of 1200 mT, to yield a saturation remanent magnetiza-tion (SIRM).
Magnetization directions from the AF demagnetization experi-ments were plotted on orthogonal-vector (Zijderveld) plots. Meanmagnetization directions were calculated for each sample using mea-surements from a univectorial decay portion of the plot and fitting alinear least-squares line anchored to the origin (Kirschvink, 1980).Mean paleoinclinations are given in Table 3.
NRM intensities ranged over two and a half orders of magnitude,from 0.07 mA/m to 12.89 mA/m. Most samples are strongly magnet-ic compared to average deep-sea sediments. This suggests that thesediments contain a component derived from erosion of continentalrocks with abundant magnetic grains. The weakly magnetized sedi-ments are from Cores 159-958A-4H and 5H, coincident with themagnetic susceptibility low between 28 and 48 mbsf.
\—I—I—I—I—IE0.5 A/m
-0.5
- -1.0 A/m
NRM inc
159-958A-5H-2, 83-85 cmW,Z
15
mA/m
NNRM inc
Figure 6. Orthogonal vector (Zijderveld) plots of vector endpoints from AF
demagnetization of three samples from Hole 958A. At top are two strongly
magnetic samples from the top and bottom of the section. Below is a weakly
magnetic sample from the middle section of the hole. Note that the bottom
plot scales are marked in mA/m, whereas the top plots are in A/m. Open
symbols = the projection of the inclination on a vertical plane; filled symbols
= the projection of the declination on a horizontal plane.
o 958A-5H-2, 83-85 cmπ958A-1H-4, 14-16 cmΔ 958A-8H-4, 74-76 cm
200 400 600Field (mT)
800 1000
Figure 7. IRM acquisition curves for three samples from Hole 958A. Mea-
surements have been normalized by dividing with the SIRM value. Samples
159-958A-1H-4, 14-16 cm, and 159-958A-8H-4, 74-76 cm, from the top
and bottom of the section, give virtually indistinguishable IRM acquisition
curves. The other sample is from the weakly magnetic section of sediments
at middle depths in the hole.
The orthogonal vector plots indicate that all but one sample dis-played a stable characteristic remanence direction that was isolatedwith variable amounts of AF demagnetization. Strongly magneticsamples from the top and bottom of the section displayed isovectorialdecay throughout much of the demagnetization (Fig. 6). Reversedmagnetization samples (e.g., Sample 159-958A-2H-6, 126-128 cm)typically showed an overprint opposite in direction to the character-istic remanence, implying that the overprint is a present-day normalpolarity artifact. Overprints on reversed polarity samples typicallytook greater demagnetization (15 to 20 mT) to remove than did over-

SITE 958
prints from normal polarity samples (5 to 10 mT; Fig. 6). This is like-ly a result of a small difference between the direction of the overprintand the characteristic remanence direction.
The two weakly magnetic samples did not give directions thatwere as consistent as the other samples because their magnetic mo-ments were close to the sensitivity level of the magnetometer. Never-theless, their directions were sufficiently consistent (e.g., Sample159-958A-5H-2, 83-85 cm) to determine polarity and calculate amean direction (Table 3).
Mean destructive field (MDF) values ranged from 3.2 to 28.7 mT(Table 3). Lower values were obtained from the weakly magneticsamples and those from the bottom of the section. MDF values forsamples from the upper three cores were uniformly high. This distri-bution implies subtle differences in the magnetic grains in these sec-tions. The upper section appears to contain grains that are more mag-netically stable, with less propensity to acquire an overprint. Belowabout 25 mbsf, more of the magnetic grains are unstable. Sedimentsin the middle of the section do not have a high concentration of mag-netic grains and hence their magnetizations are weak. In contrast,sediments from the bottom of the section have higher NRM values,indicating a higher concentration of magnetic grains, but these mag-netizations are removed by low AF fields, indicating many of thegrains have low-coercivity magnetic moments. Figure 7 shows thatsamples from the top and bottom sections have very similar IRM ac-quisition curves, implying their magnetic minerals are similar. Thesesamples become saturated in fields of 150 mT or less, which is typicalof titanomagnetite. The one weakly magnetic sample for which anIRM acquisition curve was measured (Fig. 7) acquired most of itsSIRM in low applied fields; however, it required 600 mT to comewithin 3% of the SIRM. This implies that some of the magneticgrains in this sample have high magnetic coercivities. From the exist-ing data, it cannot be determined whether the high-coercivity grainsare only evident in the weaker samples owing to being overwhelmedby more magnetic lower-coercivity grains in the other samples (i.e.,they are ubiquitous, but masked in most places) or whether they arenot found in the other samples.
Figure 8 shows that SIRM values plotted vs. depth roughly mimicthe variation in magnetic susceptibility with high values in the topand bottom of the section. The lowest values were given by the twoweakly magnetic samples from Cores 159-958A-4H and 5H. Thissimilarity in pattern indicates that the concentration of magneticgrains dictates both the susceptibility and SIRM values. One differ-ence between the susceptibility and SIRM curves is that the samplesfrom Cores 159-958A-6H and 8H, at depths of 52.8 and 71.7 mbsf,gave relatively high SIRM values, whereas the susceptibilities fromthese depths are about the same on average as those which yieldedweakly magnetic samples. One possible explanation is that the mag-netic grains are somewhat different, but another plausible explana-tion is that the two samples from Cores 159-958A-6H and 8H wereinadvertently taken from small layers with higher susceptibility.
Magnetic Polarity
From the small number of samples measured, it is impossible toconstruct a magnetic stratigraphy; however, the results allow someobservations about magnetic polarities and the fidelity of the sedi-ments as magnetic recorders. Only three of 11 samples have reversedpolarity. In particular, all of the samples below 50 mbsf have normalpolarity. This is unexpected because this section spans approximately4 to 7 Ma, a period of abundant magnetic reversals (Cande and Kent,1992). Although the number of samples is small, so this observationmay not be statistically significant, it suggests that a drill-string over-print may not be completely removed from these samples. Anotherobservation in favor of this hypothesis is that the characteristic mag-netizations have steeper than expected inclinations. The geocentricaxial dipole field inclination for Site 958 is approximately 38°, and as
SIRM (mA/m)0 2000
120
Figure 8. SIRM vs. depth for samples from Hole 958A.
much as 15° to 20° variation from this mean is not unusual; however,the four deepest samples have inclinations of 52.1 ° to 69.9° (Table 3).
Above 50 mbsf, the samples are roughly half normal and half re-versed. The reversed polarity samples from Core 159-958A-2H im-ply that the Matuyama reversed chronozone is at that level. Giventhat the biostratigraphy indicates an age of about 0.7 to 1.0 Ma forthis section (see "Biostratigraphy" section, this chapter), this must bethe upper part of the Matuyama (Cande and Kent, 1992). The otherreversed sample, at a depth of about 40.3 mbsf, is probably from thebottom of the Matuyama chronozone.
CARBONATE GEOCHEMISTRY
Carbonate analyses were performed according to the methods ex-plained in Ruddiman, Sarnthein, Baldauf, et al. (1988). The entire se-quence sampled for carbonate analyses consists of nannofossil oozewith minor differences in other constituents. At distinct levels, olivegreen turbidites occur, varying in thickness from a few centimeters to0.3 m. Samples for carbonate analysis were taken from almost everysection. Results are shown in Table 4 and Figure 9. Carbonate contentvaries between 28% and 94%. The lower values from the upper partof the sequence correspond to dark olive green turbidites, presumablywith a higher organic carbon content. There is a general trend of in-creasing carbonate content with depth. Further analyses of mineralcontent (by XRD) and organic carbon and nitrogen will be reportedlater.
PHYSICAL PROPERTIES
Depth Scale and Completeness of Cored Section
As discussed in the "Operations" section (this chapter), the firstcore of Hole 958A had full recovery, so Core 159-958B-1H was tak-en to determine the mud line. Based on lithologic and biostratigraphicevidence, there is at least 6 m of sediment missing from above Core159-958A-1H. However, the continuous records of gamma-ray atten-uation density and magnetic susceptibility, as well as porosity andgravimetric density at Site 958 indicate that there is no overlap be-tween the two cores (Fig. 10). It is impossible to say exactly howmuch material is missing from above Core 159-958A-1H, and whichis the actual mbsf reference for Hole 958A data. We chose to illus-

SITE 958
Table 4. Carbonate analyses, Site 958.
SampleDepth(mbsf)
Carbonate
159-958 A-1H-2, 55-561H-3, 68-691H-4, 104-1051H-5, 113-1141H-6, 65-661H-7, 45-462H-1, 71-722H-2, 91-922H-3, 84-852H-4, 78-792H-5, 91-922H-6, 96-972H-7, 7-83H-1,64-653H-2, 94-953H-3, 94-953H-4, 85-863H-5, 77-783H-CC, 8-94H-1,88-894H-2, 106-1074H-3, 106-1074H-4, 68-694H-6, 55-564H-7, 54-555H-1, 123-1245H-2, 78-795H-3, 126-1275H-4, 105-1065H-5, 107-1085H-6, 42-436H-2, 42-436H-3, 80-816H-4, 105-1066H-5, 102-1036H-6, 83-847H-1,80-817H-2, 45-467H-3, 52-537H-4, 97-987H-5, 145-1467H-6, 91-928H-1,67-688H-2, 119-1208H-3, 67-688H-4, 11-128H-4, 15-168H-5, 66-678H-6, 66-679H-1,93-94
2.053.685.547.138.159.45
10.2111.9113.3414.7816.4117.9618.7719.6421.4422.9424.3525.7727.9029.3831.0632.5633.6836.5538.0439.2340.2842.2643.5545.0745.9249.4251.3053.0554.5255.8357.8058.9560.5862.4764.4565.4167.1769.1970.1771.1171.1573.1674.6676.93
62.7928.0762.9888.9685.7569.9474.1242.4272.0845.6872.1086.2183.7933.6772.8431.6639.1162.6282.1649.0675.0157.9762.8362.0480.4679.0874.6863.1585.4480.6078.9751.2862.7178.4183.0875.4456.5382.8280.1484.1554.5460.2386.3855.4086.2261.5734.8177.0384.5762.79
Carbonate (%)20 60 100
120 -
Figure 9. Carbonate percentage vs. depth in Holes 958A and 958B.
Sample
9H-2, 76-779H-2, 86-879H-4, 64-659H-5, 140-1411 OH-1,53-5410H-2, 144-14510H-3, 71-7210H-4, 95-9610H-5, 24-2510H-6, 56-57UH-1,89-9011H-3, 89-9011H-3, 101-10211H-3, 117-11811H-3, 131-13211H-5, 91-9211H-5, 101-10211H-6, 28-2912H-1,98-9912H-1, 120-12112H-3, 19-2012H-3, 55-5612H-3, 71-7212H-4, 130-13112H-5, 63-6412H-5, 90-9112H-6, 94-9513H-1,86-8713H-2, 60-6113H-2, 85-8613H-2, 100-10113H-3, 39-4013H-3, 53-5413H-5, 25-2613H-6, 120-12114H-1,69-7014H-2, 60-6114H-2, 89-9014H-4, 12-1314H-4, 34-3514H-4, 78-7914H-6, 87-88
159-958B-1H-1,39-401H-2, 39-401H-2, 80-811H-3, 39-401H-4, 30-311H-5, 81-82
Depth(mbsf)
78.2678.3681.1483.4086.0388.4489.2190.9591.7493.5695.8998.8999.0199.1799.31
101.91102.01102.78105.48105.70107.69108.05108.21110.30111.13111.40112.94114.86116.10116.35116.50117.39117.53120.25122.70124.19125.60125.89128.12128.34128.78131.87
0.391.892.303.394.806.81
Carbonate(%)
77.3264.8387.7060.8767.1637.4693.4980.7888.2873.6287.7361.1786.0752.6788.4769.8389.8688.0563.2383.1983.7658.3480.7563.4376.2378.2381.8286.4883.1954.1278.1167.6779.5146.3262.6176.8390.4470.7562.1581.4185.8594.81
70.9468.0166.9459.6653.4176.05
trate, in Figure 10, the data from the top of Site 958 using an arbitrary10-m offset for Core 159-958A-1H. In the following descriptions anddiscussion we refer to the official "mbsf values for Hole 958A eventhough the actual mbsf values are approximately 7-10 m deeper. Thisway, we ensure compatibility with the other data reported in thischapter.
Physical Properties UnitsDescription
Cores 159-958A-1H through 14H were measured on board forgamma-ray attenuation (GRAPE) density, natural gamma radiation,magnetic susceptibility and P-wave velocity. No further measure-ments were conducted on the ship, and the cores were shipped toODP/TAMU in College Station, TX.
Sampling for discrete physical properties measurements was doneduring the June 1995 description and sampling meeting. A ship-board-equivalent pycnometer and other equipment for gravimetricdensity determination were available at ODP/TAMU. We took 20-cm3 samples and determined the wet and dry mass to calculate watercontent. A freeze-drier was used instead of a convection oven tomake the dried samples available later for grain size and other analy-ses. Dry volumes of subsamples of 6-9 g were determined with thegas pycnometer. Because of the slightly different procedure and lab-oratory environment on shore, we could not use the IP/4D program
10

SITE 958
0
Natural gammatotal counts
(cps)
10 14 18
Magneticsusceptibility
(SI)5 15 25
Bulk density(g/cm 3)
1.2 1.4 1 .6
Porosity
60 70 80
12
16
201.5 2.5
Grain density(g/cm3)
Figure 10. Uppermost recovered section of Hole 958A (top part of figures)and Core 159-958B-1H data (bottom part of figures). The Hole 958A data,which lack a mud-line determination, are arbitrarily offset from "mbsf'depth by 10 m (see text). Note that the top records of the two holes cannot becorrelated (i.e., there is a coring gap of unknown lengths). Diamonds = graindensities, circles = porosities, squares = bulk densities determined by thegravimetric method. Solid symbols = Core 159-958B-1H data, open symbols= Hole 958A data. Natural gamma radiation apparently was not measured onCore 159-958B-1H.
used on the ship for moisture-density calculations. Grain densitieswere calculated directly from dry masses and volumes, while bulkdensities were calculated using the water content determined fromthe main sample. Salt corrections were applied appropriately (Table5).
The results show that gravimetric densities are higher thanGRAPE by about 0.15 to 0.2 g/cm3, or approximately 10%, whereasthe relative trends are very similar (Figs. 10, 11). This difference canbe explained by changes made to the GRAPE system (hardware orsoftware) on one of the recent legs.
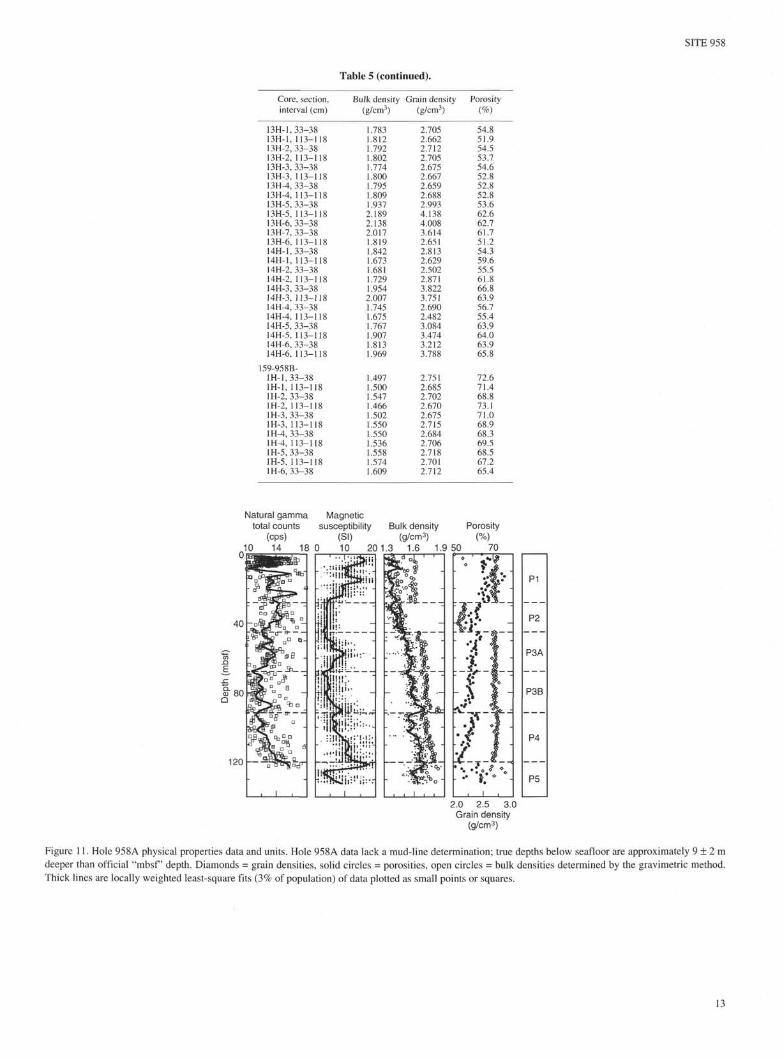
Based on the core physical properties, the sediment section recov-ered at Site 958 can be divided into five characteristic units (Fig. 11).Unit P-l (0-28.0 mbsf) shows the largest variations in porosity andnatural gamma radiation. Grain density varies strongly in the upperpart (0-8 mbsf), and porosity shows the most extreme fluctuation inthe middle part of the unit (8-22 mbsf). Grain density has a mean of2.63 g/cm3 and a relatively large standard deviation of 0.20 g/cm3 dueto the low values in the upper part of the unit. Fluctuations in bulkdensity are mostly due to variations in porosity. Magnetic suscepti-bility is relatively high at more than 10 S1 units, and natural gammaradioactivity fluctuates between the lowest (10 cps) and highest (17cps) values measured at Site 958.
Unit P-2 (28.0-45.0 mbsf) is the most anomalous interval in Hole958A. Porosity continues its steady decrease and shows less variabil-ity downhole from Unit P-1, but grain density and bulk density aresharply offset from the adjacent values. The low and constant graindensity (mean 2.15 g/cm3; standard deviation 0.04 g/cm3) and lack ofoffset in porosity indicate a drastic change in lithology. This is alsoreflected in the flat magnetic susceptibility curve at low values ofabout 5 S1 units (Fig. 11). Natural gamma radiation, however, still re-
mains relatively high in this interval. No anomaly in uranium, thori-um, or potassium content is observed.
In Unit P-3 (45.0-91.5 mbsf), grain density returns to a high meanvalue of 2.70 g/cm3 with a low standard deviation of 0.03 g/cm3. Po-rosity and bulk density resume their linear increase from values inUnit P-l, and porosity continues to decrease linearly. Bulk density,magnetic susceptibility, and natural gamma radiation show cyclicvariations. The unit is divided in two subunits based on a sharp de-crease in natural gamma radiation, which to a lesser degree occurswith all other properties as well. The bottom of Unit P-3 shows asharp offset in all properties except grain density. The increase inbulk density is mirrored and directly related to a decrease in porosity.
Unit P-4 (91.5-120.0 mbsf) properties show similar trends as inUnit P-3. Porosity and densities are also very similar in range. Graindensity is constant with a mean of 2.71 g/cm3 and a standard devia-tion of 0.08. Porosity decreases steadily, whereas bulk density in-creases. The transition to Unit P-5 is characterized by a sharp changein gradient of porosity and drop in magnetic susceptibility and bulkdensity. Unit P-5 shows high scatter in grain and bulk density, highgrain densities (mean: 3.21 g/cm3; standard deviation 0.56 g/cm3),and an anomalous porosity trend.
Discussion
The bulk of the Site 958 sediment section has a constant graindensity of about 2.7 g/cm3, which is in excellent agreement with thehigh carbonate content of these sediments (see "Lithostratigraphy"section, this chapter). Unit P-2 is an exception with a rather low graindensity of 2.15 g/cm3. This, and the disappearance of the magneticsusceptibility signal, indicate a significantly different sediment com-position in Unit P-2. The upper boundary of Unit P-2 correspondsreasonably well with the change from lithologic Subunit IA to IB (see"Lithostratigraphy" section, this chapter), and a change in sedimen-tation rate (see "Biostratigraphy" section, this chapter). Smear-slideanalysis indicates an interval of somewhat higher quartz and biosilicacontent within Unit P-2, which may, in part, explain the lower graindensities. However, further sedimentologic analysis is needed to re-solve this. The lower boundary of Unit P-2 correlates with a possiblehiatus (see "Biostratigraphy" section, this chapter).
The sharp offset in all physical properties at 91.5 m suggests ei-ther a major paleoceanographic change or an erosional unconformity.The physical character could be indicative of a cemented horizon thatprevents pore-water diffusion upsection. Indeed, a hiatus may be in-terpreted at this level from the tentative sedimentation rate curve (see"Biostratigraphy" section, this chapter). The sediments correlativewith Unit P-4 show a distinct, light-gray, clayey layering not ob-served in higher units (see "Lithostratigraphy" section, this chapter).
Finally, another significant boundary has been penetrated at 120m. Grain density values as well as the porosity trend are anomalousin Unit P-5. Olive gray, fining-upward layers were observed in thisunit as well as in Unit P-l (see "Lithostratigraphy" section, this chap-ter). They are tentatively interpreted as organic-rich turbidites and areprobably the cause of relatively high scatter in physical properties inthese intervals.
REFERENCES
Cande, S.C., and Kent, D.V., 1992. A new geomagnetic polarity time scalefor the Late Cretaceous and Cenozoic. J. Geophys. Res., 97:13917-13951.
deMenocal, P., Bloemendal, J., and King, J., 1991. A rock-magnetic recordof monsoonal dust deposition to the Arabian Sea: evidence for a shift inthe mode of deposition at 2.4 Ma. In Prell, W.L., Niitsuma, N., et al.,Proc. ODP, Sci. Results, 117: College Station, TX (Ocean Drilling Pro-gram), 389^407.
Kirschvink, J.L., 1980. The least-squares line and plane and the analysis ofpalaeomagnetic data. Geophys. J. R. Astron. Soc, 62:699-718.
11
SITE 958
Martini, E., and Muller, C , 1986. Current Tertiary and Quaternary calcare-ous nannoplankton stratigraphy and correlations. Newsl. Stratigr., 16:99-112.
Munsell Soil Color Charts, 1971. Baltimore (Munsell Color).Ruddiman, W., Sarnthein, M., Baldauf, J., et al., 1988. Proc. ODP, Init.
Repts., 108 (Sections 1 and 2): College Station, TX (Ocean Drilling Pro-gram).
Srivastava, S.P., Arthur, M., Clement, B., et al, 1987. Proc. ODP, Init.Repts., 105: College Station, TX (Ocean Drilling Program).
Weaver, P.P.E., Schmincke, H.-U., Firth, J.V., et al., in press. Proc. ODP,Init. Repts., 157: College Station, TX (Ocean Drilling Program).
Young, LR., 1991. A Quaternary nannofossil range chart. INA Newsl., 13:14-17.
Ms 159TIR-001
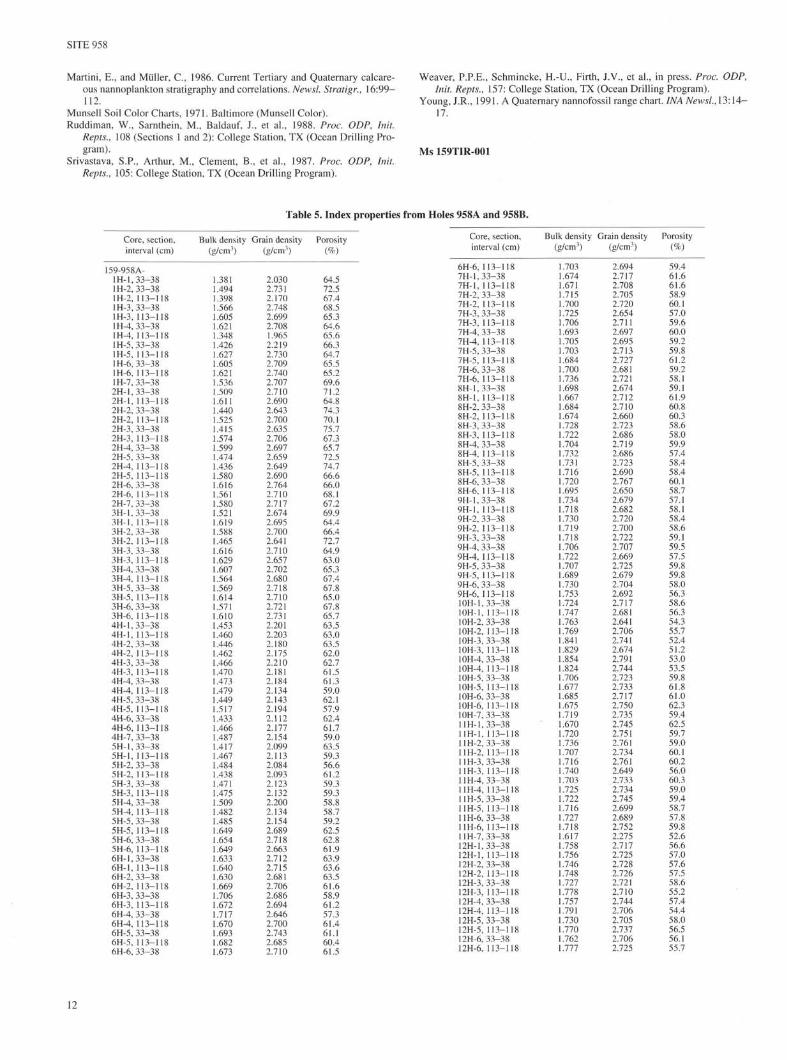
Table 5. Index properties from Holes 958A and 958B.
Core, section,interval (cm)
159-958A-1H-1,33-381H-2, 33-381H-2, 113-1181H-3, 33-381H-3, 113-1181H-4, 33-381H-4, 113-1181H-5, 33-381H-5, 113-1181H-6, 33-381H-6, 113-1181H-7, 33-382H-1,33-382H-1, 113-1182H-2, 33-382H-2, 113-1182H-3, 33-382H-3, 113-1182H-4, 33-382H-5, 33-382H-4, 113-1182H-5, 113-1182H-6, 33-382H-6, 113-1182H-7, 33-383H-1,33-383H-1, 113-1183H-2, 33-383H-2, 113-1183H-3, 33-383H-3, 113-1183H-4, 33-383H-4, 113-1183H-5, 33-383H-5, 113-1183H-6, 33-383H-6, 113-1184H-1,33-384H-1, 113-1184H-2, 33-384H-2, 113-1184H-3, 33-384H-3, 113-1184H-4, 33-384H-4, 113-1184H-5, 33-384H-5, 113-1184H-6, 33-384H-6, 113-1184H-7, 33-385H-1, 33-385H-1, 113-1185H-2, 33-385H-2, 113-1185H-3, 33-385H-3, 113-1185H-4, 33-385H-4, 113-1185H-5, 33-385H-5, 113-1185H-6, 33-385H-6, 113-1186H-1,33-386H-1, 113-1186H-2, 33-386H-2, 113-1186H-3, 33-386H-3, 113-1186H-4, 33-386H-4, 113-1186H-5, 33-386H-5, 113-1186H-6, 33-38
Bulk density(g/cm3)
1.3811.4941.398
::•
:
:
:
:
.566
.605
.621
.348
.426
.627
.605
.621
.536
.509
.611
.440
.525
.415
.574
.599
.474
.436
.580
.616
.561
.580
.5211.6191.5881.4651.6161.6291.6071.5641.5691.6141.5711.6101.4531.4601.4461.4621.4661.4701.4731.4791.4491.5171.4331.4661.4871.4171.4671.4841.4381.4711.4751.5091.4821.4851.6491.6541.6491.6331.6401.6301.6691.7061.6721.7171.6701.6931.682.673
Grain density(g/cm3)
2.0302.7312.1702.7482.6992.7081.9652.2192.7302.7092.7402.7072.7102.6902.6432.7002.6352.7062.6972.6592.6492.6902.7642.7102.7172.6742.6952.7002.6412.7102.6572.7022.6802.7182.7102.7212.7312.2012.2032.1802.1752.2102.1812.1842.1342.1432.1942.1122.1772.1542.0992.1132.0842.0932.1232.1322.2002.1342.1542.6892.7182.6632.7122.7152.6812.7062.6862.6942.6462.7002.7432.6852.710
Porosity(%)
64.572.567.4
65.364.665.666.364.765.565.269.671.264.874.370.175.767.365.772.574.766.666.068.167.269,964.466.472.764.963.065.367.467.865.067.865.763.563.063.562.062.761.561.359.062.157.962.461.759.063.559.356.661.259.359.358.858.759.262.5
61.963.963.663.561.658.961.257.361.461.160.461.5
Core, section,interval (cm)
6H-6. 113-1187H-1,33-387H-1, 113-1187H-2, 33-387H-2, 113-1187H-3, 33-387H-3, 113-1187H-4, 33-387H-4, 113-1187H-5, 33-387H-5, 113-1187H-6, 33-387H-6, 113-1188H-1,33-388H-1, 113-1188H-2. 33-388H-2, 113-1188H-3, 33-388H-3, 113-1188H-4, 33-388H-4, 113-1188H-5, 33-388H-5, 113-1188H-6, 33-388H-6, 113-1189H-1, 33-389H-1, 113-1189H-2, 33-389H-2, 113-1189H-3, 33-389H-4, 33-389H-4, 113-1189H-5, 33-389H-5, 113-1189H-6, 33-389H-6, 113-11810H-1,33-3810H-1, 113-11810H-2, 33-3810H-2, 113-11810H-3, 33-3810H-3, 113-11810H-4, 33-3810H-4, 113-11810H-5, 33-3810H-5, 113-11810H-6, 33-3810H-6, 113-11810H-7, 33-3811H-1, 33-3811H-1, 113-11811H-2, 33-3811H-2, 113-11811H-3, 33-3811H-3, 113-11811H-4, 33-3811H-4, 113-11811H-5, 33-3811H-5, 113-11811H-6, 33-3811H-6, 113-11811H-7, 33-3812H-1,33-3812H-1, 113-11812H-2, 33-3812H-2, 113-11812H-3, 33-3812H-3, 113-11812H-4, 33-3812H-4, 113-11812H-5, 33-3812H-5, 113-11812H-6, 33-3812H-6, 113-118
Bulk density(g/cm3)
1.7031.6741.6711.7151.700
::::::::
.725
.706
.693
.705
.703
.684
.700
.736
.698
.667
.684
.674
.728
.722
.704
.732
.731
.716
.720
.695
.734
.718
.730
.719
.718
.706
.7221.7071.6891.7301.7531.7241.7471.7631.7691.8411.8291.8541.8241.706.677
1.6851.6751.719.670
1.7201.736
:.
::
.707
.716
.740
.703
.725
.722
.7161.727.718
1.6171.758.756
1.7461.7481.727.778
1.7571.7911.7301.7701.762.111
Grain density(g/cm3)
2.6942.7172.7082.7052.7202.6542.7112.6972.6952.7132.7272.6812.7212.6742.7122.7102.6602.7232.6862.7192.6862.7232.6902.7672.6502.6792.6822.7202.7002.7222.7072.6692.7252.6792.7042.6922.7172.6812.6412.7062.7412.6742.7912.7442.7232.7332.7172.7502.7352.7452.7512.7612.7342.7612.6492.7332.7342.7452.6992.6892.7522.2752.7172.7252.7282.7262.7212.7102.7442.7062.7052.7372.7062.725
Porosity(%)
59.461.661.658.960.157.059.660.059.259.861.259.258.159.161.960.860.358.658.059.957.458.458.460.158.757.158.158.458.659.159.557.559.859.858.056.358.656.354.355.752.451.253.053.559.861.861.062.359.462.559.759.060.160.256.060.359.059.458.757.859.852.656.657.057.657.5ss.n55.257.454.458.056.556.155.7
12
SITE 958
Table 5 (continued).
Core, section,interval (cm)
13H-1, 33-3813H-1, 113-11813H-2, 33-3813H-2, 113-11813H-3, 33-3813H-3, 113-11813H-4, 33-3813H-4, 113-11813H-5, 33-3813H-5, 113-11813H-6, 33-3813H-7, 33-3813H-6, 113-11814H-1, 33-3814H-1, 113-11814H-2, 33-3814H-2, 113-11814H-3, 33-3814H-3, 113-11814H-4, 33-3814H-4, 113-11814H-5, 33-3814H-5, 113-11814H-6, 33-3814H-6, 113-118
159-958B-1H-1,33-381H-1, 113-1181H-2, 33-381H-2, 113-1181H-3, 33-381H-3, 113-1181H-4, 33-381H-4, 113-1181H-5, 33-381H-5, 113-1181H-6, 33-38
Bulk density(g/cm3)
.783
.812
.792
.802
.774
.800
.795
.809
.9372.1892.1382.0171.8191.8421.6731.6811.7291.9542.007
::
:
.745
.675
.767
.907
.813
.969
.497
.500
.547
.466
.502
.550
.550
.536
.558
.574
.609
Grain density(g/cm3)
2.7052.6622.7122.7052.6752.6672.6592.6882.9934.1384.0083.6142.6512.8132.6292.5022.8713.8223.7512.6902.4823.0843.4743.2123.788
2.7512.6852.7022.6702.6752.7152.6842.7062.7182.7012.712
Porosity(%)
54.851.954.553.754.652.852.852.853.662.662.761.751.254.359.655.561.866.863.956.755.463.964.063.965.8
72.671.468.873.171.0
68.369.568.567.265.4
Natural gamma Magnetictotal counts susceptibility Bulk density Porosity
(cps) (S1) (g/cm3) (%)
10 14 18 0 10 20 1.3 1.6 1.9 50 70
40
α> 80Q
120
P1
P2
P3A
P3B
P4
P5
2.0 2.5 3.0
Grain density(g/cm3)
Figure 11. Hole 958A physical properties data and units. Hole 958A data lack a mud-line determination; true depths below seafloor are approximately 9 ± 2 m
deeper than official "mbsf' depth. Diamonds = grain densities, solid circles porosities, open circles = bulk densities determined by the gravimetric method.
Thick lines are locally weighted least-square fits (3% of population) of data plotted as small points or squares.
13