1 sims 247: information visualization and presentation marti hearst dec 6, 2005
Post on 22-Dec-2015
216 views
TRANSCRIPT

1
SIMS 247: Information Visualization and PresentationMarti Hearst
Dec 6, 2005

2
Today
• Visualization on Small Devices• Course Summary• Course Evaluations

3
How Can Infoviz Help PDAs?

4
Zooming
• Focus+Context Visualization with Flip Zooming and the Zoom
Browser LE Holmquist - CHI Extended Abstracts, 1997

5Slide adapted from Patrick Baudisch's
Halo: A Technique for Visualizing Off-Screen
Locations P. Baudisch, R Rosenholtz - CHI’03

6Slide adapted from Patrick Baudisch's
the problem
+

7Slide adapted from Patrick Baudisch's
streetlamps• aura visible from distance• aura is round• overlapping auras aggregate• fading of aura indicates distance
what they changed• smooth transition sharp edge• disks rings• dark background light background

8Slide adapted from Patrick Baudisch's
Usability Study Interfaces
arc/arrow fading offscale 110-300m/cmmap as backdropreadability oksame selectable
size
hypothesis:
halo faster
halo ring distance from display border
legend
9Slide adapted from Patrick Baudisch's
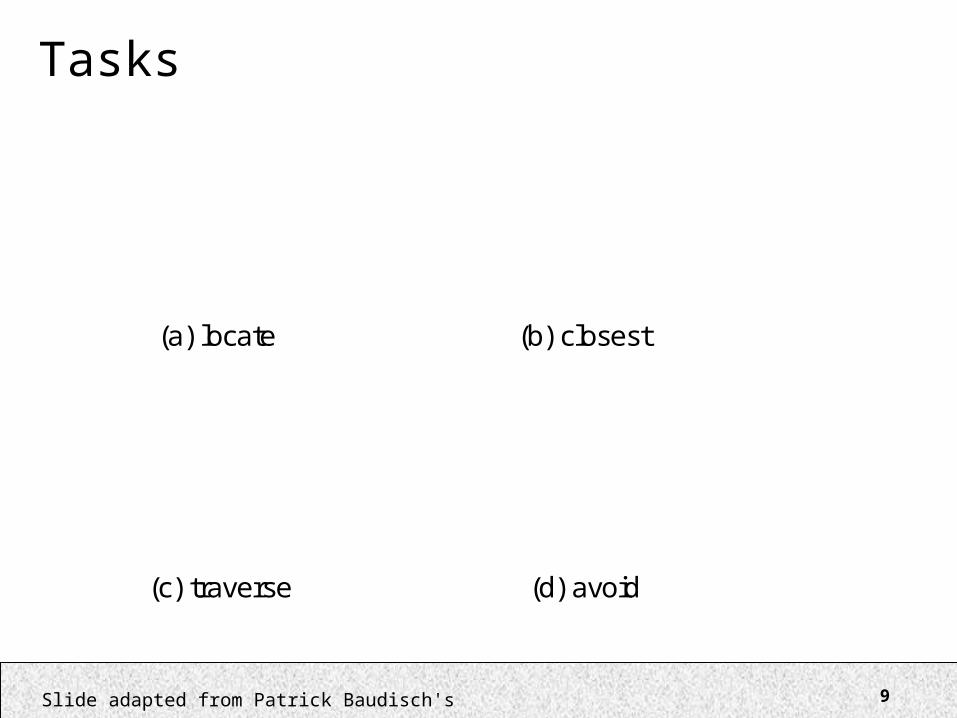
Tasks
(a) locate (b) closest
(d) avoid(c) traverse

10Slide adapted from Patrick Baudisch's
Procedure
• 12 participants• within subject design, counterbalanced• four training maps per interface/task,
then eight timed maps• questionnaire

11Slide adapted from Patrick Baudisch's
task completion time
Task Arrow interface Halo interface
Locate 20.1 (7.3) 16.8 (6.7)
Closest 9.9 (10.1) 6.6 (5.3)
Traverse 20.6 (14.1) 16.8 (8.7)
Avoid 9.2 (4.7) 7.7 (5.8)
0
5
10
15
20
25
Locate Closest Traverse Avoid
Arrow interface
Halo interface
33%
16%
12Slide adapted from Patrick Baudisch's
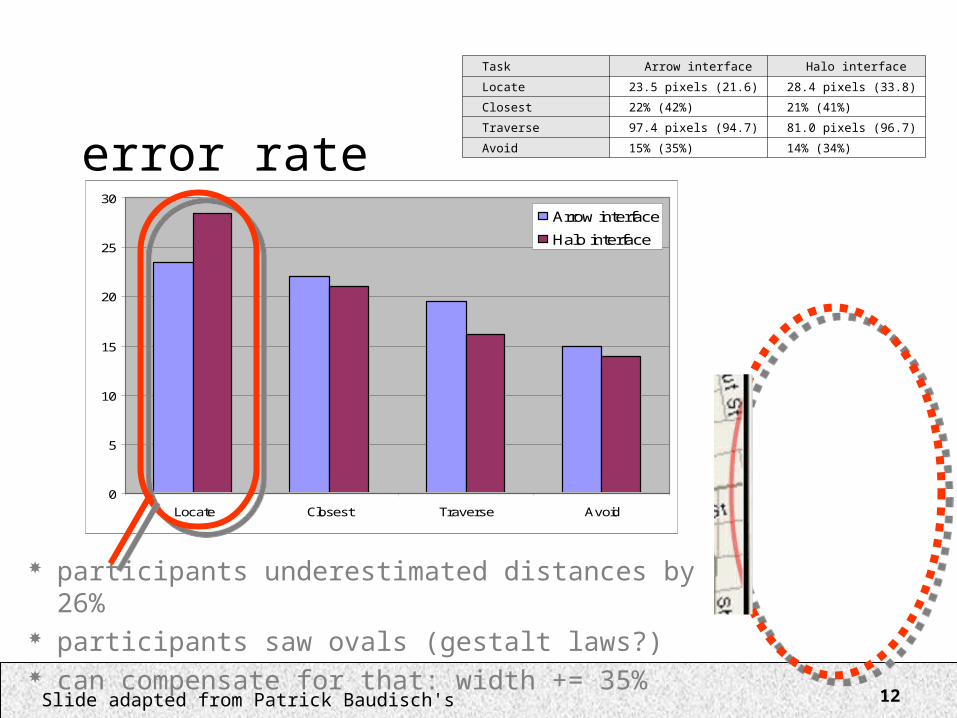
error rate
Task Arrow interface Halo interface
Locate 23.5 pixels (21.6) 28.4 pixels (33.8)
Closest 22% (42%) 21% (41%)
Traverse 97.4 pixels (94.7) 81.0 pixels (96.7)
Avoid 15% (35%) 14% (34%)
0
5
10
15
20
25
30
Locate Closest Traverse Avoid
Arrow interface
Halo interface
participants underestimated distances by 26% participants saw ovals (gestalt laws?) can compensate for that: width += 35%

13Slide adapted from Patrick Baudisch's
0
1
2
3
4
5
6
7
8
9
Locate Closest Traverse Avoid
Arrow interface
Halo interface
subjective preference

14Slide adapted from Patrick Baudisch's
results
• halo 16%-33% faster than arrows– no split attention– distortion-free space– scale independent– no need to annotate distance– perceive all rings at once
[treisman & gormican]
• limitation: max number or rings
> back to large displays

15
Infoviz with Input• ZoneZoom:
– Input technique that lets users traverse large information spaces on smartphones
– Segments a given view of an information space into 9 segments, accessed via number keypad
ZoneZoom: Map Navigation for Smartphones with Recursive View Segmentation DC Robbins, E Cutrell, R Sarin, E Horvitz - Proceedings of AVI 2004

16
ZoneZoom
http://research.microsoft.com/~cutrell/AVI-ZoneZoom.pdf

17
ZoneZoom
http://research.microsoft.com/~cutrell/AVI-ZoneZoom.pdf

18
More Input
AppLens and LaunchTile: Two Designs for One-Handed Thumb Use on Small DevicesAK Karlson, BB Bederson, J SanGiovanni, CHI 2005
19
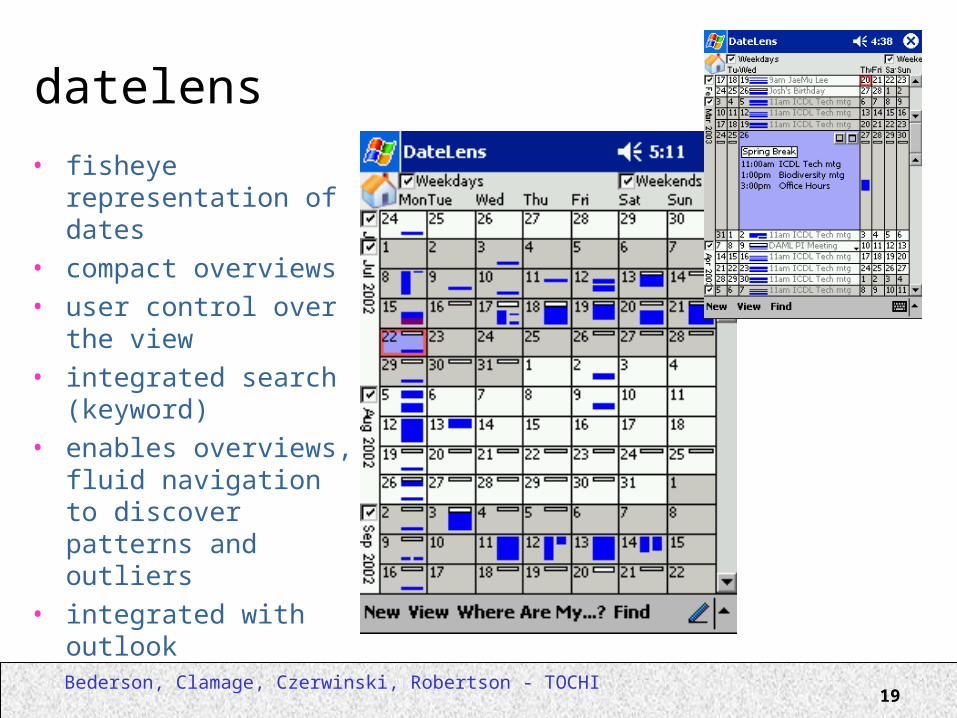
datelens
• fisheye representation of dates
• compact overviews • user control over the
view• integrated search
(keyword) • enables overviews,
fluid navigation to discover patterns and outliers
• integrated with outlook
Bederson, Clamage, Czerwinski, Robertson - TOCHI

20
Visualization of the threads in two discussion forums using the Thread Mode. Size proportional to number of posts in the thread and color proportional to thread activity.
Using Treemaps to Visualize Threaded Discussion Forums on PDAsB Engdahl, M Koeksal, G Marsden – CHI’05 Late Breaking

21
Treemap Threads
• Small Usability Study– 6 participants– Tasks:
• Find 3 largest threads; which of these has most recent posts?• Do the opposite• VERY tailored to their design• Compared to an unspecified text-based version
– Faster than text unless text sorted on size (!)– Size of squares got most attention– Color was not understood as indicating thread activity until
pointed out– Participants wanted the name of the forum labeled within
each rectangle– Subjective? Not reported

22
Course Summary

23
Course OverviewThe Evolution of the Treemap

24
information visualization
• Leverage highly-developed human visual system to achieve rapid uptake of abstract information.
1.2 b/s (Reading)2.3 b/s (Pictures)
(slide “borrowed” from PARC User Interface Research Group)

25
interactive tasks [Shneiderman]• Overview
– Get an overview of the collection• Zoom
– Zoom in on items of interest• Filter
– Remove uninteresting items• Details on demand
– Select items and get details• Relate
– View relationships between items• History
– Keep a history of actions for undo, replay, refinement• Extract
– Make subcollections

26
characterizing the visualization
• x-axis: year of release (quantitative)• y-axis: popularity (quantitative)• color: genre (nominal)• dynamic query filters
– title (nominal)– actor (nominal)– actress (nominal)– director (nominal)– length (quantitative)– rating (ordinal)

27
basic types of visual encodings
• “Retinal” properties– spatial position (e.g., x-y axes)– size– shape– color– orientation– texture
• “Gestalt” properties– connectivity– grouping (e.g., enclosure)
• Animation– view transitions– animated elements
Later in the semester we’ll examine guidelines on when to apply these mappings…

Accuracy Ranking of Quantitative Perceptual TasksEstimated; only pairwise comparisons have been validated
(Mackinlay 88 from Cleveland & McGill)

Gestalt PropertiesConnectedness
Slide adapted from Tamara Munzner

30

31
Steve Few’s Elegant Designs

32
Steve Few’s Elegant Designs

33
Steve Few’s Analysis Advice

34
COLOR

Brushing and Linking

36
Multi-Dimensional Data Visualization

37
Panning and Zooming

38
Overview + Detail

39Slide adapted from Fengdong Du
Distortion-Based Techniques
Image from Leung & Apperly ’94
40
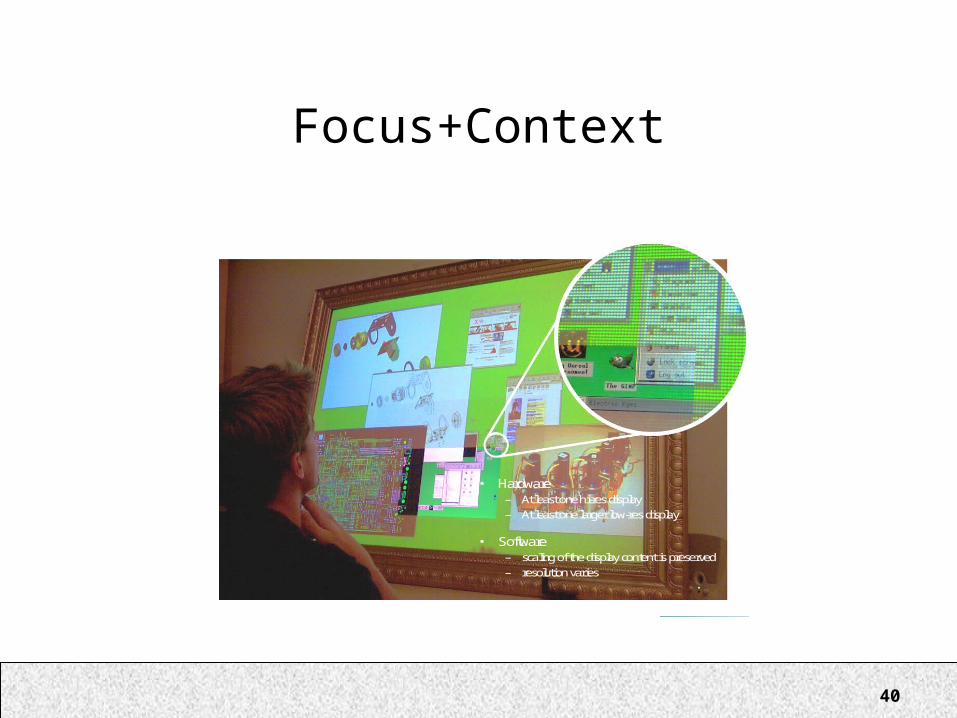
Focus+Context
• Hardware– At least one hi-res display
– At least one larger low-res display
• Software– scaling of the display content is preserved
– resolution varies

41
Cartoon-Style Animation

42
3D
http://research.microsoft.com/ui/TaskGallery/index.htm 23Robertson et al., 2000

43
3D vs. 2D

44
Martin Wattenberg (!)

45
Filter Layout Color Size
Abstract DataNodes, Edges
Visual AnaloguesVisualItems in ItemRegistry
filtering
DisplayInteractive Display
Renderers ActionList RendererFactory
DATA VISUAL FORM
I/O Libraries
UI Controls
User
renderingVIEW
Software Architectures and Toolkits

46
Visualizing Temporal Relations
47
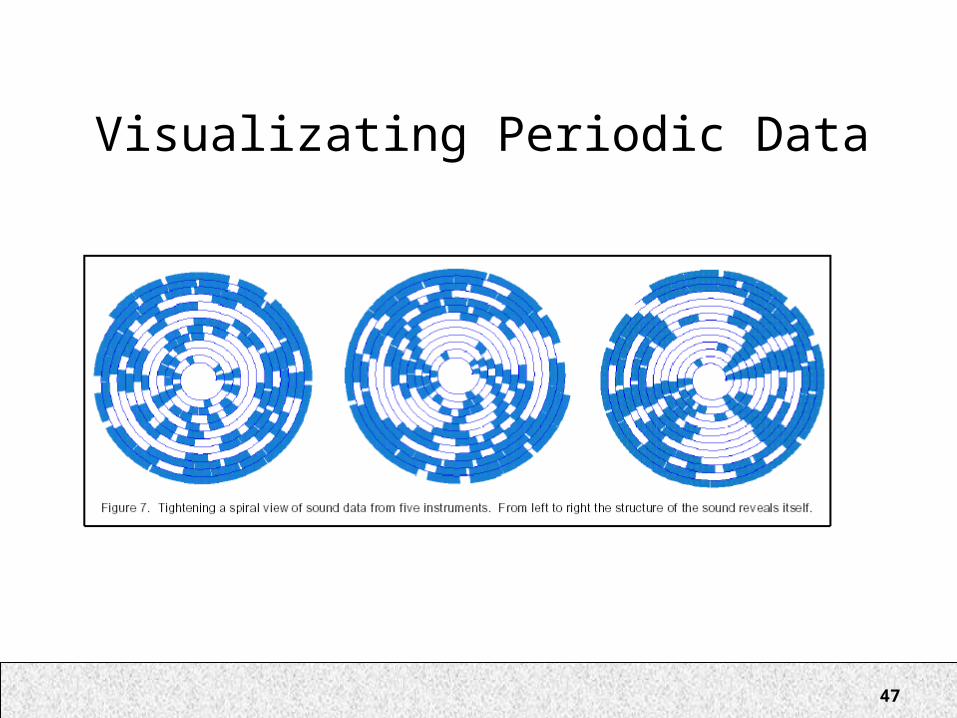
Visualizating Periodic Data

48
Visualizing Video
49
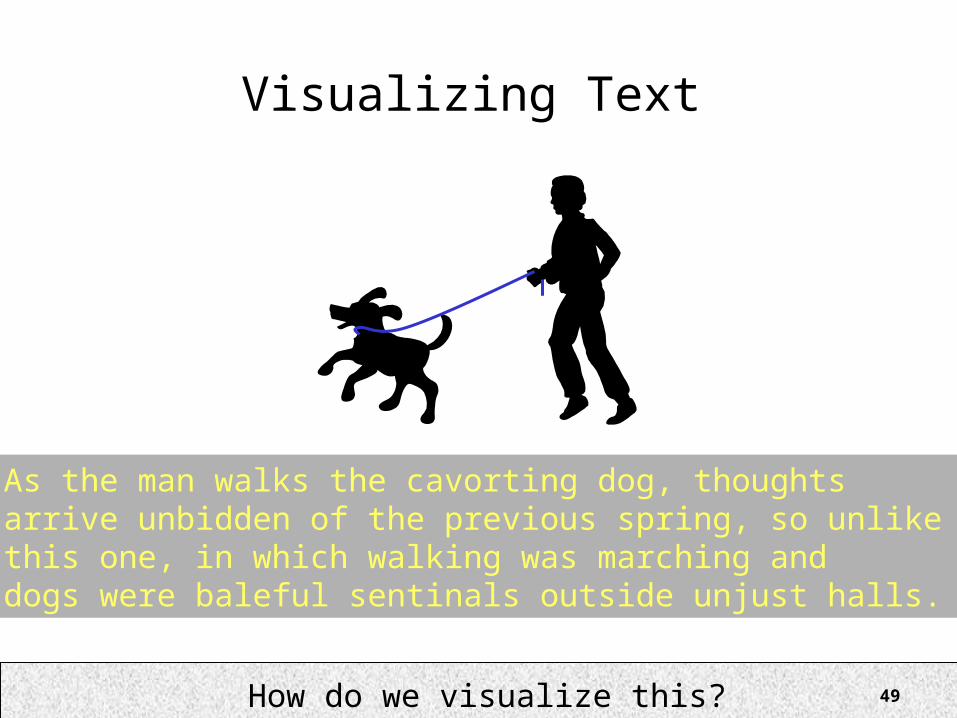
Visualizing Text
As the man walks the cavorting dog, thoughtsarrive unbidden of the previous spring, so unlikethis one, in which walking was marching anddogs were baleful sentinals outside unjust halls.
How do we visualize this?

50
Visualizing Search

51
Trees, Networks, and Matrices

52
Social Networks

53
Visualization and the Arts

54
Evaluating Visualizations

55
Your Projects!