1 sarasota health care access: 2007-2009 impacts and opportunities linda l. stone, ph.d. program...
TRANSCRIPT

1
Sarasota Health Care Access: 2007-2009Impacts and Opportunities
Linda L. Stone, Ph.D.Program Administrator
Melanie Michael, M.S., ARNP-CDivision Director
Clinical & Community Health Services
Sarasota County Health Department

2
Purpose
• Evaluate the impact of Sarasota Health Care Access (SHCA) on target population
• Emergency room utilization• In-patient hospitalizations (admissions)
• Establish baseline reference measures for future comparison
• Improve model specification• Support the development of “best
practices” and benchmarks for diversion/prevention projects

3
SHCA (LIP) Referrals 7/1/07 – 10/31/09(n=4,726)
0%
0%
0%
0%
0%
1%
1%
1%
1%
2%
47%
20%
19%
3%
3%
2%
Fawcett Memorial Hospital
Lakewood Ranch Medical Center -InPatientEnglewood Hospital In-Patient
Lakewood Ranch Medical Center - ER
Peace River Medical Center - InPatient
Fawcett Memorial Hospital In-Patient
Fawcett Memorial Hospital - ER
Peace River Medical Center - ER
Englewood Hospital - ER
Venice Regional MC In-Patient
Doctors Hospital - ER
Doctors Hospital - In-Patient
Other
Sarasota Memorial Hospital In-Patient
Sarasota Memorial Hospital - ER
Venice Regional MC - ER
Sarasota Memorial Hospital Accounts for approximately 39% of SHCA referrals

4
Sarasota Health Care Access
Sarasota Health Care
Access
Primary Care Capacity
Expansion
Chronic Disease
Management
Community Outreach
Eligibility Expansion
Hospital Diversion

5
Evaluation Model and Methods
• Retrospective “community intervention” model
• Time series • Before – after within patient group
comparison

6
Methods/Procedures
• Patient group and data set stratification– 1,660 patients referred to SHCA from Sarasota Memorial
Hospital (SMH) between 7/1/07 and 10/31/09 – Cross matched – Final patient population size: 1,602
• Categories– Emergency room visits– In-patient admissions/stays
• Calculations/analysis– Before and after utilization rate per 1,000 patient days– Mean (M) difference– Annualized projection of utilization and financial impact
• Subset evaluation– Patients with number of ER or in-patient admissions at or
below 95th percentile based on frequency of ER visits or in-patient admissions

7
Patient Population: Descriptive Statistics
• Age – Range: <1 -
81– Mean: 40– Median: 43– Mode: 45
• Race– White: 77%– Black: 20%– Other: <2%– Unknown:
<2%
• Gender– Male: 53%– Female: 45%– Unreported: 2%
• Payer Source– Uninsured: 72%– Medicaid: 16%– Medicaid HMO: 9%– Medicare: 2%– Other: 1%

8
SCHD Primary Care Program Utilization:Unduplicated Patients by Program
1545
569
3758
1398
4021
5766
1581552
4047
1677
4567
6416
1614463
3678
1790
4548
7985
1942421
4162
2455
5414
12027
2103224
4040
2464
6188
14429
2247345
3800
2673
7382
17074
0%
20%
40%
60%
80%
100%
FY 03-04 FY 04-05 FY 05-06 FY 06-07 FY 07-08 FY 08-09
Program 02 - Sexually Trans. Dis. Program 03 - AIDS
Program 23 - Family Planning Program 25 - IPO
Program 29 - Child Health Program 37 - Adult Health

9
Analysis Results: ER Visits
Pre-referral Post-referral
ER Visit Subgroup
M visits/ 1,000 days
95% CI
M visits/ 1,000 days
95% CI
M difference/1,000 days
All (n=1,389)
4.53 4.23-4.79 4.34 3.82 – 4.81
0.19
95th Percentile*(n=1,323)
3.85 3.71 – 3.97
3.35 3.10 – 3.58
0.50**
*sample limited to patients with number of ER visits at or below 95th percentile based on visit frequency
** Significant value (p < 0.05)

10
Analysis Results: ER Visits
Annual decrease in ER
visits/year
Average charge/ER
visit*
Estimated reduction/year
241.4 $1,212 $292,577
ER visit subgroup
Difference/1,000 days
Decrease in
visits/year
Range: Decrease in visits/year
All 0.19 NS NS
95th% 0.50** 241.4 62.8-420.1
*Source: AHCA/http://www.floridahealthfinder.gov/
** Significant value (p < 0.05)

11
Analysis Results: In-patient Admissions
Pre-referral Post-referralIn-patient admission subgroup
M admissions
/ 1,000 days
95% CI
M admissions
/ 1,000 days
95% CI
M difference/1,000 days
All (n=879)
2.75 2.75 - 2.76
1.47 1.27 - 1.65
1.28**
95th Percentile*(n=851)
2.62 2.60 – 2.64
1.15 1.03 – 1.27
1.47**
*sample limited to patients with number of admissions at or below 95th percentile based on frequency of admission
**Significant value (p < 0.05)

12
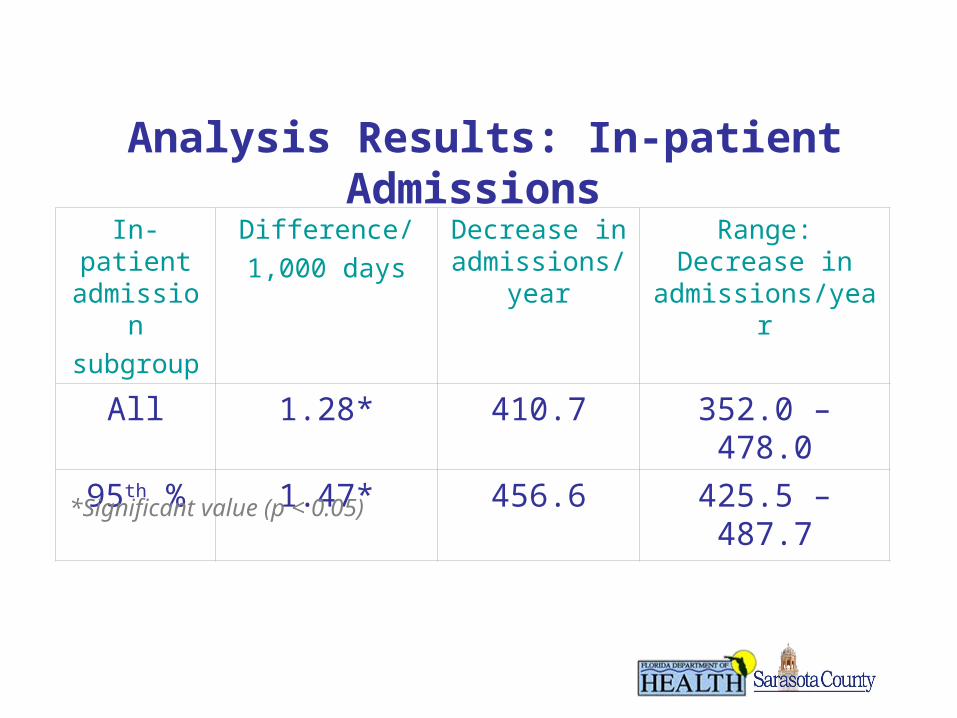
Analysis Results: In-patient Admissions
In-patient admissionsubgroup
Difference/1,000 days
Decrease in admissions/y
ear
Range: Decrease in
admissions/year
All 1.28* 410.7 352.0 – 478.0
95th % 1.47* 456.6 425.5 – 487.7
*Significant value (p < 0.05)
13
Analysis Results: In-patient Admissions
In-patient admissionsubgroup
Difference/1,000 days
Decrease in admissions/y
ear
Range: Decrease in
admissions/year
All 1.28* 410.7 352.0 – 478.0
95th % 1.47* 456.6 425.5 – 487.7
*Significant value (p < 0.05)

14
Expense Impact: In-patient Stay Reduction
In-patient admissio
n subgroup
Decrease in in-
patient admissions/year
Average days/
admission
Decrease in-patient days/year
Average expense/
day*
Estimated expense
savings/year
All 410.7 6.6 2,710.62 $1,836 $4,976,698
95th % 456.6 6.7 3,059.22 $1,836 $5,616,728
*Source: AHCA/Florida Hospital Financial Data 2007

15
SCHD Primary Care Program Utilization:Unduplicated Patient Counts Over Time
1705718840
20078
26421
29448
33521
0
5000
10000
15000
20000
25000
30000
35000
FY 03-04 FY 04-05 FY 05-06 FY 06-07 FY 07-08 FY 08-09

16
Services Provided to Referred Patients• Eligibility Services• Case Management• Counseling and Education• Medication Assistance• Living Healthy Workshops
– Evidence based chronic disease patient education – Stanford Chronic Disease Self-Management Program
model– Cost per participant: $70 - $200*– Annual estimate of health care system cost savings per
patient: $295 - $750/year*• Primary Care Navigation • Individualized Chronic Disease Case Management
*Sources: Lorig, et al. Medical Care, 39(11), 1217-1223; Sobel, et al. The Permanente Journal 6(2), 15-22
17
Analysis/Evaluation Limitations
• Evaluation methodology does not establish a “cause and effect” relationship
• Pre- and post-intervention periods not time bounded
• Results do not factor utilization of other primary care and/or hospital based services
• Expense/charge averages may not accurately reflect those of the patient population
• Evaluation period not adequate for assessment of long term impacts
• Financial impact calculations do not factor third party or client payments

18
Implications
• Preliminary evidence– Impact on health system utilization and
costs – Need for further model evaluation and
modification– Need for ongoing/continued quantitative
and qualitative evaluation– Value of and need for ongoing exchange
of service utilization data among project partners

19