1 safta india-pakistan-afghanistan trade harsh vivek february 1, 2006 – taj mahal palace and...
TRANSCRIPT

1
SAFTAIndia-Pakistan-Afghanistan
Trade
Harsh Vivek
February 1, 2006 – Taj Mahal Palace and Towers, Mumbai
India Development Foundation

2
The Presentation Agenda
SAFTA
Trade: India-Pak-Afghan
Customs duties
The way forward

3
Why regional trade?
• More integrated markets• Benefits of trade multipliers in the region• Intra-bloc trade – ‘cluster approach to development’
– Exploit trade complementarities of neighbouring countries
• Cooperate to compete (India-China energy example)• Price competitiveness of intra-bloc trade• More benefits (relatively) to small countries in intra-
bloc trade– E.g. Sri Lanka gaining relatively more from India-Sri Lanka
trade

4
SAFTA
• SAFTA Agreement – “Strengthen intra-SAARC economic cooperation to maximize the realization of the region’s potential for trade.”
• Governed by WTO principles– Reciprocity, special and differential treatment– Awareness of the needs of least developed members
(Revenue Compensation Mechanism)
• Focus on elimination of tariff and non-tariff barriers• Two institutions to oversee implementation
– SAFTA Ministerial Council (highest decision-making body)– Committee of Experts (senior economic official from each
member-state)– Role of the SAARC Secretariat (?)

5
Tariffs and Non-tariff barriers
• Tariffs (10 year phase-out of tariffs)– Least developed members reduce tariffs to a maximum of 30
per cent (in first 2 years).
– Tariffs already below 30 per cent will be reduced by 5 per cent annually for least developed members
– Non-least developed members reduce tariffs to a maximum of 20 per cent (first 2 years)
– Tariffs already below 20 per cent will be reduced by 10 per cent annually for non-least developed members
• Non-tariff barriers – QRs eliminated for products not on sensitive-list
6
The Presentation Agenda
SAFTA
Trade: India-Pak-Afghan
Customs duties
The way forward

7
Contribution to SAARC trade (2001)
Export To/From Bangladesh Bhutan India Maldives Nepal Pakistan Sri Lanka
Bangladesh 1.58 23.42 75.00
India 37.53 5.38 1.41 22.75 7.24 25.69
Maldives 1.45 98.55
Nepal 0.56 0.19 99.22 0.03
Pakistan 46.72 21.45 0.43 4.35 27.05
Sri Lanka 32.47 50.90 16.63
8
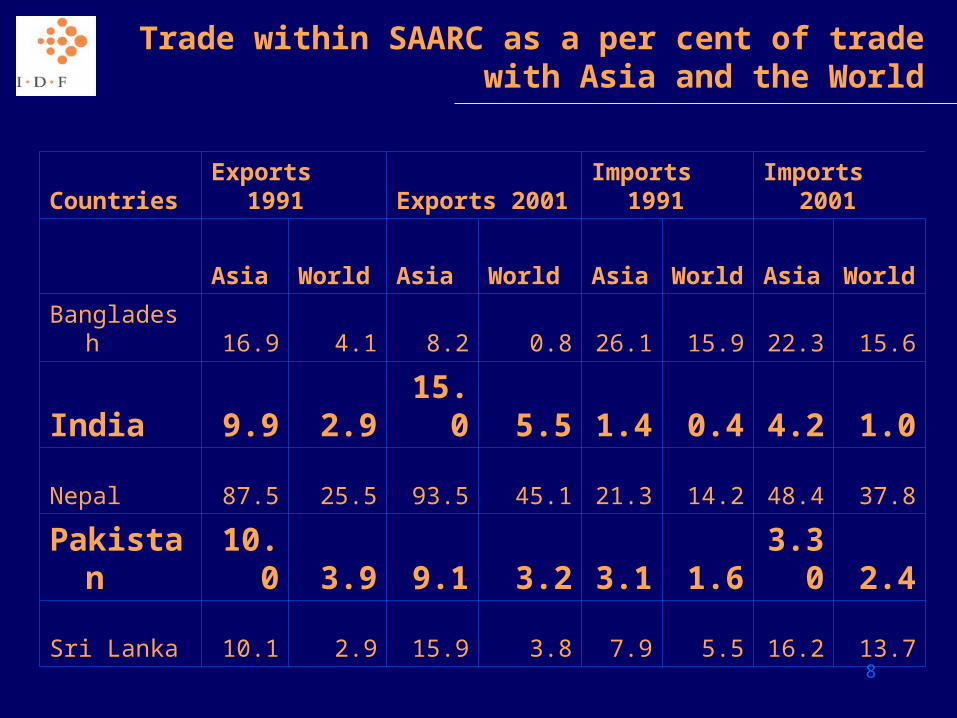
Trade within SAARC as a per cent of trade with Asia and the World
Countries Exports 1991 Exports 2001 Imports 1991 Imports 2001
Asia World Asia World Asia World Asia World
Bangladesh 16.9 4.1 8.2 0.8 26.1 15.9 22.3 15.6
India 9.9 2.9 15.0 5.5 1.4 0.4 4.2 1.0
Nepal 87.5 25.5 93.5 45.1 21.3 14.2 48.4 37.8
Pakistan 10.0 3.9 9.1 3.2 3.1 1.6 3.30 2.4
Sri Lanka 10.1 2.9 15.9 3.8 7.9 5.5 16.2 13.7
9
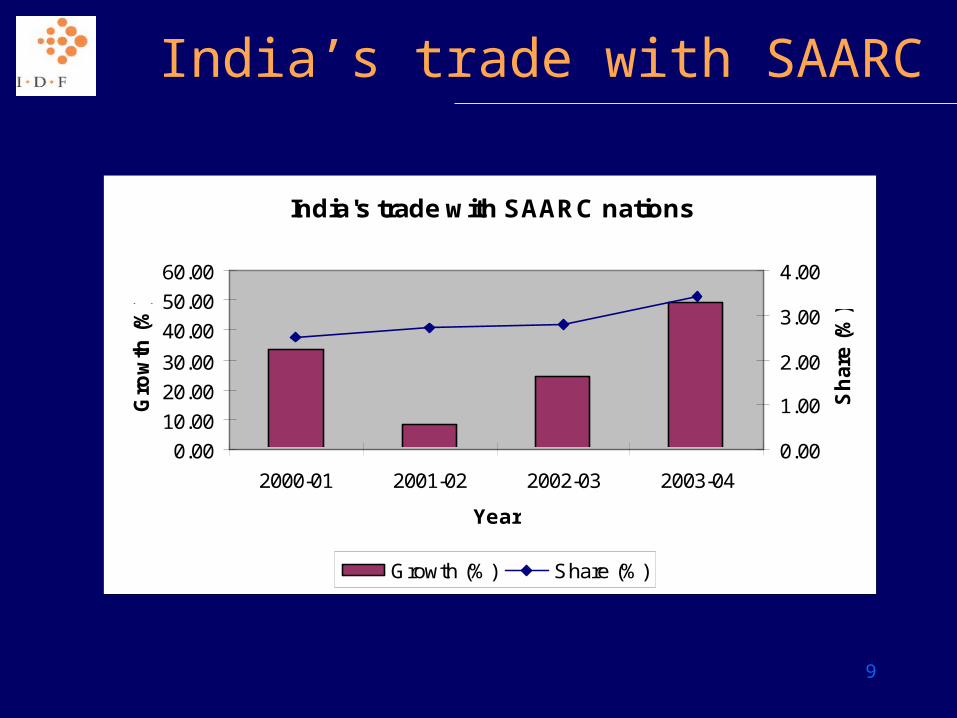
India’s trade with SAARC
India's trade with SAARC nations
0.00
10.00
20.00
30.00
40.00
50.00
60.00
2000-01 2001-02 2002-03 2003-04
Year
Gro
wth
(%
)
0.00
1.00
2.00
3.00
4.00
Sh
are
(%
)
Growth (%) Share (%)

10
Share of developing and Asian countries in India’s trade
Share of developing and Asian countries in India's trade
0.0010.0020.0030.0040.0050.0060.00
2000 2001 2002 2003 2004
Year
Per
cen
tag
e
Developing Countries Asia
11
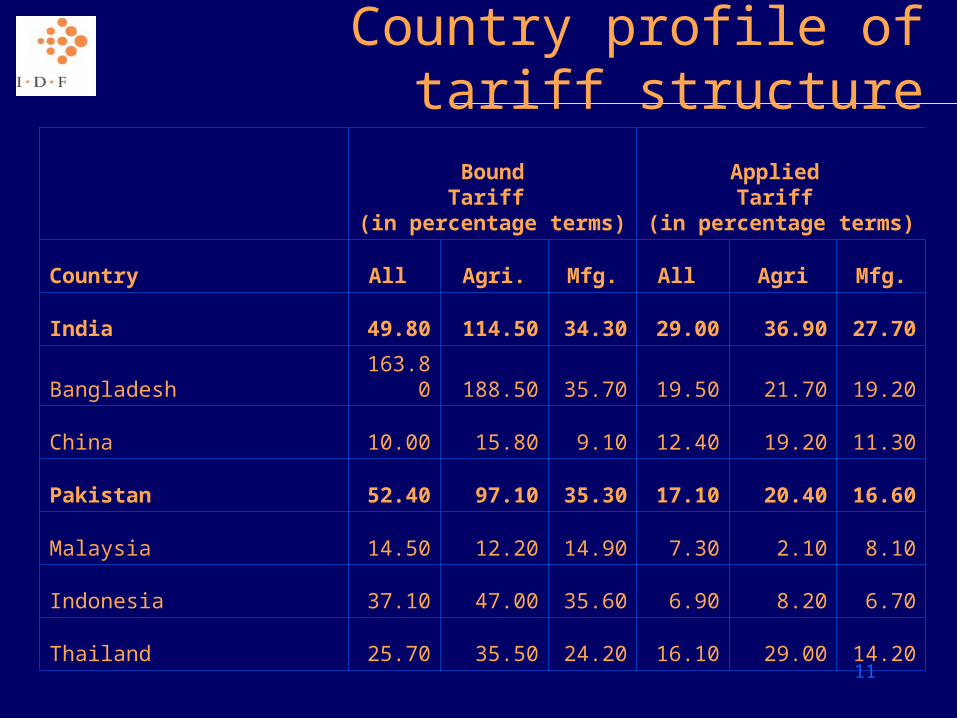
Country profile of tariff structure
BoundTariff
(in percentage terms)
Applied Tariff
(in percentage terms)
Country All Agri. Mfg. All Agri Mfg.
India 49.80 114.50 34.30 29.00 36.90 27.70
Bangladesh 163.80 188.50 35.70 19.50 21.70 19.20
China 10.00 15.80 9.10 12.40 19.20 11.30
Pakistan 52.40 97.10 35.30 17.10 20.40 16.60
Malaysia 14.50 12.20 14.90 7.30 2.10 8.10
Indonesia 37.10 47.00 35.60 6.90 8.20 6.70
Thailand 25.70 35.50 24.20 16.10 29.00 14.20
12
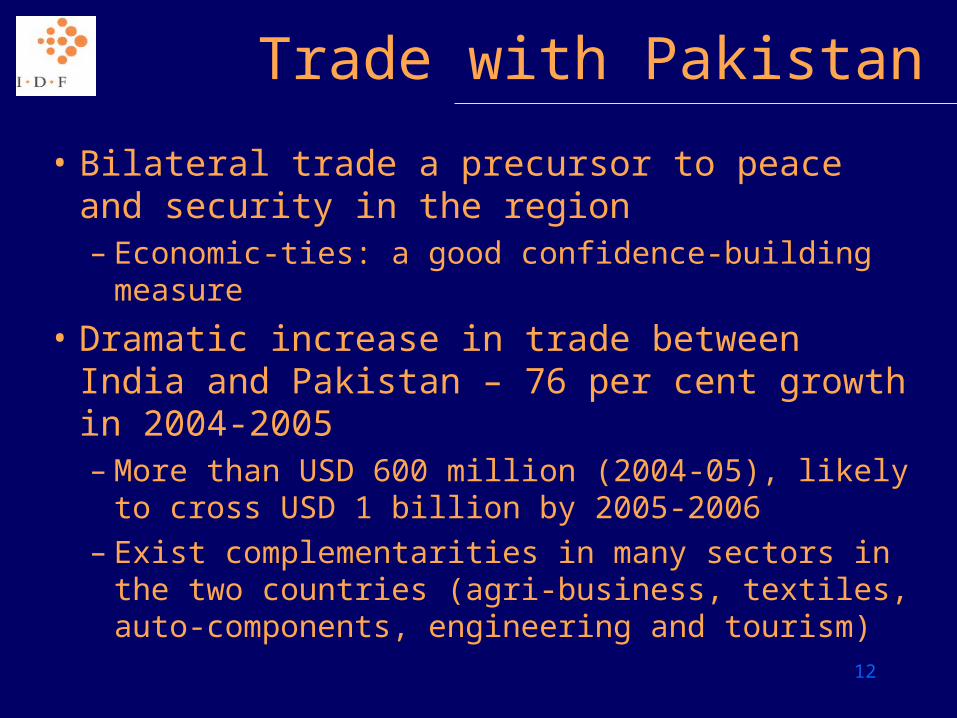
Trade with Pakistan
• Bilateral trade a precursor to peace and security in the region– Economic-ties: a good confidence-building measure
• Dramatic increase in trade between India and Pakistan – 76 per cent growth in 2004-2005– More than USD 600 million (2004-05), likely to
cross USD 1 billion by 2005-2006– Exist complementarities in many sectors in the two
countries (agri-business, textiles, auto-components, engineering and tourism)

13
List of export-import commodities
Pakistan import list / India export list
• Electric and power machinery
• Iron-ore, pig iron
• Medicine and pharma products
• Organic chemicals, pesticides and insecticides
• Rubber tyres
• Pulp and paper
Pakistan export list/ India import list
• Animal hides and skins
• Raw cotton
• Edible nuts
• Metal scrap
• Precious and semi-precious stones
• Jewelry
Source: International Trade Statistics Yearbook (2001), United Nations

14
Composition of India-Pak trade
• Major trade in mfg. goods (60 per cent)
• Bulk trade in agriculture and allied products– Sugar and onions (recent
examples)
• Good potential for increase in trade– Textiles
– Petroleum
Exports from India to Pakistan (2004-05)
20%
4%
60%
6%
1%
2%
7%
Agri. and allied Ores and minerals Mfg goods
Engg goods Machinery Textiles
Petroleum

15
Trade in agriculture commodities
Commodity Name
Pakistan Exports (USD Million)
India Imports (USD Million)
a) Tobacco 1.95 3.63
b) Fish 2.02 5.36
c) Natural honey 2.33 1.18
d) Nuts 12.44 19.04
Commodity Name
India Exports (USD Million)
Pakistan Imports (USD Million)
a) Wheat 1.42 3.92
b) Sunflower oil 1.55 5.79
c) Coconut oil 4.63 1.83
d) Tea 3.18 6.11
e) Pepper 124.47 5.22
f) Processed cereals 1.27 9.39
16
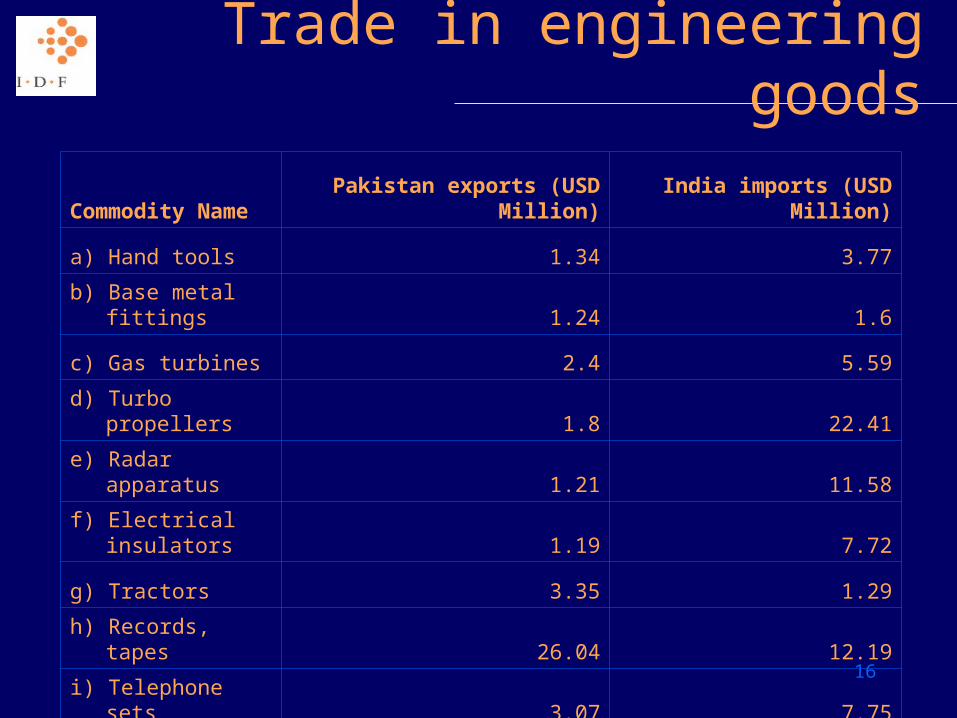
Trade in engineering goods
Commodity Name Pakistan exports (USD Million) India imports (USD Million)
a) Hand tools 1.34 3.77
b) Base metal fittings 1.24 1.6
c) Gas turbines 2.4 5.59
d) Turbo propellers 1.8 22.41
e) Radar apparatus 1.21 11.58
f) Electrical insulators 1.19 7.72
g) Tractors 3.35 1.29
h) Records, tapes 26.04 12.19
i) Telephone sets 3.07 7.75

17
Afghanistan’s trade
• Trade suffered a setback due to prolonged strife, civil wars and political turmoil
• Total exports to India and Pakistan (2004) – USD 150 million (approx)
• Bulk of Afghanistan’s exports go to Pakistan (69 per cent in 2004)
• India (8%) and Russia (6%) other major trading partners
• Imports from a larger number of countries

18
Afghanistan trade destinationsExports by destination (2004)
69%
8%
6%
4%
13%
Pakistan India Russia Europe Others
Imports by destination (2004)
18%
14%
9%
6%
4%
3%
46%
China Japan Pakistan India Germany Kenya Unspecified

19
Composition of Afghan. trade (2004)
Commodity (Exports)
Pakistan (%)
India (%)
Dry fruits 69.40 7.10
Animal skins and fur 89.40 0.00
Carpets 81.80 0.90
Medicinal seeds 33.40 45.20
Fresh fruits 82.70 2.80
Wool 45.30 0.00
Cotton 99.40 0.00
Others 31.10 7.20
Total trade(exports) 69.00 8.00
Commodity (Imports)
Pakistan (%)
India (%)
Fabrics 0.40 3.20
Tyres and tubes 0.00 23.20
Metals 16.60 0.80
Wheat and flour 88.80 0.00
Tea 0.00 3.40
Vegetable oil 22.90 0.00
Cement 10.60 0.00
Medicines 1.70 22.60
Sugar 37.80 14.90
Bicycles 1.60 6.30
Stationery 4.00 8.00
Total trade (imports) 9.00 6.00
20
The Presentation Agenda
SAFTA
Trade: India-Pak-Afghan
Customs duties
The way forward

21
Customs Valuation
• Indian Customs requires extensive documentation.
• Processing delays often due to complex tariff structure and multiple exemptions, which may vary according to product or user.

22
Customs Valuation• On an average, documents required for importing or
exporting one consignment in/out of India includes:
Type of documents 29
No. of copies 118
No. of Signatures 256
Manpower Required 7
Cost of procedures 10 % of consignment value
Source: An UN ESCAP estimate.
23
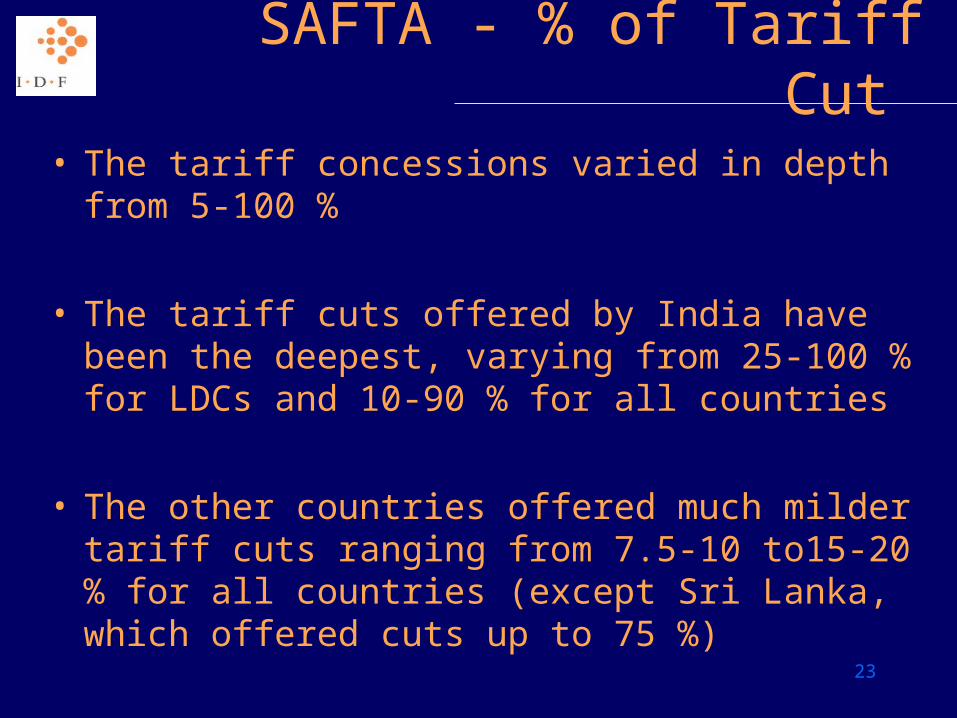
SAFTA - % of Tariff Cut
• The tariff concessions varied in depth from 5-100 %
• The tariff cuts offered by India have been the deepest, varying from 25-100 % for LDCs and 10-90 % for all countries
• The other countries offered much milder tariff cuts ranging from 7.5-10 to15-20 % for all countries (except Sri Lanka, which offered cuts up to 75 %)

24
SAFTA - Tariff Structure
• Provides free trade in goods
– The Agreement does not look at trade in services
– The issue of cross-border investments is also not dealt with strongly in
the Agreement
• Each SAFTA nation will maintain a Sensitive List to protect the
interests of the domestic stakeholders
• The Agreement also provides for an institutional mechanism of
the SAFTA Ministerial Council (SMC)
• Detailed Dispute Settlement Mechanism (on the lines of the
WTO)
– Proper documentation, case based on scientific, verifiable evidences

25
India’s Trade with SAFTA Nations
India's Export to SAARC Nations
INR In billion
SAARC Nations
2002-03
2003-04
2003-04 Apr-Oct
Afghanistan 762.82 936.81 467.55
Bangladesh 56.91 7.99 41.83
Nepal 16.96 30.76 15.77
Pakistan 9.98 13.19 4.03
Sri Lanka 44.57 60.62 32.31
Source: DGCI&S
India's Import from SAARC Nations
INR In billion
SAARC Nations
2002-03
2003-04
2003-04 April-Oct
Afghanistan .89 1.86 .77
Bangladesh 3.00 3.56 2.00
Nepal 13.64 13.14 6.31
Pakistan 2.17 2.64 1.87
Sri Lanka 4.40 8.94 3.51
Source: DGCI&S

26
India's Market among SAFTA Nations
• India’s Market in SAARC for it’s Major Export Commodities
Bangladesh Organic chemical, jewelry, articles of iron & steel, pharmaceutical products, computers
Nepal Medicines and drugs, oil, ores, organic chemical, articles of iron & steel, electrical machinery, processed foods, textiles
Pakistan Ores, slag & ash, chemicals, iron & steel (articles), mfg. products, tea, sugar, processed foods, spices, computers, auto-components (e.g. Tyres)
Sri Lanka Ores, slag & ash, organic chemicals, cotton, iron & steel (articles), electrical machinery, auto-components and parts, pharmaceutical products

27
The Presentation Agenda
SAFTA
Trade: India-Pak-Afghan
Customs and transit rights
The way forward

28
The Way Forward
• Need to strengthen the Agreement– Expanding the scope to include trade in services
• Focus on cross-border investments• Simplification of trade procedures and documentation• Strengthening the implementation of the Agreement –
focus on trade reforms in SAARC• Involvement of international organisations
– Harmonizing tariffs and standards between nations
– Working-out a compensation mechanism for the revenue loss by the least developed countries in the region

29
In conclusion…
“The success of SAFTA greatly depends on the political commitment and harmony among all the signatory members, and on the vigour and vision with which India and Pakistan – the two largest economies in the region – lead meaningful trade reforms.”

30
Thank you.www.idfresearch.org