1-s2.0-s0266353806004532-main
DESCRIPTION
artigoTRANSCRIPT

COMPOSITES
www.elsevier.com/locate/compscitech
Composites Science and Technology 67 (2007) 2027–2035
SCIENCE ANDTECHNOLOGY
Controlled interfacial adhesion of Twaron� aramid fibres incomposites by the finish formulation
Pieter J. de Lange a,*, Peter G. Akker a, Edith Mader b, Shang-Lin Gao b,Warawan Prasithphol c, Robert J. Young c
a Teijin Twaron Research, Department of QRF, Arnhem, The Netherlandsb Leibniz Institute of Polymer Research, Dresden, Germany
c School of Materials, University of Manchester, Manchester, M1 7HS, UK
Received 17 October 2006; accepted 30 November 2006Available online 21 December 2006
Abstract
In order to investigate the effect of oily finish components on the interphase strength of aramid-epoxy composites, Twaron� aramidyarn has been treated in a one step finish process with combinations of adhesion improving (epoxy-amine) components and processabil-ity improving (oily) components. Variations in the macroscopic composite properties (compression shear strength and transverse tensilestrength) as a function of the amount of oil are very well predicted by micro-mechanical adhesion results from single filament pull outmeasurements and micro Raman spectroscopy. They can be explained by differences in the amount and distribution of epoxy, fixated tothe yarn surface, shown by XPS, contact angle measurements and atomic force microscopy.� 2006 Elsevier Ltd. All rights reserved.
Keywords: A. Aramid fibre; A. Polymer–matrix composites; B. Surface treatments; B. Interphase; B. Interfacial strength
1. Introduction
Aramid fibres are used as reinforcements in high perfor-mance composites, e.g. in aerospace applications, but theyare also used extensively as reinforcements for rubber, tires,plastics, and concrete. The employing aramid fibres as rein-forcements have been limited by poor fibre–matrix interfa-cial adhesion, however, because of the difficultiesassociated with to aramid fibre surface having no sufficientreactive functional groups for covalent bonding withmatrix resin. The aramid fibre consists of relatively rigidpolymer chains with linked benzene rings and amide bondshaving high crystallinity. In order to reach optimalmechanical properties of these composite materials, signif-icant research efforts have been directed towards character-ization and improvement of the fibre–matrix interfacial
0266-3538/$ - see front matter � 2006 Elsevier Ltd. All rights reserved.
doi:10.1016/j.compscitech.2006.11.018
* Corresponding author. Tel.: +31 26 3665289; fax: +31 26 3665432.E-mail address: [email protected] (P.J. de Lange).
adhesion by various fibre surface treatments. Commer-cially, a typical chemical treatment of special Twaron� ara-mid fibre types for improvement of adhesion to epoxy andrubber matrices is the application of an epoxy-based finishto their surface, and subsequent curing thereof [1]. In addi-tion to adhesion active components, a certain amount of an‘‘oily’’ finish component is always applied to the fibre sur-face. The use of these finish components is essential in con-trolling the processing of the fibre, both in the productionstep as well as in consecutive process steps, such as twistingand cabling. However, besides this positive effect on theprocessability of the yarns, the oily components in the fin-ish might weaken the interphase by forming a weak bound-ary layer and thus deteriorate the adhesion strength.Moreover, they dilute the epoxy/amine system during theshort curing process, in case of combined application. Tothe best of the knowledge of the authors, comparativeexperimental information of how the oily componentsaffect the fibre/resin interphase and composite mechanicalproperties has been scarcely reported in the literature.

2028 P.J. de Lange et al. / Composites Science and Technology 67 (2007) 2027–2035
To develop new and improved surface-treated aramidfibre types, aimed at increasing composites performance,the fundamental knowledge in both material surface andcomposite interphase is required. A combination of analyt-ical techniques has been used in the past to study the rela-tionship between the fibre surface (with or withoutadhesion activation treatment), the resulting microscopicinterphase structure and the macroscopic composite prop-erties, including the fibre–matrix adhesion [2–4], such asX-ray photoelectron spectroscopy (XPS), static (time-of-flight) secondary ion mass Spectrometry (ToFSIMS), lowenergy ion scattering (LEIS), inverse gas chromatography(IGC), atomic force microscopy (AFM) and micro-Ramanspectroscopy. These techniques allow to study the localsurface chemistry (XPS, ToFSIMS, LEIS), the surfacepolarity, and possible presence of acid/base interactions(IGC), the physical surface microstructure (AFM), andthe local, i.e. micro-mechanical properties of the interphaseregion (nanoindentation, pull-out, micro-Raman). The ana-lytical observations can then be correlated with the fibre–matrix adhesion strength and toughness, measured e.g. infibre pull-out tests, and with the macroscopic mechanicalproperties of the composite, from transverse tensile strengthand compression shear strength measurements.
In this study, we investigated in detail the effects of theoily components in the finish. One basic Twaron yarn typewas selected, which was treated in a one step finish with acombination of an adhesion active finish, based on anepoxy-amine system, and a processability improving ‘‘oily’’finish with varying ratios. XPS, contact angle measure-ments, and AFM have been used to characterize the sur-face properties of these treated fibres. The interphaseproperties of the fibres in an epoxy matrix were studiedby single fibre pull out tests and micro-Raman spectro-scopic analysis upon single-fibre fragmentation geometryspecimens. Finally, the relation to the macroscopic com-posite properties was established by mechanical evaluationof unidirectional fibre/epoxy composites.
2. Experimental
2.1. Materials
Para-aramid yarn from Teijin Twaron, Arnhem, TheNetherlands, was used for the investigation. One basic yarntype (Twaron 2200, 1680 dtex, f1000) was selected andtreated with a combination of an adhesion active modelfinish and a processability improving ‘‘oily’’ finish, in sixdifferent ratios. The adhesion active model finish is anepoxy-amine system, which contains the diglycidyletherof glycerol as epoxy, and piperazine as amine, in 9:1 weightratio. The ‘‘oily’’ part of the finish consists of a fatty acidpolyglycol ester. The amount of applied epoxy-amine wasfixed on 0.3% (weight on yarn). The amount of ‘‘oily’’finish was varied between 0% and 4.8% (weight on yarn).After application of the combined finish, the yarn wasdried for 5 s in a hot air oven, while curing was accom-
plished by drawing the finished yarn over a hot metal plate(240 �C) for 5 s.
The bulk composites were prepared as unidirectionallaminates with a size of 300 · 300 mm and a thickness of4 mm by impregnating the aramid strands continuouslywith the epoxy resin system, using a drum winding tech-nique to manufacture a single prepreg layer, and followingby a subsequent hot pressing process. In preparation of sin-gle fibre model microcomposites, a commercial DGEBA-based epoxy resin Bakelite EPR L20 and curing agentBakelite EPH 161 were used in 100:34 weight ratio (manu-facturer: Hexion Speciality Chemicals). The curing condi-tions used in the study were similar to thoserecommended by the manufacturer (6 h, 80 �C).
2.2. Characterisation
2.2.1. X-ray photoelectron spectroscopy (XPS)
XPS measurements were carried out on a VG EscalabMKII instrument, making use of non-monochromated AlKa radiation from a dual Al–Mg anode. The analyzerwas operated in constant analyzer energy (CAE) mode,with a pass-energy of 50 eV for elemental quantificationpurposes and 20 eV for C1s peak shape comparison pur-poses. Intensities were converted to elemental concentra-tions using Wagner sensitivity factors. Data processingwas performed with VG Eclips software. Before XPS anal-ysis, all Twaron yarn samples were subjected to a Soxhlettextraction (4 h) with ethanol.
2.2.2. Contact angle measurement
To predict the wetting behaviour during composite pro-cessing, the contact angles of differently surface treated ara-mid fibres as control and extracted samples with water weredetermined. A single fibre Wilhelmy technique [5] enabledto determine both the advancing and receding angle. Avery sensitive tensiometer K14 (KRUSS GmbH) was used.For each sample 25 single fibres were measured to get agood average value.
2.2.3. Atomic force microscopy (AFM)
An AFM (Digital Instruments D3100, USA) was usedas a fibre surface topography imaging tool in tappingmode. The cantilever (ULTRASHARP NSC15-F/5, Mik-roMasch, Estonia) has a normal spring constant of40.9 N/m, a tip cone angle of 20�, radius of �10 nm andmodulus of 160 GPa to assure good imaging resolution.
Image surface area difference ratio (Sdr, Eq. (1)) as oneroughness parameter derived from ASME B46.1 expressesthe percentage ratio of the three-dimensional area of all ofthe triangles formed by three adjacent data points (takingthe z height into account), AT, to the projected two-dimen-sional surface area in the flat x–y plane, A0, as shownbelow:
Sdr ¼AT
A0
� 1
� �� 100%: ð1Þ

Table 1XPS elemental analysis of solvent extracted Twaron samples
P.J. de Lange et al. / Composites Science and Technology 67 (2007) 2027–2035 2029
2.2.4. Single-fibre pull-out test (SFPO)
Using a self-made embedding apparatus enabling PC-controlled temperature and time cycles, the model micro-composites for the single fibre pull-out test were preparedby accurately embedding the single fibres in matrix withembedding lengths of 100 through 200 lm. The pull-out testwas carried out on a self-made pull-out apparatus with forceaccuracy of 1 mN and displacement accuracy of 0.07 lmwith identical pull-out velocities (0.01 lm s�1) at ambienttemperature. From each force–displacement-curve, theforce at debonding or ‘‘kink’’ point Fd, the maximum forceFmax, and the embedded length le were determined. The fibrediameter d = 2rf of each pulled-out fibre piece was measuredmicroscopically. Each fibre/epoxy combination was evalu-ated by about 15–20 single tests. As a relative measure ofinterfacial adhesion of differently sized fibres, the apparentadhesion strength sapp, for each specimen was calculatedfrom the equation
sapp ¼F max
pdle
: ð2Þ
In this traditional data reduction practice, the maximumexternal force Fmax applied to the fibre is taken to corre-spond to the complete interface debonding [6–9]. A moredifferentiating approach determines the force, Fd, thepoint when initial fibre debonding from the matrix maystart, as seen from a kink in the force–displacement curve.Further increase of the external load leads to interfacialcrack propagation and additional friction in the debondedregions. Then, the local interfacial adhesion strength, sd,can be determined by using the algorithm described previ-ously [10], in which the raw data was considered includingthe whole force–displacement curve, the specimen geome-try, the embedded area, and the properties of the fibreand the matrix. We also calculated an energy parameterwhich characterizes debonding the fibre from the polymermatrix, namely, the critical interphase energy release rate,Gic. On the assumption that the pull-out process is gov-erned by an energy criterion, Gic can be regarded as aconstant value. The debond force, Fd, is related to Gic
by the equation [11]:
F d ¼ pr2f �p þ
ffiffiffiffiffiffiffiffiffiffiffiffiffiffiffiffiffiffiffiffiffiffiffip2 � qðGicÞ
p� �; ð3Þ
where p and q(Gic) are terms depending on fibre and matrixmechanical properties and specimen geometry; theirexpressions and the derivation are given in the reference[10], based on the theory originally presented by Nairn [12].
Applied finish (wt%-on-yarn) Atomic %
Oil Epoxy-amine C O N Cl Na S
0.0 0.3 67.8 22.4 6.8 1.2 0.2 0.40.3 0.3 69.8 22.6 5.4 1.8 0.2 0.30.6 0.3 69.1 23.4 5.6 1.7 0.0 0.21.2 0.3 68.5 23.7 6.6 1.0 0.0 0.42.4 0.3 69.5 22.6 7.0 0.7 0.0 0.24.8 0.3 75.4 15.3 9.0 0.4 0.0 0.0Untreated reference Twaron 76.4 11.6 11.8 0.0 0.1 0.1Aramid, theoretical 77.8 11.1 11.1
2.2.5. Micro-Raman spectroscopy
Single fibre model composites as fragmentation geome-try specimens with fibres 2–3 mm long were prepared withan epoxy resin matrix as described in detail elsewhere [13].The model composites were deformed using a Minimatstraining rig and the composite strain monitored usingthe strain gauges. The Minimat, with a specimen mounted,was attached to the stage of the microscope so that the fibre
could be observed as the load was increased. The laserbeam was focused on the fibre inside the resin matrix usinga ·50 objective lens and a near-IR 785 nm laser was used toobtain the Raman spectra. An exposure time of 3 s and fiveaccumulations were employed. The shift of 1612 cm�1
Raman band along the length of the fibre at each level ofmatrix strain applied was examined. A separate experimentupon the deformation of the fibres in air showed that bandshifted at a rate of �3.6 ± 0.1 cm�1/% strain. The matrixstrain was increased in increments from 0% to 0.5%,1.0% and 1.5%. The measurements were taken at every10 lm at both ends of the fibre and every 40 lm alongthe middle of the fibres.
2.2.6. Composite mechanical testing
The mechanical properties of the unidirectional compos-ites were determined by transverse tensile test and compres-sion shear test, since it was pointed out in previous work [5]that the ‘‘adhesion relevance’’ is highest, if epoxy resinmatrix composites are considered. The testing conditionswere chosen according to ISO 527.
3. Results and discussion
3.1. Chemical composition and wettability
XPS analysis was used to characterise the chemicalstructure of the finish-treated fibre surfaces after the curingprocess. Before each analysis, a solvent extraction with eth-anol was carried out, which removes the ‘‘oily’’ finish com-ponents and possible residual epoxide. In this way thetechnique can be used to determine only the amount ofepoxide which is fixated to the aramid surface by the curingprocess, and which will be responsible for adhesionimprovement in consecutive adhesion tests [4].
The results of XPS analysis of the solvent extractedTwaron samples, treated with finishes of varying oil toepoxy-amine ratio, are given in Table 1. The oxygen per-centage of all finish treated samples is higher than theuntreated reference sample. This is explained by the pres-ence of cured epoxy-amine on the surface, which is relative(in comparison to aramid) oxygen rich. The nitrogenpercentage of all finish treated samples is lower than the

2030 P.J. de Lange et al. / Composites Science and Technology 67 (2007) 2027–2035
untreated reference sample. This is also caused by the curedepoxy-amine on the surface, which attenuates the nitrogensignal from aramid. Although the epoxy-amine containssome nitrogen from piperazine, the amount is low in com-parison to aramid, which explains the decrease.
All finish treated samples show a clear chlorine signal.This can be attributed to the epoxy compound, which con-tains (as commercial product) a small amount of covalentlybonded chlorine. Therefore, the chlorine can be used as tra-cer for the epoxy present at the fibre surface.
Fig. 1 illustrates the effect of increasing the concentra-tion of oil in the finish on the chlorine/epoxy contentdetermined by XPS. Above a level of 0.3% of oil, thechlorine percentage decreases with increasing amount ofoil in the finish. This can easily be explained by a dilutioneffect. The oil and the epoxy-amine are cured together onthe fibre surface. During the curing process, the epoxyand amine molecules have to find (besides each other)the fibre surface and react there, in order to form a fix-ated surface layer which will be responsible for adhesionactivation. With increasing amount of oil and a constantnumber of epoxy and amine molecules, the number ofepoxy and amine molecules which will find the surfaceand react there will go down. This is observed in theXPS measurements, since a solvent extraction is carriedout before the analysis, which removes the oil and allepoxy and amine molecules which are not fixated to thearamid surface.
Furthermore, it is remarkable that the maximumamount of chlorine/epoxy is not found for the sample with-out oil. The explanation might be that the presence andamount of oil has a significant effect on the distributionof epoxy over the surface. In case of a more inhomoge-neous distribution of the epoxy over the surface, the mea-sured chlorine percentage will directly go down due tothe surface sensitivity of XPS. This might be the case forthe sample without oil.
0
0.2
0.4
0.6
0.8
1
1.2
1.4
1.6
1.8
2
0 1 2
Amount of oi
Ch
lori
ne
per
cen
tag
e
Fig. 1. Change in chlorine and nitrogen content of aramid fibres with the a
All observations in the chlorine percentage are con-firmed by the nitrogen percentage, also given in Fig. 1.The two curves show a perfect opposite behaviour, asexpected; the more epoxy is present at the surface, thehigher is the chlorine signal, and the lower is the nitrogensignal from the underlying aramid. For high oil levels,e.g., the chorine percentage decreases to low values, indi-cating almost no epoxy at the surface, while the nitrogenpercentage rises to a value close to the expected percentageof aramid. Note that the sum of the nitrogen and chlorinepercentage is lower than 10%, this means that the observedanti-correlation is real and not caused by normalisation ofthe sum of all elemental percentages to 100%.
In addition to determination of the atomic percentages,XPS was used to probe the chemical binding state of thecarbon and oxygen surface atoms. Fig. 2 shows an overlayof the C1s signals of the (solvent extracted) samples, pre-pared with varying amounts of oil. Starting with the samplewithout oil, the curve basically consists of a C–C contribu-tion at 284.5 eV binding energy, and a C–O contribution at286 eV binding energy. The C–C contribution can partly beattributed to aramid and partly to cured epoxy-aminestructures, while the C–O contribution is mainly arisingfrom the cured epoxy-amine structures. Note that a refer-ence C1s spectrum of pure aramid [4] contains a C–Ncontribution, on approximately the same position as theC–O, and a C(@O)–N contribution on 288 eV, but thesecontributions are relatively small. This means that the sig-nal at the C–O position can be used as a measure for theamount of epoxy-amine present at the surface.
Going from the sample without oil, to the sample with0.3% oil, an increase of the C–O contribution is observed,which implies more fixated epoxy-amine on the surface.This is consistent with Fig. 1. If the amount of oil is furtherincreased, the C–O contribution/fixated epoxy-amine goesthrough a maximum at 0.6% oil, and decreases then forhigher oil amounts, due to the dilution effect. So qualitatively
3 4 5
l (w.o.y., %)
0
1
2
3
4
5
6
7
8
9
10
Nit
rog
en p
erce
nta
ge
ClN
mount of oil in the finish, measured with XPS after solvent extraction.

281283285287289291293
Binding energy (eV)
0
10
20
30
40
50
60
70
80
90
100
Inte
nsi
ty
0.0%0.3%0.6%1.2%2.4%4.8%
Fig. 2. Changes of C1s spectra with the amount of oil, measured with XPS after solvent extraction.
P.J. de Lange et al. / Composites Science and Technology 67 (2007) 2027–2035 2031
the same as in Fig. 1 is observed, only the maximum isshifted from 0.3% of oil to 0.6% of oil. Note that for thehighest oil levels the C(@O)–N contribution from aramidbecomes visible at 288 eV.
Fig. 3 shows an overlay of the O1s signals of the differ-ent samples (The oxygen signal in the sample prepared with0.3% oil is missing due to a recording error). All O1s sig-nals consist of two main contributions. The left contribu-tion at high binding energy (532 eV) can be attributed tosingle bonded oxygen from the epoxy-amine structure,the right contribution at low binding energy (530.5 eV)can be attributed to double bonded oxygen from aramid.
With increasing amount of oil, the relative ‘‘aramid’’contribution first goes down (0.6% oil), and then goes upagain (1.2%, 2.4%, 4.8%). With the limited number of
5534536538
Binding e
0
10
20
30
40
50
60
70
80
90
100
Inte
nsi
ty
0.0%
0.6%1.2%2.4%4.8%
Fig. 3. Changes of O1s spectra with the amount of
measurements, the minimum ‘‘aramid’’ contribution(=maximum epoxy-amine contribution) is found for 0.6%of oil, consistent with the result from the C1s signal.
So the XPS measurements show a maximum amount offixated epoxy-amine for an oil level in the range of 0.3–0.6%. Without oil, the distribution of the epoxy-aminemight be inhomogeneous, while for higher oil-levels than0.3–0.6% the dilution of the epoxy-amine by the oilbecomes more important. This dilution could cause differ-ent surface topography in nanometer region and/or influ-ence the surface free energy of the aramid fibres and inturn the adhesion strength towards polymer matrices incomposites.
Table 2 summarizes advancing and receding contactangles with water of extracted Twaron samples. In agreement
52652853032
nergy (eV)
oil, measured with XPS after solvent extraction.

Table 2Contact angles of selected extracted Twaron samples with bi-distilledwater
Applied finish[wt%-on-yarn]
Contact angles (CA) ± s.d. [�]
Oil Epoxy-amine CA advancing CA receding CA hysteresis
0.0 0.3 79.0 ± 6.0 46.7 ± 11.0 32.30.6 0.3 74.2 ± 8.3 30.6 ± 8.1 43.64.8 0.3 80.8 ± 7.6 49.0 ± 15.7 31.8
2032 P.J. de Lange et al. / Composites Science and Technology 67 (2007) 2027–2035
with the C–O contribution determined from the C1s signal,the lowest surface contact angles (both advancing andreceding) were determined for the Twaron sample having0.6% oil together with 0.3% epoxy-amine. This is an indica-tion of more hydrophilic behaviour and increased surfacefree energy, caused by the presence of the (maximum)amount of fixated epoxy on the fibre surface. This maxi-mum amount of fixated epoxide probably also leads tothe highest surface roughness, which would explain the sig-nificant contact angle hysteresis found for this sample.
3.2. Surface topography
Fig. 4 compares height images of the selected oil/epoxyamine finished Twaron samples after solvent extraction. Inall images, the fixated epoxy (which is not removed by theextraction) seems to be inhomogeneously distributed, andvisible in small islets. With increasing oil content, the nano-size of these ‘‘epoxy’’ islets increases from about 50 nm for0% oil to about 100 nm for 0.3% oil, resulting in lower sur-face area, i.e., Image surface area difference ratio decreasesfrom 1.2% to 0.6%. Interestingly, the islets are distributedon all fibre surface, therefore, the oil turns out to have apositive effect on the distribution of epoxy over the surfaceat low content. When the oil content increases to 4.8% andsize of the islets increases to about 200 nm, however, theislets appear to only partly cover the fibre surface whichleads to possible poor interfacial adhesion as confirmedin following part of the paper. It is also consistent withthe aforementioned XPS results, where the untreated fibre
Fig. 4. AFM height images of (solvent extracted) Twaron samp
and fibre with 4.8% oil show the similar C1s, N1s and O1ssignals.
3.3. Interfacial adhesion
Fig. 5 summarizes the apparent shear strength of all fin-ished Twaron samples determined from the maximumforces of the force–displacement curves of single fibrepull-out test. The data shows an increase of the adhesionstrength with a decrease of the amount of oily componentsin the epoxy-amine finishes. On the contrary the pureepoxy-amine finish proved somewhat lower adhesionstrength. As assumed by XPS surface investigation, thechlorine content (measured after extraction) representsthe amount of (fixated) epoxy species on the outermost sur-face layer. Only these fixated epoxy species have the abilityto covalently bond with the surrounding epoxy resinmatrix, and will contribute in the fibre–matrix adhesion.So the findings with respect to adhesion strength correlatevery well with the XPS results.
This is even more emphasized in Fig. 6. Here, relativevalues of the critical energy release rates, determined fromthe force–displacement curves, are plotted as a function ofthe amount of oil. In the same figure, the chlorine contentsdetermined from XPS investigation are plotted. The twocurves correlate very well. Both chemical and micro-mechanical data highlight same tendencies.
3.4. Micro-Raman spectroscopy
The variations of Raman band position along the lengthof the fibre in the composite were determined at differentmatrix strain levels. The band positions were convertedto fibre strain in the composite specimens by using the mea-sured rate of shift of the Raman band with strain of thefibre in air (�3.6 cm�1/%).
The level of interfacial adhesion was evaluated from thestress transfer length (lt). This is defined as the length overwhich the strain in the fibre builds up to the plateau value[14] and it has been found [13] that there is a good
les, for different amounts of oil: (a) 0%; (b) 0.3%; (c) 4.8%.

0
10
20
30
40
50
60
0 1 2 3 4 5
Amount of oil (w.o.y., %)
Ap
par
ent
Sh
ear
Str
eng
th [
MP
a]
Fig. 5. Apparent shear strength determined from single fibre pull-out tests with epoxy resin in dependence of the oil content in the finish of Twaron fibres.
0
20
40
60
80
100
120
0 1 2 3 4 5
Amount of oil (w.o.y., %)
Rel
ativ
e p
erce
nta
ge
Critical energy release rate(scaled)
Chlorine content (from XPS)
Fig. 6. Relative values of critical energy release rates determined from single fibre pull-out tests with epoxy resin and chlorine content determined fromXPS in dependence of the oil content in the finish of Twaron fibres.
P.J. de Lange et al. / Composites Science and Technology 67 (2007) 2027–2035 2033
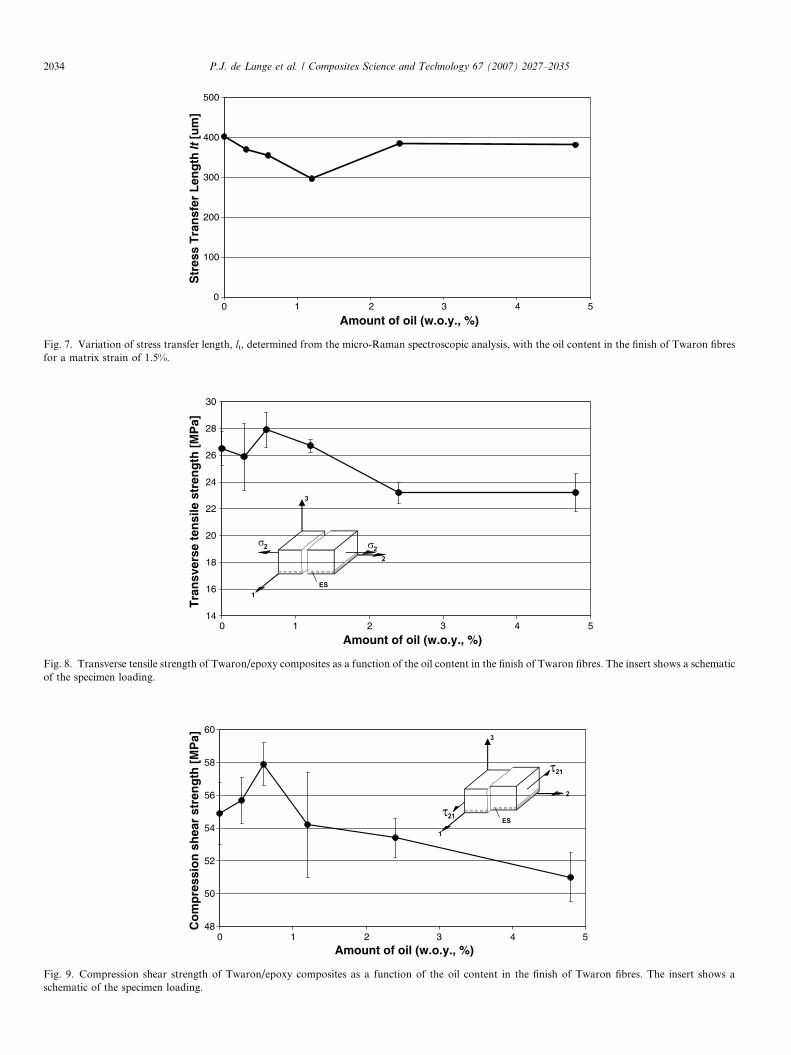
correlation between lt and the interfacial shear strength inthe composite. The stress transfer length was found toincrease with increasing matrix strain due to phenomenasuch as non-linear matrix deformation, yielding of thematrix or debonding that might occur locally at the inter-face around the fibre end. For a given level of matrixstrain, a low value of lt indicates good stress transfer,whereas a higher value indicates poorer stress transfer.The variations of stress transfer length obtained at a matrixstrain of 1.5% from averaging the values at both ends ofthe fibres with six different levels of oil content in theapplied finish are shown in Fig. 7. The shortest transferlength and hence the best adhesion is found for about1.0% of oil in the applied finish, consistent with the resultsfrom the other experiments.
3.5. Composite mechanical properties
The transverse tensile strength and compression shearstrength as a function of the oil content on the Twaronfibres are presented in Figs. 8 and 9, respectively. Although
the specimen loading is differently for these tests, the twostrengths determined show well agreeing tendencies independence of the oil content on the Twaron fibres. In bothcases, maximum strength is not found for samples withoutoil, but for samples with oil amounts around 0.6%. And thestrength goes down at oil levels above 1%. These macro-scopic composite properties are very well predicted by themicro-mechanical adhesion study, carried out with SFPOand Raman. The more fundamental explanation is givenby the results of the analytical characterization.
4. Conclusions
One basic Twaron yarn type has been treated with acombination of an adhesion active finish, based on anepoxy-amine system, and varying amounts of a process-ability improving ‘‘oily’’ finish. It was shown with XPS thatthe amount of fixated epoxy, detected at the fibre surfaceafter solvent extraction, gradually decreases with increasingoil content of the finish formulation. This can be explainedby dilution of the epoxy/amine system by the oil
0
100
200
300
400
500
0 1 2 3 4 5
Amount of oil (w.o.y., %)
Str
ess
Tra
nsf
er L
eng
th
[u
m]
lt
Fig. 7. Variation of stress transfer length, lt, determined from the micro-Raman spectroscopic analysis, with the oil content in the finish of Twaron fibresfor a matrix strain of 1.5%.
14
16
18
20
22
24
26
28
30
0 1 2 3 4 5
Amount of oil (w.o.y., %)
Tra
nsv
erse
ten
sile
str
eng
th [
MP
a]
Fig. 8. Transverse tensile strength of Twaron/epoxy composites as a function of the oil content in the finish of Twaron fibres. The insert shows a schematicof the specimen loading.
48
50
52
54
56
58
60
0 1 2 3 4 5
Amount of oil (w.o.y., %)
Co
mp
ress
ion
sh
ear
stre
ng
th [
MP
a]
Fig. 9. Compression shear strength of Twaron/epoxy composites as a function of the oil content in the finish of Twaron fibres. The insert shows aschematic of the specimen loading.
2034 P.J. de Lange et al. / Composites Science and Technology 67 (2007) 2027–2035

P.J. de Lange et al. / Composites Science and Technology 67 (2007) 2027–2035 2035
components. With increasing amount of oil and a constantnumber of epoxy and amine molecules, the number ofepoxy and amine molecules which will find the yarn surfaceand react there, during the curing process, will go down.This is observed with XPS, due to the fact that a solventextraction is carried out before the analysis, which removesall the oil and the ‘‘loose’’ epoxy and amine molecules.However, the maximum amount of fixated epoxy is notfound in case of absence of oil. A small amount of oil seemsto be required to improve the distribution of the epoxy overthe fibre surface. These findings are confirmed with surfacecontact angle measurements. The lowest advancing andreceding angle, and thus the highest hydrophilic behaviour,is found for the (extracted) Twaron sample having 0.6% oiltogether with 0.3% epoxy-amine. The effect of the oil con-tent on the distribution of the fixated epoxy is further illus-trated by surface topography measurements with AFM.The size of the observed ‘‘epoxy’’ islets increases from50 nm to about 200 nm with increasing oil content.
The effect of the variation in the chemical surface struc-ture of the fibres, as shown by the analytical techniques, isclearly demonstrated in a micro-mechanical adhesion studyin an epoxy matrix. The critical energy release rate, whichcan be determined from the force–displacement curve insingle filament pull out measurements, and which is a mea-sure for the local ‘‘microscopic’’ strength of the interphase,correlates very well with the amount of fixated epoxy, asdetermined with XPS. And also the stress transfer length,derived from micro-Raman spectroscopy, indicates anoptimum adhesion for about 1% of oil in the applied finish.So qualitatively the same trend is found. This suggestsstrongly that the amount of fixated epoxide on the fibresurface, as measured with XPS, is a determining factor inthe microscopic adhesion to an epoxy matrix.
Furthermore, it can be concluded that the ‘‘macro-scopic’’ composite properties, tested in unidirectional lam-inates using the same epoxy matrix, is very well predictedby the micro-mechanical adhesion study (SFPO andRaman). The curves of the transverse tensile strength andthe compression shear strength, both as a function of theamount of oil, are showing the same behaviour as thecurves of the critical energy release rate and the (inverted)stress transfer length. In all cases, maximum performance isnot found for samples without oil, but for samples with oilamounts between 0.3% and �1%. The correlation of themicroscopic adhesion with the analytical characterizationresults, i.e. the amount and distribution of fixated epoxy,is now giving a clear explanation for this behaviour.
Finally, it can be concluded that the presence of a smallamount of oil on commercially adhesion activated Twaronyarns, required to improve the processing behaviour of theyarns, is not directly decreasing the adhesion to epoxy, butis even working positive. And there is a relative broad‘‘safe’’ oil range, i.e. small fluctuations in the amount ofoil will not directly destroy the adhesion. This was alreadyknown from other, more practical, industrial investiga-tions, but this study gives a quantitative confirmationand additional understanding of the fundamental princi-ples behind this knowledge.
References
[1] Willemsen S, Weening WE, Steenbergen A. Adhesive-coated multi-filament yarn of an aromatic polyamide and a method for themanufacture thereof. EP no. 107887.
[2] Mahy J, Jenneskens LW, Vertommen LLT, De Lange PJ, GrabandtO. Adhesion activation of Twaron aramid fibre. In: Van Ooij WJ,Anderson Jr HR, editors. Mittal Festschrift, 1998. p. 407–25.
[3] De Lange PJ, Mader E, Mai K, Young RJ, Ahmad I. Characteriza-tion and micromechanical testing of the interphase of aramid-reinforced epoxy composites. Composites A 2001;32:331–42.
[4] De Lange PJ, Akker PG, Maas AJH, Knoester A, Brongersma HH.Adhesion activation of Twaron aramid fibres studied with low-energyion scattering and X-ray photoelectron spectroscopy. Surf InterfaceAnal 2001;31:1079–84.
[5] Mader E. Study of fibre surface treatments for control of interphaseproperties in composites. Compos Sci Technol 1997;57:1077–88.
[6] Greszczuk LB. Theoretical studies of the mechanics of the fibre–matrix interface in composites. Interfaces Compos, ASTM STP1969;452:42–58.
[7] Andreevskaya GD, Gorbatkina YA. Ind Eng Chem, Prod Res Devel1972;11:24.
[8] Takaku A, Arridge RGC. The effect of interfacial radial and shearstress on fibre pull-out in composite materials. J Phys D: Appl Phys1973;6:2038–47.
[9] Miller B, Muri P, Rebenfeld L. A microbond method for determi-nation of the shear strength of a.ber/resin interface. Compos SciTechnol 1987;28:17–32.
[10] Zhandarov S, Pisanova E, Mader E. Is there any contradictionbetween the stress and energy failure criteria in micromechanicaltests? Part II. Crack propagation: effect of friction on force–displacement curves. Compos Interfaces 2000;7:149–75.
[11] Zhandarov S, Mader E. Indirect estimation of fibre/polymer bondstrength and interfacial friction from maximum load values recordedin the microbond and pull-out tests. Part II: Critical energy releaserate. J Adhesion Sci Technol 2003;17:967–80.
[12] Nairn JA. Analytical fracture mechanics analysis of the pull-out testincluding the effects on friction and thermal stresses. Adv ComposLett 2000;9:373–83.
[13] Prasithphol W, Young RJ. Interfacial micromechanics of technorafibre/epoxy composites. J Mater Sci 2005;40:5381–6.
[14] Hull D, Clyne TW. An introduction to composite materials.Cambridge: Cambridge University Press; 1996.