1-s2.0-s0032386109010891-main
DESCRIPTION
artigoTRANSCRIPT

lable at ScienceDirect
Polymer 51 (2010) 738–747
Contents lists avai
Polymer
journal homepage: www.elsevier .com/locate/polymer
Effects of chain conformation on miscibility, morphology, and mechanicalproperties of solution blended substituted polyphenylene and polyphenylsulfone
Paul J. Jones, Lea C. Paslay, Sarah E. Morgan*
School of Polymers and High Performance Materials, University of Southern Mississippi, Hattiesburg, MS 39406, USA
a r t i c l e i n f o
Article history:Received 19 August 2009Received in revised form6 December 2009Accepted 9 December 2009Available online 21 December 2009
Keywords:PolyphenylenePolyphenylsulfoneMolecular composites
* Corresponding author. Tel.: þ1 601 818 6728; faxE-mail address: [email protected] (S.E. Mor
0032-3861/$ – see front matter � 2009 Elsevier Ltd.doi:10.1016/j.polymer.2009.12.010
a b s t r a c t
The effects of polymer conformation and degree of substitution on miscibility, morphology andmechanical properties of solution blended systems containing polyphenylsulfone and copolymers ofphenylketone substituted p-phenylene with m-phenylene were studied. Static and dynamic light scat-tering studies were performed to obtain the z-average root mean square radius of gyration, second virialcoefficient, weight average molecular weight and hydrodynamic radius. Solution blends of poly-phenylsulfone with phenylene copolymers yielded free standing films. Blend miscibility was assessed byglass transition behavior, morphology was analyzed using atomic force microscopy and mechanicalproperties were measured using nanoindentation. Copolymer composition determined miscibility.Miscible blends exhibited homogeneous morphologies while immiscible blends displayed unique,heterogeneous morphologies. Polymer conformation in solution, rather than enthalpic contributions,was the primary determinant of miscibility. Successful reinforcement was achieved in blended systems.
� 2009 Elsevier Ltd. All rights reserved.
1. Introduction
Molecular composites are blends containing rigid-rod polymersthat act as reinforcing agents dispersed within a flexible polymermatrix. When no interface exists between the reinforcing fibers andthe polymer matrix, molecular composites can also be referred to ashomogeneous composites [1]. According to composite theory,successful mechanical reinforcement is described by the rule ofmixtures and occurs when the aspect ratio of the reinforcingcomponent is greater than one hundred [2]. Development ofmolecular composites has the potential to provide new materialswith increased strength to weight ratios and improved dimensionaland thermal stabilities. Composite performance is driven by themolecular level reinforcing agent and its interaction with thematrix [3,4]. A primary challenge in developing useful compositesof this type is the dispersion of the rigid-rod polymer within theflexible matrix. Unlike blends of coiled polymers where compati-bility can be achieved by offsetting an unfavorable enthalpy ofmixing with a favorable entropy of mixing, blends containing rigid-rod and coiled polymers most often suffer from a highly unfavor-able mixing entropy due to differences in conformation. As a resultof steric forces, rigid-rod polymers form an ordered phase,excluding the coiled polymers. This effect, commonly referred to as
: þ1 601 266 5635.gan).
All rights reserved.
entropic demixing, most often leads to unstable or incompatibleblends even when favorable enthalpy of mixing exists between therigid-rod and coiled polymers [5–7]. In order to create a molecularcomposite, the thermodynamic effects of entropic demixing mustbe counteracted by altering the rigid-rod polymer to allow incor-poration of the coiled polymer in the rigid phase [8–11]. Increasingthe free volume associated with the rigid-rod phase has beenshown to relax the steric constraints and inhibit the formation of anordered state [12]. Effective methods for increasing free volumeinclude modification of the rigid-rod polymer through side groupattachment and introduction of nonlinear monomers into thepolymer backbone [12].
The rigid-rod polyphenylenes investigated in this study arecopolymers of para-phenylene substituted by a phenylketonegroup and meta-phenylene, with the generalized structure shownin Fig. 1. These transparent, amorphous polymers have been clas-sified as self reinforcing polymers (SRPs) for their high strength andmodulus without the addition of reinforcing agents [13,14]. SRPsare inherently both thermally and dimensionally stable and havebeen shown to possess mechanical properties far superior toknown high performance thermoplastics [15–17]. Their mechanicalperformance makes them excellent candidates as reinforcingelements when blended with flexible polymers. Miscible blends ofthis nature are classified as molecular composites. Although SRPshave typically exhibited low melt compatibility with other poly-mers, high levels of miscibility have been reported for SRP/poly-etherimide (PEI) blends [18]. Studies of tertiary melt blends

Fig. 1. Generalized chemical structure of SRP copolymer.
P.J. Jones et al. / Polymer 51 (2010) 738–747 739
containing SRP, polyetheretherketone (PEEK), and poly-phenylsulfone (PPSU) demonstrated that PPSU increases compati-bility between SRP and PEEK [19]. While less industrially viable,solution blending provides a more effective means for creatinghomogeneous blends of SRPs. Solution blends of SRP with poly-imide, polycarbonate, and polysulfone yielded transparent films[15,20]. Formation of optically clear films provides evidence ofblend miscibility, but complicated processes that occur duringsolution casting often alter the state of mixing. Deviation froma state of thermodynamic equilibrium in solution cast films is dueto the diffusion kinetics of the polymers in solution, the solubility ofthe polymers in solution and the surface free energy of the blendcomponents. Non-homogenous films can be produced from poly-mers that usually form miscible blends if the solution becomestrapped in a state of immiscibility based on the tertiary solvent–polymer–polymer phase diagram [21,22]. Conversely, a homoge-neous film can be produced from immiscible polymers if thesolvent is removed at such a rate that the polymers cannot kinet-ically diffuse into a state of thermodynamic equilibrium beforesolidification occurs [23]. Immiscible polymer blends will oftendisplay an enrichment of one component at the surface. Typically,the component with the lower surface free energy will be enrichedat the surface in order to minimize polymer-air surface tension, andthe component with the lower solubility will deposit on thesubstrate first due to solvent effects [24].
In this study, solution blends of two SRP copolymers with PPSUand their films are investigated to determine miscibility andmolecular reinforcement properties. Static and dynamic lightscattering techniques are used to obtain information about thephysical dimensions and intermolecular interactions of the twodifferent SRP copolymers and polyphenylsulfone (PPSU) in solu-tion. Surface free energies are measured using contact angle goni-ometry. Miscibility is characterized by observing the glasstransition behavior of the blends, and the morphology is imaged byatomic force microscopy (AFM). The mechanical performance of theblends is assessed using nanoindentation and compared to theupper limit of mechanical reinforcement predicted by the rule ofmixtures.
2. Experimental
2.1. Materials
PPSU and two variations of SRP (SRP-A and SRP-B) weresupplied by Solvay Advanced Polymers, L.L.C. in powder form. TheSRPs are copolymers of phenylketone substituted para-phenylenewith meta-phenylene. SRP-A contains a low amount (less than25 mol%) of m-phenylene recurring units, and SRP-B containsa higher amount of m-phenylene (40–60 mol%). Both copolymersare commercially available under the trade name PRIMOSPIRE�
[17]. The reported tensile moduli for SRP-A and SRP-B are 8.3 and
5.5 GPa, respectively. PPSU has a reported tensile modulus of2.3 GPa [25]. Anhydrous 1-methyl-2-pyrrolidone (NMP), anhydroustoluene, and a 5000 molecular weight polystyrene standard wereobtained from Sigma–Aldrich. Anhydrous solvents were supplied insealed bottles and only opened immediately prior to solutionpreparation. In each case that a polymer solution or solvent wasfiltered, an inorganic membrane filter (Anotop 25, Whatman,Maidstone, UK) was used.
2.2. Sample preparation
For light scattering measurements all glassware was rinsed withfiltered ethanol and dried prior to use to remove any dust collected.Polymer powders were dried in a vacuum oven at 120 �C for 1 hprior to dissolution. Stock solutions were prepared by adding 1 g ofdry polymer to a 100 mL volumetric flask. NMP is a hygroscopicsolvent, and precautions were taken to minimize water absorptionby limiting its exposure to the laboratory environment. To removedust NMP was drawn from a sealed container into a syringe andthen added to the flask through a 0.02 mm pore size filter. Thepolymers were dissolved under nitrogen. The stock solution wasadded to a scintillation vial through a 0.2 mm pore size filter anddiluted solutions were prepared by adding NMP to the same vialthrough a 0.02 mm pore size filter. Using the same scintillation vialto dilute a polymer solution during light scattering minimizes errordue to variations in the scintillation vial since it also serves as themeasurement chamber during batch measurements. The leastconcentrated polymer solutions used during static light scattering(SLS) measurements were used for dynamic light scattering (DLS)measurements. Each solution was stored in a desiccation chamberafter preparation.
Solution cast polymer films were prepared by mixing stocksolutions at 10 wt% in different ratios to make blended solutions. Theblended solutions were applied to glass plates and placed intoa vacuum oven at 30 �C and an absolute pressure of approximately20 kPa to prevent rapid flashing of the solvent. The temperature wasincreased at a rate of 30 �C per hour until 150 �C was reached. Pres-sure was gradually reduced each time the temperature was increaseduntil the maximum vacuum was achieved around 1–2 kPa. The filmswere left in the vacuum oven overnight and placed in a convectionoven at 205 �C for 1 h to remove any remaining solvent.
2.3. Light scattering
The z-average root mean square radius of gyration (<RG>z),weight average molecular weight (Mw), and second virial coeffi-cient (A2) of the polymers in NMP were measured by SLS tech-niques using a multi-angle photometer DAWN DSP (WyattTechnologies Corp, Santa Barbara, CA) in batch mode. This instru-ment uses a He–Ne laser with wavelength (l) of 632.8 nm as theexcitation source. Scintillation vials served as the batch cell, and 11fixed angle detectors between 44� and 147� were used to collect thescattered light. An absolute calibration of the photometer wascarried out using anhydrous toluene filtered through a 0.02 mmpore size filter into a clean scintillation vial. The individual photo-diodes were normalized using an isotropic scattering solution. Theisotropic scattering solution was a narrow molecular weight poly-styrene standard (most probable molecular weight of 5000) intoluene. Polystyrene having this molecular weight in toluene hasa radius of gyration (RG) of approximately 2.3 nm and behaves as anisotropic light scattering solution. The differential refractive indexof each polymer in NMP was measured by a refractometer (Bauschand Lomb), and NMP filtered through a 0.02 mm pore size filter wasused to establish the baseline. SLS data is linearly fitted using Zimmformalism, where K*c/Rtheta is plotted versus sin2(theta/2). K is an

P.J. Jones et al. / Polymer 51 (2010) 738–747740
optical constant, c is solution concentration in g/mL, Rtheta is Ray-leigh’s ratio, and theta is the scattering angle. In each figure the datais extrapolated to both theta¼ 0� and c¼ 0. The inverse of theintercept of each extrapolated line is the weight average molecularweight, Mw. The limiting slope of the line projected to theta¼ 0� atconstant c gives the second virial coefficient (A2). Due to the poly-disperse nature of the polymers investigated the limiting slope ofthe line projected to c¼ 0 at constant theta gives the z-average rootmean square radius of gyration <Rg
2>z [26,27]. The relationshipbetween RG
2 and <RG2>z is given by Eq. (1).
DR2
G
EZ¼X
i
wiMiR2GðiÞ=
Xi
wiMi (1)
The hydrodynamic radii (Rh) of the polymers in NMP weremeasured by DLS using a Malvern Instruments Zetasizer Nanoseries instrument equipped with a He–Ne laser operating ata wavelength of 632.8 nm, an avalanche photodiode detector witha high quantum efficiency, and an ALV/LSE-5003 multiple taudigital correlator electronics system.
2.4. Differential scanning calorimetry
For neat and blended samples the glass transition (Tg) wasmeasured using a Thermal Analysis Instruments Q100 DSC undernitrogen at a flow rate of 50 mL/min. A heating rate of 10 �C/min wasapplied from room temperature to 230 �C. The samples were held at230 �C for 1 min then quenched to 50 �C. A heating rate of 10 �C/minwas applied until 230 �C, and the Tg was determined from the secondheating scan by the temperature on the curve half way between thetangent lines drawn above and below the transition region.
2.5. Contact angle goniometry
Contact angle measurements were conducted via the sessiledrop technique using a Rame’-Hart goniometer coupled withDROP-image� data analysis software. The static contact angleformed by drops of HPLC grade water (11 mL) and diidomethane(DiiM) (2 mL) was measured on each polymer surface immediatelyafter deposition. Ten droplets of each test fluid were analyzed atdifferent locations on each polymer surface. The solid-vaporsurface energies (gSV) of the pure components and blends arecalculated from the measured contact angles (q) of water anddiiodomethane on the polymer surfaces using the Owens–Wendtmodel given by Eq. (2) [28]. This model contains both a dispersiveenergy component (gSV
d ) that accounts for van der Waals forces anda polar energy component (gSV
p ) accounting for dipole–dipole,induced dipole and hydrogen bonding forces.
gSV ¼ gSVd þ gSV
p (2)
The polar and dispersive components of the Owens–Wendt modelare found by combining Good’s and Young’s equations in Eq. (3),where the only unknowns are gd
SV and gpSV. The contact angles of
water and diiodomethane on each polymer surface are used tosolve for the polar and dispersive energy components of each solidpolymer surface by Eq. (3) [29].
ð1þ cosqÞ$g
LVp þ g
LVd
2$gLd
¼ffiffiffiffiffiffiffiffiffiffiffig
SVd
qþ
ffiffiffiffiffiffiffiffiffiffiffig
SVp
q$
ffiffiffiffiffiffiffiffiffiffiffig
LVp
gLV
d
vuut (3)
In the above equation gL is the surface tension of the test fluid, andgp
LV and gdLV are the polar and dispersive components of the surface
tension of the test fluid.
2.6. Atomic force microscopy
AFM micrographs were collected with an Agilent 5500 AFM(Agilent Technologies, Santa Clara, CA) in alternating current modeusing an etched silicon probe with a nominal resonant frequency of275 kHz (RTESP, Veeco Instruments, Santa Barbara, CA). The scanrate was kept at 0.5 Hz, and images are an array of 512� 512 datapoints. Data were processed using Gwyddion version 2.7 softwareto remove artifacts and improve image quality by applying planeleveling, line correction, and scar removal operations. AFM studieswere performed under ambient conditions in a temperature (27 �C)and humidity (40–45%) controlled room. Multiple areas wereimaged for each sample, and representative images are presented.Height and phase images of the pure component and blend surfacemorphologies were obtained on the film surfaces without furthersample preparation. Measurements of root mean square roughness(Rrms) values were taken from AFM micrographs over an area of625 mm2 and calculated using Gwyddion version 2.7 software.
Bulk morphologies of blended systems were investigated byAFM analysis of microtomed surfaces. The films were embedded ina thermally cured epoxy resin. The cured epoxy surrounding thefilm was trimmed away to expose a small surface containing thefilm cross section. The surfaces were cut with a diamond knifeusing a microtome to obtain surfaces that were smooth ona nanoscopic level. After the cross sectional surface of theembedded film was located using an optical microscope, thecantilever was placed directly over the location, and height andphase micrographs were obtained simultaneously.
2.7. Nanoindentation
Hardness and reduced modulus values for all samples werecalculated from load-displacement curves generated by displace-ment controlled indents using a Hysitron Triboindenter (Hysitron,Minneapolis, MN) with a Berkovich diamond probe tip. A trape-zoidal displacement profile with a 5 s hold at the maximumdisplacement and displacement rate of 10 nm/s was applied to thesamples. Ten indents were made in each specimen made ata maximum depth of 100 nm. The shape of the tip was modeled bymaking a series of indents in a fused quartz standard with depthsranging from 80 to 280 nm. Using the known value for the reducedmodulus of fused quartz and the measured contact depth, hc, areawas fitted to a six parameter function of hc using eqn. (4) to give thetip area function, A(hc), in nanometers by the relation:
AðhcÞ ¼ C0*h2c þ C1*hc þ C2*h1=2
c þ C3*h1=4c þ C4*h1=8
c
þ C5*h1=16c (4)
where C0–5 are the parameters for the area function. Load-framecompliance was measured in a similar manner by making indentsin a fused quartz standard. Total compliance is plotted versus 1/(Pmax)1/2, and the intercept is the load-frame compliance [30].
3. Results and discussion
3.1. Solution properties
In Fig. 2 static light scattering (SLS) data are linearly fitted usingZimm formalism, where K*c/Rtheta is plotted versus sin2(theta/2).There is good agreement for Mw from extrapolation of angular andconcentration data, and parallel lines are observed at differentconcentrations and angles. The conformation of the polymer insolution can be determined from the angular dependence of lightscattering from solution [31]. However, this method was not

Fig. 2. Zimm plots: (a) SRP-A (b) SRP-B (c) PPSU.
P.J. Jones et al. / Polymer 51 (2010) 738–747 741
applicable to the polymers under investigation because the angularvariation of light scattering for rods and coils deviates significantlyonly at higher molecular weights. Therefore, dynamic light scat-tering (DLS) was employed to measure the hydrodynamic radius(Rh). The ratio of <RG>z to Rh provides a measure of polymerconformation in solution [32]. The theoretical ratio (<RG>z/Rh) fora hard sphere is 0.778. Random coil polymers demonstrate ratios inthe range of 1.27–2.05, while rod-like polymers show ratios greaterthan 2.2 [33–38].
Data from SLS and DLS are summarized in Table 1. SRP-A has anMw of 32,000, SRP-B has a slightly higher molecular weight of34,000 and the molecular weight of PPSU is 26,000. The <RG>z/Rh
values for the polymers indicate that each adopts a rodlikeconformation when dissolved in NMP. SRP-A has the mostextended conformation followed by PPSU and then SRP-B. SRP-A isexpected to have a more extended conformation than SRP-B due to
Table 1Summary of SLS and DLS measurements for SRP-A, SRP-B, and PPSU.
SRP-A SRP-B PPSU
Mw 32,000 34,000 26,000<RG>z (nm) 22.5 19.1 18.6Rh (nm) 6.3 8.0 8.5<RG>z/Rh 3.6 2.4 2.9A2 (mol*mL/g2) 1.67 � 10�3 1.59 � 10�3 2.31 � 10�3
c0 0.265 0.283 0.233
the greater number of para linkages between phenylene units inthe copolymer backbone, while SRP-B contains a greater number ofmeta backbone linkages that reduce its degree of linearity. Thereduced linearity in SRP-B results in a reduction in the <RG>z incomparison to that of SRP-A, even though SRP-B has a greatermolecular weight. The reduced degree of linearity of SRP-B isexpected to provide an increased ability to form homogeneousblends with PPSU by increasing the free volume of the SRP phase.This increase in free volume relaxes the steric constraints asso-ciated with the SRP phase and helps prevent entropic demixing.
The second virial coefficient (A2) measured from SLS is reportedin Table 1. It reflects the strength of the interaction between thepolymer and NMP and is used to calculate the polymer–solventinteraction parameter as concentration approaches zero (co) of thesystem by the following relation [39]:
co ¼ 0:5� r2*V*A2 (5)
where r is the density of the polymer and V is the solvent molarvolume. Polymer–solvent interaction decreases in the orderPPSU> SRP-A> SRP-B. These results compare well with observa-tions from dissolution of the polymers in NMP. PPSU dissolved ina short time at room temperature with stirring at a concentration of10 g PPSU per 100 mL of solution. At the same concentration bothSRPs required elevated temperatures to dissolve, but SRP-Brequired the most time. The increased solubility of SRP-A in NMPcompared to SRP-B is explained by the higher benzoyl substitutionin SRP-A which provides increased interaction with the solvent. Thesimilarities of the co values calculated from the A2 indicate a lowenthalpy of mixing for PPSU with SRP [40].
3.2. Bulk properties of pure components and blends
Blends were first assessed for miscibility by a visual inspec-tion of films cast from blend solutions. PPSU, SRP-A and SRP-Bpolymers produce transparent, amorphous films when solutioncast. The films are free standing with thicknesses greater than25 mm. The difference in refractive index between PPSU and theSRPs is greater than 0.01, and thus a valid assumption con-cerning miscibility can be made by optical inspection [41,42].Films prepared from blends containing PPSU and SRP-B appeartransparent over the entire range of compositions, indicatingthat a homogeneous blend is produced during solution casting.Films prepared from blends containing PPSU and SRP-A aretransparent at 20 wt% concentrations of the minor component,but those with an SRP-A content between 40 and 60 wt% havea cloudy appearance, indicating the presence of compositionalheterogeneities.
The glass transition behavior of polymer blends is an indicationof bulk blend miscibility. A single, well-defined glass transition ischaracteristic of a miscible blend, while multiple glass transitionsindicate that the blend components possess phase separation or areonly partially miscible [43]. Two conditions must be met forassessment of miscibility by a single glass transition. The blendmust contain at least 10–20 wt% of the minor component, and thedifference in the glass transition of the two components must be atleast 20 �C [44,45]. Both of these conditions are satisfied in thisstudy with the minor component content being greater than20 wt% and the difference in the glass transitions between the SRPand PPSU being greater than 55 �C. Glass transition behavior issummarized in Table 2. Blends containing SRP-B and PPSU showa single, well-defined glass transition over the entire compositionrange, and blends of SRP-A and PPSU where the minor componentis 20 wt% also show a single glass transition. Blends containing SRP-A and PPSU where the minor component content is approximately

Table 2Glass transition behavior of neat and blended films cast from 10 wt% polymersolutions measured by DSC and their relation to the Fox equation.
Mass FractionPPSU
Mass FractionSRP-A
Mass FractionSRP-B
Glass Transition(�C)
Predicted GlassTransition (�C)a
0.000 1.000 0.000 161 1610.220 0.780 0.000 159 1730.418 0.582 0.000 159, 210 1840.623 0.377 0.000 160, 211 1960.808 0.192 0.000 211 2070.000 0.000 1.000 164 1640.205 0.000 0.795 174 1740.407 0.000 0.593 185 1850.606 0.000 0.394 195 1960.805 0.000 0.195 209 2081.000 0.000 0.000 220 220
a Theoretical glass transition predicted by Fox equation.
Fig. 3. AFM height (left) and corresponding phase (right) images of blends con-taining SRP-A and PPSU: (a) 20/80 SRP-A/PPSU, Z-scale¼ 30 nm; (b) 20/80 SRP-A/PPSU, Z-scale¼ 90�: (c) 40/60 SRP-A/PPSU, Z-scale¼ 20 nm; (d) 40/60 SRP-A/PPSU,Z-scale¼ 60�; (e) 60/40 SRP-A/PPSU, Z-scale¼ 15 nm; (f) 60/40 SRP-A/PPSU,Z-scale¼ 60�; (g) 80/20 SRP-A/PPSU, Z-scale¼ 30 nm; (h) 80/20 SRP-A/PPSU,Z-scale¼ 120� . The above images were taken on the cross sectional surfaces of thesolution cast blends. Each image is 5 mm� 5 mm.
P.J. Jones et al. / Polymer 51 (2010) 738–747742
40 wt% display two glass transitions indicating an immiscibleblend.
A simple and convenient method to predict the temperature ofthe glass transition when there are weak polymer–polymer inter-actions is application of the Fox equation [46]:
1=Tg ¼ w1=Tg1 þw2=Tg2 (6)
where Tg is the glass transition temperature of the blend and wrefers to the weight fraction. The subscripts 1 and 2 refer to thecomponents of the blend. Blends of SRP-B and PPSU follow the Foxequation well, but those containing SRP-A and PPSU displaysignificant deviations. Although blends containing SRP-A where theminor component is 20 wt% display a single Tg the actual temper-ature of the Tg is weighted towards the major component of theblend.
Microtomed samples were analyzed by AFM to investigate thebulk morphology of blended systems. AFM images of the SRP-A/PPSU film cross sections are shown in Fig. 3. These films exhibitbulk morphologies characteristic of metastable and unstableblends. The 20/80 (3a,b) and 80/20 (3g,h) SRP-A/PPSU blendsdisplay isolated regions of phase separated components that aredispersed in a predominantly homogeneous continuous phase. The40/60 (3c,d) and 60/40 (3e,f) SRP-A/PPSU blends display co-continuous morphologies with larger phase dimensions [47].Micrographs of the 40/60 and 60/40 SRP-B/PPSU blends are shownin Fig. 4. In contrast to the morphologies observed in the SRP-A/PPSU blends, the morphologies of SRP-B/PPSU blends appearhomogeneous with no evidence of phase separation or composi-tional fluctuations.
3.3. Surface properties of pure components and blends
The surface properties of polymer blends often deviate fromthose observed in the bulk. Differences in surface energy betweenthe pure components of the blend lead to surface enrichment of thelower energy component. This phenomenon increases the concen-tration of one component at the surface and can induce phaseseparation in a metastable blend by creating large fluctuations inconcentration over the polymer surface [48]. The measured contactangles, surface free energies and surface roughness (Rrms) values forthe pure components and the blends are shown in Table 3. Standarddeviations were calculated following propagation of uncertaintymethod and are shown in parenthesis next to the measurement orcalculation.
SRPs exhibit slightly lower surface energy than PPSU indicatingthat a small driving force exists for surface enrichment of SRPin SRP/PPSU blends. The surface free energy of the blends is
consistently lower than that of the pure components. Blends con-taining SRP-B and PPSU that displayed miscible characteristicsaccording to bulk analysis techniques show only a small drop insurface free energy with respect to the pure components, whileblends containing SRP-A and PPSU that displayed immiscible bulkcharacteristics display a significant drop in surface free energy.
The drop in surface free energy is correlated with surfaceroughness. Roughness and compositional heterogeneities presenton blend surfaces can increase the observed contact angles of testfluids by inhibiting spreading, leading to a reduction in measuredsurface free energy [49,50]. The roughness induced by surface

Fig. 4. AFM height (left) and corresponding phase (right) images of blends con-taining SRP-B and PPSU: (a) 40/60 SRP-B/PPSU, Z-scale¼ 20 nm; (b) 40/60 SRP-B/PPSU, Z-scale¼ 60�: (c) 60/40 SRP-B/PPSU, Z-scale¼ 20 nm; (d) 60/40 SRP-B/PPSU,Z-scale¼ 60� . The above images were taken on the cross sectional surface of thesolution cast blends. Each image is 5 mm� 5 mm.
P.J. Jones et al. / Polymer 51 (2010) 738–747 743
phase separation in SRP-A/PPSU blends (Fig. 7) is responsible forthe lower measured surface free energy in these blends. SRP-B/PPSU blends (Fig. 6) have a lower degree of roughness and thusshow only a moderate drop in surface free energy. The purecomponent surfaces (Fig. 5) have the lowest degree of surfaceroughness and are free of large compositional heterogeneities. Thesmooth, pure component surfaces give the most accurate assess-ment of the surface free energy.
The surface topographies of neat films of PPSU, SRP-A, and SRP-Bare presented as AFM height images in Fig. 5. The different poly-mers exhibit similar surface morphologies with low degrees of Rrms.The surfaces are composed of predominantly homogeneousfeatures with isolated heterogeneities, appearing as bright spots. Inthe homogeneous region of the surfaces the features are approxi-mately 30–60 nm in diameter with heights ranging from 0.1 to2 nm. The isolated heterogeneities are larger, having diametersranging from 75 to 150 nm and heights on the order of 10 nm ineach case. Due to the tight packing of the surface features in theneat films and the ratio of their diameter to height, it is apparent
Table 3Contact angles, surface free energies, and roughness for pure polymers and blends.
qwater (deg.) qDiiM (deg.) gSV (mJ/m2) Roughness (nm)
Pure ComponentsSRP-A 70.7(0.5) 29.5(1.7) 50.8(0.3) 0.60SRP-B 71.3(0.8) 30.2(2.9) 50.3(0.5) 1.85PPSU 70.1(0.5) 26.2(1.3) 52.0(0.5) 0.77
Blends20/80 SRP-A/PPSU 91.7(1.6) 54.0(2.0) 33.7(0.6) 10.940/60 SRP-A/PPSU 82.4(0.4) 26.2(1.0) 47.9(0.2) 10.760/40 SRP-A/PPSU 93.1(0.6) 56.6(1.1) 32.2(0.2) 5.0980/20 SRP-A/PPSU 95.2(1.3) 56.2(2.0) 32.0(0.5) 1.6420/80 SRP-B/PPSU 80.0(0.6) 26.1(0.7) 48.6(0.3) 0.7240/60 SRP-B/PPSU 79.1(0.2) 25.1(0.6) 49.1(0.1) 0.7160/40 SRP-B/PPSU 82.6(0.7) 27.5(1.5) 47.4(0.3) 0.9280/20 SRP-B/PPSU 82.5(0.6) 27.4(1.6) 47.5(0.3) 1.93
Fig. 5. AFM height images of neat polymer films: (a) PPSU (b) SRP-A (c) SRP-B. In allheight images the vertical axis (Z-scale) is set to a 10 nm data scale.
that both homogeneous and heterogeneous features are notspherical, but possess either a cylindrical or disk shape. However,the distinction between cylinders and disks cannot be madewithout knowledge of the morphology below the surface, and theexact nature of the heterogeneities remains unknown. A possible

P.J. Jones et al. / Polymer 51 (2010) 738–747744
explanation is that they are nanoscopic crystallites that form on thesurface during solution casting and are predominately composed oflow molecular weight polymer species.
Blends of SRP-B and PPSU (Fig. 6) show surface morphologiessimilar to those of the pure components. Small bright features areobserved, but there is no evidence of phase separation in theblends. These surfaces exhibit low degrees of roughness attributedto the small bright features rather than high levels of roughnesscaused by phase separation or metastability. These blends appearprimarily homogeneous and display miscible characteristics.
Blends of SRP-A and PPSU demonstrate completely differentsurface morphologies that are strongly dependent upon blendcomposition, representative of metastable and immiscible blends.Fig. 7 shows AFM height images that are representative of thedifferent morphologies exhibited for blends containing 20, 40, 60,and 80 wt% SRP-A. The blend containing 20 wt% SRP-A (Fig. 7a) hasa continuous granular morphology with surface roughness of10.9 nm. The granules show evidence of coalescence into structureshaving extended dimensions of 300–400 nm and widths ofapproximately 100 nm. Although the appearance of coalescedparticles indicates the initial stages of phase separation, a clearinterface between regions of SRP-A and PPSU is not apparent.When the fraction of SRP-A is increased to 40 wt% (Fig. 7b) phaseseparation is evident, and a clear interface is observed betweendomains of SRP-A and PPSU. This surface exhibits well definedisland structures above a pitted surface. These islands have a height
Fig. 6. AFM height images of solution cast polymer blends containing SRP-B and PPSU: (a)SRP-B/PPSU, Z-scale¼ 20 nm; (d) 80/20 SRP-B/PPSU, Z-scale¼ 25 nm.
of up to 50 nm and diameters between 100 and 500 nm, while thepits are up to 200 nm wide with a depth of 30 nm. The 60 wt% SRP-A blend (Fig. 7c) displays a continuous, elevated surface with largepits, but no interface is observed between elevated regions and pits.The surface has an Rrms of 5.09 nm. The 80 wt% SRP-A (Fig. 7d)blend has a surface morphology and roughness similar to that ofthe pure components.
3.4. Nanomechanical properties of films
The experimental values for hardness (H) and reduced modulus(Er) presented in Fig. 8 are calculated by the contact mechanicsrelationships developed by Oliver and Pharr [51]. The relationshipsfor H and Er are given by Eqs (7) and (8), respectively as:
H ¼ Pmax=AðhcÞ (7)
1=Er ¼ ðvhc=vPÞ*2*
� ffiffiffiffiffiffiffiffiffiffiffiffiAðhcÞ
q=ffiffiffipp �
(8)
where P is applied load, and Pmax is the maximum applied load. Theerror bars associated with each data point represent one standarddeviation based on ten indentation measurements. The anticipateddegree of mechanical reinforcement, predicted by the rule ofmixtures, is indicated by a solid line on each graph in Fig. 8. Thelinearity of the data for all systems in Fig. 8 indicates that their
20/80 SRP-B/PPSU, Z-scale¼ 10 nm; (b) 40/60 SRP-B/PPSU, Z-scale¼ 10 nm; (c) 60/40

Fig. 7. AFM height images of solution cast polymer blends containing SRP-A and PPSU: (a) 20/80 SRP-A/PPSU, Z-scale¼ 75 nm; (b) 40/60 SRP-A/PPSU, Z-scale¼ 100 nm; (c) 60/40SRP-A/PPSU, Z-scale¼ 50 nm; (d) 80/20 SRP-A/PPSU, Z-scale¼ 20 nm.
P.J. Jones et al. / Polymer 51 (2010) 738–747 745
mechanical performance follows the rule of mixtures well. SRP-Ahas higher H and Er than SRP-B, and blends containing SRP-Aexhibit the same trend. The standard deviations associated withSRP-A blends are nearly two times greater than those observed forSRP-B blends, indicating higher surface heterogeneity for the SRP-Ablends. The increase in surface heterogeneity indicates phasesegregation of the SRP-A component at the surface. We explain thisbehavior by migration of the SRP during the final stages of solutioncasting. At the final temperature of solvent removal, 205 �C, thelower Tg SRPs are able to undergo long range segmental motion andare driven towards the surface.
3.5. Relation of copolymer structure to miscibility, morphology,and nanomechanics of blends
Light scattering measurements of A2 and co parameters revealedmore similar values for SRP-A and PPSU than SRP-B and PPSU. ThusSRP-A is expected to have a lower enthalpy of mixing with PPSU thanSRP-B. However, based on Tg measurements as well as bulk andsurface morphology images, SRP-B is more compatible with PPSUthan SRP-A. This can be explained in terms of chain conformationand flexibility. Light scattering measurements reveal that all threepolymers adopt rod-like conformations in NMP, with SRP-A havingthe most extended conformation, followed by PPSU, and with SRP-B
having the least extended conformation. The SRP backbone struc-ture, formed by a combination of meta-phenylene and para-phe-nylene recurring units, possesses some degree of flexibility related tothe number of meta linkages present. The PPSU molecule demon-strates increased flexibility due to the presence of sulfone and etherlinkages in the backbone [10]. As the solution becomes concentratedPPSU deforms to accommodate restrictions placed on it by the highlyrigid SRPs. From light scattering measurements the ratio of<RG>z/Rh
of SRP-B is much closer to PPSU than that of SRP-A. Blends con-taining SRP-A are more susceptible to entropic demixing. The moreextended structure of SRP-A excludes PPSU from penetrating into therigid phase by restricting the conformational freedom of PPSU. Thisleads to incompatible, heterogeneous blends of SRP-A and PPSU.SRP-B has a more kinked and less extended conformation that ismore similar to that of PPSU than SRP-A. There is less restriction onthe conformational freedom of PPSU leading to compatible, homo-geneous blends.
Based on the lower surface energy calculated for the SRPs,surface enrichment of SRP is favored for the blends. Surfaceroughness and compositional heterogeneities lead to lowermeasured surface free energy for the blends in comparison to theirpure components. AFM studies indicate surface enrichment of SRP-A in the solution cast films. In addition to surface free energycontributions, the method of solvent removal can have strong
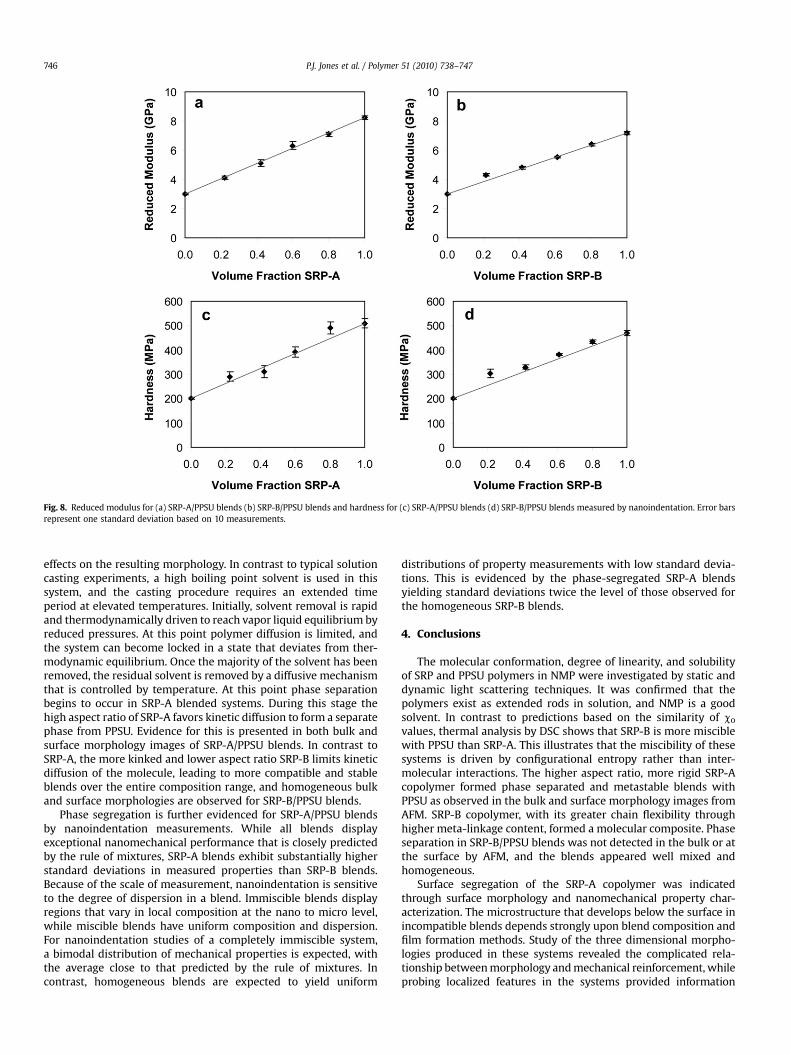
Fig. 8. Reduced modulus for (a) SRP-A/PPSU blends (b) SRP-B/PPSU blends and hardness for (c) SRP-A/PPSU blends (d) SRP-B/PPSU blends measured by nanoindentation. Error barsrepresent one standard deviation based on 10 measurements.
P.J. Jones et al. / Polymer 51 (2010) 738–747746
effects on the resulting morphology. In contrast to typical solutioncasting experiments, a high boiling point solvent is used in thissystem, and the casting procedure requires an extended timeperiod at elevated temperatures. Initially, solvent removal is rapidand thermodynamically driven to reach vapor liquid equilibrium byreduced pressures. At this point polymer diffusion is limited, andthe system can become locked in a state that deviates from ther-modynamic equilibrium. Once the majority of the solvent has beenremoved, the residual solvent is removed by a diffusive mechanismthat is controlled by temperature. At this point phase separationbegins to occur in SRP-A blended systems. During this stage thehigh aspect ratio of SRP-A favors kinetic diffusion to form a separatephase from PPSU. Evidence for this is presented in both bulk andsurface morphology images of SRP-A/PPSU blends. In contrast toSRP-A, the more kinked and lower aspect ratio SRP-B limits kineticdiffusion of the molecule, leading to more compatible and stableblends over the entire composition range, and homogeneous bulkand surface morphologies are observed for SRP-B/PPSU blends.
Phase segregation is further evidenced for SRP-A/PPSU blendsby nanoindentation measurements. While all blends displayexceptional nanomechanical performance that is closely predictedby the rule of mixtures, SRP-A blends exhibit substantially higherstandard deviations in measured properties than SRP-B blends.Because of the scale of measurement, nanoindentation is sensitiveto the degree of dispersion in a blend. Immiscible blends displayregions that vary in local composition at the nano to micro level,while miscible blends have uniform composition and dispersion.For nanoindentation studies of a completely immiscible system,a bimodal distribution of mechanical properties is expected, withthe average close to that predicted by the rule of mixtures. Incontrast, homogeneous blends are expected to yield uniform
distributions of property measurements with low standard devia-tions. This is evidenced by the phase-segregated SRP-A blendsyielding standard deviations twice the level of those observed forthe homogeneous SRP-B blends.
4. Conclusions
The molecular conformation, degree of linearity, and solubilityof SRP and PPSU polymers in NMP were investigated by static anddynamic light scattering techniques. It was confirmed that thepolymers exist as extended rods in solution, and NMP is a goodsolvent. In contrast to predictions based on the similarity of co
values, thermal analysis by DSC shows that SRP-B is more misciblewith PPSU than SRP-A. This illustrates that the miscibility of thesesystems is driven by configurational entropy rather than inter-molecular interactions. The higher aspect ratio, more rigid SRP-Acopolymer formed phase separated and metastable blends withPPSU as observed in the bulk and surface morphology images fromAFM. SRP-B copolymer, with its greater chain flexibility throughhigher meta-linkage content, formed a molecular composite. Phaseseparation in SRP-B/PPSU blends was not detected in the bulk or atthe surface by AFM, and the blends appeared well mixed andhomogeneous.
Surface segregation of the SRP-A copolymer was indicatedthrough surface morphology and nanomechanical property char-acterization. The microstructure that develops below the surface inincompatible blends depends strongly upon blend composition andfilm formation methods. Study of the three dimensional morpho-logies produced in these systems revealed the complicated rela-tionship between morphology and mechanical reinforcement, whileprobing localized features in the systems provided information

P.J. Jones et al. / Polymer 51 (2010) 738–747 747
about local composition. The observed increase in mechanicalproperties at the surface of the films and development of compli-cated surface morphologies indicate the potential for the formationof PPSU/SRP blends that exhibit synergistic properties basedon nano/microphase separation. Thermal, nanomechanical,and morphological characterization show that stable reinforcedPPSU/SRP blends can be created and tailored through control of SPRcopolymer architecture.
Acknowledgements
Partial funding from Solvay Advanced Polymers is gratefullyacknowledged. This work was also supported by the major researchinstrumentation program of the National Science Foundation underAward Number DMR-0421403 and through instrumentation sup-ported by the Office of Naval Research, Award No. N00014-07-1-1057.
References
[1] Lindenmeyer PH. Polym Eng Sci 1975;15:236–7.[2] Krause SH, Haddock TB, Price GE, Adams WW. Polymer 1988;29:195–206.[3] Venkatasubramian N, Dean DR, Dang TD, Price GE, Arnold FE. Polymer
2000;41:3213–26.[4] Fukai T, Yang JC, Kyu T, Cheng SZD, Lee SK, Hsu SLC, et al. Polymer
1992;33(17):3621–6.[5] Ballauf M, Dorgan JR. Polymer blends. In: Paul DR, Bucknall CB, editors.
Formulation, vol 1. New York: Wiley; 2000. p. 200.[6] Abe A, Flory PJ. Macromolecules 1978;11:1122–6.[7] Ciferri A. Polym Eng Sci 1994;34:377–8.[8] Hwang WF, Wiff DR, Benner CL, Helmeniak TE. J Macromol Sci Phys
1983;22:231–57.[9] Flory PJ. Macromolecules 1978;11:1138–41.
[10] Flory PJ. Macromolecules 1978;11:1141–4.[11] Bianchi E, Ciferri A, Conio G, Marsano E, Tealdi A. Macromolecules
1984;17:1526–31.[12] Schartel B, Wendorff JH. Polym Eng Sci 1999;39:128–51.[13] Trimmer MS, Wang Y, Marrocco ML, Lee VJ. US Patent 1999:5,886,130.[14] Marrocco ML, Gagne RR, Trimmer MS. US Patent 1993:5,227,457.[15] Marrocco ML, Trimmer MS, Hsu LC, Gagne RR. 39th Int SAMPE Symp
1994;39:1063–71.[16] Morgan SE, Misra R, Jones PJ. Polymer 2006;47:2865–73.
[17] Thomas DB, Maljkovic N, Schuler T, Rushing T, Carter RL. Int Patent 2007:WO2007/101852 A2.
[18] El-Hibri MJ, Myrick LJ, Thomas DB, Carter RL, Maljkovic N, Davis C, et-al. IntPatent 2007:WO 2007/101858 A2.
[19] El-Hibri MJ, Maljkovic N, Chavers RB, Massillon H. US Patent 20080312387.[20] Yung HH, Scott SE, Thomas EL. Polymer 2001;42:6463–72.[21] Robard A, Patterson D, Delmas G. Macromolecules 1977;10:706–8.[22] Nandi AK, Mandal BM, Bhattacharyya SN. Macromolecules 1985;18:1454–60.[23] Nishmoto M, Keskkula H, Paul DR. Polymer 1991;32:272–8.[24] Ton-That C, Shard AG, Teare DOH, Bradley RH. Polymer 2001;42:1121–9.[25] http://solvayadvancedpolymers.com [accessed 08 02 2009].[26] Zimm BH. J Chem Phys 1945;13:141–5.[27] Wyatt PJ. Analytica Chemica Acta 1993;272:1–40.[28] Owens D, Wendt R. J Appl Polym Sci 1969;13:1741–7.[29] Gurau V, Bluemle MJ, De Castro ES, Tsou YM, Mann A, Zawodzinski TA. J Power
Sources 2006;160:1156–62.[30] Triboindenter� users manual; NRL-M-011 v3.0. Minneapolis, MN: Hysitron
Incorporated; 2003.[31] Doty P, Bunce BH. J Am Chem Soc 1952;74:5029–34.[32] Liu Y, Bo S. Chromatographia 2004;59:299–303.[33] Burchard W, Schmidt M, Stockmayer WH. Macromolecules 1985;13:580–7.[34] Rey A, Freire JJ, Garcia de la Torre J. Macromolecules 1987;20:342–6.[35] Akcasu ZA, Benmouna M. Macromolecules 1978;11:1193–8.[36] Reisman J, Kirkwood JG. J Chem Phys 1950;18:512–6.[37] Mueller A, Buchard W. Colloid Polym Sci 1995;273:866–75.[38] Savin G, Burchard W, Luca C, Beldie C. Macromolecules 2004;37:6565–75.[39] Barton AF, editor. CRC handbook of polymer–liquid interaction parameters
and solubility parameters. Boca Raton: CRC Press; 1990. p. 8.[40] Gedde UW. Polymer physics. Dordrecht: Kluwer Academic Publishers; 2001.
p. 72.[41] Bohn L. In: Brandup J, Immergut EH, editors. Polymer handbook. New York:
Wiley; 1975. p. III-211.[42] Merfeld GD, Paul DR. Polymer blends. In: Paul DR, Bucknall CB, editors.
Formulation, vol. 1. New York: Wiley; 2000. p. 55–92.[43] Olabisi O, Robeson LM, Shaw MT. Polymer–polymer miscibility. New York:
Academic Press; 1979.[44] MacKnight WJ, Karasz FE, Fried JR. In: Paul DR, Newman S, editors. Polymer
blends. New York: Academic Press; 1978.[45] Karasz FE. In: Walsh DJ, Higgins JS, Maconnachie A, editors. Polymer blends
and mixtures. Boston: Matinus Nijhoff Publishers; 1985.[46] Fox TG. Bull Am Phys Soc 1956;1:123.[47] Wen G, Li X, Liao Y. An L. Polymer 2003;44(14):4035–45.[48] Jones RAL, Kramer EJ, Rafailovich MJ, Sokolov J, Schwartz SA. Phys Rev Lett
1986;62:280–3.[49] de Gennes PG. Rev Mod Phys 1985;57:827–63.[50] Dettre R, Johnson R. In: Fowkes FM, editor. Contact angle, wettability and
adhesion. Washington D.C.: American Chemical Society; 1964.[51] Oliver WC, Pharr GM. J Mater Res 1992;7:1564–83.