1 random early detection gateways for congestion avoidance sally floyd and van jacobson, ieee...
Post on 20-Dec-2015
214 views
TRANSCRIPT

1
Random Early Detection Gateways for Congestion Avoidance
Sally Floyd and Van Jacobson,
IEEE Transactions on Networking, Vol.1, No. 4, (Aug 1993), pp.397-413.
This slides are largely based on Bob Kinicki’s talk at WPI
2
IntroductionMain idea :: to provide congestion signal at the
router for TCP flows.• RED Algorithm Goals
– The primary goal is to provide congestion avoidance by controlling the average queue size such that the router stays in a region of low delay and high throughput.
– To avoid global synchronization (e.g., in Tahoe TCP).
– To control misbehaving users (this is from a fairness context).
– To seek a mechanism that is not biased against bursty traffic. What bias?

3
Previous Work
• Drop Tail
• Random Drop
• Early Random Drop
• Source Quench messages
• DECbit scheme

4
Drop Tail Router
• FIFO queuing mechanism that drops packets from the tail when the queue overflows.
• Introduces global synchronization when packets are dropped from several connections.
5
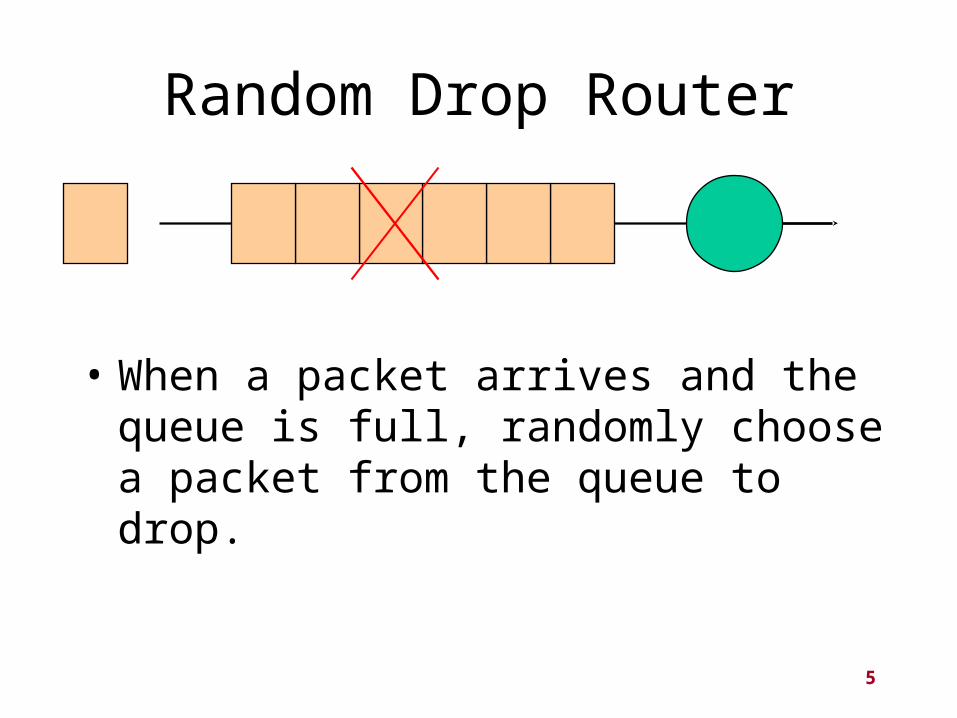
Random Drop Router
• When a packet arrives and the queue is full, randomly choose a packet from the queue to drop.

6
Early Random Drop Router
• If the queue length exceeds a drop level, then the router drops each arriving packet with a fixed drop probability.
• Reduces global synchronization
• Does not control misbehaving users (UDP)
p
Drop level
7
Source Quench messages
• Router sends source quench messages back to source before the queue reaches capacity.
• Complex solution that gets router involved in end-to-end protocol.

8
DECbit scheme• Uses a congestion-indication bit in packet header to
provide feedback about congestion.• Upon packet arrival, the average queue length is
calculated for last (busy + idle) period plus current busy period.
• When the average queue length exceeds one, the router sets the congestion-indicator bit in arriving packet’s header.
• If at least half of packets in source’s last window have the bit set, decrease the congestion window exponentially.

9
RED Algorithm
for each packet arrival
calculate the average queue size avg
if minth <= avg < maxth
calculate the probability pa
with probability pa:
mark/drop the arriving packet
else if maxth <= avg
mark/drop the arriving packet.

10
RED drop probability ( pa )
pb = maxp x (avg - minth)/(maxth - minth) [1]
where
pa = pb/ (1 - count x pb) [2]
count: no of pkt since last marking
Note: this calculation assumes queue size is measured in packets. If queue is in bytes, we need to add [1.a] between [1] and [2]
pb = pb x PacketSize/MaxPacketSize [1.a]

11
avg - average queue length
avg = (1 – wq) x avg + wq x q
where q is the newly measured queue length.
what is the effect of wq on RED’s behavior?
This exponential weighted moving average is designed such that short-term increases in queue size from bursty traffic or transient congestion do not significantly increase average queue size.

12
RED/ECN Router Mechanism
1
0
Average Queue Length
minth maxth
Dropping/Marking Probability
Queue Size
maxp
What is the effect of each parameter on RED behavior?

13
RED parameter settings• wq suggest 0.001 <= wq <= 0.0042
authors use wq = 0.002 for simulations• minth, maxth depend on desired average queue size
– bursty traffic increase minth to maintain link utilization. – maxth depends on the maximum average delay allowed.– RED is most effective when maxth - minth is larger than
typical increase in calculated average queue size in one round-trip time. Why?
– “parameter setting rule of thumb”: maxth at least twice minth . However, maxth = 3 times minth is used in some of the experiments shown.

14
packet-marking probability• The goal is to uniformly spread out the marked
packets. This reduces global synchronization.
• Q: how to map pb to pa ?
Method 1: geometric random variable
When each packet is marked with probability pb,, the packet inter-marking time, X, is a geometric random variable with E[X] = 1/ pb.
• This distribution could both cluster packet drops and cause long intervals between drops => global sync.

15
packet-marking probability
Method 2: uniform random variable
Mark packet with probability pb/ (1 - count x pb) where count is the number of unmarked packets that have arrived since last marked packet.
E[X] = 1/(2 pb) + 1/2

16
Method 1: geometric p = 0.02
Method 2: uniform p = 0.01
Result :: marked packets more clustered for method 1 uniform is better at eliminating “bursty drops”

17
Setting maxp
• “RED performs best when packet-marking probability changes fairly slowly as the average queue size changes.”– This is a stability argument in that the claim is that RED
with small maxp will reduce oscillations in avg and actual marking probability.
• They recommend that maxp never be greater than 0.1
Does a single value of maxp works in a wide range of network traffic patterns? Why?

18
RED Simulations
• Figure 4: Four heterogeneous FTP sources
• Figure 6: Two homogeneous FTP sources
• Figure 10: 41 Two-way, short FTP and TELNET flows
• Figure 11: Four FTP non-bursty flows and one bursty FTP flow

19
Simple Simulation
Four Heterogeneous FTP Sources
TCP Tahoe
1KB packet size
wq = 0.002maxp = 1/50minth = 5maxth = 15max cwnd = bw*delayLarge Buffer at GW

20

21
Two Homogeneous FTP Sources
•RED varies minth from 3 to 50 packets•Drop Tail varies buffer from 15 to 140 packets• max cwnd = 240 packets

22
Two Homogeneous FTP Sources
Each point in Figure 5 is obtained from separate simulation.
RED yields lower queuing delay as utilization improves by increasing minth from 3 to 50 packets.
Drop-tail yields unacceptable delay at high utilization.
The power (throughput/delay) measure is better for RED !

23
Network with 41 Short Duration Connections
Two-way traffic of FTP and
TELNET traffic .
Total number of packets per
Connection varies from 20
To 400 packets.

24
Figure 9
Short, two-way
FTP and TELNET flows
- RED controls the average
queue size.
- Flows have small cwnd
maximums (8 or 16).
-RED causes large # of pkt drop
due to heavy congestion
- Utilization is low (61%/59%).
-ACK-compression causes
bursty packet arrivals.
.

25
Five FTP Flows
Including One Bursty Flow

26
Simulation Details
• Bursty traffic = large RTT, small cwnd• Other traffic = small RTT, small cwnd
{robust flows}• Node 5 :: the bursty flow cwnd = 8 packets• Each simulation run for 10 seconds and
each mark in figures represents one second.– Marks present one second of simulation
• What is the effect of RED on bursty traffic?

27
Drop Tail Gateways
Buffer size ranging from 8 to 22 pkts

28
Random Drop Gateways
Buffer size ranging from 8 to 22 pkts

29
RED Gateways
Min. Threshold ranging from 3 to 14 and
Buffer size ranging from 12 to 56 pkts

30
Evaluation of RED meeting design goals
• congestion avoidance– If RED drops packets, this guarantees the
calculated average queue size does not exceed the max threshold. If wq is set properly, RED controls the actual average queue size.
– If RED marks packets when avg exceeds maxth, the router relies on source cooperation to control the average queue size.

31
Evaluation of RED meeting design goals
• appropriate time scales– The detection time scale roughly matches time
scale of response to congestion. Why?– RED does not notify connections during
transient congestion at the router.

32
Evaluation of RED meeting design goals
• no global synchronization– RED avoids global synchronization by marking at as low
a rate as possible with marking distribution spread out.
• simplicity– detailed argument about how to cheaply implement in
terms of adds and shifts.
• {Historically, the simplicity of RED has been strongly questioned because RED has too many parameters to make it robust.}

33
Evaluation of RED meeting design goals
• maximizing global power– power defined as ratio of throughput to delay– see Figure 5 for comparison against drop tail.
• fairness– authors claim not well-defined– {This is an obvious side-step of this issue.}– [later this becomes a big deal - see FRED
paper.]

34
Conclusions
• RED is effective mechanism for congestion avoidance at the router in cooperation with TCP.
• The probability that RED chooses a particular connection to notify during congestion is roughly proportional to that connection’s share of the bandwidth.

35
Future Work• Is RED really fair?• How do we tune/config RED?• Is there a way to optimize power?• What happens with other versions of TCP?• How does RED work when mixed with
drop tail routers?• How robust is RED?• What happens when there are many flows?