1 quarter 2018 results -...
TRANSCRIPT

Cop
yri
gh
t ©
20
18
Th
e N
iels
en
Com
pa
ny (
US
), L
LC
. C
on
fid
en
tia
l a
nd
pro
pri
eta
ry. D
o n
ot d
istr
ibu
te.
1ST QUARTER 2018 RESULTSTHURSDAY APRIL 26, 2018
8:00 AM ET
NYSE: NLSN4/27/18: Updated to reflect the addition of footnote (a) on slide 26
Cop
yri
gh
t ©
20
18
Th
e N
iels
en
Com
pa
ny (
US
), L
LC
. C
on
fid
en
tia
l a
nd
pro
pri
eta
ry. D
o n
ot d
istr
ibu
te.
2
The following discussion contains forward-looking statements, including those about Nielsen’s outlook
and prospects, that relate to the Private Securities Litigation Reform Act of 1995. Forward-looking
statements are those which are not historical facts. These and other statements that relate to future
results and events are based on Nielsen’s current expectations as of April 26, 2018.
Our actual results in future periods may differ materially from those currently expected because of a
number of risks and uncertainties. The risks and uncertainties that we believe are material are outlined in
our disclosure filings and materials, which you can find on http://ir.nielsen.com, such as our most recent
10-K, 10-Q and 8-K reports. Please consult these documents for a more complete understanding of
these risks and uncertainties. We disclaim any intention or obligation to update or revise any forward-
looking statements, whether as a result of new information, future events or otherwise, except as may be
required by law.
Our outlook is provided for the purpose of providing information about current expectations for 2018. This
information may not be appropriate for other purposes.
SAFE HARBOR FOR FORWARD-LOOKING
STATEMENTS

This artwork was created using Nielsen data.
Copyright © 2018 The Nielsen Company (US), LLC. Confidential and proprietary. Do not distribute.
Cop
yri
gh
t ©
20
18
Th
e N
iels
en
Com
pa
ny (
US
), L
LC
. C
on
fid
en
tia
l a
nd
pro
pri
eta
ry. D
o n
ot d
istr
ibu
te.
4
JAMERE JACKSONCHIEF FINANCIAL OFFICER

Cop
yri
gh
t ©
20
18
Th
e N
iels
en
Com
pa
ny (
US
), L
LC
. C
on
fid
en
tia
l a
nd
pro
pri
eta
ry. D
o n
ot d
istr
ibu
te.
5
TOTAL NIELSEN RESULTS – 1Q 2018($ in millions, except per share amounts)
U.S. GAAP RESULTS1Q
2018
1Q
2017V%(a)
Revenues $1,610 $1,526 5.5%
Net Income (NI) $72 $71 1.4%
GAAP NI per share(c) $0.20 $0.20 0%
NON-GAAP RESULTS1Q
2018
1Q
2017V%(b)
Total Revenue $1,610 $1,526 2.4%
Core Revenue $1,566 $1,458 4.3%
Adjusted EBITDA(d) $423 $420 (0.7%)
Adjusted EBITDA margin %(d) 26.3% 27.5% (83) bps
Free Cash Flow $(245) $(74) U
(a) Growth as reported
(b) Growth in constant currency, excluding Free Cash Flow
(c) Calculated using weighted average shares outstanding of 357.3 million for 1Q 2018 and 359.1 million for 1Q 2017
(d) 2017 Adjusted EBITDA numbers are revised to reflect the adoption of ASU 2017-07 - Presentation of Net Periodic Pension Costs.

Cop
yri
gh
t ©
20
18
Th
e N
iels
en
Com
pa
ny (
US
), L
LC
. C
on
fid
en
tia
l a
nd
pro
pri
eta
ry. D
o n
ot d
istr
ibu
te.
6
WATCH SEGMENT RESULTS($ in millions, growth in constant currency)
REVENUE
PROFITABILITY
1Q DYNAMICS
Total Watch
Adjusted EBITDA
Margin
$834
$350
42.0%
1Q’18
$769
$323
42.0%
1Q’17
7.1%
7.4%
+12 bps
V%
• Strong total revenue growth: +7.1%
Audience Measurement (Video/Text): +10.5%
Ex-Gracenote: +7.0% (a)
Audio: +0.8%
Marketing Effectiveness: +22.7%
Other Watch/Corporate: (35.3%)
• Delivering on initiatives and driving growth
Strength in National TV and Digital
DAR campaigns up 55%
Strong ROI solutions in Marketing Effectiveness
• Adjusted EBITDA margin: +85 bps ex-Gracenote (a)
(a) Excludes Gracenote from January 1, 2018 – January 31, 2018

Cop
yri
gh
t ©
20
18
Th
e N
iels
en
Com
pa
ny (
US
), L
LC
. C
on
fid
en
tia
l a
nd
pro
pri
eta
ry. D
o n
ot d
istr
ibu
te.
7
BUY SEGMENT RESULTS($ in millions, growth in constant currency)
REVENUE
PROFITABILITY
1Q DYNAMICS
Adjusted EBITDA
Margin
$84
10.8%
1Q’18
$108
14.3%
1Q’17
(24.3%)
(318) bps
V%
Total Buy $776 $757 (2.1%) • Total Buy revenue: (2.1%) Developed: (5.2%)
Emerging: +6.1%
Corporate: (42.1%)
• Developed markets Continued weakness in the U.S.
• Emerging markets Improvement from 4Q’17
Broad-based growth across key markets
• Continued investments Retailer initiatives
Connected System
Total Consumer

Cop
yri
gh
t ©
20
18
Th
e N
iels
en
Com
pa
ny (
US
), L
LC
. C
on
fid
en
tia
l a
nd
pro
pri
eta
ry. D
o n
ot d
istr
ibu
te.
8
310
180
4060
140140
80
-20
3050
1Q18 2Q18E 3Q18E 4Q18E FY18E
Rev (bps) EBITDA (bps)
FOREIGN CURRENCY IMPACT
(a) Projected impact assumes rates in effect at 04/25/18 remain in effect for the balance of 2018.
Note: We report on a constant currency basis to reflect operating performance
57%
11%
3%3%3%
23%
USD EUR CNY CAD GBP Other
CURRENCY PROFILE - REVENUEPROJECTED FX IMPACT(a):
REPORTED VS CONSTANT CURRENCY
Cop
yri
gh
t ©
20
18
Th
e N
iels
en
Com
pa
ny (
US
), L
LC
. C
on
fid
en
tia
l a
nd
pro
pri
eta
ry. D
o n
ot d
istr
ibu
te.
9
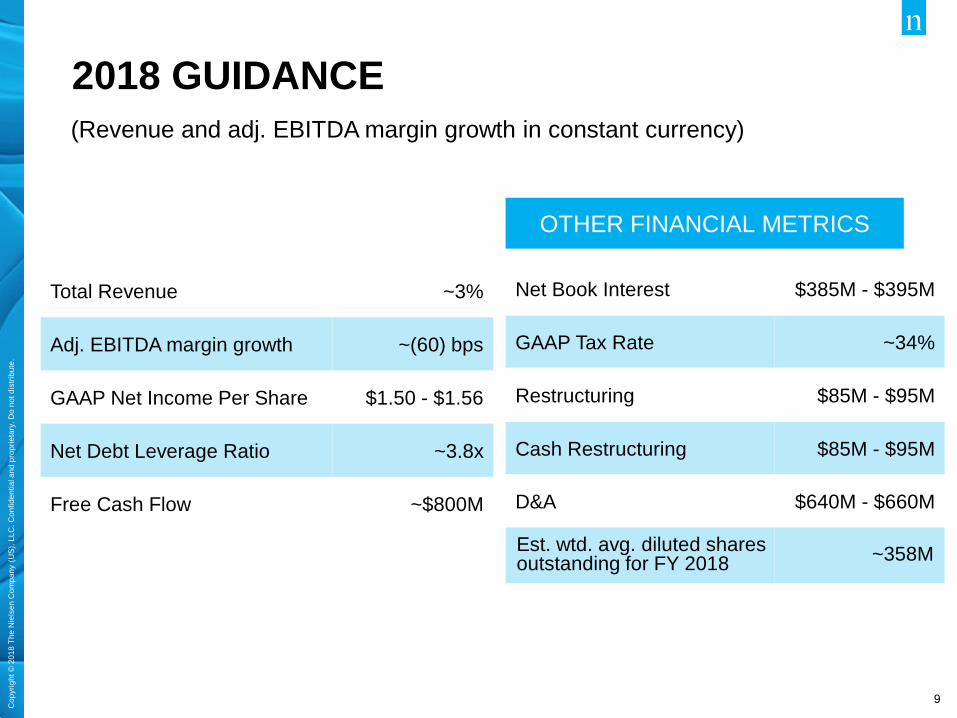
2018 GUIDANCE
(Revenue and adj. EBITDA margin growth in constant currency)
Net Book Interest $385M - $395M
GAAP Tax Rate ~34%
Restructuring $85M - $95M
Cash Restructuring $85M - $95M
D&A $640M - $660M
Est. wtd. avg. diluted shares outstanding for FY 2018
~358M
Total Revenue ~3%
Adj. EBITDA margin growth ~(60) bps
GAAP Net Income Per Share $1.50 - $1.56
Net Debt Leverage Ratio ~3.8x
Free Cash Flow ~$800M
OTHER FINANCIAL METRICS
Cop
yri
gh
t ©
20
18
Th
e N
iels
en
Com
pa
ny (
US
), L
LC
. C
on
fid
en
tia
l a
nd
pro
pri
eta
ry. D
o n
ot d
istr
ibu
te.
10
MITCH BARNSCHIEF EXECUTIVE OFFICER

Cop
yri
gh
t ©
20
18
Th
e N
iels
en
Com
pa
ny (
US
), L
LC
. C
on
fid
en
tia
l a
nd
pro
pri
eta
ry. D
o n
ot d
istr
ibu
te.
11
FIVE KEY TOPICS
1. Transforming Watch: Measuring Fragmenting Audiences
2. Transforming Buy: Differentiation, Retailers, Coverage
3. Transforming Operations: Automation & Consolidation
4. 2018 Upfronts and Newfronts
5. Consumer Data Privacy and Data Protection

Cop
yri
gh
t ©
20
18
Th
e N
iels
en
Com
pa
ny (
US
), L
LC
. C
on
fid
en
tia
l a
nd
pro
pri
eta
ry. D
o n
ot d
istr
ibu
te.
12
WATCH: MEASURING FRAGMENTING AUDIENCES
Total Audience Measurement: Only Nielsen
Digital in TV Ratings: Amazon Prime Video Channels, Verizon Fios, Philo
Digital Ad Ratings: Adopted by top 7 global agency holding companies
Expanding the currency: C3/C7 + DAR to cover both linear & dynamic ads
Audience analytics: Leveraging Smart TV data via Gracenote
1

Cop
yri
gh
t ©
20
18
Th
e N
iels
en
Com
pa
ny (
US
), L
LC
. C
on
fid
en
tia
l a
nd
pro
pri
eta
ry. D
o n
ot d
istr
ibu
te.
13
BUY: DIFFERENTIATION, RETAILERS, COVERAGE
Connected System
• On track to engage with 100 clients by the end of 2018
• Connected Partner Program…45 partners, usage growing
• 219 clients using at least one component of the Connected System
Key wins with retailers
• “Walmart One Version of Truth” launched February 1st
o 50+ manufacturers on board
• Expanded Sam’s Club relationship
Total Consumer Measurement
• Total Food offering provides view of total store
• E-commerce…aligning offline and online sales for total consumer view
Key Growth Initiatives
• Global footprint, balanced client portfolio…key competitive advantages
• Ongoing investments in measurement coverage and penetration
2
Emerging Markets

Cop
yri
gh
t ©
20
18
Th
e N
iels
en
Com
pa
ny (
US
), L
LC
. C
on
fid
en
tia
l a
nd
pro
pri
eta
ry. D
o n
ot d
istr
ibu
te.
14
TRANSFORMING OPERATIONS
Leveraging Artificial Intelligence & Machine Learning
DRIVING 4 POINTS OF MARGIN EXPANSION BY 2020
Automate Watch Operations
Automation in Field
Operations
Consolidate via Super Hubs
Super hubs: Poland, Mexico,
Malaysia…all 3 open
Automate Buy Data Collection
Tech-enabled processes
3
Nano Meter: Sweden live,
U.S. testing
vBrand: Automating
operations
Throughput growing
Enables platform
convergence
Mexico: Early mover
• Revenue up
• Cost down
• EBITDA accelerating

Cop
yri
gh
t ©
20
18
Th
e N
iels
en
Com
pa
ny (
US
), L
LC
. C
on
fid
en
tia
l a
nd
pro
pri
eta
ry. D
o n
ot d
istr
ibu
te.
15
• Advertising ROI + attributiono Outcome-based metricso Growing double-digits
• Audience-based buyingo Launched Advanced Audience Forecastingo Enterprise Audience API…audience segments on-demand
• Leveraging our new + existing capabilitieso Total Audience Measurement at the heart
• DAR, DCR, DTVR, OOH, SVOD
2018 UPFRONTS AND NEWFRONTS4
Showcasing breadth of portfolio
INCREMENTAL GROWTH OPPORTUNITY FOR NIELSEN

Cop
yri
gh
t ©
20
18
Th
e N
iels
en
Com
pa
ny (
US
), L
LC
. C
on
fid
en
tia
l a
nd
pro
pri
eta
ry. D
o n
ot d
istr
ibu
te.
16
CONSUMER PRIVACY AND DATA PROTECTION
Conservative approach
Embedded in product design
Strong relationships with data partners
Robust compliance program
Prepared for GDPR
WELL-POSITIONED…COMPETITIVE ADVANTAGE
5

Cop
yri
gh
t ©
20
18
Th
e N
iels
en
Com
pa
ny (
US
), L
LC
. C
on
fid
en
tia
l a
nd
pro
pri
eta
ry. D
o n
ot d
istr
ibu
te.
17
Q&A

Cop
yri
gh
t ©
20
18
Th
e N
iels
en
Com
pa
ny (
US
), L
LC
. C
on
fid
en
tia
l a
nd
pro
pri
eta
ry. D
o n
ot d
istr
ibu
te.
18
APPENDIX

Cop
yri
gh
t ©
20
18
Th
e N
iels
en
Com
pa
ny (
US
), L
LC
. C
on
fid
en
tia
l a
nd
pro
pri
eta
ry. D
o n
ot d
istr
ibu
te.
19
CERTAIN NON-GAAP MEASURES
Overview of Non-GAAP Presentations
We use the non-GAAP financial measures discussed below to evaluate our results of operations, financial condition, liquidity and
indebtedness. We believe that the presentation of these non-GAAP measures provides useful information to investors regarding
financial and business trends related to our results of operations, cash flows and indebtedness and that when this non-GAAP
financial information is viewed with our GAAP financial information, investors are provided with valuable supplemental
information regarding our results of operations, thereby facilitating period-to-period comparisons of our business performance.
These non-GAAP measures are also consistent with how management evaluates the company’s operating performance and
liquidity. In addition, these non-GAAP measures address questions the Company routinely receives from analysts and investors
and, in order to assure that all investors have access to similar data, the Company has determined that it is appropriate to make
this data available to all investors. None of the non-GAAP measures presented should be considered as an alternative to net
income or loss, operating income or loss, cash flows from operating activities, total indebtedness or any other measures of
operating performance and financial condition, liquidity or indebtedness derived in accordance with GAAP. These non-GAAP
measures have important limitations as analytical tools and should not be considered in isolation or as substitutes for an analysis
of our results as reported under GAAP. Our use of these terms may vary from the use of similarly-titled measures by others in our
industry due to the potential inconsistencies in the method of calculation and differences due to items subject to interpretation.
Constant Currency Presentation
We evaluate our results of operations on both an as reported and a constant currency basis. The constant currency presentation,
which is a non-GAAP measure, excludes the impact of fluctuations in foreign currency exchange rates. We believe providing
constant currency information provides valuable supplemental information regarding our results of operations, thereby facilitating
period-to-period comparisons of our business performance and is consistent with how management evaluates the company’s
performance. We calculate constant currency percentages by converting our prior-period local currency financial results using the
current period exchange rates and comparing these adjusted amounts to our current period reported results. No adjustment has
been made to foreign currency exchange transaction gains or losses in the calculation of constant currency net income.
Net Debt and Net Debt Leverage Ratio
The net debt leverage ratio is defined as net debt (gross debt less cash and cash equivalents) as of the balance sheet date
divided by Adjusted EBITDA for the twelve months then ended. Net debt and the net debt leverage ratio are commonly used
metrics to evaluate and compare leverage between companies and are not presentations made in accordance with GAAP.

Cop
yri
gh
t ©
20
18
Th
e N
iels
en
Com
pa
ny (
US
), L
LC
. C
on
fid
en
tia
l a
nd
pro
pri
eta
ry. D
o n
ot d
istr
ibu
te.
20
CERTAIN NON-GAAP MEASURES
Adjusted EBITDA
We define Adjusted EBITDA as net income or loss from our consolidated statements of operations before interest income and
expense, income taxes, depreciation and amortization, restructuring charges, stock-based compensation expense and other non-
operating items from our consolidated statements of operations as well as certain other items that arise outside the ordinary
course of our continuing operations. We use Adjusted EBITDA to measure our performance from period to period both at the
consolidated level as well as within our operating segments, to evaluate and fund incentive compensation programs and to
compare our results to those of our competitors.
Free Cash Flow
We define free cash flow as net cash provided by operating activities, less capital expenditures, net. We believe providing free
cash flow information provides valuable supplemental liquidity information regarding the cash flow that may be available for
discretionary use by us in areas such as the distributions of dividends, repurchase of common stock, voluntary repayment of debt
obligations or to fund our strategic initiatives, including acquisitions, if any. However, free cash flow does not represent residual
cash flows entirely available for discretionary purposes; for example, the repayment of principal amounts borrowed is not
deducted from free cash flow. Key limitations of the free cash flow measure include the assumptions that we will be able to
refinance our existing debt when it matures and meet other cash flow obligations from financing activities, such as principal
payments on debt. Free cash flow is not a presentation made in accordance with GAAP.
(continued)

Cop
yri
gh
t ©
20
18
Th
e N
iels
en
Com
pa
ny (
US
), L
LC
. C
on
fid
en
tia
l a
nd
pro
pri
eta
ry. D
o n
ot d
istr
ibu
te.
21
ADJUSTED EBITDA RECONCILIATION
Quarter Ended March 31
2018 2017
Net income $ 72 $ 71
Interest expense, net 94 89
Provision for income taxes 39 43
Depreciation and amortization 167 155
EBITDA 372 358
Other non-operating expense, net 2 2
Restructuring charges 24 32
Stock-based compensation expense 13 15
Other items(a) 12 13
Adjusted EBITDA $ 423 $ 420
($ in millions) (unaudited)
(a) For the three months ended March 31, 2018 and 2017, other items primarily consist of transaction related costs and business optimization costs.

Cop
yri
gh
t ©
20
18
Th
e N
iels
en
Com
pa
ny (
US
), L
LC
. C
on
fid
en
tia
l a
nd
pro
pri
eta
ry. D
o n
ot d
istr
ibu
te.
22
Operating
Income
Restructuring
Charges
Depreciation
and
Amortization
Stock-Based
Compensation
Expense
Other
Items(a)
Adjusted
EBITDA
Buy $34 $20 $50 $4 - $108
Watch $208 $7 $104 $4 - $323
Corporate $(37) $5 $1 $7 $13 $(11)
Total $205 $32 $155 $15 $13 $420
Operating
Income
Restructuring
Charges
Depreciation
and
Amortization
Stock-Based
Compensation
Expense
Other
Items(a)
Adjusted
EBITDA
Buy $11 $15 $54 $4 - $84
Watch $226 $9 $112 $3 - $350
Corporate $(30) - $1 $6 $12 $(11)
Total $207 $24 $167 $13 $12 $423
ADJUSTED EBITDA RECONCILIATION($ in millions) (unaudited)
(a) For the three months ended March 31, 2018 and 2017, other items primarily consist of transaction related costs and business optimization costs.
QUARTER ENDED MARCH 31, 2018
QUARTER ENDED MARCH 31, 2017

Cop
yri
gh
t ©
20
18
Th
e N
iels
en
Com
pa
ny (
US
), L
LC
. C
on
fid
en
tia
l a
nd
pro
pri
eta
ry. D
o n
ot d
istr
ibu
te.
23
Original – as reported
March 31,
2017
June 30,
2017
September 30,
2017December 31,
2017 Full Year
Watch $ 323 $ 357 $ 390 $ 415 $ 1,485
Buy 108 163 145 171 587
Corporate (9) (8) (13) (7) (37)
Adjusted EBITDA - original $ 422 $ 512 $ 522 $ 579 $ 2,035
Other income/(expense), net $ - $ (2) $ (1) $ (14) $ (17)
Net income attributable to Nielsen
stockholders
$ 71 $ 131 $ 146 $ 81 $ 429
ADOPTION OF ASU 2017-07 – IMPACT ON
ADJUSTED EBITDA($ in millions) (unaudited)
FOR THE THREE MONTHS ENDED
FOR THE THREE MONTHS ENDED
Revised in accordance with ASU
2017-07
March 31,
2017
June 30,
2017
September 30,
2017
December 31,
2017 Full Year
Watch $ 323 $ 357 $ 390 $ 416 $ 1,486
Buy 108 162 144 170 584
Corporate (11) (10) (15) (10) (46)
Adjusted EBITDA - revised $ 420 $ 509 $ 519 $ 576 $ 2,024
Other income/(expense), net $ 2 $ 1 $ 2 $ (11) $ (6)
Net income attributable to Nielsen
stockholders
$ 71 $ 131 $ 146 $ 81 $ 429

Cop
yri
gh
t ©
20
18
Th
e N
iels
en
Com
pa
ny (
US
), L
LC
. C
on
fid
en
tia
l a
nd
pro
pri
eta
ry. D
o n
ot d
istr
ibu
te.
24
REVENUE RECONCILIATION($ in millions) (unaudited)
2018
Reported
2017
Reported
% V
Reported
2017 Constant
Currency
% V Constant
Currency
Developed Markets $471 $471 0.0% $497 (5.2%)
Emerging Markets 294 267 10.1% 277 6.1%
Core Buy $765 $738 3.7% $774 (1.2%)
Corporate 11 19 (42.1%) 19 (42.1%)
Buy $776 $757 2.5% $793 (2.1%)
Video and Text $599 $535 12.0% $542 10.5%
Audio 121 120 0.8% 120 0.8%
Marketing Effectiveness 81 65 24.6% 66 22.7%
Core Watch $801 $720 11.3% $728 10.0%
Corporate/Other Watch 33 49 (32.7%) 51 (35.3%)
Watch $834 $769 8.5% $779 7.1%
Total Core Buy and Watch $1,566 $1,458 7.4% $1,502 4.3%
Total $1,610 $1,526 5.5% $1,572 2.4%
QUARTER ENDED MARCH 31
Cop
yri
gh
t ©
20
18
Th
e N
iels
en
Com
pa
ny (
US
), L
LC
. C
on
fid
en
tia
l a
nd
pro
pri
eta
ry. D
o n
ot d
istr
ibu
te.
25
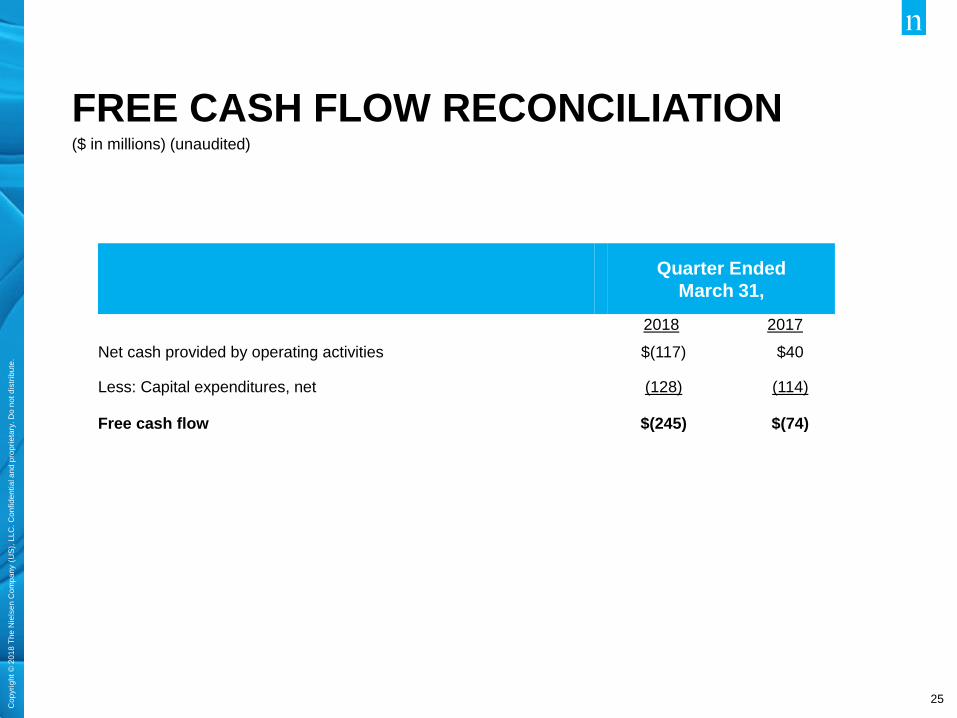
FREE CASH FLOW RECONCILIATION($ in millions) (unaudited)
Quarter Ended
March 31,
2018 2017
Net cash provided by operating activities $(117) $40
Less: Capital expenditures, net (128) (114)
Free cash flow $(245) $(74)
Cop
yri
gh
t ©
20
18
Th
e N
iels
en
Com
pa
ny (
US
), L
LC
. C
on
fid
en
tia
l a
nd
pro
pri
eta
ry. D
o n
ot d
istr
ibu
te.
26
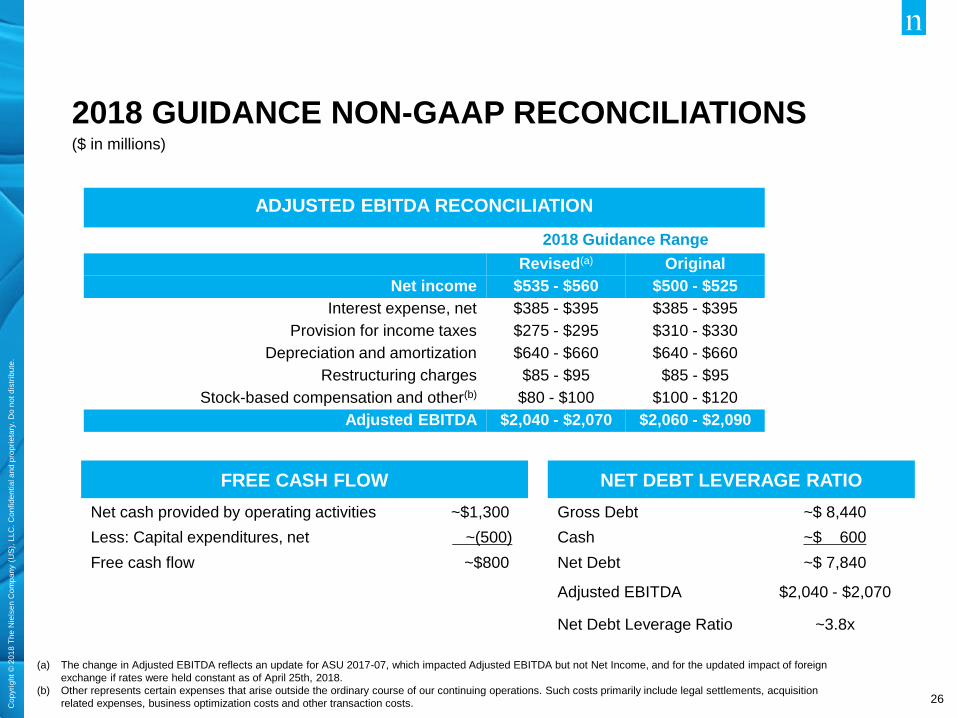
2018 GUIDANCE NON-GAAP RECONCILIATIONS($ in millions)
ADJUSTED EBITDA RECONCILIATION
2018 Guidance Range
Revised(a) Original
Net income $535 - $560 $500 - $525
Interest expense, net $385 - $395 $385 - $395
Provision for income taxes $275 - $295 $310 - $330
Depreciation and amortization $640 - $660 $640 - $660
Restructuring charges $85 - $95 $85 - $95
Stock-based compensation and other(b) $80 - $100 $100 - $120
Adjusted EBITDA $2,040 - $2,070 $2,060 - $2,090
FREE CASH FLOW
Net cash provided by operating activities ~$1,300
Less: Capital expenditures, net ~(500)
Free cash flow ~$800
NET DEBT LEVERAGE RATIO
Gross Debt ~$ 8,440
Cash ~$ 600
Net Debt ~$ 7,840
Adjusted EBITDA $2,040 - $2,070
Net Debt Leverage Ratio ~3.8x
(a) The change in Adjusted EBITDA reflects an update for ASU 2017-07, which impacted Adjusted EBITDA but not Net Income, and for the updated impact of foreign
exchange if rates were held constant as of April 25th, 2018.
(b) Other represents certain expenses that arise outside the ordinary course of our continuing operations. Such costs primarily include legal settlements, acquisition
related expenses, business optimization costs and other transaction costs.
Cop
yri
gh
t ©
20
18
Th
e N
iels
en
Com
pa
ny (
US
), L
LC
. C
on
fid
en
tia
l a
nd
pro
pri
eta
ry. D
o n
ot d
istr
ibu
te.
27
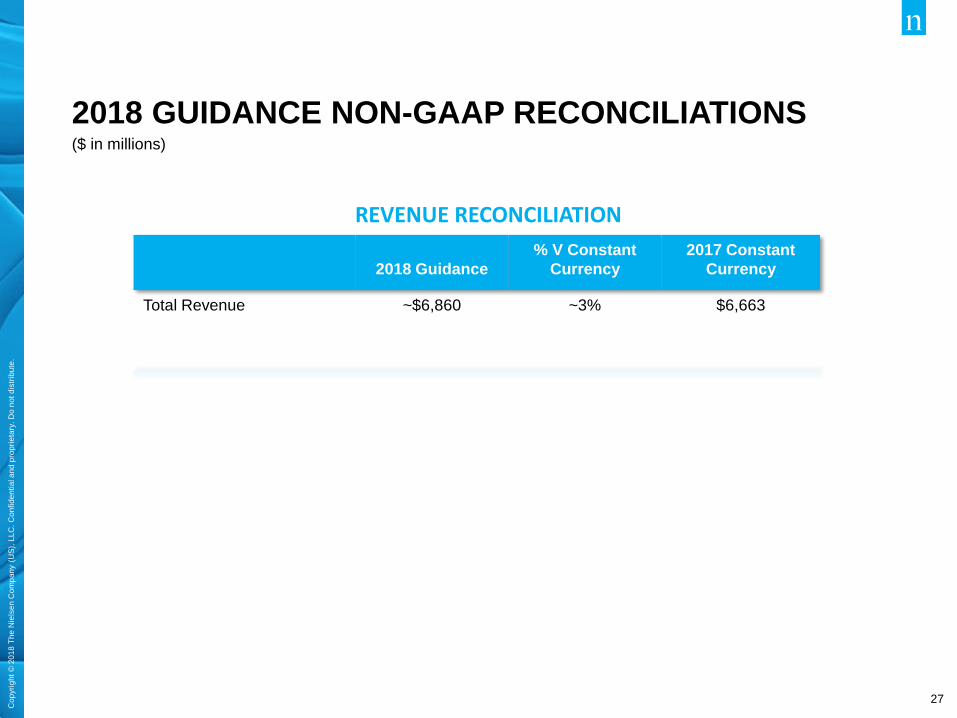
2018 GUIDANCE NON-GAAP RECONCILIATIONS($ in millions)
2018 Guidance
% V Constant
Currency
2017 Constant
Currency
Total Revenue ~$6,860 ~3% $6,663
REVENUE RECONCILIATION

Cop
yri
gh
t ©
20
18
Th
e N
iels
en
Com
pa
ny (
US
), L
LC
. C
on
fid
en
tia
l a
nd
pro
pri
eta
ry. D
o n
ot d
istr
ibu
te.
28
DEBT CAPITAL TABLE($ in millions)
DEBT CAPITAL TABLE
3/31/18 (unaudited)
12/31/17 Change
Loan Debt (secured) $4,276 $4,074 $202
4.50% Sr. Notes (10/1/20) 796 795 1
5.50% Sr. Notes (10/1/21) 620 620 -
5.00% Sr. Notes (4/15/22) 2,289 2,288 1
5.00% Sr. Notes (2/1/25) 496 496 -
Capital lease/misc. debt 169 168 1
Total Debt $8,646 $8,441 $205
Less Cash 462 656 (194)
Net Debt $8,184 $7,785 $399
Adjusted EBITDA(a) $2,027 $2,024 3
Net Debt Leverage Ratio(b) 4.04x 3.85x 0.19x
Weighted avg. interest rate(c) 4.43% 4.32% 11bps
(a) Adjusted EBITDA calculated based on last twelve months basis
(b) Reflects Net Debt (gross debt minus cash), divided by Adjusted EBITDA calculated on last twelve months basis
(c) Excludes capital leases

Cop
yri
gh
t ©
20
18
Th
e N
iels
en
Com
pa
ny (
US
), L
LC
. C
on
fid
en
tia
l a
nd
pro
pri
eta
ry. D
o n
ot d
istr
ibu
te.
29
SELECTED FINANCIAL METRICS & BALANCE SHEET ITEMS($ in millions) (unaudited)
FINANCIAL METRICS
1Q 18
Free Cash Flow $(245)
Capital Expenditures, net $128
D&A(b) $167
Net Book Interest $94
Cash Taxes $42
Cash Restructuring $24
Wtd. avg. diluted shares 357.3
BALANCE SHEET – 3/31/18
Gross Debt $8,646
Cash $462
Net Debt $8,184
Net Debt Leverage Ratio(c) 4.04x
$24
$1,401
$818
$1,090
$2,325
$2,126
$-
2018 2019 2020 2021 2022 2023 2024 2025
$499
CURRENT DEBT MATURITY PROFILE – 3/31/18(a)
(a) Excludes revolver ($195M) and capital leases ($168M)
(b) Includes $56M of depreciation and amortization associated with tangible and intangible assets acquired in business combinations
(c) Reflects Net Debt (gross debt minus cash), divided by Adjusted EBITDA calculated on last twelve months basis

Cop
yri
gh
t ©
20
18
Th
e N
iels
en
Com
pa
ny (
US
), L
LC
. C
on
fid
en
tia
l a
nd
pro
pri
eta
ry. D
o n
ot d
istr
ibu
te.
NIELSEN INVESTOR RELATIONS
+1.646.654.4602
http://ir.nielsen.com
Follow @Nielsen