1 promoting a realworld and holistic approach to impact evaluation designing evaluations under...
TRANSCRIPT

1
Promoting a RealWorld and Holistic approach to
Impact EvaluationDesigning Evaluations under Budget, Time, Data and Political Constraints
AEA pre-conference professional development workshopMinneapolis, October 24, 2012
Facilitated byMichael Bamberger and Jim Rugh
Note: This PowerPoint presentation and the summary (condensed) chapter of the book are available at:
www.RealWorldEvaluation.org

Workshop Objectives
1. The basics of the RealWorld Evaluation approach for addressing common issues and constraints faced by evaluators such as: when the evaluator is not called in until the project is nearly completed and there was no baseline nor comparison group; or where the evaluation must be conducted with inadequate budget and insufficient time; and where there are political pressures and expectations for how the evaluation should be conducted and what the conclusions should say;
2

Workshop Objectives
2. Identifying and assessing various design options that could be used in a particular evaluation setting;
3. Some tips on developing logic models;
4. Ways to reconstruct baseline data;
5. How to account for what would have happened without the project’s interventions: alternative counterfactuals;
6. The advantages of using mixed-methods designs;
7. Considerations for more holistic approaches to impact evaluation.
3

Workshop Objectives
Note: In this workshop we focus on project-level impact evaluations. There are, of course, many other purposes, scopes, evaluands and types of evaluations. Some of these methods may apply to them, but our examples will be based on project impact evaluations, most of them in the context of developing countries.
4

Workshop agenda: morning
8:00-8:30 Introduction + Brief overview of the RealWorld Evaluation approach
8:30-9:00 Basic evaluation design scenarios Jim 29-48
9:00-9:30 Small group discussion: personal introductions, including RWE-type constraints you have faced in your own practice
9:30-9:50 break
9:50-10:20 Logic models; reconstructing baselines Jim 51- 77
10:20-10:40 Mixed Method evaluations Michael 78-102
10:40-11:00 Alternative counterfactuals Jim 103-115
11:00-12:00 Small group exercise, Part I: Reading of case studies then preparing an evaluation design when working under budget, time, data or political constraints
12:00-1:00 lunch

Workshop agenda: afternoon
1:00-1:45 Impact Evaluations Michael 120-134, Jim 135-155
1:45-2:30 Small group exercise, Part II: 'Clients’ and ‘consultants’ re-negotiate the case study evaluation ToR. Note: In addition to becoming familiar with some of the RWE approaches, the case study exercises will also illustrate the different evaluation agendas and perspectives of evaluation consultants, project implementers and funding agencies.
2:30-2:50 Plenary discussion of main learnings from group exercises and the RealWorld Evaluation approach. Jim 156-159
2:50-3:00 Wrap-up and evaluation of workshop by participants

7
OVERVIEW OF THE
RWE APPROACH
RealWorld Evaluation
Designing Evaluations under Budget, Time,
Data and Political Constraints

8
Typical RealWorld Evaluation Scenario
Evaluator(s) not brought in until near end of project
For political, technical or budget reasons:• There was no life-of-project evaluation plan• There was no baseline survey• Project implementers did not collect
adequate data on project participants at the beginning nor during the life of the project
• It is difficult to collect data on comparable control groups
9
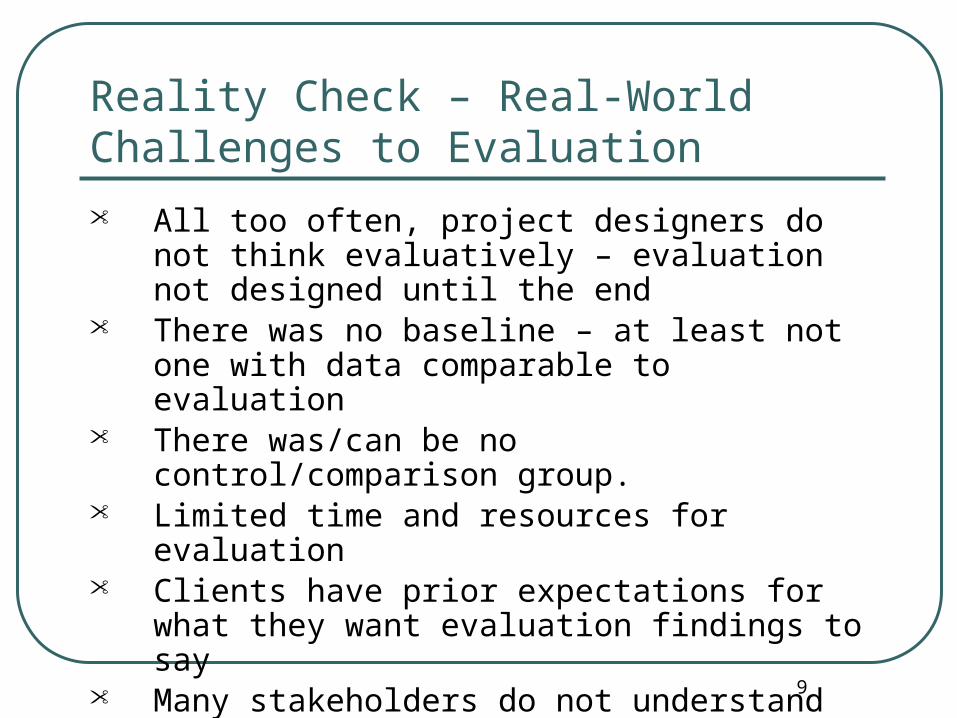
Reality Check – Real-World Challenges to Evaluation
• All too often, project designers do not think evaluatively – evaluation not designed until the end
• There was no baseline – at least not one with data comparable to evaluation
• There was/can be no control/comparison group.• Limited time and resources for evaluation• Clients have prior expectations for what they want
evaluation findings to say• Many stakeholders do not understand evaluation;
distrust the process; or even see it as a threat (dislike of being judged)

10
RealWorld Evaluation Quality Control Goals
Achieve maximum possible evaluation rigor within the limitations of a given context
Identify and control for methodological weaknesses in the evaluation design
Negotiate with clients trade-offs between desired rigor and available resources
Presentation of findings must acknowledge methodological weaknesses and how they affect generalization to broader populations

11
The Need for the RealWorld Evaluation Approach
As a result of these kinds of constraints, many of the basic principles of rigorous impact evaluation design (comparable pre-test -- post test design, control group, adequate instrument development and testing, random sample selection, control for researcher bias, thorough documentation of the evaluation methodology etc.) are often sacrificed.

12
The RealWorld Evaluation Approach
An integrated approach to ensure acceptable standards of methodological rigor while operating under real-world budget, time, data and political constraints.
This is the cover of the cover of the 1se edition of the RealWorld Evaluation book (2006)

Bam
berg
er Ru
gh
M
abry RealWo
rld Evaluatio
n
RealWorld Evaluation
Working Under Budget, Time, Data, and Political Constraints
Michael Bamberger
Jim Rugh
Linda Mabry
EDITION
2
EDITION
This book addresses the challenges of conducting program evaluations in real-world contexts where evaluators and their clients face budget and time constraints and where critical data may be missing. The book is organized around
a seven-step model developed by the authors, which has been tested and refined in workshops and in practice. Vignettes and case studies—representing evaluations from a variety of geographic regions and sectors—
demonstrate adaptive possibilities for small projects with budgets of a few thousand dollars to large-scale, long-term evaluations of complex programs. The text incorporates quantitative, qualitative, and mixed-method designs and this
Second Edition reflects important developments in the field over the last five years.
New to the Second Edition:
·Adds two new chapters on organizing and managing evaluations, including how to strengthen capacity and promote the institutionalization of evaluation systems
·Includes a new chapter on the evaluation of complex development interventions, with a number of promising new approaches presented
·Incorporates new material, including on ethical standards, debates over the “best” evaluation designs and how to assess their validity, and the importance of understanding settings
·Expands the discussion of program theory, incorporating theory of change, contextual and process analysis, multi-level logic models, using competing theories, and trajectory analysis
·Provides case studies of each of the 19 evaluation designs, showing how they have been applied in the field
“This book represents a significant achievement. The authors have succeeded in creating a book that can be used in a wide variety of locations and by a large community of evaluation practitioners.”
—Michael D. Niles, Missouri Western State University
“This book is exceptional and unique in the way that it combines foundational knowledge from social sciences with theory and methods that are specific to evaluation.”
—Gary Miron, Western Michigan University
“The book represents a very good and timely contribution worth having on an evaluator’s shelf, especially if you work in the international development arena.”
—Thomaz Chianca, independent evaluation consultant, Rio de Janeiro, Brazil
2 EDITION
RealWorld Evaluation
2nd edition published
January 2012

14
The RealWorld Evaluation approach
Developed to help evaluation practitioners and clients• managers, funding agencies and external
consultants Still a work in progress (we continue to learn
more through workshops like this) Originally designed for developing countries,
but equally applicable in industrialized nations

15
Most RealWorld Evaluation tools are not new— but promote a holistic, integrated approach
Most of the RealWorld Evaluation data collection and analysis tools will be familiar to experienced evaluators.
What we emphasize is an integrated approach which combines a wide range of tools adapted to produce the best quality evaluation under RealWorld constraints.

16
What is Special About the RealWorld Evaluation Approach?
There is a series of steps, each with checklists for identifying constraints and determining how to address them
These steps are summarized on the following slide and in the more detailed flow-chart on page 5 of the Condensed Overview.

17
The Steps of the RealWorld Evaluation Approach
Step 1: Planning and scoping the evaluation Step 2: Addressing budget constraintsStep 3: Addressing time constraintsStep 4: Addressing data constraintsStep 5: Addressing political constraintsStep 6: Assessing and addressing the strengths and
weaknesses of the evaluation designStep 7: Helping clients use the evaluation
See page 5 of the Condensed Summary for more details

18
Planning and Scoping the Evaluation
Understanding client information needs Defining the program theory model Preliminary identification of constraints to
be addressed by the RealWorld Evaluation

19
Understanding client information needs
Typical questions clients want answered: Is the project achieving its objectives? Is it having desired impact? Are all sectors of the target population
benefiting? Will the results be sustainable? Which contextual factors determine the
degree of success or failure?

20
A full understanding of client information needs can often reduce the types of information collected and the level of detail and rigor necessary.
However, this understanding could also increase the amount of information required!
Understanding client information needs

Still part of scoping: Other questions to answer as you customize an evaluation Terms of Reference (ToR):
1. Who asked for the evaluation? (Who are the key stakeholders)?
2. What are the key questions to be answered?
3. Will this be mostly a developmental, formative or summative evaluation?
4. Will there be a next phase, or other projects designed based on the findings of this evaluation?
21
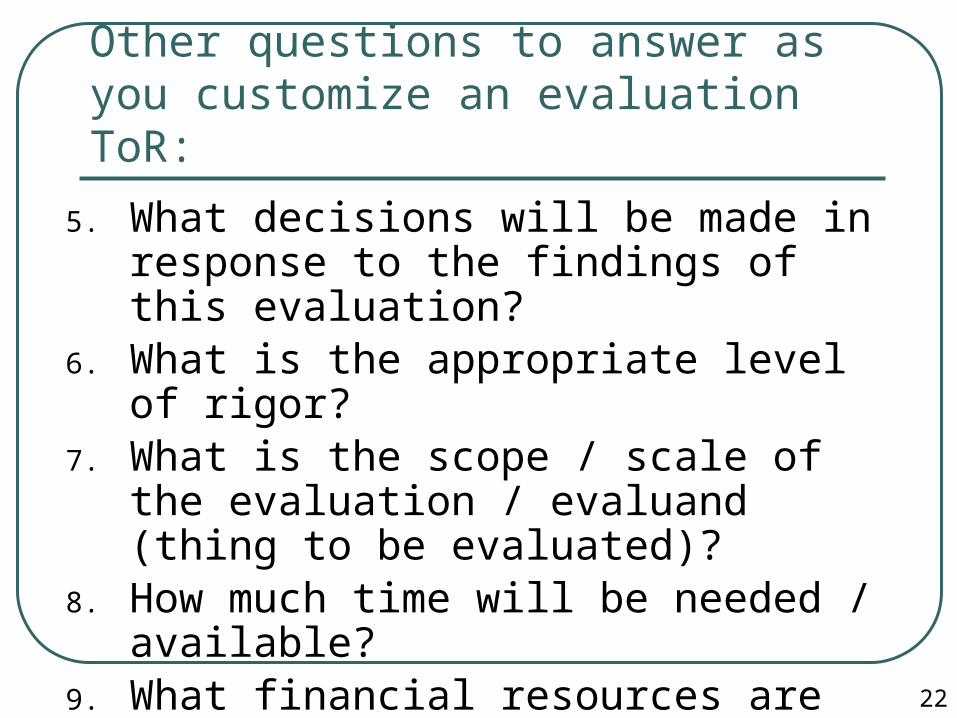
5. What decisions will be made in response to the findings of this evaluation?
6. What is the appropriate level of rigor?7. What is the scope / scale of the
evaluation / evaluand (thing to be evaluated)?
8. How much time will be needed / available?
9. What financial resources are needed / available?
Other questions to answer as you customize an evaluation ToR:
22

10. Should the evaluation rely mainly on quantitative or qualitative methods?
11. Should participatory methods be used?12. Can / should there be a household
survey?13. Who should be interviewed?14. Who should be involved in planning /
implementing the evaluation?15. What are the most appropriate forms of
communicating the findings to different stakeholder audiences?
Other questions to answer as you customize an evaluation ToR:
23

Before we return to the RealWorld steps,
let’s gain a perspective on levels of rigor, and what a
life-of-project evaluation plan could
look like
24
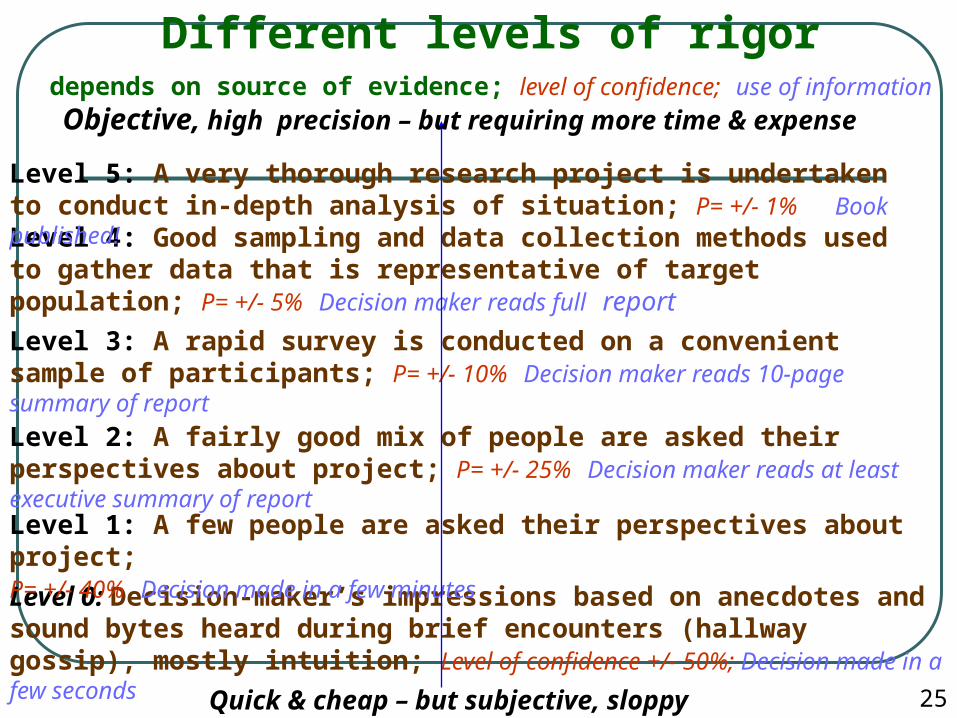
Different levels of rigordepends on source of evidence; level of confidence; use of information
Level 0: Decision-maker’s impressions based on anecdotes and sound bytes heard during brief encounters (hallway gossip), mostly intuition; Level of confidence +/- 50%; Decision made in a few seconds
Level 1: A few people are asked their perspectives about project; P= +/- 40% Decision made in a few minutes
Level 3: A rapid survey is conducted on a convenient sample of participants; P= +/- 10% Decision maker reads 10-page summary of report
Level 2: A fairly good mix of people are asked their perspectives about project; P= +/- 25% Decision maker reads at least executive summary of report
Level 4: Good sampling and data collection methods used to gather data that is representative of target population; P= +/- 5% Decision maker reads full report
Level 5: A very thorough research project is undertaken to conduct in-depth analysis of situation; P= +/- 1% Book published!
Objective, high precision – but requiring more time & expense
Quick & cheap – but subjective, sloppy 25

Ran
dom
ized
sam
ple
sele
ctio
n
Que
stio
nnai
re q
ualit
y
Rel
iabi
lity
& v
alid
ity o
f ind
icat
ors
Qua
lity
of d
ata
colle
ctio
n
Dep
th o
f ana
lysi
s
Rep
ortin
g &
util
izat
ion
QUALITY OF INFORMATION GENERATED BY AN EVALUATION DEPENDS UPON LEVEL OF RIGOR OF ALL COMPONENTS
CONDUCTING AN EVALUATION IS LIKE LAYING A PIPELINE

Ran
dom
ized
sam
ple
sele
ctio
n
Que
stio
nnai
re q
ualit
y
Rel
evan
ce &
val
idity
of i
ndic
ator
s
Qua
lity
of d
ata
colle
ctio
n
Dep
th o
f ana
lysi
s
Rep
ortin
g &
util
izat
ion
AMOUNT OF “FLOW” (QUALITY) OF INFORMATION IS LIMITED TO THE SMALLEST COMPONENT OF THE SURVEY “PIPELINE”

Determining appropriate levels of precision for
events in a life-of-project evaluation plan
Annualself-evaluation
Mid-termevaluation
Baselinestudy
Needs assessment
Finalevaluation
Time during project life cycle
Special Study
Same level of rigor
High rigor
Low rigor
2
3
4
28

29
EVALUATION DESIGNS
RealWorld Evaluation
Designing Evaluations under Budget, Time,
Data and Political Constraints

30
Formative: learning and improvement including early identification of possible problems
Knowledge generation: identify cause-effect correlations and generic principles about effectiveness.
Accountability: to demonstrate that resources are used efficiently to attain desired results
Summative judgment: to determine value and future of program
Developmental evaluation: adaptation in complex, emergent and dynamic conditions
-- Michael Quinn Patton, Utilization-Focused Evaluation, 4th edition, pages 139-140
Some of the purposes for program evaluation
31
Determining appropriate (and feasible) evaluation design
Based on the main purpose for conducting an evaluation, an understanding of client information needs, required level of rigor, and what is possible given the constraints, the evaluator and client need to determine what evaluation design is required and possible under the circumstances.
32
Some of the considerations pertaining to evaluation design
1: When evaluation events take place (baseline, midterm, endline)
2. Review different evaluation designs (experimental, quasi-experimental, other)
3. Determine what needs to be done to “fill in the missing pieces” when the “ideal” evaluation design/scenario is not feasible.
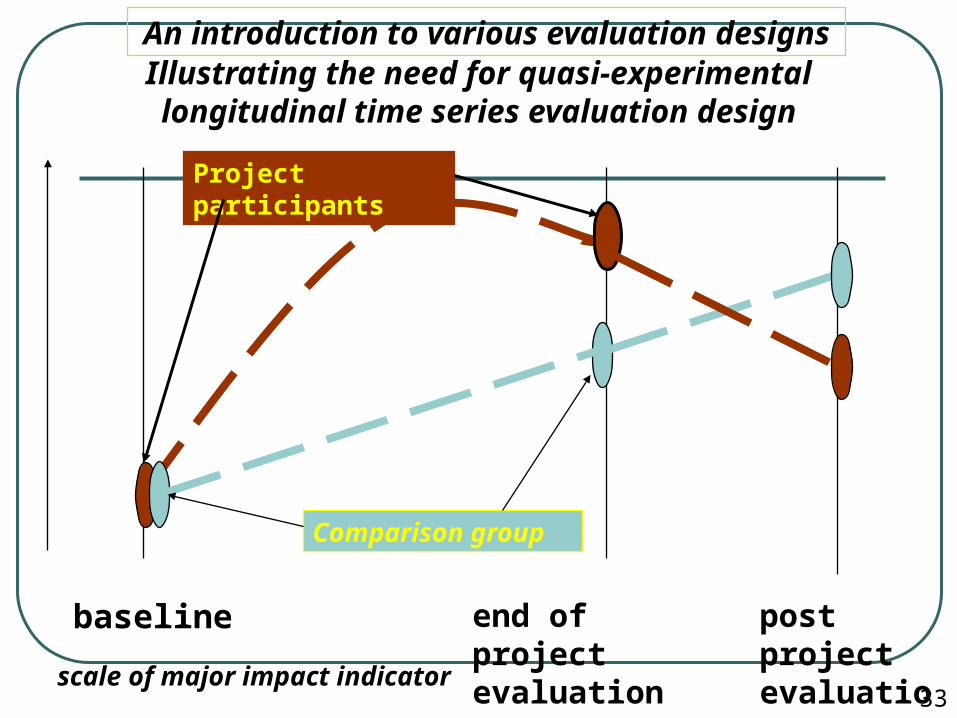
baseline end of project evaluation
Illustrating the need for quasi-experimental longitudinal time series evaluation design
Project participants
Comparison group
post project evaluation
An introduction to various evaluation designs
scale of major impact indicator33

OK, let’s stop the action to identify each of the major types of evaluation (research) design
…
… one at a time, beginning with the most rigorous design.
34
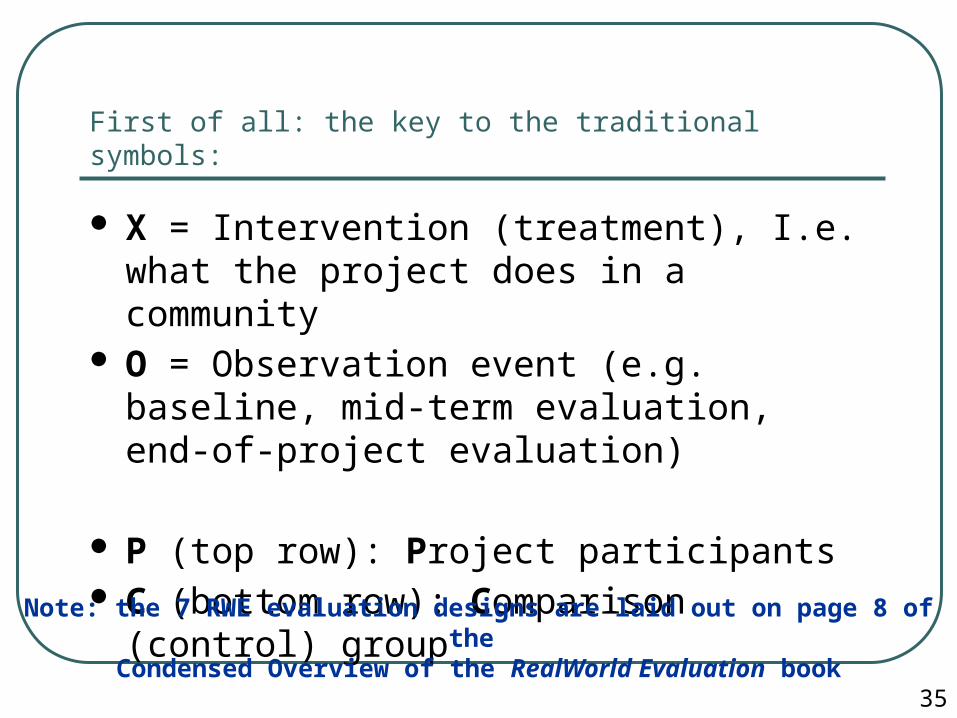
First of all: the key to the traditional symbols:
X = Intervention (treatment), I.e. what the project does in a community
O = Observation event (e.g. baseline, mid-term evaluation, end-of-project evaluation)
P (top row): Project participants C (bottom row): Comparison (control) group
35
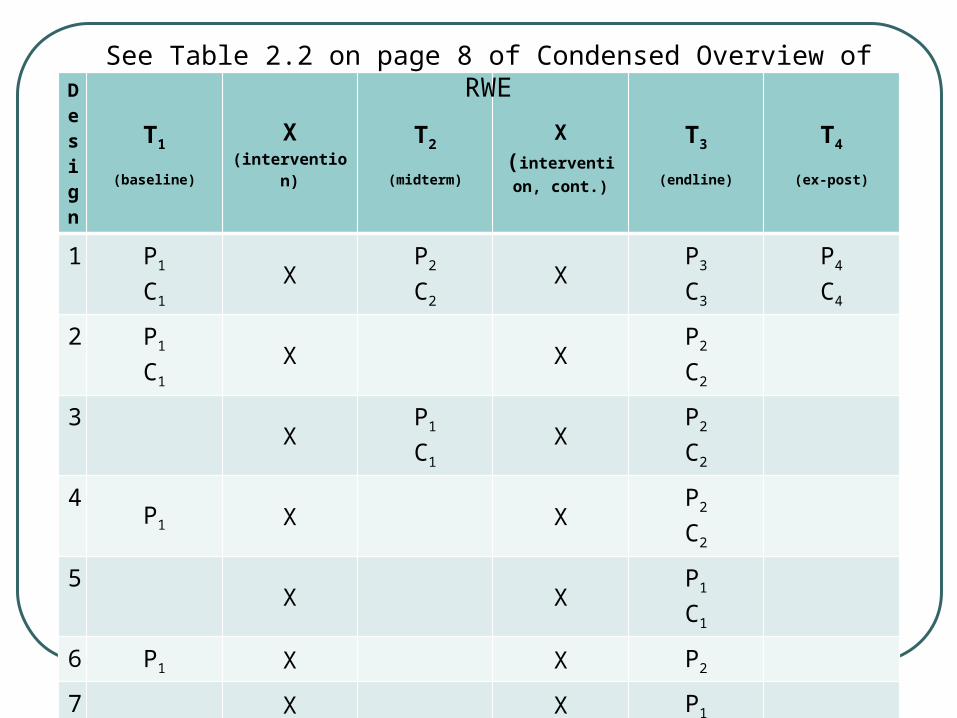
Note: the 7 RWE evaluation designs are laid out on page 8 of the Condensed Overview of the RealWorld Evaluation book
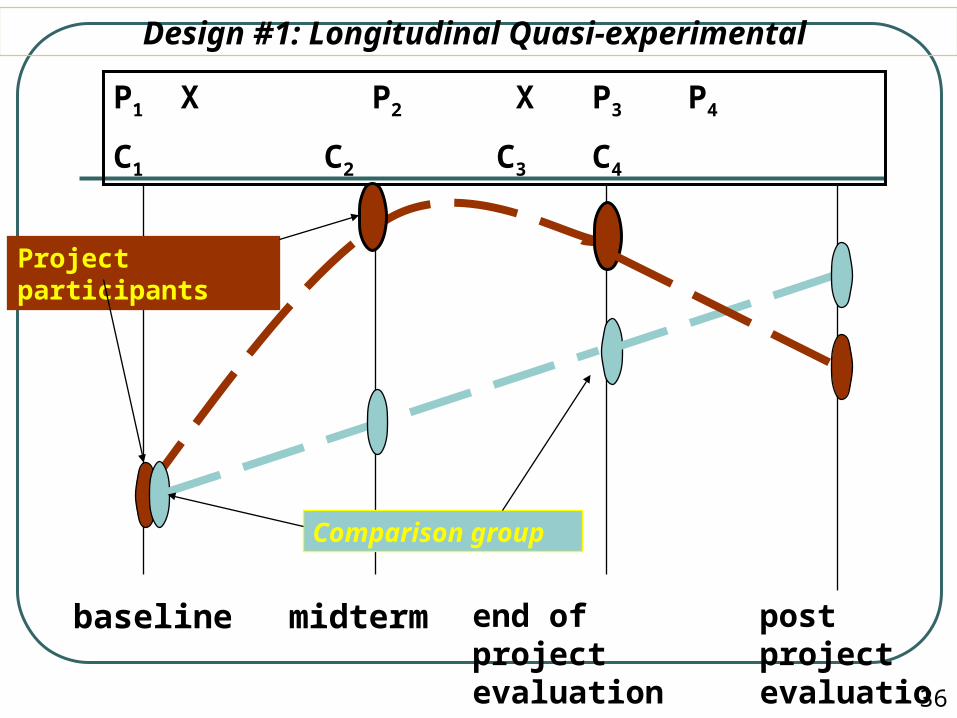
baseline end of project evaluation
Comparison group
post project evaluation
Design #1: Longitudinal Quasi-experimental
P1 X P2 X P3 P4
C1 C2 C3 C4
Project participants
midterm
36

baseline end of project evaluation
Comparison group
Design #2: Quasi-experimental (pre+post, with comparison)
P1 X P2
C1 C2
Project participants
37

baseline end of project evaluation
Control group
Design #2+: Randomized Control Trial
P1 X P2
C1 C2
Project participants
38
Research subjects randomly assigned either to project or control group.
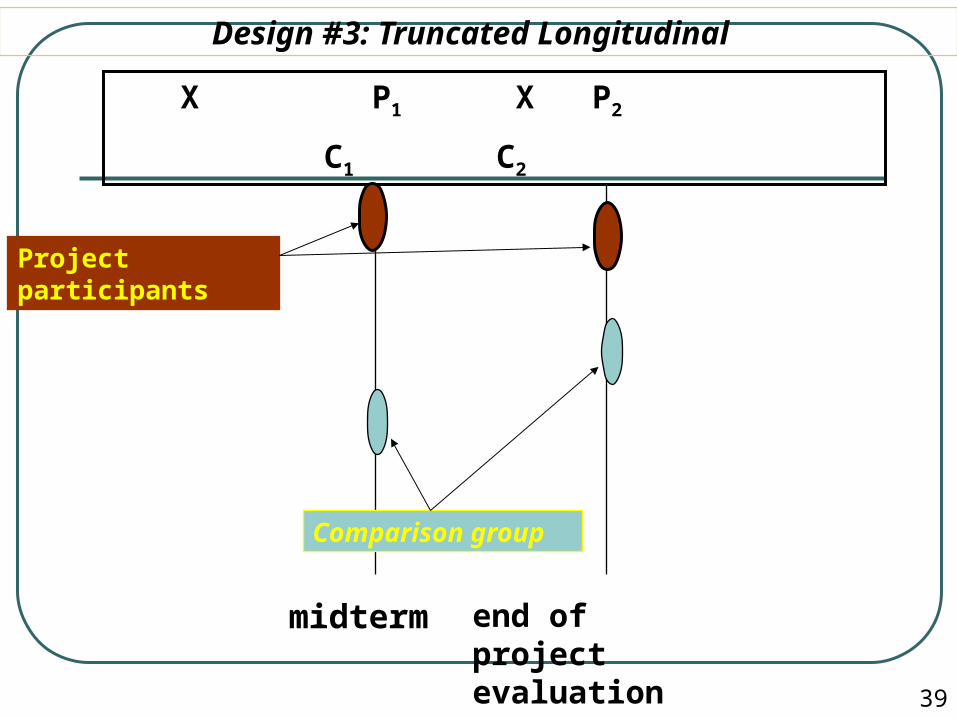
end of project evaluation
Comparison group
Design #3: Truncated Longitudinal
X P1 X P2
C1 C2
Project participants
midterm
39
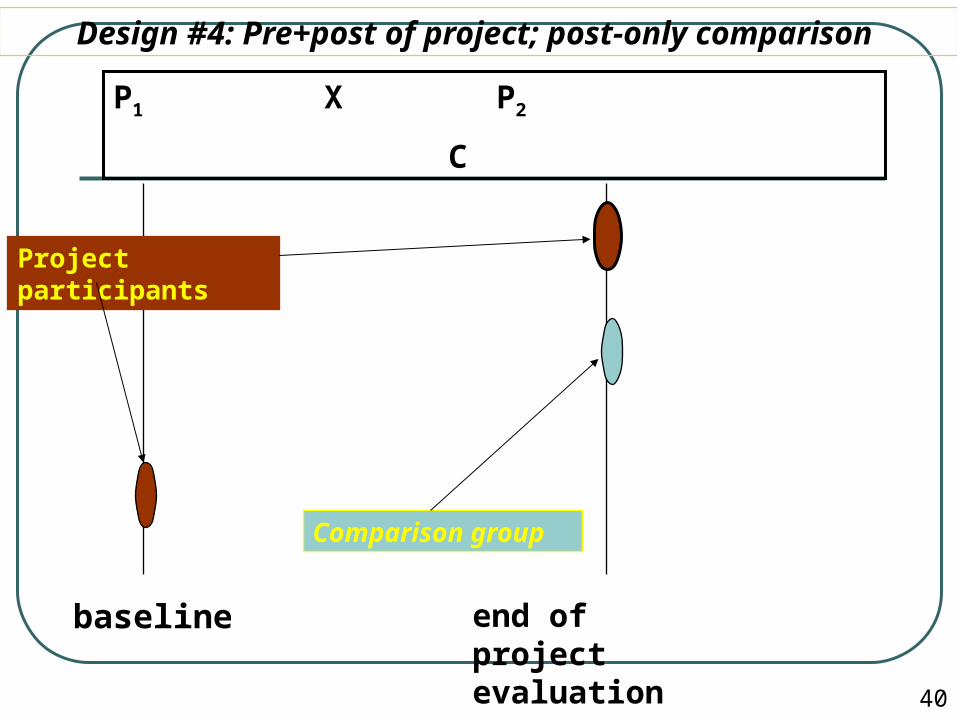
baseline end of project evaluation
Comparison group
Design #4: Pre+post of project; post-only comparison
P1 X P2
C
Project participants
40
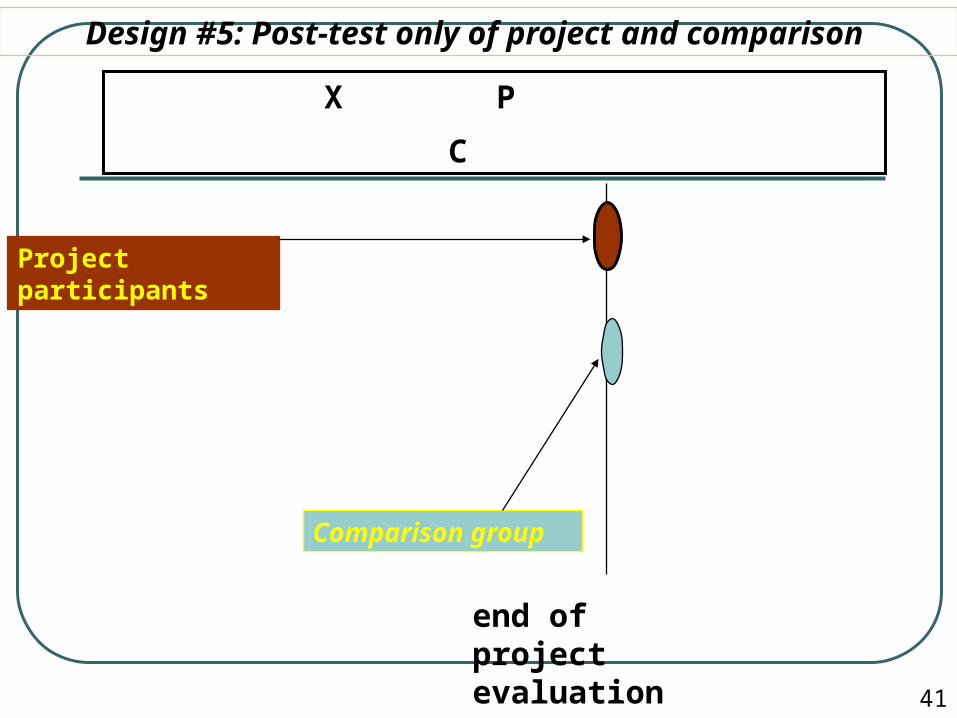
end of project evaluation
Comparison group
Design #5: Post-test only of project and comparison
X P
C
Project participants
41
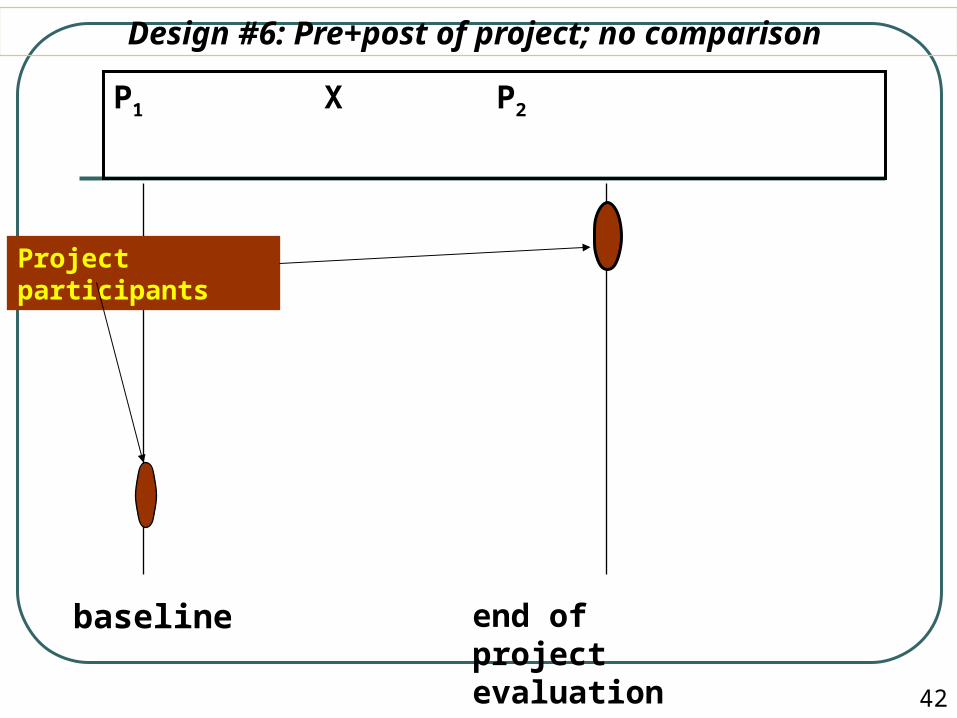
baseline end of project evaluation
Design #6: Pre+post of project; no comparison
P1 X P2
Project participants
42

end of project evaluation
Design #7: Post-test only of project participants
X P
Project participants
43
Need to fill in missing data through other means:• What change occurred during the life of the
project?• What would have happened without the
project (counterfactual)?• How sustainable is that change likely to be?
44
Design
T1
(baseline)
X(intervention)
T2
(midterm)
X(intervention,
cont.)
T3
(endline)
T4
(ex-post)
1 P1
C1
XP2
C2
XP3
C3
P4
C4
2 P1
C1
X XP2
C2
3X
P1
C1
XP2
C2
4P1 X X
P2
C2
5X X
P1
C1
6 P1 X X P2
7 X X P1
See Table 2.2 on page 8 of Condensed Overview of RWE

“Non-Experimental” Designs [NEDs]
NEDs are impact evaluation designs that do not include a matched comparison group
Outcomes and impacts assessed without a conventional statistical counterfactual to address the question• “what would have been the situation of the
target population if the project had not taken place?”
45
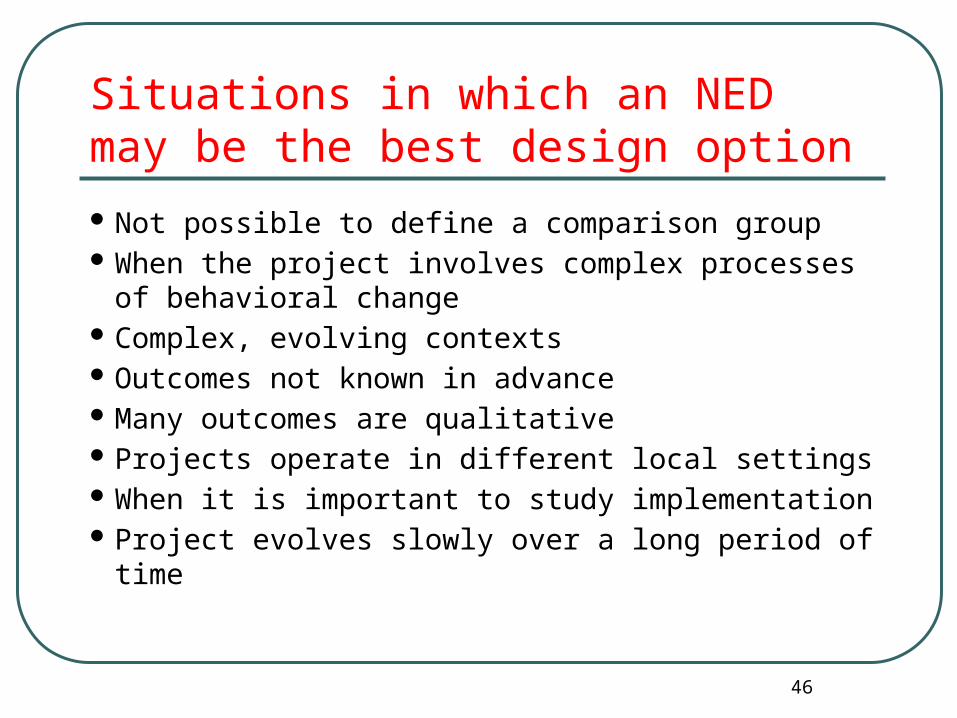
Situations in which an NED may be the best design option
Not possible to define a comparison group When the project involves complex processes of
behavioral change Complex, evolving contexts Outcomes not known in advance Many outcomes are qualitative Projects operate in different local settings When it is important to study implementation Project evolves slowly over a long period of time
46
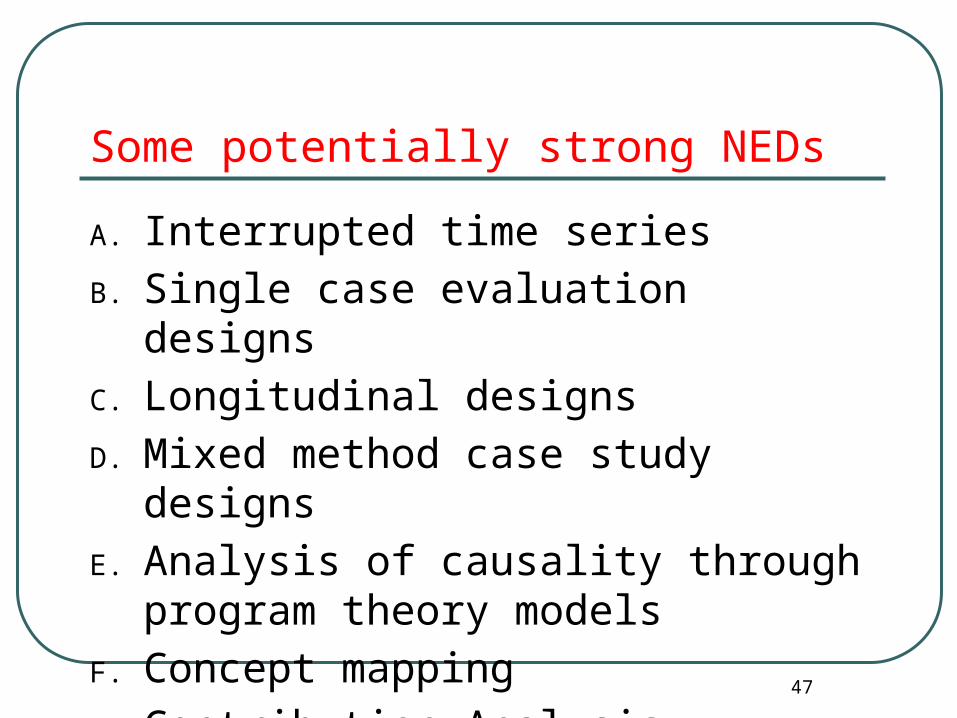
Some potentially strong NEDs
A. Interrupted time series
B. Single case evaluation designs
C. Longitudinal designs
D. Mixed method case study designs
E. Analysis of causality through program theory models
F. Concept mapping
G. Contribution Analysis47

Any questions?48

TIME FOR SMALL GROUP DISCUSSION 49

50
1. Self-introductions
2. What constraints of these types have you
faced in your evaluation practice?
3. How did you cope with them?

51
LOGIC
MODELS
RealWorld Evaluation
Designing Evaluations under Budget, Time,
Data and Political Constraints

52
Defining the program theory model
All programs are based on a set of assumptions (hypothesis) about how the project’s interventions should lead to desired outcomes.
Sometimes this is clearly spelled out in project documents.
Sometimes it is only implicit and the evaluator needs to help stakeholders articulate the hypothesis through a logic model.

53
Defining and testing critical assumptions are essential (but often ignored) elements of program theory models.
The following is an example of a model to assess the impacts of microcredit on women’s social and economic empowerment
Defining the program theory model

54
Sustainability• Structural changes will lead to long-term impacts.
Medium/long-term impacts• Increased women’s economic and social empowerment. • Economic and social welfare of women and their families will
improve. Short-term outcomes
• If women obtain loans they will start income-generating activities.• Women will be able to control the use of loans and reimburse them.
Outputs• If credit is available women will be willing and able to obtain loans
and technical assistance.
Critical logic chain hypothesis for a Gender-Inclusive Micro-Credit Program

What does it take to measure indicators at each level?
Outcome: Change in behavior of participants (can be surveyed annually)
Output: Measured and reported by project staff (annually)
Activities: On-going (monitoring of interventions)
Inputs: On-going (financial accounts)
Impact :Population-based survey (baseline, endline evaluation)

PROBLEM
PRIMARY CAUSE 2
PRIMARYCAUSE 1
PRIMARY CAUSE 3
Secondary cause 2.2
Secondary cause 2.3
Secondary cause 2.1
Tertiary cause 2.2.1
Tertiary cause 2.2.2
Tertiary cause 2.2.3
Consequences Consequences Consequences
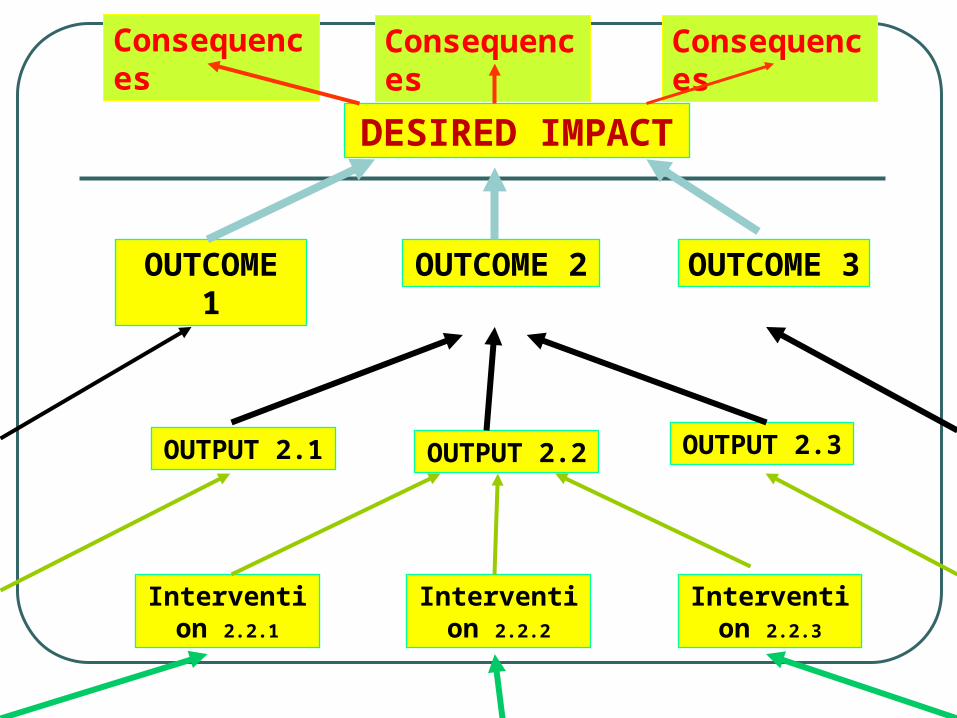
DESIRED IMPACT
OUTCOME 2
OUTCOME 1
OUTCOME 3
OUTPUT 2.2 OUTPUT 2.3OUTPUT 2.1
Intervention 2.2.1
Intervention 2.2.2
Intervention 2.2.3
Consequences Consequences Consequences

Women empowered
Young women educated
Women in leadership roles
Economic opportunities
for women
Female enrollment rates
increase
Curriculum improved
Improved educational
policies
Parents persuaded to send girls to
school
Schools built
School system hires and pays
teachers
Reduction in poverty
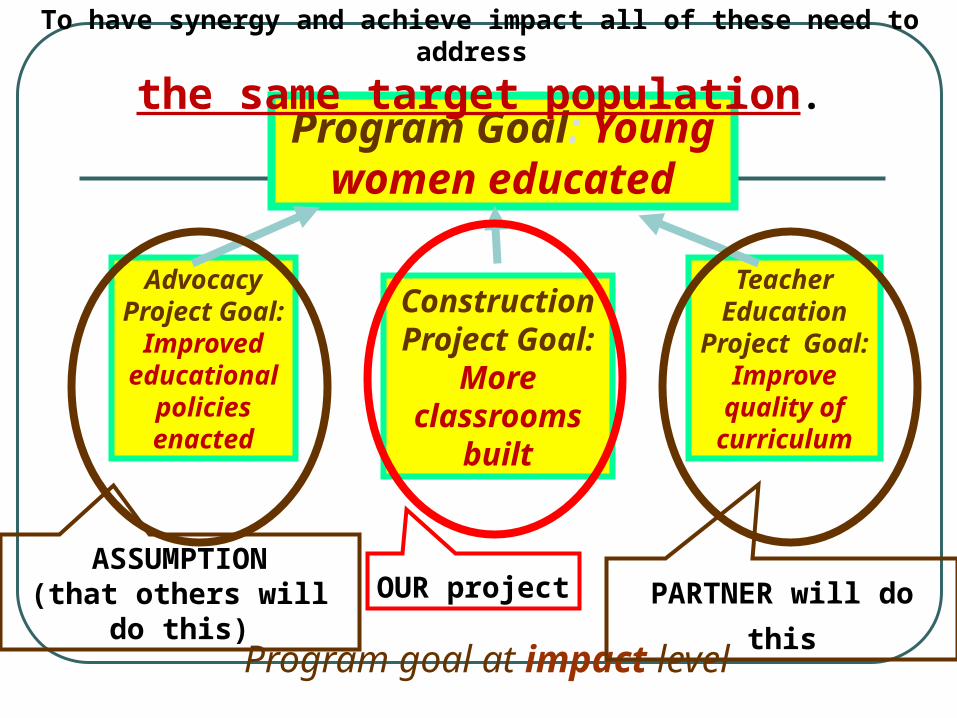
Advocacy Project Goal:
Improved educational
policies enacted
Program Goal: Young women educated
Construction Project Goal:
More classrooms
built
Teacher Education
Project Goal:
Improve quality of
curriculum
Program goal at impact level
ASSUMPTION(that others will do this) PARTNER will do this
OUR project
To have synergy and achieve impact all of these need to address
the same target population.
60
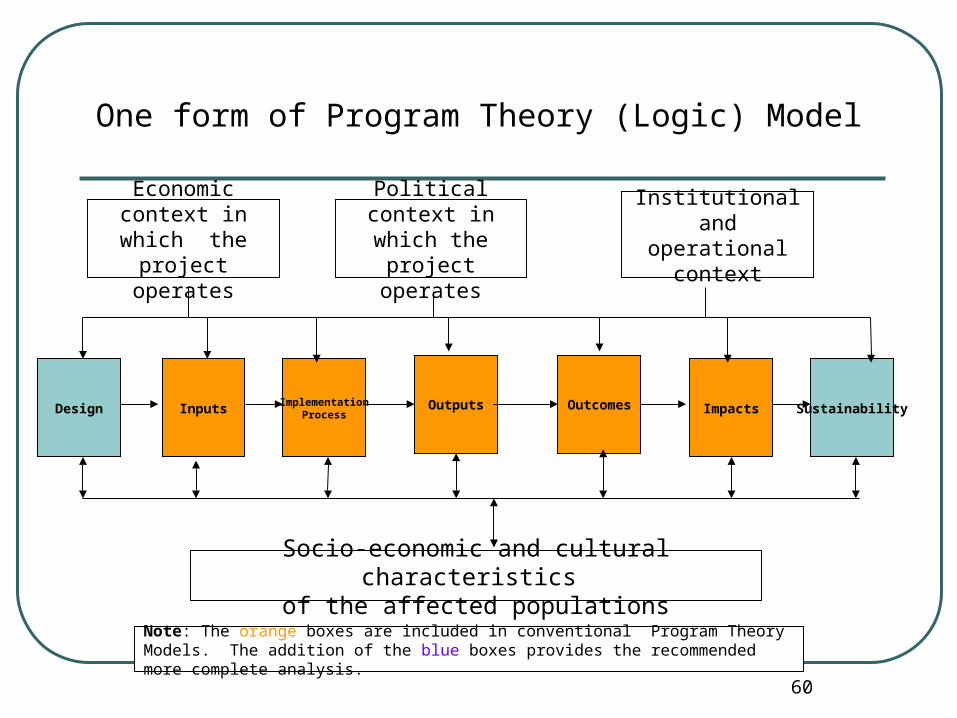
Design InputsImplementation
ProcessOutputs Outcomes Impacts Sustainability
Economic context in which the
project operates
Political context in which the project
operates
Institutional and operational
context
Socio-economic and cultural characteristics of the affected populations
Note: The orange boxes are included in conventional Program Theory Models. The addition of the blue boxes provides the recommended more complete analysis.
One form of Program Theory (Logic) Model
61
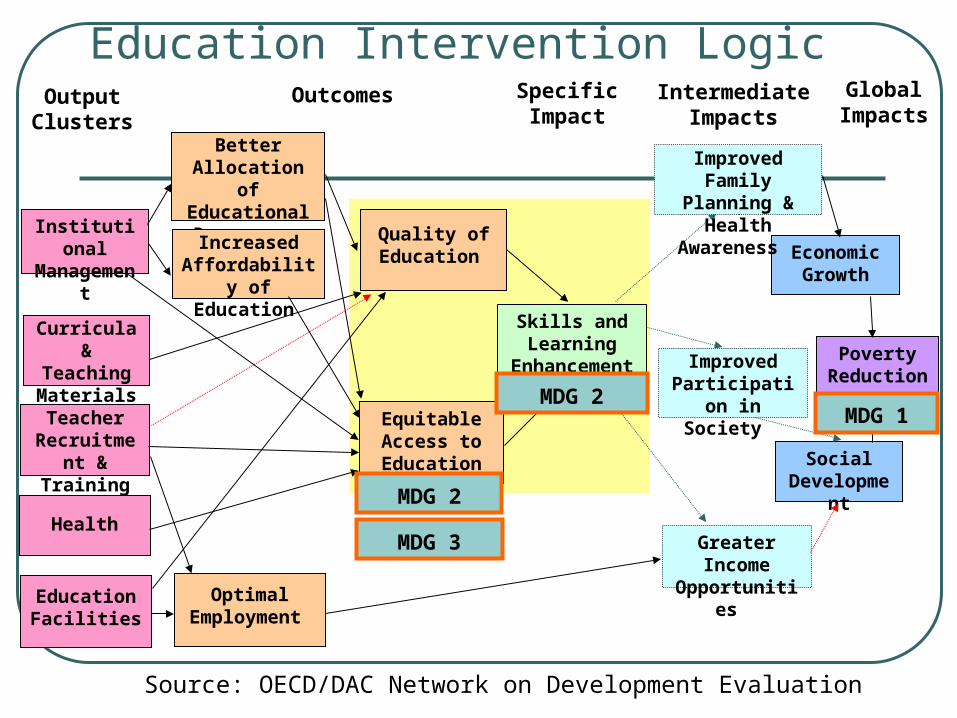
Education Intervention Logic
Institutional Management
Curricula & Teaching Materials
Teacher Recruitment & Training
Education Facilities
Health
Better Allocation of Educational Resources
Increased Affordability of
Education
Optimal Employment
Skills and Learning
Enhancement
Equitable Access to Education
Quality of Education
Greater Income Opportunities
Economic Growth
Social Development
Poverty Reduction
OutputClusters
Outcomes Specific Impact
IntermediateImpacts
GlobalImpacts
Improved Participation in
Society
Improved Family Planning &
Health Awareness
MDG 3
MDG 2
MDG 1MDG 2
Source: OECD/DAC Network on Development Evaluation

Inputs
Outputs
Intermediate outcomes
Impacts
Donor Government Other donors
Credit for small farmers
Rural roads
SchoolsHealth services
Increased rural H/H income
Increased production
Increased school enrolment
Increased use of health services
Access to off-farm employment
Improved education performance
Improved health
Increased political participation
Expanding the results chain for multi-donor, multi-component program
Attribution gets very difficult! Consider plausible contributions each makes.

Contribution Analysis*
1. Develop a program logic (theory of change)
2. Identify existing evidence on the causal links between interventions and possible effects. Identify gaps in information.
3. Assess alternative explanations of possible effects. Assess the possible contributions of different factors to effects.
64
* John Mayne et al in EES’ Evaluation journal, Vol. 18, No. 3, July 2012
Contribution Analysis*
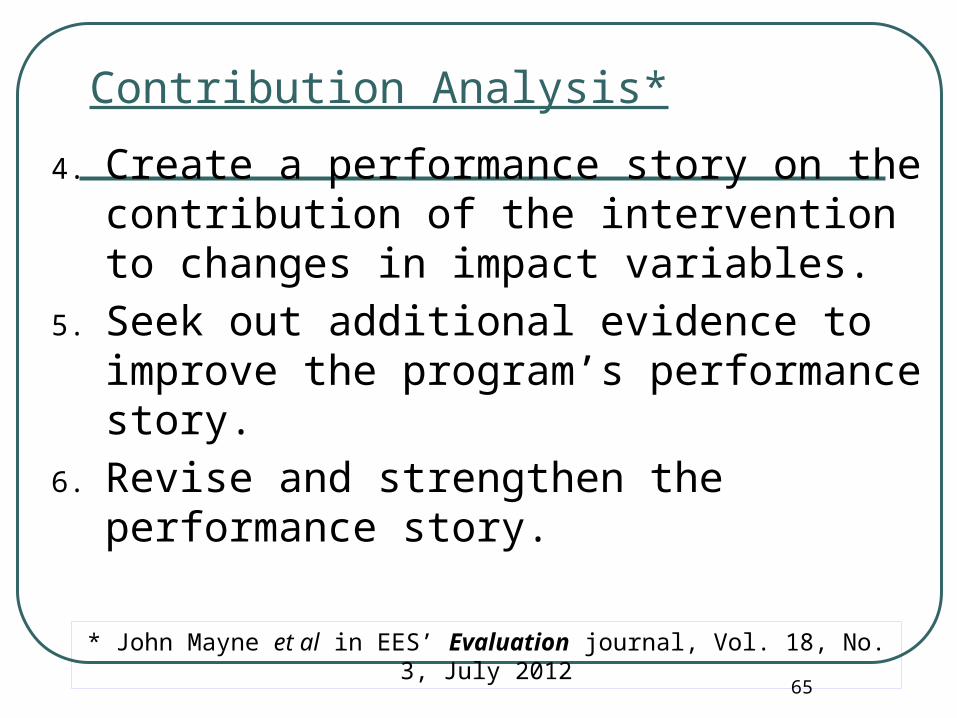
4. Create a performance story on the contribution of the intervention to changes in impact variables.
5. Seek out additional evidence to improve the program’s performance story.
6. Revise and strengthen the performance story.
65
* John Mayne et al in EES’ Evaluation journal, Vol. 18, No. 3, July 2012

Where there was no baseline
RealWorld Evaluation
Designing Evaluations under Budget, Time,
Data and Political Constraints
67
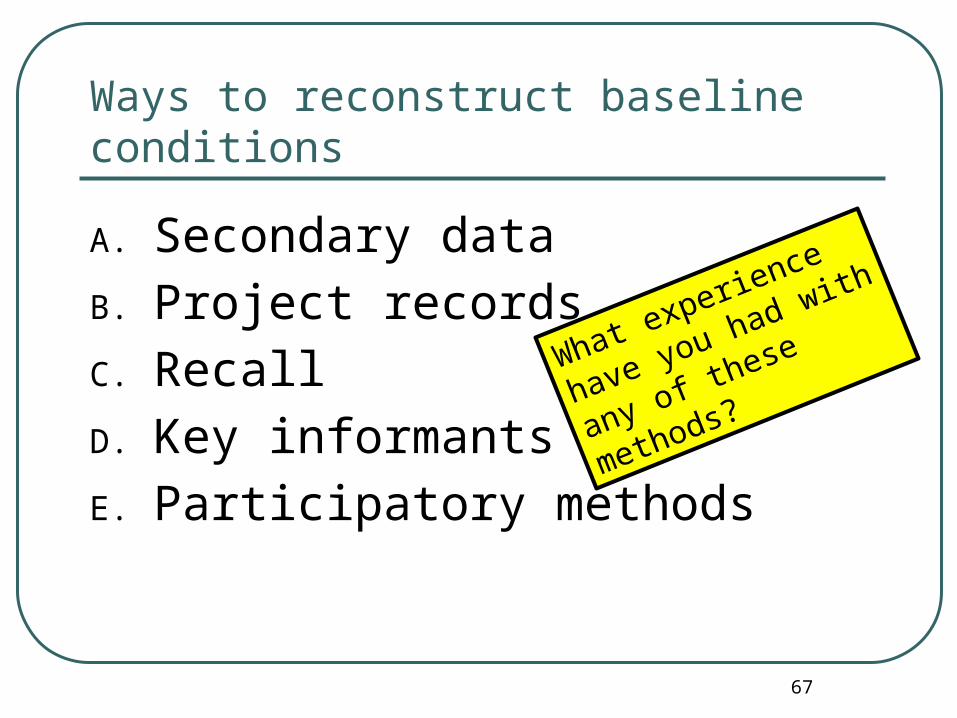
Ways to reconstruct baseline conditions
A. Secondary data
B. Project records
C. Recall
D. Key informants
E. Participatory methods
What experience have
you had with any of
these methods?

68
Assessing the utility of potential secondary data
Reference period Population coverage Inclusion of required indicators Completeness Accuracy Free from bias
69
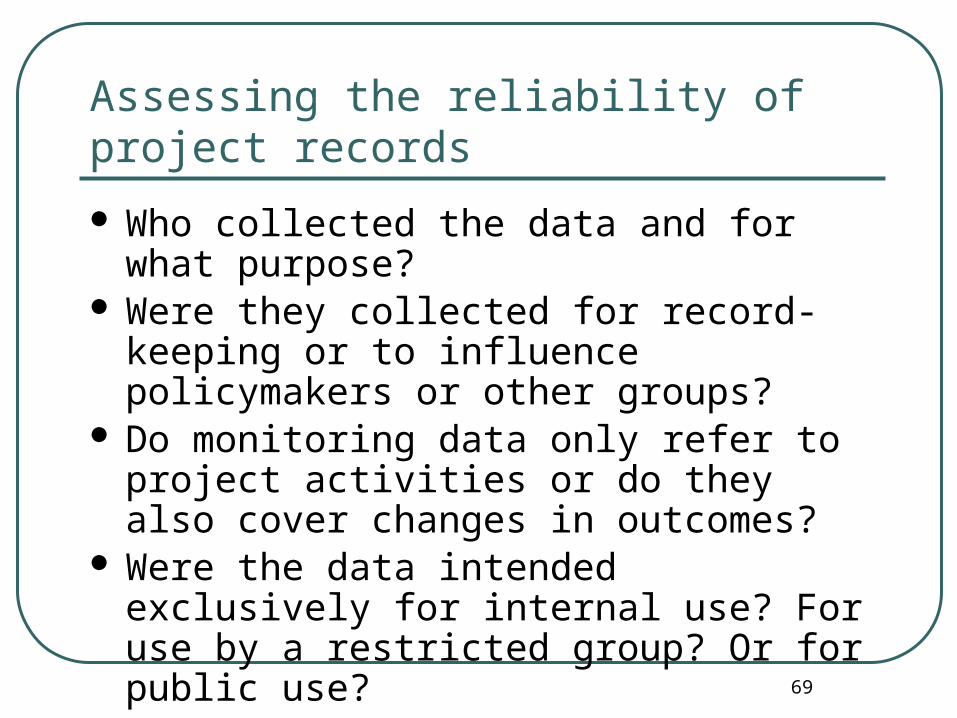
Assessing the reliability of project records
Who collected the data and for what purpose?
Were they collected for record-keeping or to influence policymakers or other groups?
Do monitoring data only refer to project activities or do they also cover changes in outcomes?
Were the data intended exclusively for internal use? For use by a restricted group? Or for public use?

70
Limitations of recall
Generally not reliable for precise quantitative data
Sample selection bias Deliberate or unintentional distortion Few empirical studies (except on
expenditure) to help adjust estimates
71
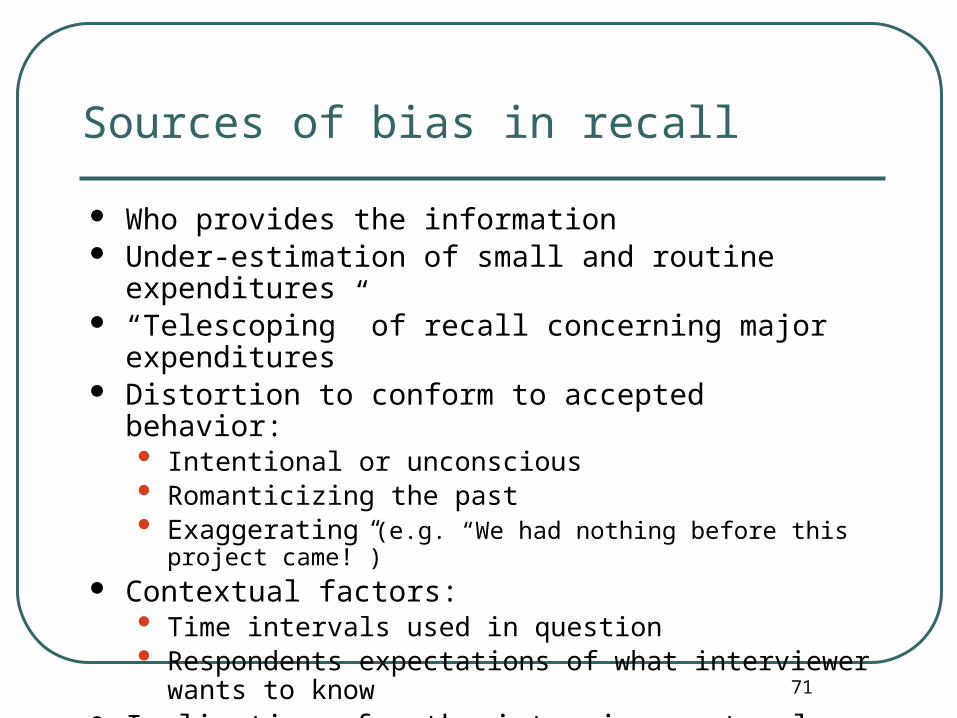
Sources of bias in recall
Who provides the information Under-estimation of small and routine expenditures “Telescoping” of recall concerning major expenditures Distortion to conform to accepted behavior:
• Intentional or unconscious• Romanticizing the past• Exaggerating (e.g. “We had nothing before this project came!”)
Contextual factors:• Time intervals used in question• Respondents expectations of what interviewer wants to
know Implications for the interview protocol

72
Improving the validity of recall
Conduct small studies to compare recall with survey or other findings.
Ensure all relevant groups interviewed Triangulation Link recall to important reference events
• Elections• Drought/flood/tsunami/war/displacement• Construction of road, school etc

73
Key informants
Not just officials and high status people Everyone can be a key informant on their
own situation:• Single mothers• Factory workers• Users of public transport• Sex workers• Street children

74
Guidelines for key-informant analysis
Triangulation greatly enhances validity and understanding
Include informants with different experiences and perspectives
Understand how each informant fits into the picture
Employ multiple rounds if necessary Carefully manage ethical issues
75
PRA and related participatory techniques
PRA (Participatory Rapid Appraisal) and PLA (Participatory Learning and Action) techniques collect data at the group or community [rather than individual] level
Can either seek to identify consensus or identify different perspectives
Risk of bias:• If only certain sectors of the community
participate• If certain people dominate the discussion
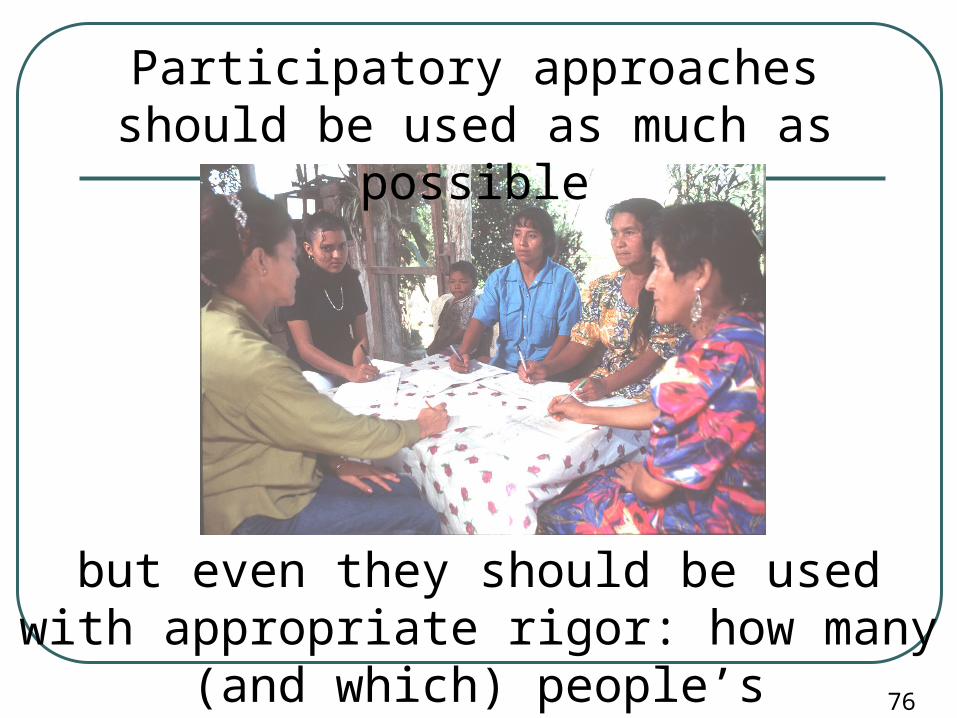
Participatory approaches should be used as much as possible
but even they should be used with appropriate rigor: how many (and which) people’s perspectives contributed to the story? 76
77
Summary of issues in baseline reconstruction
Variations in reliability of recall Memory distortion Secondary data not easy to use Secondary data incomplete or unreliable Key informants may distort the past
Yet in many cases we need to use one or more of these methods to determine what change occurred during the life of a project.

Mixed-method (MM) evaluations
RealWorld Evaluation
Designing Evaluations under Budget, Time,
Data and Political Constraints

79
The Main Messages
1. No single evaluation approach can fully address the complexities of development evaluations
2. MM combines the breadth of quantitative (QUANT) evaluation methods with the depth of qualitative (QUAL) methods
3. MM is an integrated approach to evaluation with specific tools and techniques for each stage of the evaluation cycle
4. MM are used differently by evaluators with a QUANT orientation and those with a QUAL orientation – and offer distinct benefits for each kind of evaluation

A. Why mixed methods?
No single evaluation
methodology can fully explain how
development programs operate in the real world
This explains the growing interest in mixed methods
evaluations
81
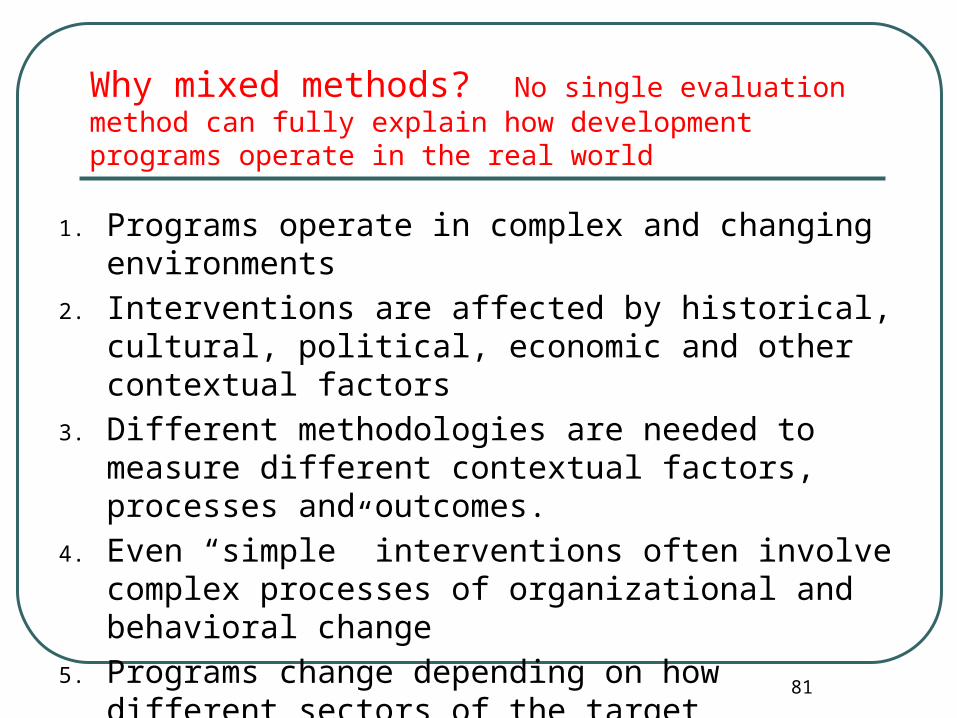
Why mixed methods? No single evaluation method can fully explain how development programs operate in the real world
1. Programs operate in complex and changing environments
2. Interventions are affected by historical, cultural, political, economic and other contextual factors
3. Different methodologies are needed to measure different contextual factors, processes and outcomes.
4. Even “simple” interventions often involve complex processes of organizational and behavioral change
5. Programs change depending on how different sectors of the target population respond

The benefits of a mixed methods approach
QUANTITATIVE breadth
QUALITATIVE depth
How many?How much?
How representative of the total population?
Are changes statistically significant?
• How were changes experienced by individuals?
• What actually happened on the ground?
• The quality of services
+

83
Four decisions for designing a mixed methods evaluation
1. At which stages of the evaluation are mixed methods used?
2. Is the design sequential or concurrent?
3. Which approach is dominant?
4. Is the design single or multi-level?
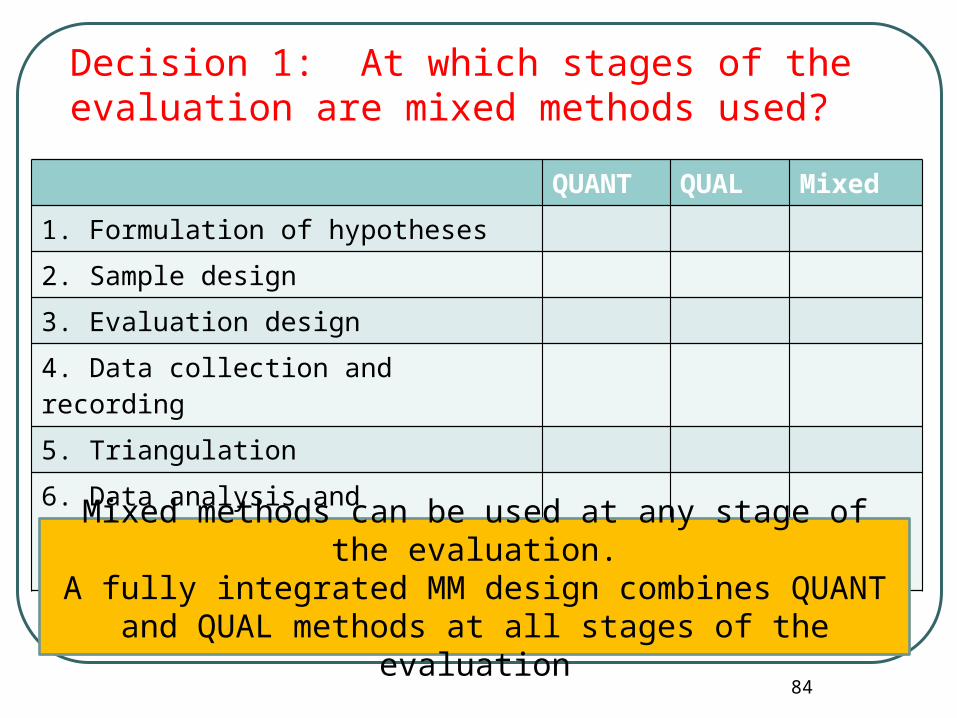
Decision 1: At which stages of the evaluation are mixed methods used?
QUANT QUAL Mixed
1. Formulation of hypotheses
2. Sample design
3. Evaluation design
4. Data collection and recording
5. Triangulation
6. Data analysis and interpretation
Mixed methods can be used at any stage of the evaluation.A fully integrated MM design combines QUANT and QUAL
methods at all stages of the evaluation
85
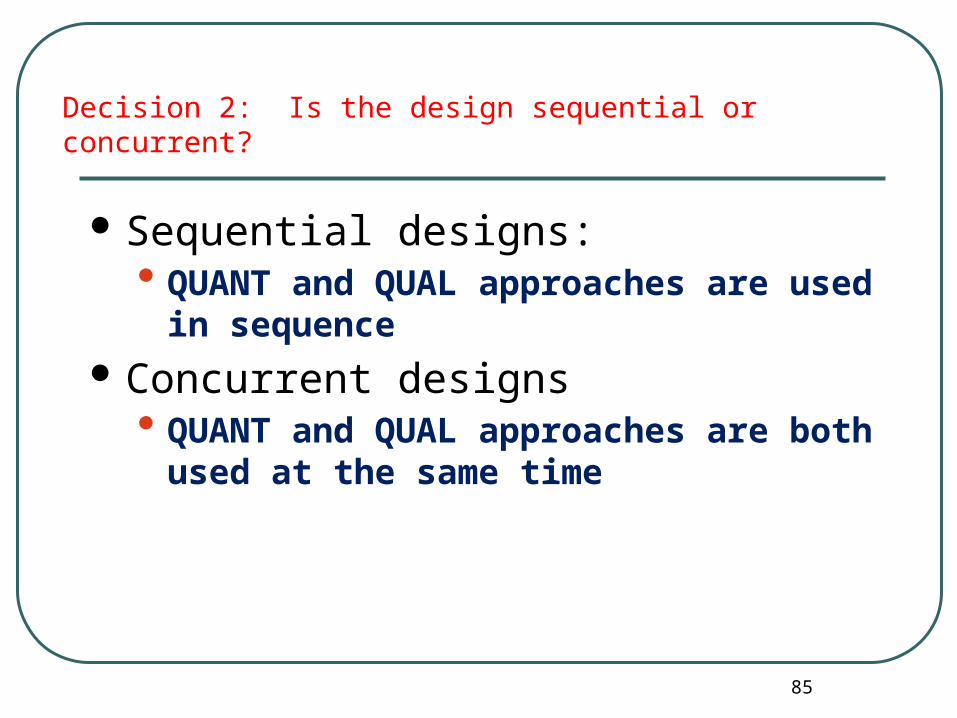
Decision 2: Is the design sequential or concurrent?
Sequential designs:• QUANT and QUAL approaches are used in
sequence Concurrent designs
• QUANT and QUAL approaches are both used at the same time

86
Sequential QUAL dominant MM design: Evaluating the adoption of new seed varieties by different types of rural families.
Rapid QUANT household survey in project villages to estimate HH characteristics, ethnicity, agricultural production and seed adoption
QUAL data collection using key informants focus groups, observation, and preparation of case studies on households and farming practices.
QUAL data analysis using within and between-case analysis and constant comparison. Triangulation among different data sources.
quant QUAL QUAL

87
A concurrent MM design: Triangulating QUANT and QUAL estimates of household income in project and comparison areas
Project communities
Comparison communities
QUANT household surveys
QUANT/QUAL Observation of household possessions and construction quality
QUAL: Focus groups
Triangulation of estimates from the 3 sources – to obtain the most reliable estimate of household income
QUANT and QUAL data collection methods are used at the same time

A B CD
E F G
QUAL oriented studies gradually incorporating more QUANT focus
QUANT oriented studies gradually incorporating more QUAL focus
QU
AN
T QU
AL
A = completely QUANT designB = dominant QUANT with some QUAL elementsC = QUANT oriented design giving equal weight to both approachesD = Study designed as balanced MME = QUAL oriented design giving equal weight to both approaches.F = dominant QUAL design with some QUANT elementsG = completely QUAL design
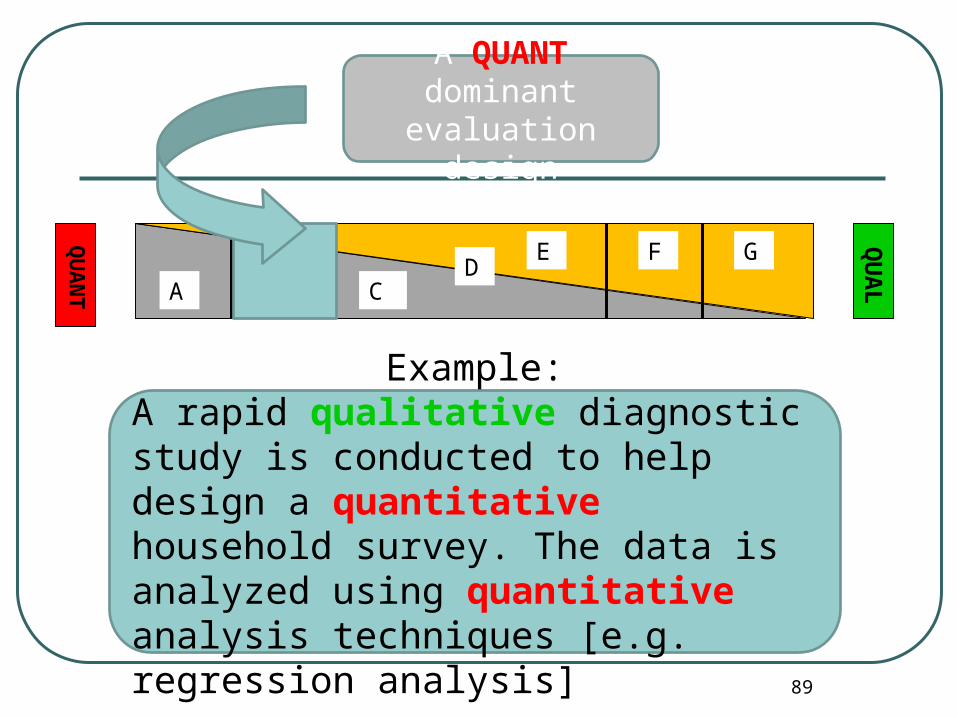
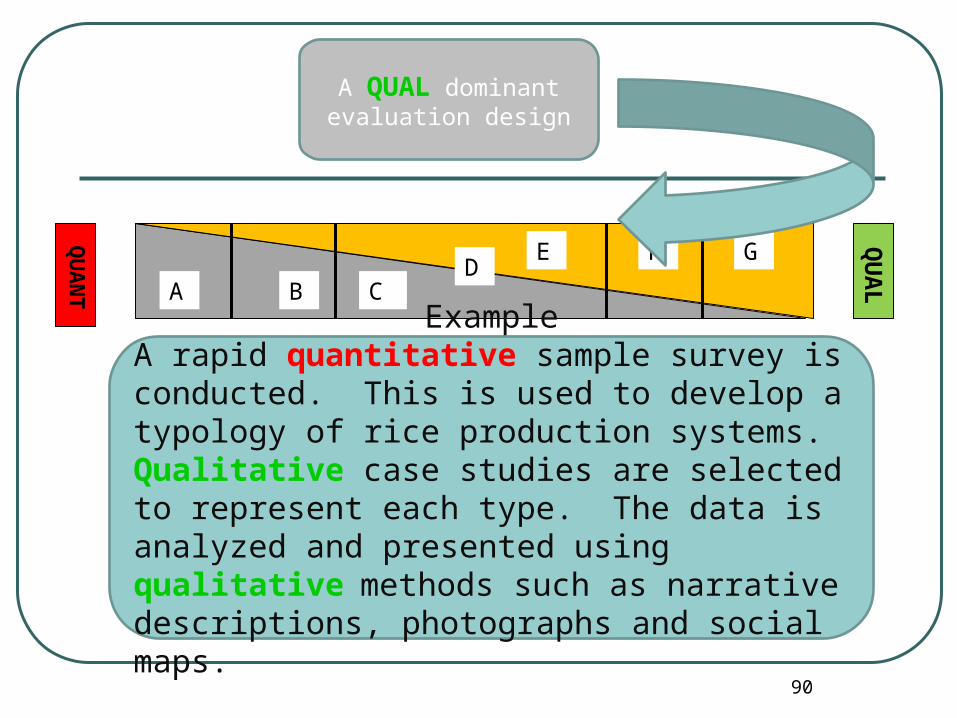
Decision 3: which approach is dominant?
A B CD
E F G
QU
AN
T
QU
AL
A QUANT dominant evaluation design
Example:A rapid qualitative diagnostic study is conducted to help design a quantitative household survey. The data is analyzed using quantitative analysis techniques [e.g. regression analysis]
90
A B CD
E F G
QU
AN
T
QU
AL
A QUAL dominant evaluation design
ExampleA rapid quantitative sample survey is conducted. This is used to develop a typology of rice production systems. Qualitative case studies are selected to represent each type. The data is analyzed and presented using qualitative
methods such as narrative descriptions, photographs and social maps.

A Multi-level mixed methods designThe effects of a school feeding program on school enrolment
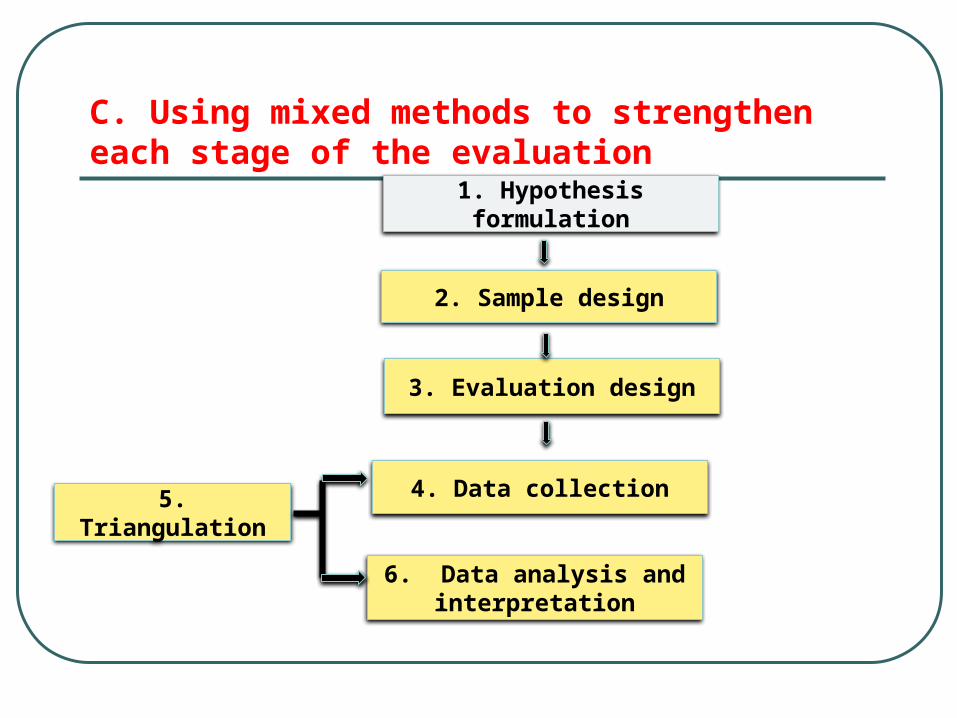
C. Using mixed methods to strengthen each stage of the evaluation
1. Hypothesis formulation
2. Sample design
3. Evaluation design
4. Data collection
6. Data analysis and interpretation
5. Triangulation
93
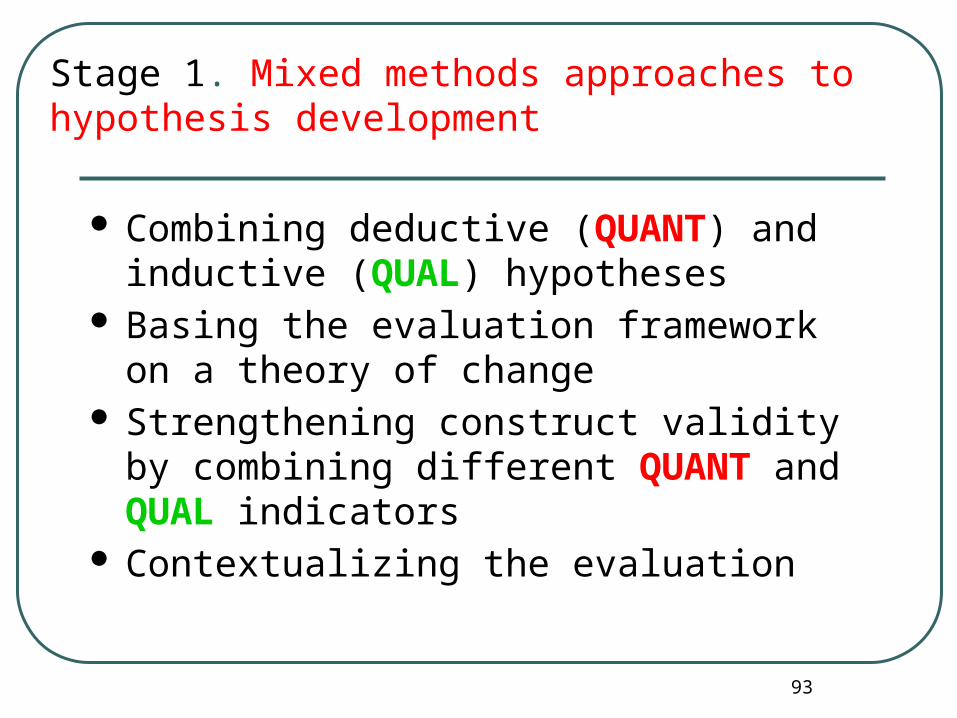
Stage 1. Mixed methods approaches to hypothesis development
Combining deductive (QUANT) and inductive (QUAL) hypotheses
Basing the evaluation framework on a theory of change
Strengthening construct validity by combining different QUANT and QUAL indicators
Contextualizing the evaluation

94
Comparing DEDUCTIVE and INDUCTIVE hypotheses
Deductive InductiveMainly used in QUANT research Mainly used in QUAL research
Hypotheses test theories based on prior research
Hypotheses based on observations in the field
Hypotheses defined at start of the evaluation before data collection begins
Hypotheses not defined until data collection begins
Hypotheses normally do not change Hypotheses evolve as data collection progresses
Hypotheses can be tested experimentally
Hypotheses are tested using Theory of Change or logically
Mixed methods hypotheses combine both deductive and inductive

95
Stage 2. Mixed method sample designs
Parallel mixed method sampling• Random (QUANT) and purposive (QUAL)
sampling Sequential MM sampling Multi-level MM sampling Strengthening the coverage of the sampling
frame Strengthening the matching of the project
and control groups

96
Stage 3. Mixed method evaluation design
Combining experimental and quasi-experimental; designs with QUAL techniques to explore:• Processes and quality of services• Context• Behavioral change
Flexibility to adapt the evaluation to changes in the project design or the project context
In-depth analysis of how the project affects different groups
Creative identification of comparison groups

97
Stage 4. Strengthening data collection
A. Integrating survey and QUAL data collection
B. Commonly used mixed method data collection methods for strengthening QUANT evaluations
1. Focus groups
2. Observation
3. Secondary data
4. Case studies
C. Reconstructing baseline data
D. Interviewing difficult-to-reach groups
E. Collecting information on sensitive topics
F. Attention to contextual clues
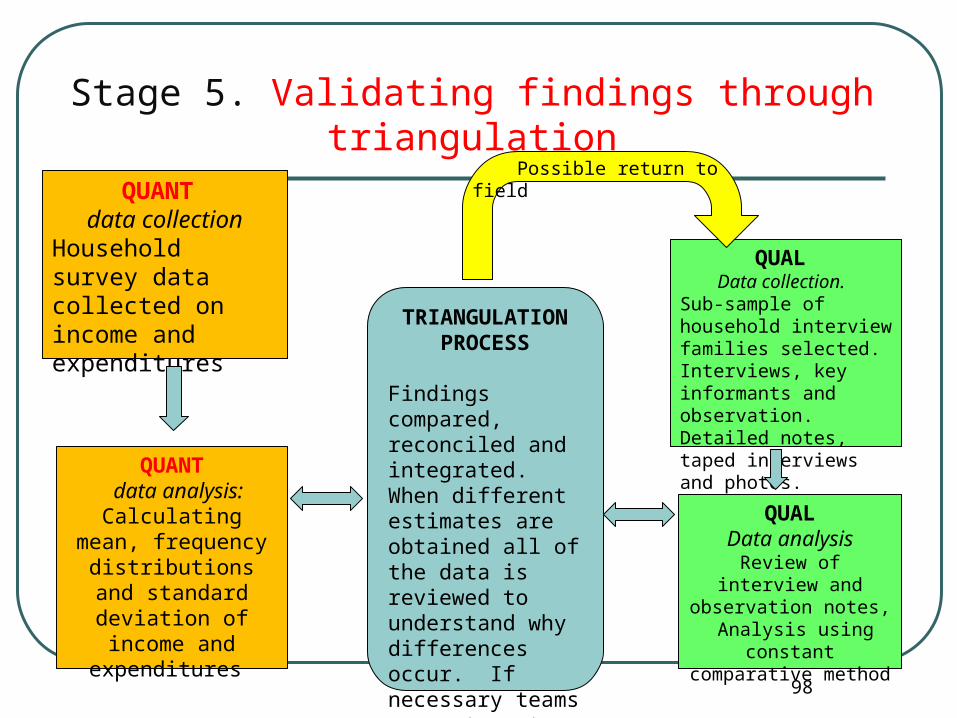
QUANT data collection
Household survey data collected on income and expenditures
QUANT data analysis:
Calculating mean, frequency
distributions and standard deviation of
income and expenditures
QUALData analysis
Review of interview and observation notes,
Analysis using constant comparative method
QUAL Data collection.
Sub-sample of household interview families selected. Interviews, key informants and observation. Detailed notes, taped interviews and photos.
TRIANGULATION PROCESS
Findings compared, reconciled and integrated. When different estimates are obtained all of the data is reviewed to understand why differences occur. If necessary teams may return to the field to investigate further
Possible return to field
Stage 5. Validating findings through triangulation
99
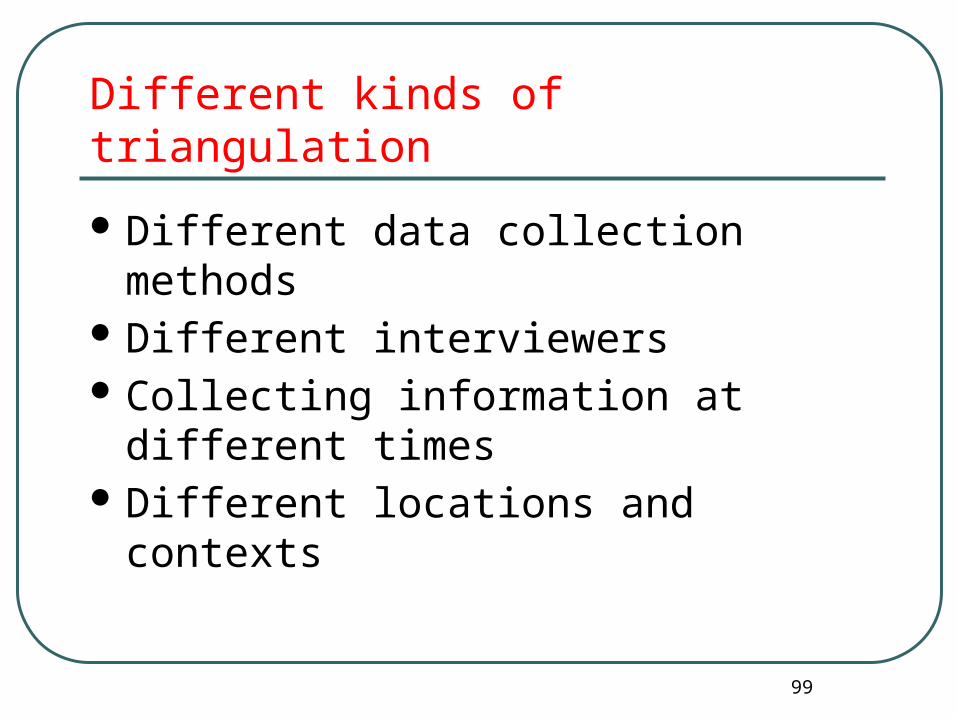
Different kinds of triangulation
Different data collection methods Different interviewers Collecting information at different times Different locations and contexts
100
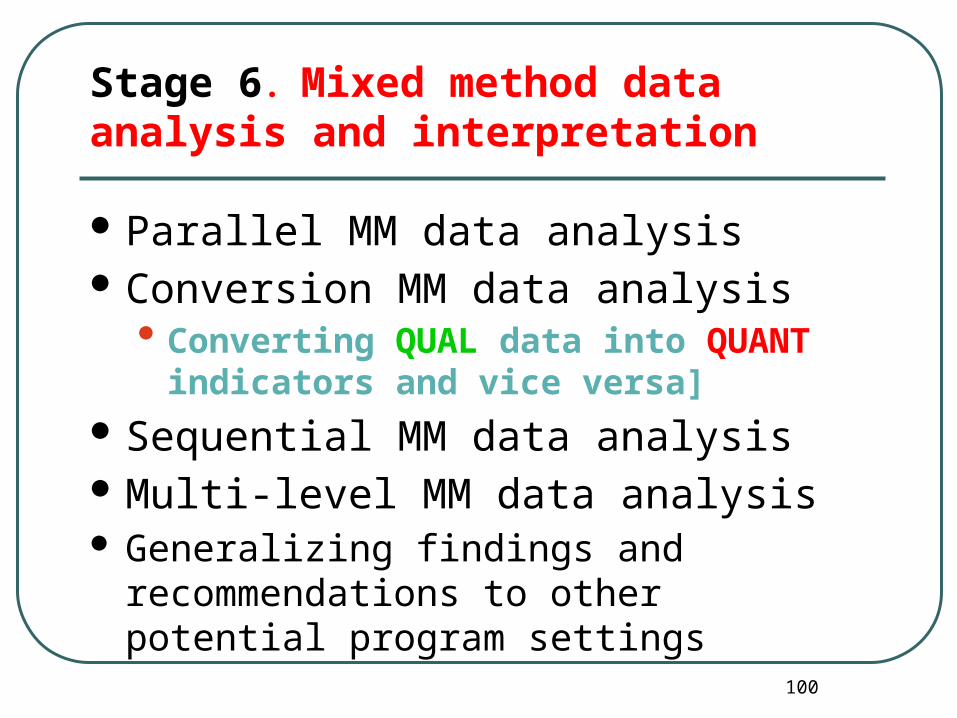
Stage 6. Mixed method data analysis and interpretation
Parallel MM data analysis Conversion MM data analysis
• Converting QUAL data into QUANT indicators and vice versa]
Sequential MM data analysis Multi-level MM data analysis Generalizing findings and recommendations
to other potential program settings

101
Quantitative data collection methodsStrengths and weaknesses
Strengths Generalization statistically representative Estimate magnitude and
distribution of impacts Clear documentation of
methods Standardized approach Statistical control of bias and
external factors
Weaknesses Surveys cannot capture many
types of information Do not work for difficult to reach
groups No analysis of context Survey situation may alienate Long delay in obtaining results Reducing data to easy-to-
measure indicators loses perspectives on complex information
102
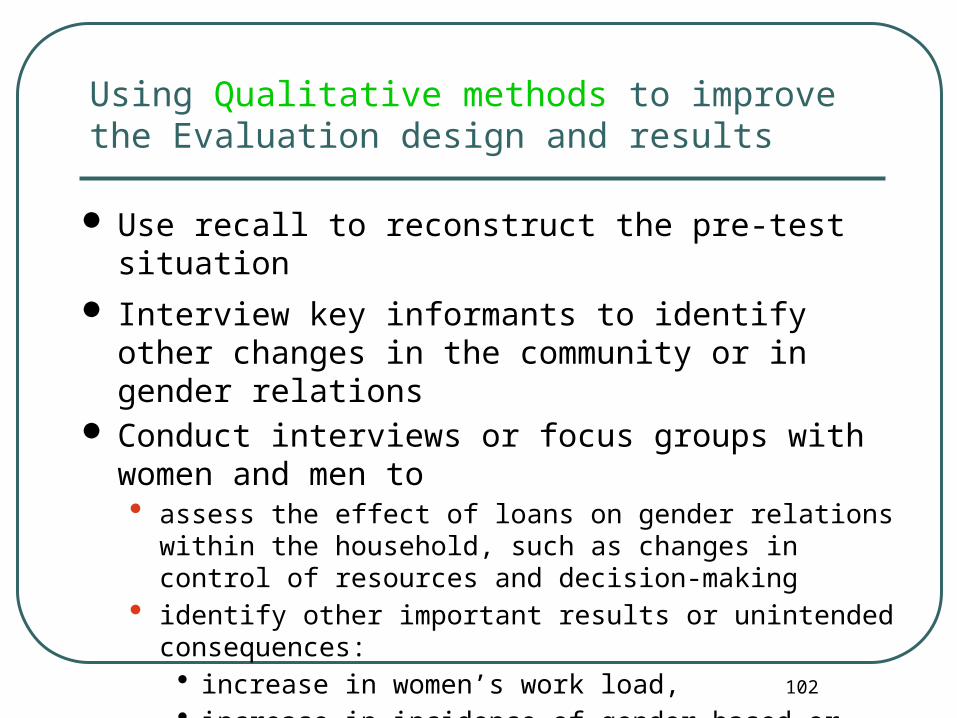
Using Qualitative methods to improve the Evaluation design and results
Use recall to reconstruct the pre-test situation
Interview key informants to identify other changes in the community or in gender relations
Conduct interviews or focus groups with women and men to • assess the effect of loans on gender relations within the
household, such as changes in control of resources and decision-making
• identify other important results or unintended consequences: • increase in women’s work load, • increase in incidence of gender-based or domestic violence
Determining Counterfactuals
RealWorld Evaluation
Designing Evaluations under Budget, Time,
Data and Political Constraints

104
Attribution and counterfactuals
How do we know if the observed changes in the project participants or communities • income, health, attitudes, school attendance.
etc
are due to the implementation of the project • credit, water supply, transport vouchers, school
construction, etc
or to other unrelated factors?• changes in the economy, demographic
movements, other development programs, etc

105
The Counterfactual
What change would have occurred in the relevant condition of the target population if there had been no intervention by this project?
106
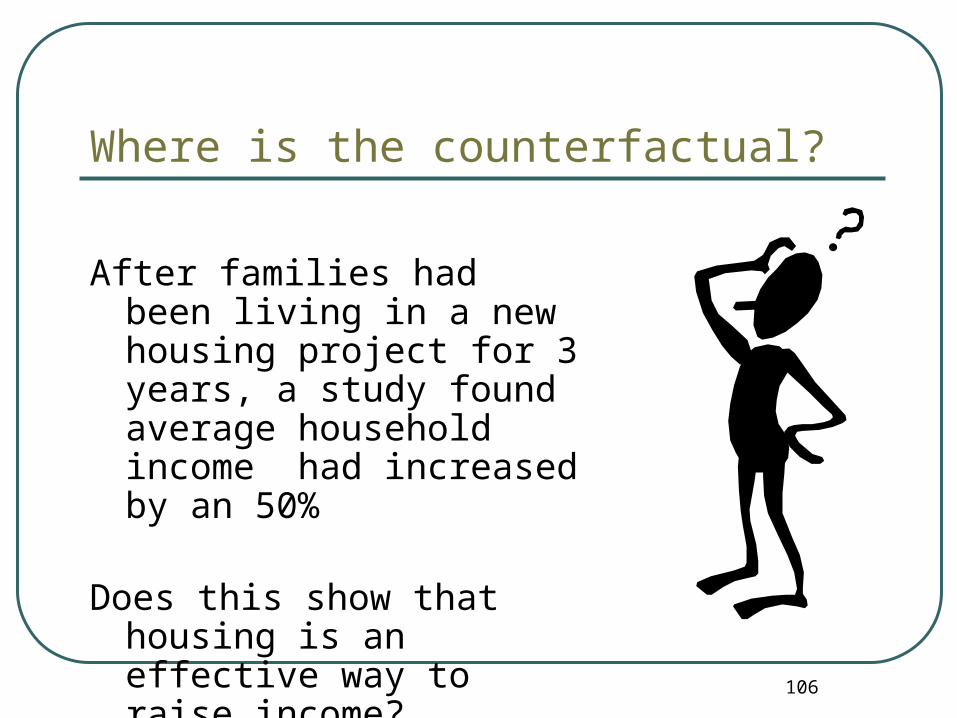
Where is the counterfactual?
After families had been living in a new housing project for 3 years, a study found average household income had increased by an 50%
Does this show that housing is an effective way to raise income?

Comparing the project with two possible comparison groups
2004 2009
250
500
750
I n c o m e
Project group. 50% increase
Scenario 2. 50% increase in comparison group income. No evidence of project impact
Scenario 1. No increase in comparison group income.
Potential evidence of project impact

108
Control group and comparison group
Control group = randomized allocation of subjects to project and non-treatment group
Comparison group = separate procedure for sampling project and non-treatment groups that are as similar as possible in all aspects except the treatment (intervention)

Eligible individuals, communities, schools etc are randomly assigned to either:
• The project group (that receives the services)
or
• The control group (that does not have access to the project services)
109
IE Designs: Experimental Designs
Randomized Control Trials

A graphical illustration of an ‘ideal’counterfactual using pre-project trend line then RCT
110Time
Prim
ary
Out
com
e
Impact
Counterfactual
Intervention
Trend line
Subjects randomly assigned either to …
Treatment group
Control group
IMPACT
111
There are other methods for assessing the counterfactual
Reliable secondary data that depicts relevant trends in the population
Longitudinal monitoring data (if it includes non-reached population)
Qualitative methods to obtain perspectives of key informants, participants, neighbors, etc.

112
Ways to reconstruct comparison groups
Judgmental matching of communities When there is phased introduction of
project services beneficiaries entering in later phases can be used as “pipeline” comparison groups
Internal controls when different subjects receive different combinations and levels of services
113
Using propensity scores and other methods to strengthen comparison groups
Propensity score matching Rapid assessment studies can compare
characteristics of project and comparison groups using:• Observation• Key informants• Focus groups• Secondary data• Aerial photos and GIS data

114
Issues in reconstructing comparison groups Project areas often selected purposively and
difficult to match Differences between project and comparison
groups - difficult to assess whether outcomes were due to project interventions or to these initial differences
Lack of good data to select comparison groups
Contamination (good ideas tend to spread!) Econometric methods cannot fully adjust for
initial differences between the groups [unobservables]

115
What experiences have you had with identifying counterfactual data?
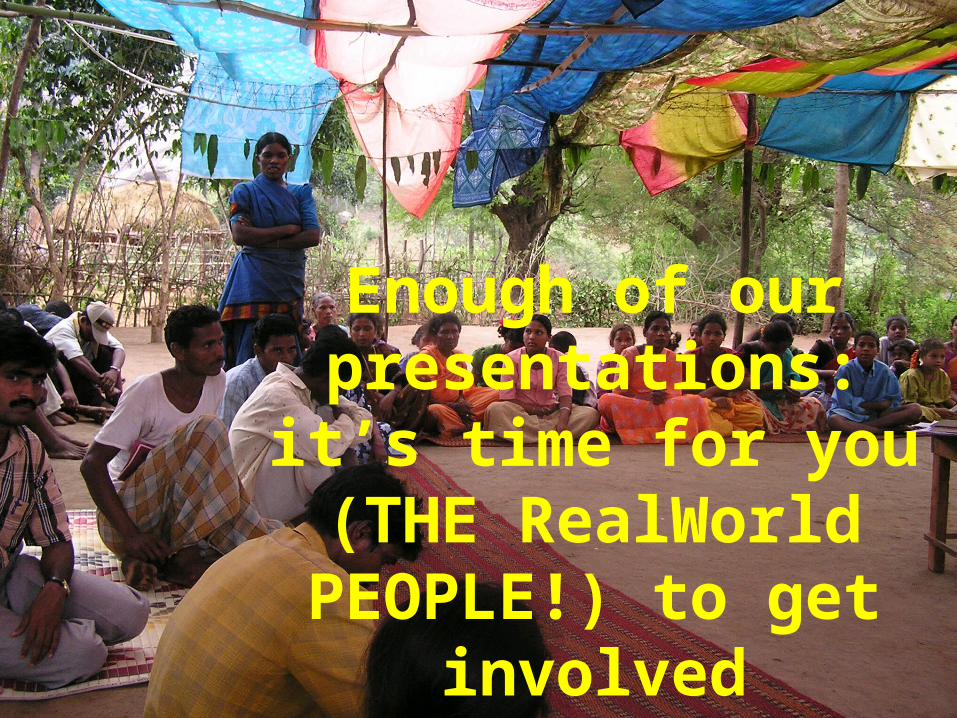
Enough of our presentations: it’s time
for you (THE RealWorld PEOPLE!)
to get involved yourselves.

Time for small-group work. Read your case studies
and begin your discussions.
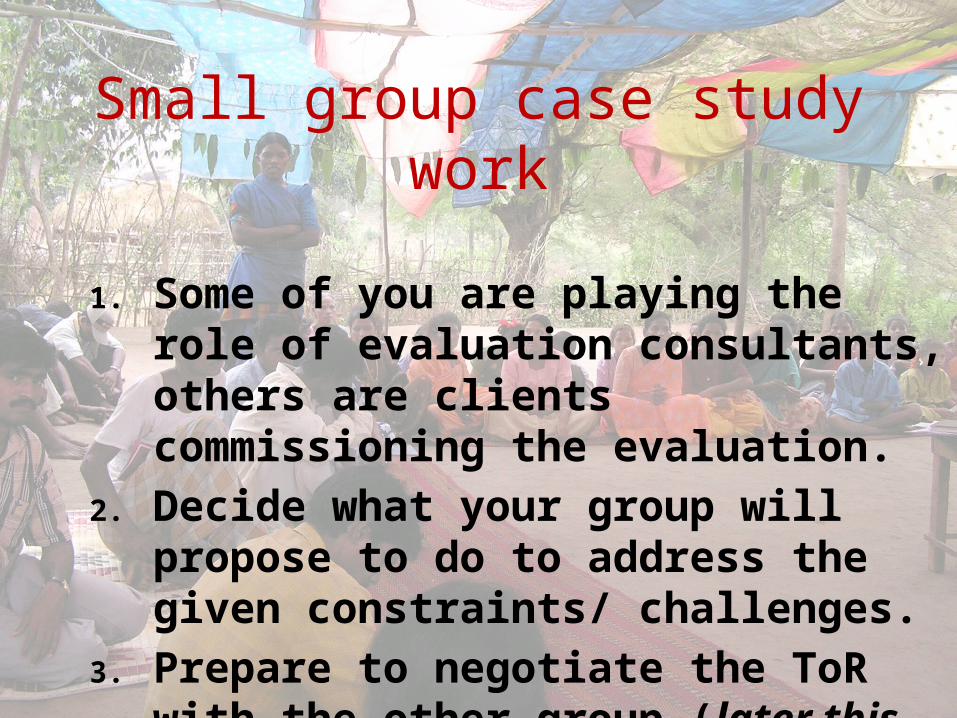
1. Some of you are playing the role of evaluation consultants, others are clients commissioning the evaluation.
2. Decide what your group will propose to do to address the given constraints/ challenges.
3. Prepare to negotiate the ToR with the other group (later this afternoon).
Small group case study work

The purpose of this exercise to gain some practical ‘feel’ for applying what we’ve learned about RealWorld Evaluation.
Group A (consultants) Evaluation team to consider how they will propose a revised evaluation design and plan that reduces the budget by 25% to 50%, and yet meets the needs of both clients (City Housing Department and the international donor).
Group B (clients) will also review the initial proposal in light of what they have learned about RealWorld Evaluation, and prepare to re-negotiate the plans with the consultancy group. Note: there are two types of clients: the Housing Department (project implementers) and the international donor (foundation).
Groups are given 45 minutes to prepare their cases.
Later the Consultants’ group will meet with Clients’ groups to negotiate their proposed revisions in the plans for this evaluation. 45 minutes will be available for those negotiation sessions.

More holistic approaches to
Impact Evaluation
RealWorld Evaluation
Designing Evaluations under Budget, Time,
Data and Political Constraints

121
Some recent developments in impact evaluation in development
J-PAL is best understood as a network of affiliated researchers … united by their use of the randomized trial methodology…
2003
2008
2006
2009
Impact Evaluation for Improving Development – 3ie and AfrEA conference in Cairo March 2009
2012 Stern, E., N. Stame, J. Mayne, K. Forss, R. Davies and B. Befani. Broadening the Range of Designs and Methods for Impact Evaluations DFID Working Paper 38
Randomized control trials and strong statistical
designs
When might they be appropriate … and when not?
123
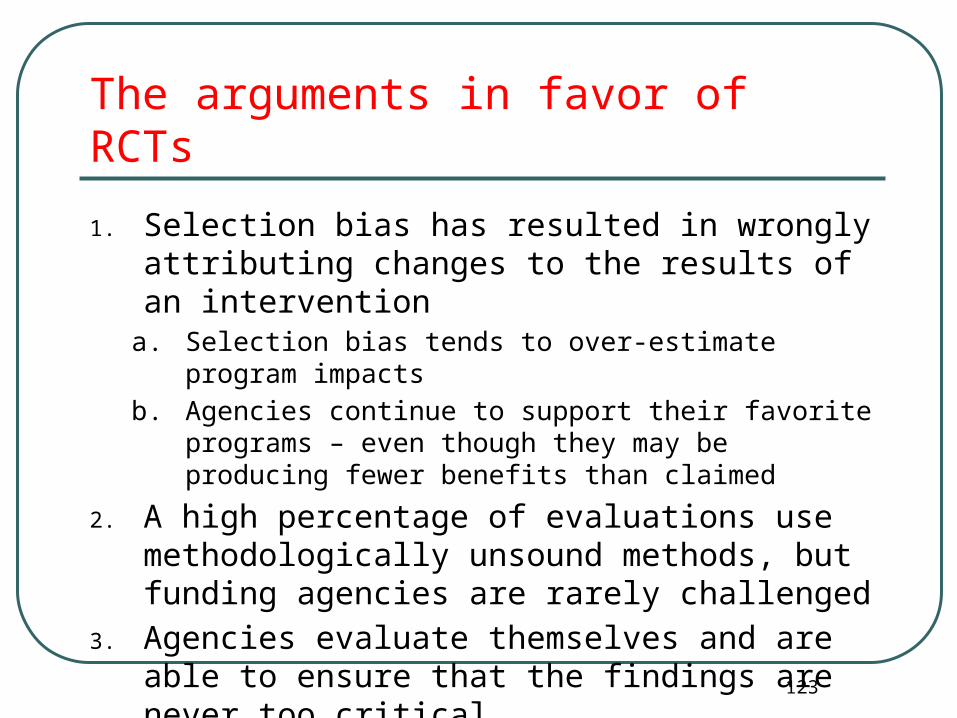
The arguments in favor of RCTs
1. Selection bias has resulted in wrongly attributing changes to the results of an intervention
a. Selection bias tends to over-estimate program impacts
b. Agencies continue to support their favorite programs – even though they may be producing fewer benefits than claimed
2. A high percentage of evaluations use methodologically unsound methods, but funding agencies are rarely challenged
3. Agencies evaluate themselves and are able to ensure that the findings are never too critical.

124
4. Isolating defined treatments and testing them in a systematically controlled way is an effective way to improve our understanding of the potential benefits of this specific intervention.
5. It has proved possible to use RCTs in a very wide range of contexts and sectors and in many cases they have produced useful findings at the operational and policy levels
The arguments in favor of RCTs
125
6. RCTs provide a reference point against which to assess the methodological rigor of other evaluation designs. A good way to keep evaluators honest.
The arguments in favor of RCTs

126
Practical, political and ethical limitations on the use of RCTs
1. It is only possible to use RCTs in a small proportion of evaluations It is often not possible to identify a
comparison group The goal of reaching as many people as
possible does not permit the exclusion of certain people
Programs are often implemented gradually over a period of time and it is not possible to define a specific starting point.

127
2. Opposition to the random assignment of beneficiaries Politicians do not wish to lose their control
over who receives benefits Managers (and others) may wish to target
the poorest or most vulnerable sectors and not to give scarce resources to better-off groups
Communities may not accept this approach
Practical, political and ethical limitations on the use of RCTs

128
3. Ethical considerations
Withholding needed resources from people who need them
Giving benefits to less needy groups while depriving the most needy
Treating people as guinea pigs in a laboratory
Practical, political and ethical limitations on the use of RCTs

129
The ethical arguments are not so clear and one-sided
Using weaker evaluation designs may result in poor programs continuing to be funded – thus depriving people of potentially higher benefits from new programs that could use these funds
Resources are frequently limited so that some allocation criteria is required – what are the alternatives to randomization?
Rigorous evaluations can improve program performance
Practical, political and ethical limitations on the use of RCTs

130
Methodological limitations of RCTs and strong QEDs
1. Can only evaluate a single component (intervention) of a multi-component program
2. Inflexible design – difficult to adjust design to modifications to program design or to changes in the context in which programs are implemented
3. Cannot control what happens during implementation
4. Regression only estimates the average effect size – difficult to generalize the findings to other contexts.

131
5. Simple RCTs to not assess the implementation process and when intended impacts are not found, the analysis cannot distinguish between “design failure” and “implementation failure”
Methodological limitations of RCTs and strong QEDs

132
Implications for RWE
1. RCTs are a potentially useful component of some kinds of evaluation – but should almost never be used in isolation An RCT is strongest when part of a mixed methods
design
2. Define whether a program is intended: as an experiment to rigorously assess promising
new interventions that might be replicated on a large scale OR
To provide services to as many people as possible
133
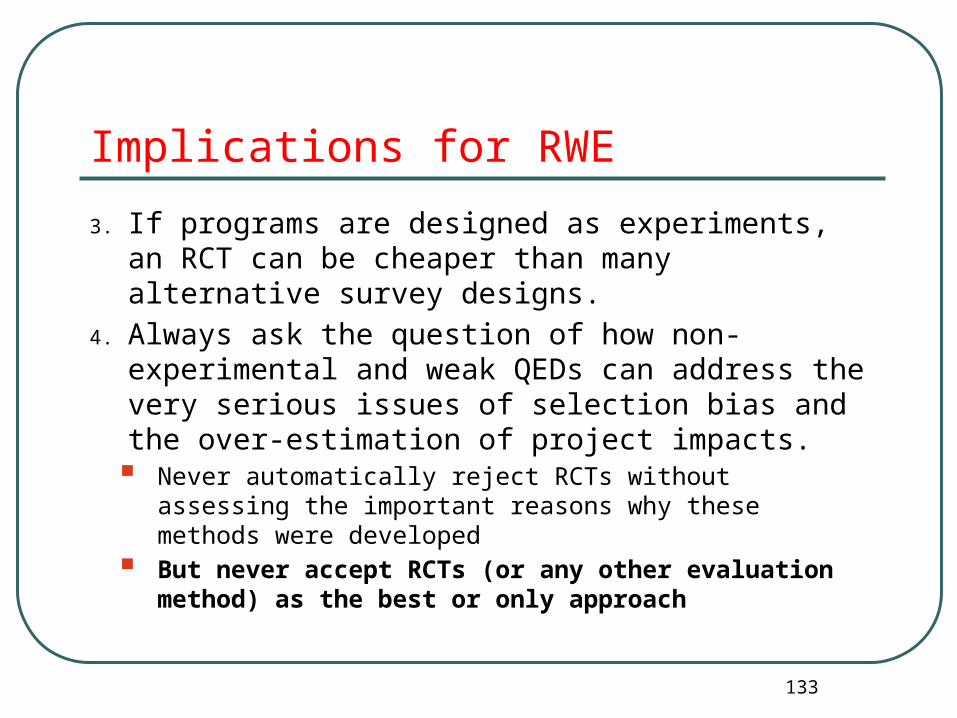
3. If programs are designed as experiments, an RCT can be cheaper than many alternative survey designs.
4. Always ask the question of how non-experimental and weak QEDs can address the very serious issues of selection bias and the over-estimation of project impacts. Never automatically reject RCTs without assessing the
important reasons why these methods were developed But never accept RCTs (or any other evaluation
method) as the best or only approach
Implications for RWE
134
5. The real world is too complex for any single evaluation approach to fully address all of the important questions that must be answered.
Implications for RWE

135
1. Direct cause-effect relationship between one output (or a very limited number of outputs) and an outcome that can be measured by the end of the research project? Pretty clear attribution.
… OR …
2. Changes in higher-level indicators of sustainable improvement in the quality of life of people, e.g. the MDGs (Millennium Development Goals)? More significant but much more difficult to assess direct attribution.
So what should be included in a “rigorous impact evaluation”?
136
OECD-DAC (2002: 24) defines impact as “the positive and negative, primary and secondary long-term effects produced by a development intervention, directly or indirectly, intended or unintended. These effects can be economic, sociocultural, institutional, environmental, technological or of other types”.
Does it mention or imply direct attribution? Or point to the need for counterfactuals or Randomized Control Trials (RCTs)?
So what should be included in a “rigorous impact evaluation”?

Different lenses needed for different situations in the RealWorld
Simple Complicated ComplexFollowing a recipe Sending a rocket to the
moonRaising a child
Recipes are tested to assure easy replication
Sending one rocket to the moon increases assurance that the next will also be a success
Raising one child provides experience but is no guarantee of success with the next
The best recipes give good results every time
There is a high degree of certainty of outcome
Uncertainty of outcome remains
Sources: Westley et al (2006) and Stacey (2007), cited in Patton 2008; also presented by Patricia Rodgers at Cairo impact conference 2009.
137

138
Examples of cause-effect correlations that are generally accepted
• Vaccinating young children with a standard set of vaccinations at prescribed ages leads to reduction of childhood diseases (means of verification involves viewing children’s health charts, not just total quantity of vaccines delivered to clinic)
• Other examples … ?
139
But look at examples of what kinds of interventions have been “rigorously tested” using RCTs
• Conditional cash transfers• The use of visual aids in Kenyan schools• Deworming children (as if that’s all that’s needed
to enable them to get a good education)
• Note that this kind of research is based on the quest for Silver Bullets – simple, most cost-effective solutions to complex problems.

Quoted by Patricia Rogers, RMIT University 140
“Far better an approximate answer to the right question, which is often vague, than an exact answer to the wrong question, which can always be made precise.“
J. W. Tukey (1962, page 13), "The future of data analysis". Annals of Mathematical Statistics 33(1), pp. 1-67.
141
Is that what we call “scientific method”?
There is much more to impact, to rigor, and to “the scientific method” than RCTs. Serious impact evaluations require a more holistic approach.

DESIRED IMPACT
OUTCOME 2
OUTCOME 1
OUTCOME 3
OUTPUT 2.2 OUTPUT 2.3OUTPUT 2.1
Intervention 2.2.1
Intervention 2.2.2
Intervention 2.2.3
Consequences Consequences Consequences
A Simple RCT
A more comprehensive design

143
The limited use of strong evaluation designs
In the RealWorld (at least of international development programs) we estimate that:
• fewer than 5%-10% of project impact evaluations use a strong experimental or even quasi-experimental designs
• significantly less than 5% of impact evaluations use randomized control trials (‘pure’ experimental design)

What kinds of evaluation designs are actually used in the real world of international development? Findings from meta-evaluations of 336 evaluation reports of an INGO.
Post-test only 59%
Before-and-after 25%
With-and-without 15%
Other counterfactual
1%
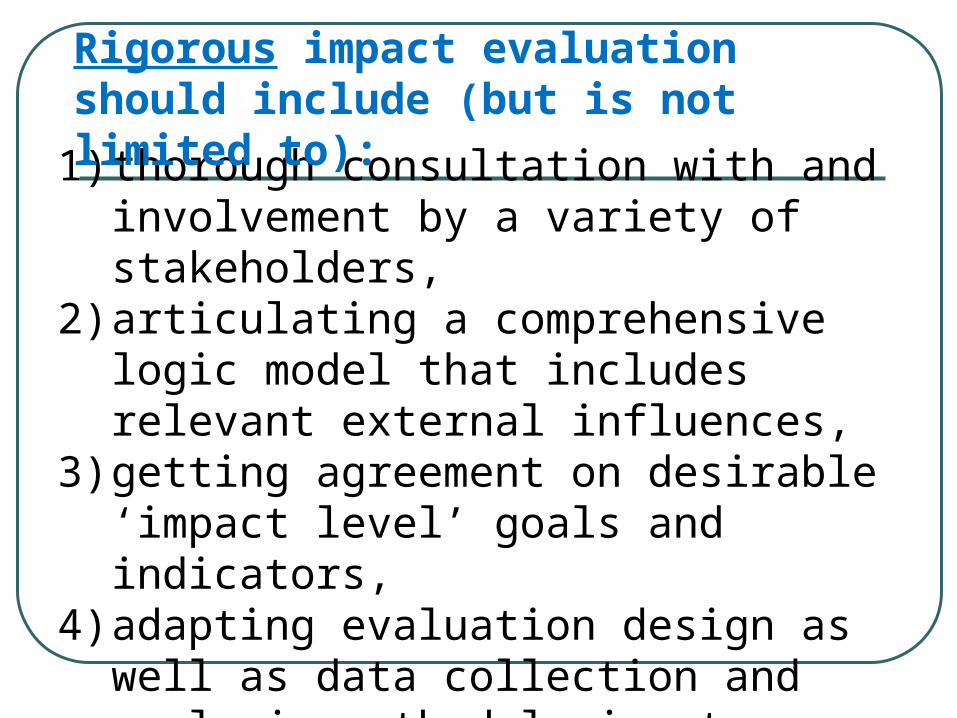
1) thorough consultation with and involvement by a variety of stakeholders,
2) articulating a comprehensive logic model that includes relevant external influences,
3) getting agreement on desirable ‘impact level’ goals and indicators,
4) adapting evaluation design as well as data collection and analysis methodologies to respond to the questions being asked, …
Rigorous impact evaluation should include (but is not limited to):

5) adequately monitoring and documenting the process throughout the life of the program being evaluated, 6) using an appropriate combination of methods to triangulate evidence being collected, 7) being sufficiently flexible to account for evolving contexts, …
Rigorous impact evaluation should include (but is not limited to):

8) using a variety of ways to determine the counterfactual, 9) estimating the potential sustainability of whatever changes have been observed, 10) communicating the findings to different audiences in useful ways, 11) etc. …
Rigorous impact evaluation should include (but is not limited to):
The point is that the list of what’s required for ‘rigorous’ impact evaluation goes way beyond initial randomization into treatment and ‘control’ groups.

We must be careful that in using the “Gold Standard”
we do not violate the “Golden Rule”:“Judge not that you not be judged!”
In other words:“Evaluate others as you would have
them evaluate you.”

Caution: Too often what is called Impact Evaluation is based on a “we will examine and judge you” paradigm. When we want our own programs evaluated we prefer a more holistic approach.

How much more helpful it is when the approach to evaluation is more like holding up a mirror to help people reflect on their own reality: facilitated self-evaluation.
The bottom line is defined by this question:
Are our programs making plausible contributions towards positive impact on the quality of life of our intended beneficiaries? Let’s not forget them!
153
Thank you!
153
154ANY QUESTIONS? 154

Time for consultancy teams to meet with
clients to negotiate the revised ToRs for the
evaluation of the housing project.
155
Time to negotiate!

What did you learn about RealWorld Evaluation by getting involved in that
case study and role-playing exercise?
156
Review

157
Next steps: What are some of the practical realities of applying RWE approaches in our
own work?

158
Main workshop messages
1. Evaluators must be prepared for RealWorld evaluation challenges.
2. There is considerable experience to learn from.
3. A toolkit of practical “RealWorld” evaluation techniques is available (see www.RealWorldEvaluation.org).
4. Never use time and budget constraints as an excuse for sloppy evaluation methodology.
5. A “threats to validity” checklist helps keep you honest by identifying potential weaknesses in your evaluation design and analysis.
6. The evaluation report should disclose what constraints were faced and what was done to address them.

Additional References for IE DFID “Broadening the range of designs and methods for impact evaluations”
http://www.oecd.org/dataoecd/0/16/50399683.pdf Robert Picciotto “Experimententalism and development evaluation: Will the
bubble burst?” in Evaluation journal (EES) April 2012: http://evi.sagepub.com/ Martin Ravallion “Should the Randomistas Rule?” (Economists’ Voice 2009)
http://ideas.repec.org/a/bpj/evoice/v6y2009i2n6.html William Easterly “Measuring How and Why Aid Works—or Doesn't”
http://aidwatchers.com/2011/05/controlled-experiments-and-uncontrollable-humans/
Control freaks: Are “randomised evaluations” a better way of doing aid and development policy? The Economist June 12, 2008 http://www.economist.com/node/11535592
Series of guidance notes (and webinars) on impact evaluation produced by InterAction (consortium of US-based INGOs):
http://www.interaction.org/impact-evaluation-notes Evaluation (EES journal) Special Issue on Contribution Analysis, Vol. 18, No.
3, July 2012. www.evi.sagepub.com Impact Evaluation In Practice www.worldbank.org/ieinpractice
159
Unanticipated consequences of development interventions:
a blind spot for evaluation theory and practice
[and if time permits]
A few thoughts on evaluating complex development interventions
Michael Bamberger
EXTRA
BONUS
SECTION

161
1. Development programs almost never work out as planned
The outcomes of most programs are unpredictable• Programs propose simple, linear solutions to complex
problems • Even when programs go smoothly and are implemented
as planned – human behavior is difficult to predict Programs operate in complex systems with
constantly changing economic, political, security, natural environmental and socio-cultural environments
Program planners have much less control than they often think

162
The scope of unanticipated outcomes increases as we move from programs to complex development interventions - • such as Country Programs or multi-donor
collaborative initiatives

163
2. So why are evaluators still surprised when programs have unanticipated outcomes?
Unanticipated outcomes still catch planners and evaluators off-guard even though experience has shown that very few programs work out exactly as planned
Many unanticipated outcomes, including serious negative consequences, are not even detected by many evaluations

164
Some serious negative outcomes not captured by the evaluation
A food-for-work program in Central America:• Many women were forbidden by their husbands from participating
in the project• Some women were seriously beaten by their husbands for
attending meetings A slum upgrading project in South East Asia:
• Prior to the official start of the project many slum dwellers were forced (sometimes at gunpoint) to sell their houses at a very low price to people with political contacts
A road construction project in East Africa:• Prior to the first supervision mission for a road construction project
the government destroyed a number of houses to avoid paying compensation to the families as specified in the loan agreement
165
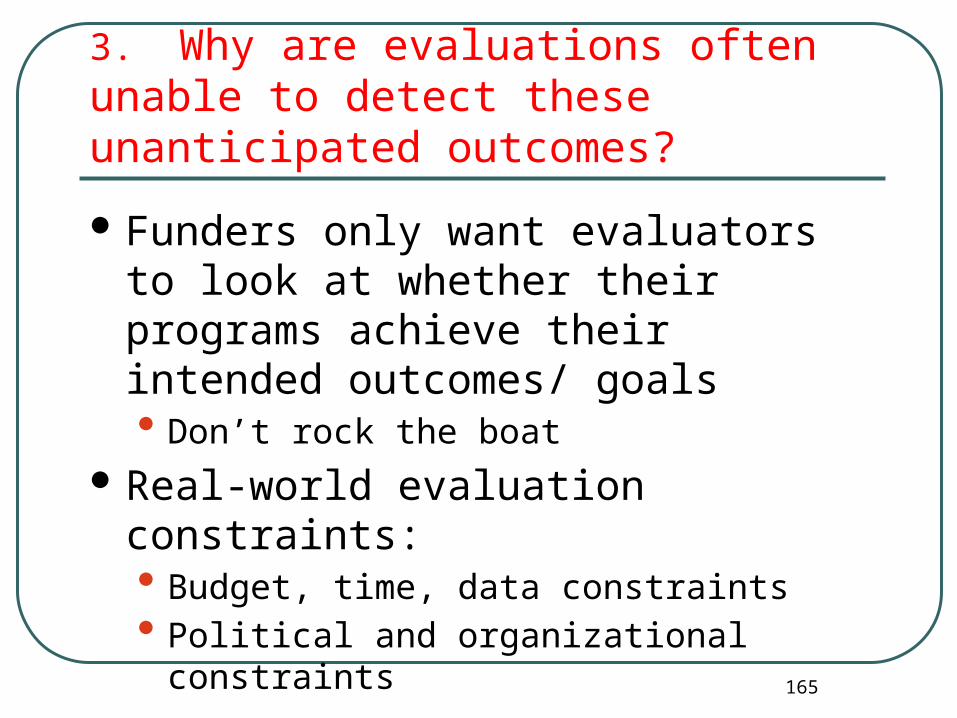
3. Why are evaluations often unable to detect these unanticipated outcomes?
Funders only want evaluators to look at whether their programs achieve their intended outcomes/ goals• Don’t rock the boat
Real-world evaluation constraints:• Budget, time, data constraints• Political and organizational constraints
166
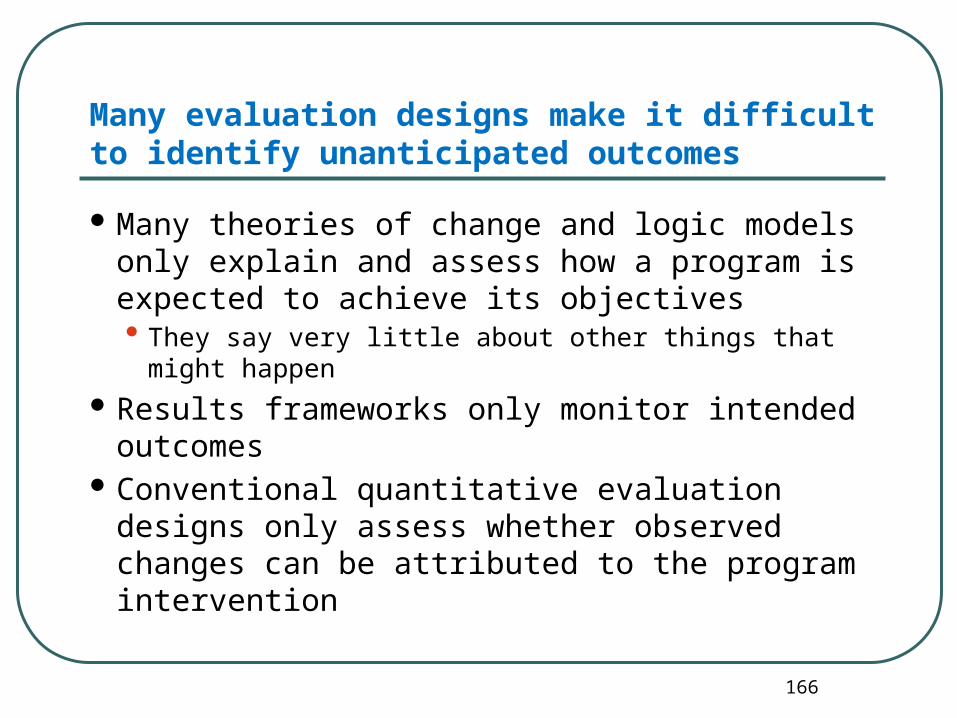
Many evaluation designs make it difficult to identify unanticipated outcomes
Many theories of change and logic models only explain and assess how a program is expected to achieve its objectives• They say very little about other things that might
happen Results frameworks only monitor intended
outcomes Conventional quantitative evaluation designs only
assess whether observed changes can be attributed to the program intervention

167
Structured surveys collect information relevant to program objectives but rarely provide an opportunity for respondents to talk about other things on their mind
Difficult to find/interview vulnerable groups and those who do not benefit
Focus groups often only cover people involved in the project
Many evaluation designs make it difficult to identify unanticipated outcomes, cont.

168
Many development evaluations focus too much on the internal concerns and procedures of their own agency• And do not focus sufficiently on the national
development context and the concerns of national stakeholders.

169
Many unanticipated events occur outside the vision field of the evaluation
Key events occur before the evaluation begins (e.g. people are forced to sell land or houses at bargain prices)
Events occur when the evaluator is not there (at night, during the rainy season, in the privacy of the household)
Critical events occur after the evaluation has ended Many quantitative evaluations have no contact with
the program between the two applications of the survey instruments (pre-test and post-test)

170
Evaluators often ignore context Budget constraints mean that the
poorest and most vulnerable groups who live far from the village center, often cannot be interviewed
Many unanticipated events occur outside the vision field of the evaluation, cont.
171
4. Why should we worry?
Unanticipated events:• Seriously reduce the efficiency and
effectiveness of programs• Important lessons are not learned• The vulnerable and voiceless tend to be the
most affected• Some groups or communities can be
significantly worse off as a result of development interventions
172
5. What can be done?
This section draws on and expands the framework presented in:
Jonathan Morell “Evaluation in the Face of Uncertainty: Anticipating Surprise and Responding to the Inevitable”
Guilford 2010
173
What can be done? Understanding the nature of the unexpected
Types of surprise• Surprises we anticipate and address • Surprises that could be planned for and detected• Surprises that cannot be anticipated
The probability and magnitude of surprise is related to:• The level of innovation in the program [uncharted territory]• The nature of the intervention• Fidelity to the design protocol• Robustness of the program in different settings• Level of understanding of the program context• Time between the intervention and the estimation of outcomes

174
What can be done?Ways to foresee and address unanticipated outcomes
Use of theory-based evaluation• With focus on mechanisms, linkages and testing
assumptions Systematic use of past experience
• Participatory consultations with affected populations Break the evaluation down into shorter
segments Adapt forecasting methods used by planners Broader definition of the role of monitoring

175
What can be done?Agile evaluation
Always have a “Plan B” [see next slide] Flexibility in terms of data collection Flexible designs that can be rapidly adapted to
changing circumstances Dynamic monitoring Unpacking the program into separate, but closely
linked, components• Each of which is easier to evaluate
Constant review of the program theory and the underlying assumptions
176
“Plan B” Planning for the unexpected
What to do when: the program begins before the baseline
study has been conducted? the comparison groups vanish? the program is restructured? Essential data is not available?
• It may be intentionally withheld
177
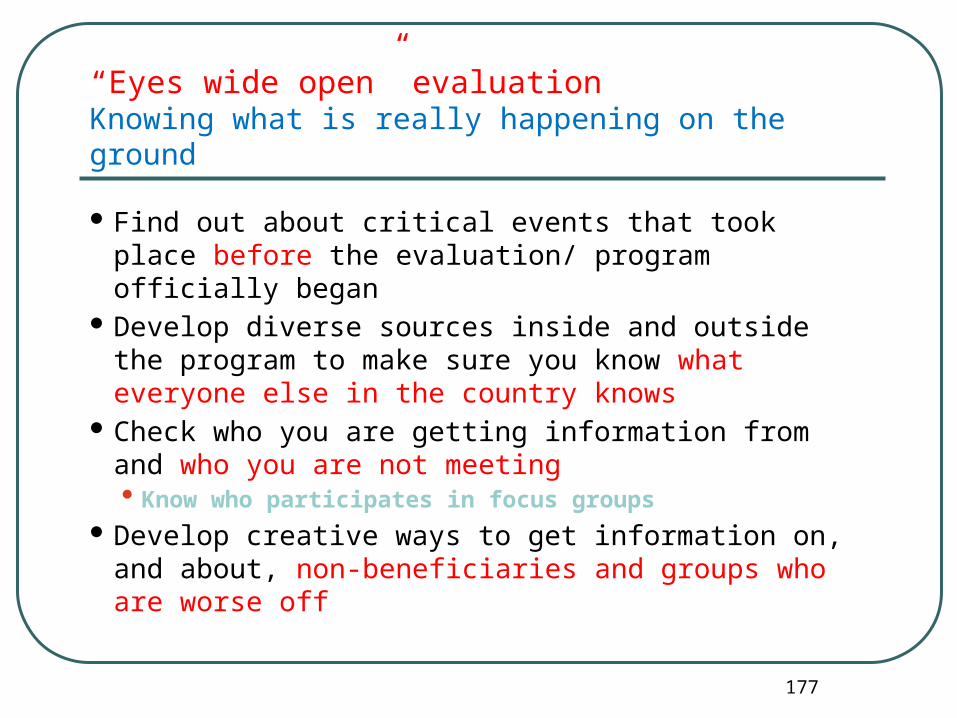
“Eyes wide open” evaluationKnowing what is really happening on the ground
Find out about critical events that took place before the evaluation/ program officially began
Develop diverse sources inside and outside the program to make sure you know what everyone else in the country knows
Check who you are getting information from and who you are not meeting• Know who participates in focus groups
Develop creative ways to get information on, and about, non-beneficiaries and groups who are worse off

178
A few thoughts on the evaluation of complex programs
The dimensions of complexity1. Scope and scale2. Organizational complexity3. Contextual factors4. Behavioral5. Challenges assessing
• Attribution• Contribution• Substitution
6. Some interventions are less complex than claimed

179
1. Scope and scale
a. Number of components and service levels
b. Number and types of geographic areas
c. Larger programs tend to have more features and to be implemented differently in different regions

180
2. Organizational complexity
a. Programs co-funded by different agencies tend to be more complex
• Different implementation strategies and management procedures• Different components/services• Coordination problems
b. Programs with several coordinating and implementing agencies
c. National and regional level programs have more levels of coordination
d. National agencies may lack implementation capacity

181
3. Contextual factors affecting complexity
a. Economic setting
b. Political context
c. Administrative and organizational
d. Climatic and ecological
e. Legal and regulatory
f. Historical
g. Socio-cultural
182
4. Behavioral
a. “Simple” projects may involve complex processes of behavioral change
b. Understanding group behavior
c. Social networks and social communication
183
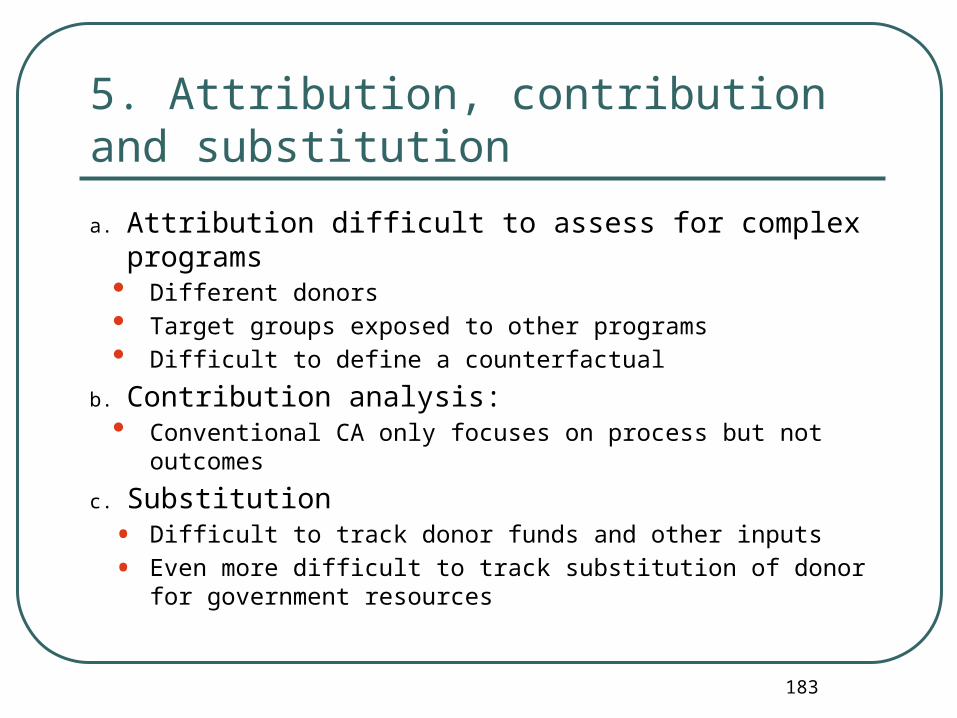
5. Attribution, contribution and substitution
a. Attribution difficult to assess for complex programs• Different donors• Target groups exposed to other programs• Difficult to define a counterfactual
b. Contribution analysis:• Conventional CA only focuses on process but not
outcomes
c. Substitution• Difficult to track donor funds and other inputs
• Even more difficult to track substitution of donor for government resources

184
6. Interventions that look “complex” may not be
a. “complex” interventions may comprise a number of “simple” components
• Coordination and management may be the only “complex” dimensions
b. Some agencies may find it convenient to claim their programs are too complex to be rigorously evaluated – to avoid critical scrutiny.
185
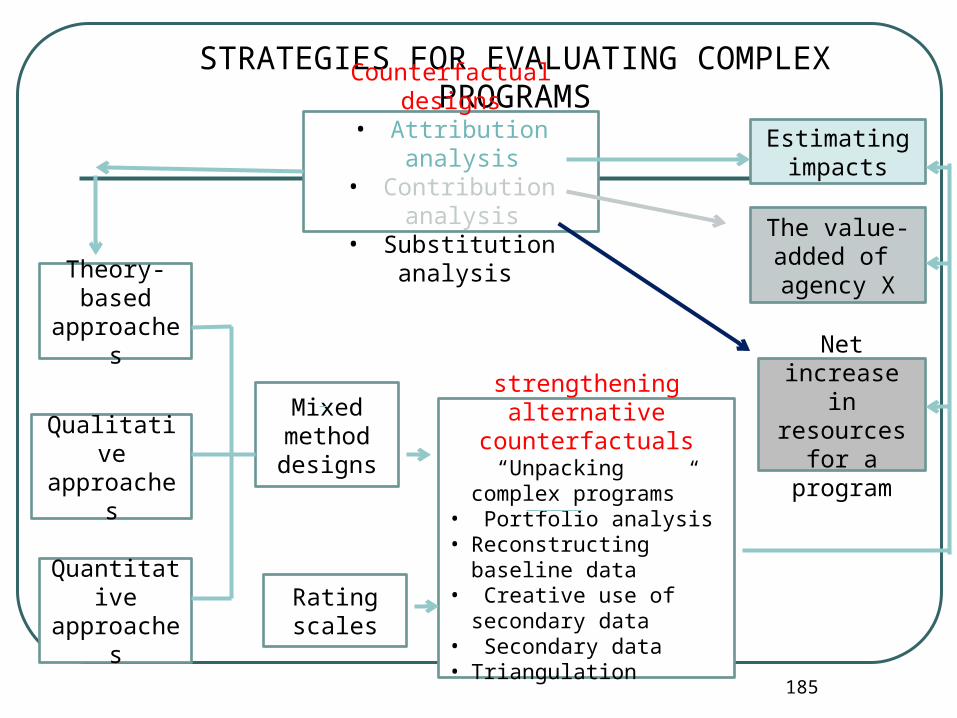
Theory-based
approaches
strengthening alternative counterfactuals
• “Unpacking complex programs”
• Portfolio analysis• Reconstructing baseline
data• Creative use of secondary
data• Secondary data• Triangulation
Qualitative approaches
Quantitative approaches
STRATEGIES FOR EVALUATING COMPLEX PROGRAMS
Rating scales
Counterfactual designs• Attribution analysis
• Contribution analysis• Substitution analysis
Mixed method designs
Estimating impacts
The value-added of agency X
Net increase in resources
for a program