1 project management: a managerial approach chapter 8 – scheduling
TRANSCRIPT

11
Project Management: Project Management: A Managerial A Managerial
ApproachApproach
Chapter 8 – SchedulingChapter 8 – Scheduling

22
OverviewOverview
• WBS to Schedule ProcessWBS to Schedule Process
• PERTPERT
• Schedule TypesSchedule Types
• CPMCPM
33
SchedulingScheduling• A schedule is the conversion of a A schedule is the conversion of a
project action plan into an project action plan into an operating timetableoperating timetable
• It serves as the basis for monitoring It serves as the basis for monitoring and controlling project activityand controlling project activity
• Taken together with the plan and Taken together with the plan and budget, it is probably the major tool budget, it is probably the major tool for the management of projectsfor the management of projects
99
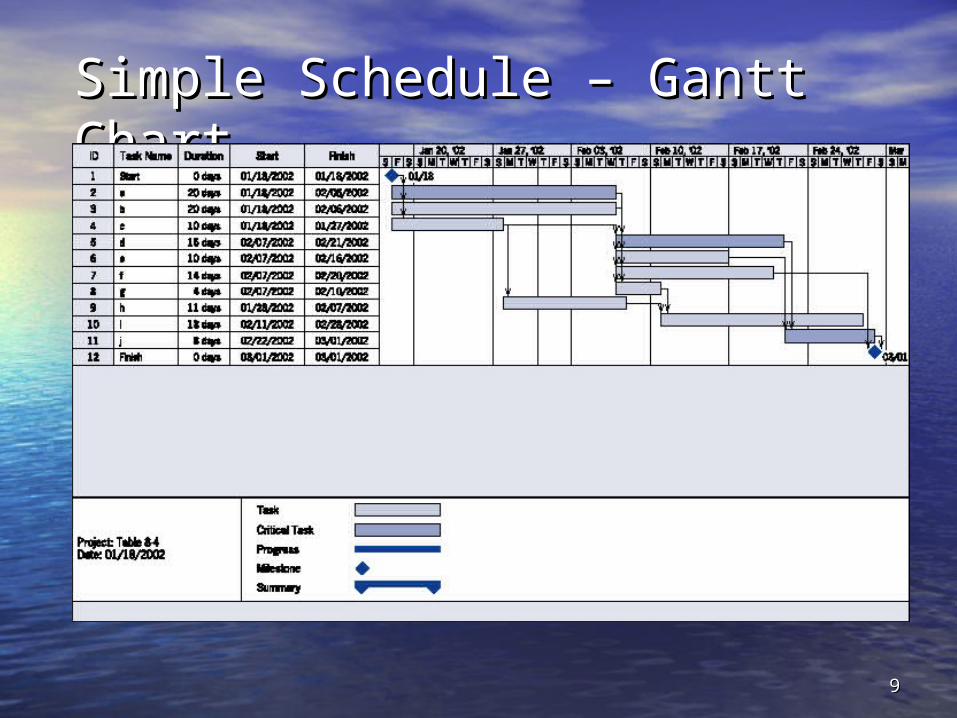
Simple Schedule – Gantt Simple Schedule – Gantt ChartChart

1010
Network Techniques: PERT and Network Techniques: PERT and CPMCPM
• With the exception of Gantt charts, the With the exception of Gantt charts, the most common approach to scheduling is most common approach to scheduling is the use of network techniques such as the use of network techniques such as PERT and CPMPERT and CPM
• The Program Evaluation and Review The Program Evaluation and Review Technique (PERT) was developed by the Technique (PERT) was developed by the U.S. Navy in 1958U.S. Navy in 1958
• The Critical Path Method (CPM) was The Critical Path Method (CPM) was developed by DuPont, Inc during the developed by DuPont, Inc during the same time periodsame time period
1212
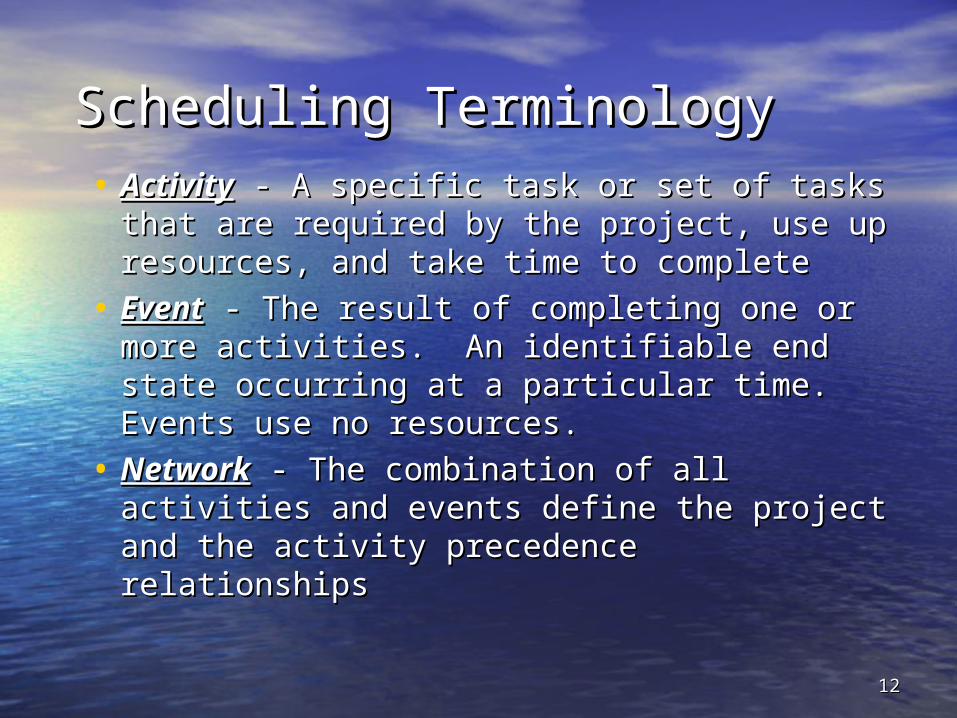
Scheduling TerminologyScheduling Terminology• ActivityActivity - A specific task or set of tasks - A specific task or set of tasks
that are required by the project, use up that are required by the project, use up resources, and take time to completeresources, and take time to complete
• EventEvent - The result of completing one or - The result of completing one or more activities. An identifiable end state more activities. An identifiable end state occurring at a particular time. Events occurring at a particular time. Events use no resources.use no resources.
• NetworkNetwork - The combination of all - The combination of all activities and events define the project activities and events define the project and the activity precedence relationshipsand the activity precedence relationships

1313
Scheduling TerminologyScheduling Terminology
• PathPath - The series of connected - The series of connected activities (or intermediate events) activities (or intermediate events) between any two events in a networkbetween any two events in a network
• Critical Critical - Activities, events, or paths - Activities, events, or paths which, if delayed, will delay the which, if delayed, will delay the completion of the project. A project’s completion of the project. A project’s critical path is understood to mean critical path is understood to mean that sequence of critical activities that that sequence of critical activities that connect the project’s start event to its connect the project’s start event to its finish eventfinish event

1414
Scheduling TerminologyScheduling Terminology
• An activity can be in any of these An activity can be in any of these conditions:conditions:– It may have a successor(s) but no It may have a successor(s) but no
predecessor(s) - starts a networkpredecessor(s) - starts a network– It may have a predecessor(s) but no It may have a predecessor(s) but no
successor(s) - ends a networksuccessor(s) - ends a network– It may have both predecessor(s) and It may have both predecessor(s) and
successor(s) - in the middle of a networksuccessor(s) - in the middle of a network
• Interconnections from horizontal links Interconnections from horizontal links in vertical WBSin vertical WBS

1515
Hypothetical NetworkHypothetical Network
2 5 61
4
3
5
16
620
13
30
TE=64
Calculate t(e) and Z for this network……

1616
Activity and Project Frequency Activity and Project Frequency DistributionsDistributions
ACTIVITY PROJECT
a m b TE
(A) (B)

1717
PERT Activity CalculationPERT Activity Calculation
t(e) = a + 4m + b a = Most Optimistic (MO)
6 m = Most Likely (ML)
b = Most Pessimistic (MP)
t(e) = Activity Duration
When a single estimate for activity time is not sufficient!

1818
PERT Schedule ProbabilityPERT Schedule Probability
Z is derived from a table of predetermined probabilities
Z = T(S) – T(E) Z = Probability of √SD(T[E])2 Meeting Schedule
Z = T(S) – T(E) T(S) = Scheduled Duration √ΣVar(T[E])
T(E) = Critical Path Duration

1919
PERT Activity Times & VariancesPERT Activity Times & Variances
ActivityActivity aa mm bb t(e)t(e)
1-21-2 1717 2929 4747 3030
2-32-3 66 1212 2424 1313
2-42-4 1616 1919 2828 2020
3-53-5 1313 1616 1919 1616
4-54-5 22 55 1414 66
5-65-6 22 55 88 55

2020
Variance of Activity Variance of Activity EstimatesEstimatesActivitActivit
yyaa mm bb t(e)t(e) [(b-a)/6][(b-a)/6]22
VarVar
1-21-2 1717 2929 4747 3030 2525
2-32-3 66 1212 2424 1313 99
2-42-4 1616 1919 2828 2020 44
3-53-5 1313 1616 1919 1616 11
4-54-5 22 55 1414 66 44
5-65-6 22 55 88 55 11

2121
Critical PathCritical Path
620
13
5
16
3062
3
4
51
TE = 30 + 13 + 16 + 5 = 64
Var(TE) = 25 + 9 + 1 + 1 = 36

2222
Possible Project DurationsPossible Project Durations
TE=64
TS=67
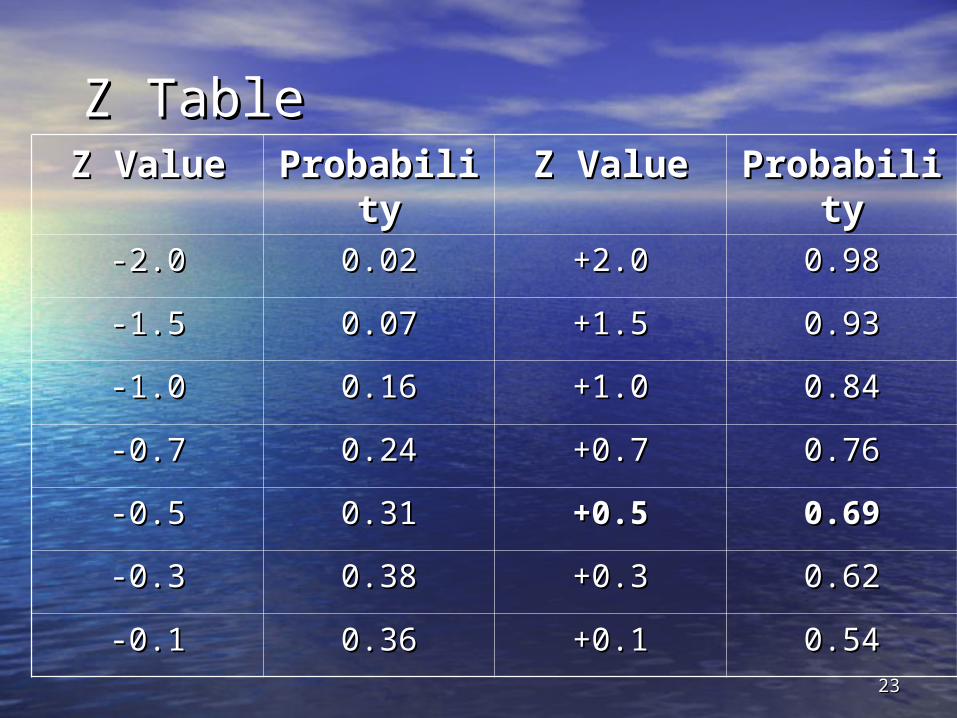
Z = (67 – 64) / √(25 + 9 + 1 + 1) = 0.5
Hence, the probability of meeting the target schedule (Ts) is 0.69 (69%)
2323
Z TableZ TableZ ValueZ Value ProbabilitProbabilit
yyZ ValueZ Value ProbabilitProbabilit
yy-2.0-2.0 0.020.02 +2.0+2.0 0.980.98
-1.5-1.5 0.070.07 +1.5+1.5 0.930.93
-1.0-1.0 0.160.16 +1.0+1.0 0.840.84
-0.7-0.7 0.240.24 +0.7+0.7 0.760.76
-0.5-0.5 0.310.31 +0.5+0.5 0.690.69
-0.3-0.3 0.380.38 +0.3+0.3 0.620.62
-0.1-0.1 0.360.36 +0.1+0.1 0.540.54
2525
Gantt ChartsGantt Charts
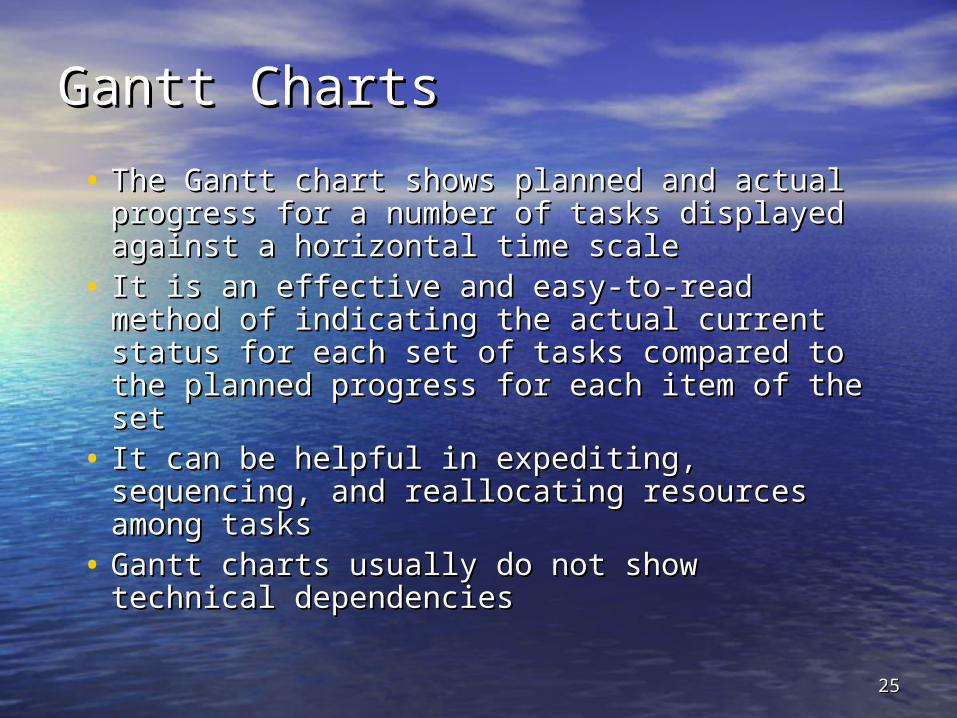
• The Gantt chart shows planned and actual The Gantt chart shows planned and actual progress for a number of tasks displayed progress for a number of tasks displayed against a horizontal time scaleagainst a horizontal time scale
• It is an effective and easy-to-read method It is an effective and easy-to-read method of indicating the actual current status for of indicating the actual current status for each set of tasks compared to the planned each set of tasks compared to the planned progress for each item of the setprogress for each item of the set
• It can be helpful in expediting, sequencing, It can be helpful in expediting, sequencing, and reallocating resources among tasksand reallocating resources among tasks
• Gantt charts usually do not show technical Gantt charts usually do not show technical dependenciesdependencies

2727
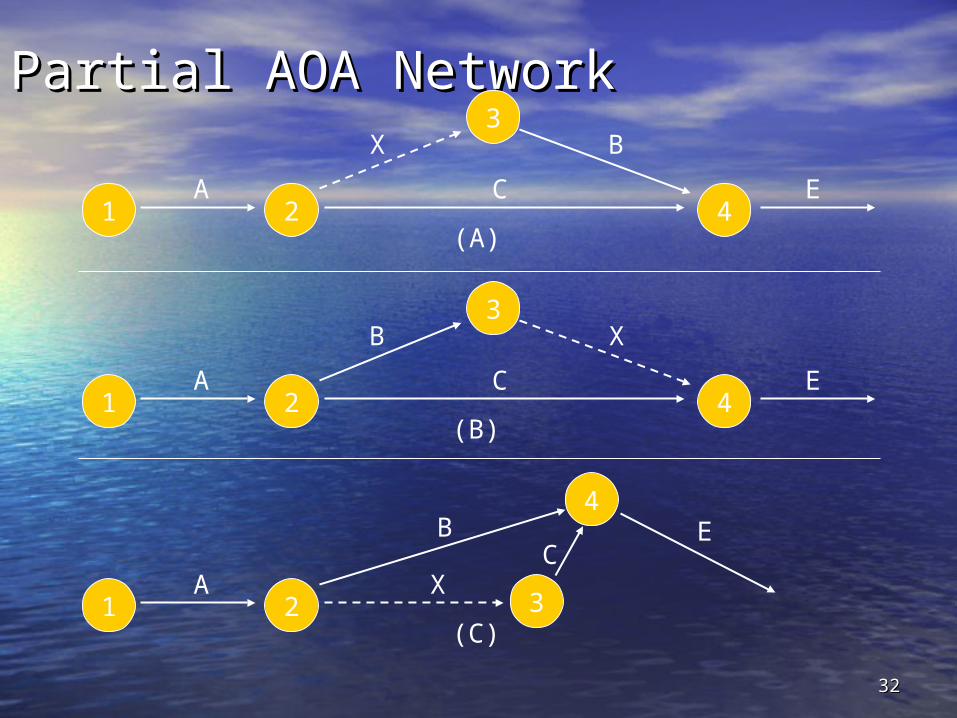
Drawing NetworksDrawing Networks
• Activity-on-Arrow (AOA) networks use Activity-on-Arrow (AOA) networks use arrows to represent activities while nodes arrows to represent activities while nodes stand for eventsstand for events
• Activity-on-Node (AON) networks use nodes Activity-on-Node (AON) networks use nodes to represent activities with arrows to show to represent activities with arrows to show precedence relationshipsprecedence relationships
• The choice between AOA and AON The choice between AOA and AON representation is largely a matter of representation is largely a matter of personal preferencepersonal preference

2929
Hypothetical NetworkHypothetical Network
2 5 61
4
3

3030
AOA Network Building BlocksAOA Network Building Blocks
8079Install software
EventActivity

3131
Partial Koll Business Center - Partial Koll Business Center - AOAAOA
4
5
1 32AApplication
approval
DService
availabilitycheck
CTrafficstudy
BConstruction
plans
3232
Partial AOA NetworkPartial AOA Network
2
3
1 4A
X
C
B
E
(A)
2
3
1 4A
B
C
X
E
(B)
2 31
4
A
B
XC
E
(C)

3333
Partial AOA NetworkPartial AOA Network
2 31
4
A
B
CX
E
(D) 5D
2 31
4
A
B
CX
E
(E)
5
D
F?

3434
Full AOA NetworkFull AOA Network
KOLL BUSINESS CENTERCounty Engineers Design Department
2 31
4
A5
B
C10
X
5
150
6 7 8
0Y
F10
G170
H35
E15
D5
ActivityDuration
Legend

3535
Activity-on-Node Network Activity-on-Node Network FundamentalsFundamentals
X
Y
Z
Y and Z are preceded by X
Y and Z can begin at thesame time, if you wish
(B)
A B C
A is preceded by nothingB is preceded by AC is preceded by B
(A)
J
K
L
M
J, K, & L can all begin atthe same time, if you wish(they need not occursimultaneously)
All (J, K, L) must becompleted before M canbegin
but
X Z
AAY
(C)
(D)
Z is preceded by X and Y
AA is preceded by X and Y