1 problems at the biogas plant henrik bangsø nielsen biogasforum, seminar, 29/11-2005
Post on 20-Dec-2015
216 views
TRANSCRIPT
1
Problems at the biogas plant
Henrik Bangsø NielsenBiogasforum, seminar, 29/11-2005
2
Strategy and objectives
Data obtained from Danish biogas plants
On going experiments
Future experiments
Comments from the audience
Outline
3
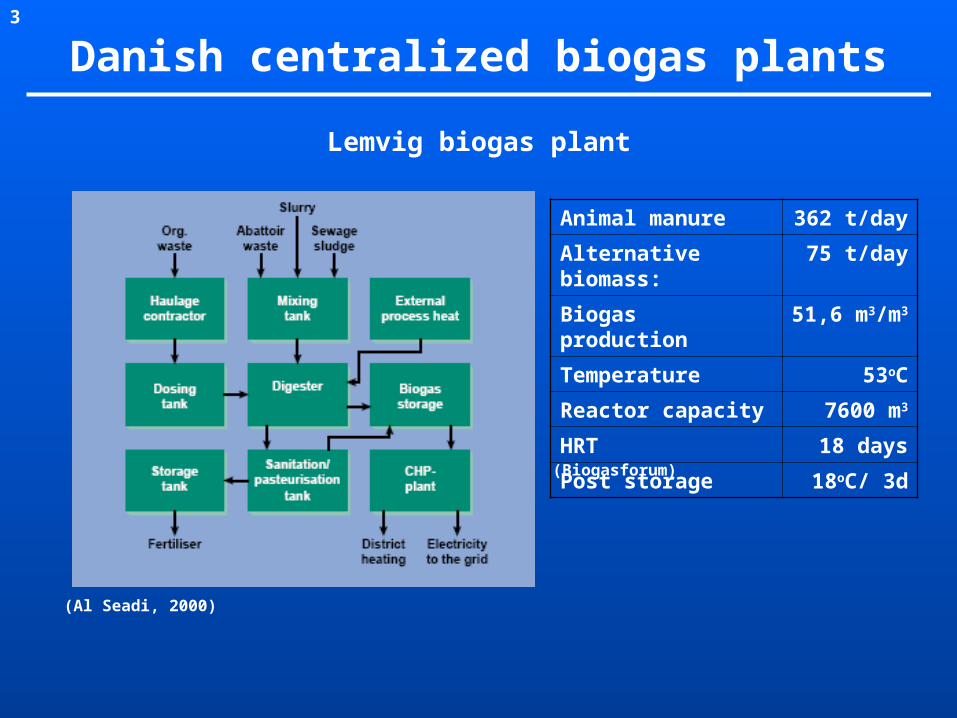
Danish centralized biogas plants
Lemvig biogas plant
Animal manure 362 t/day
Alternative biomass: 75 t/day
Biogas production 51,6 m3/m3
Temperature 53oC
Reactor capacity 7600 m3
HRT 18 days
Post storage 18oC/ 3d
(Al Seadi, 2000)
(Biogasforum)
4
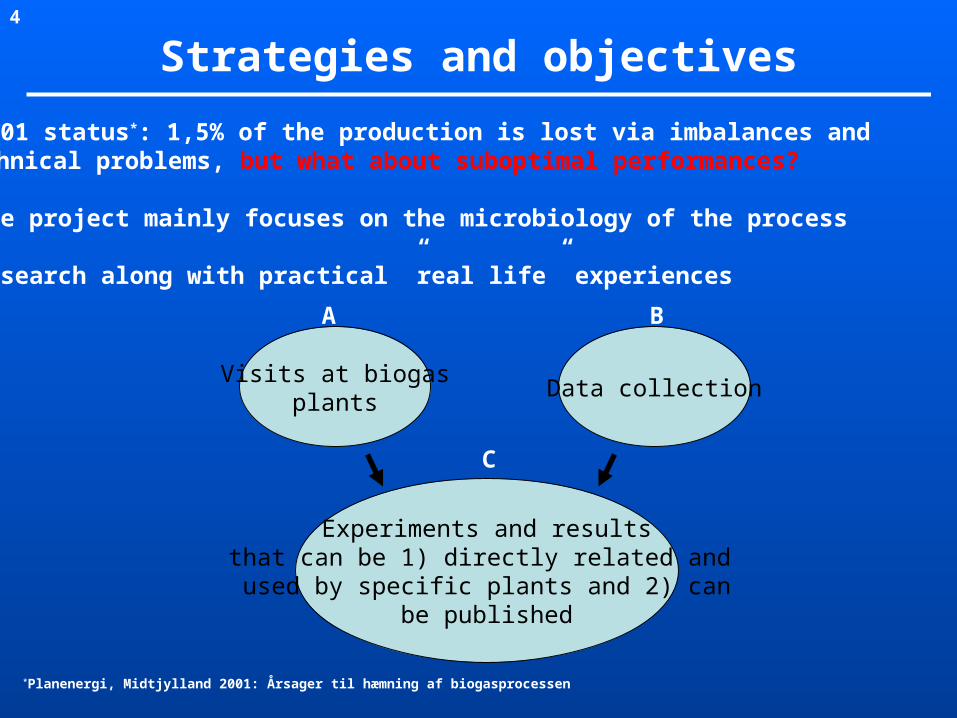
Strategies and objectives
2001 status*: 1,5% of the production is lost via imbalances andtechnical problems, but what about suboptimal performances?
The project mainly focuses on the microbiology of the process
Research along with practical ”real life” experiences
*Planenergi, Midtjylland 2001: Årsager til hæmning af biogasprocessen
Visits at biogasplants
Data collection
Experiments and resultsthat can be 1) directly related and used by specific plants and 2) can
be published
A B
C
5
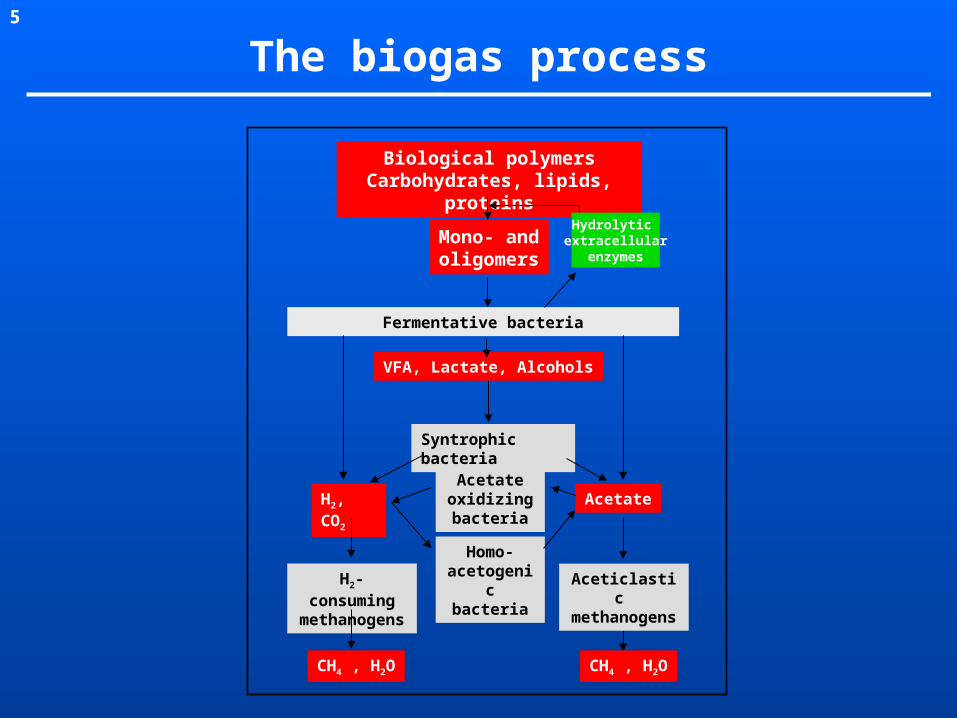
H2, CO2 Acetate
VFA, Lactate, Alcohols
Biological polymersCarbohydrates, lipids, proteins
Mono- andoligomers
CH4 , H2O CH4 , H2O
Fermentative bacteria
Syntrophic bacteria
H2-consumingmethanogens
Aceticlastic methanogens
Hydrolytic extracellular
enzymes
Acetate oxidizingbacteria
Homo-acetogenicbacteria
The biogas process
6
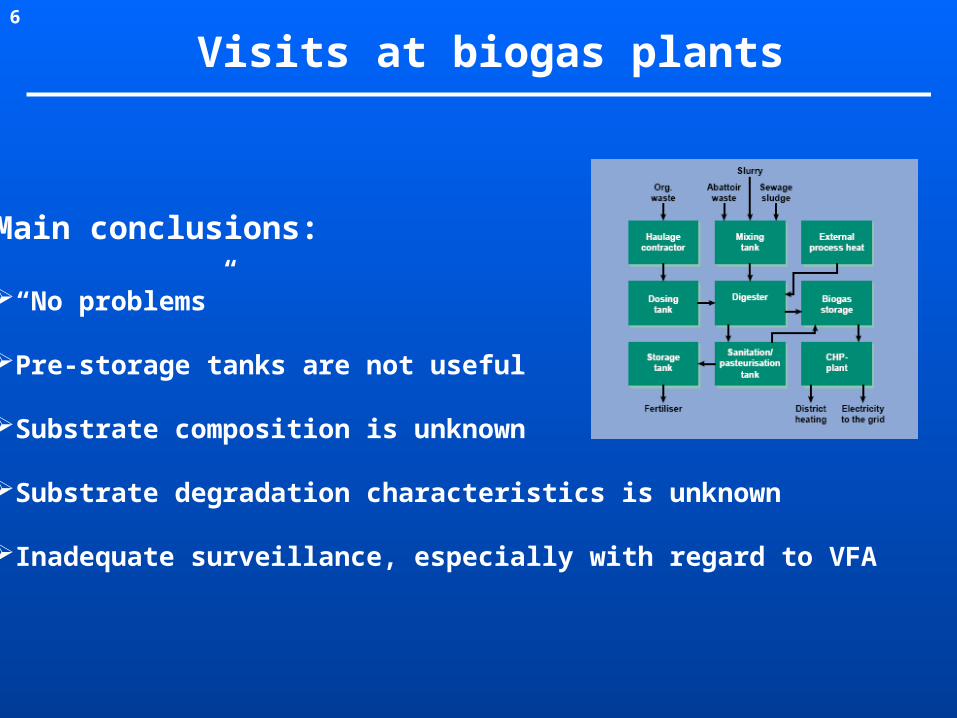
Visits at biogas plants
Main conclusions:
“No problems”
Pre-storage tanks are not useful
Substrate composition is unknown
Substrate degradation characteristics is unknown
Inadequate surveillance, especially with regard to VFA
7
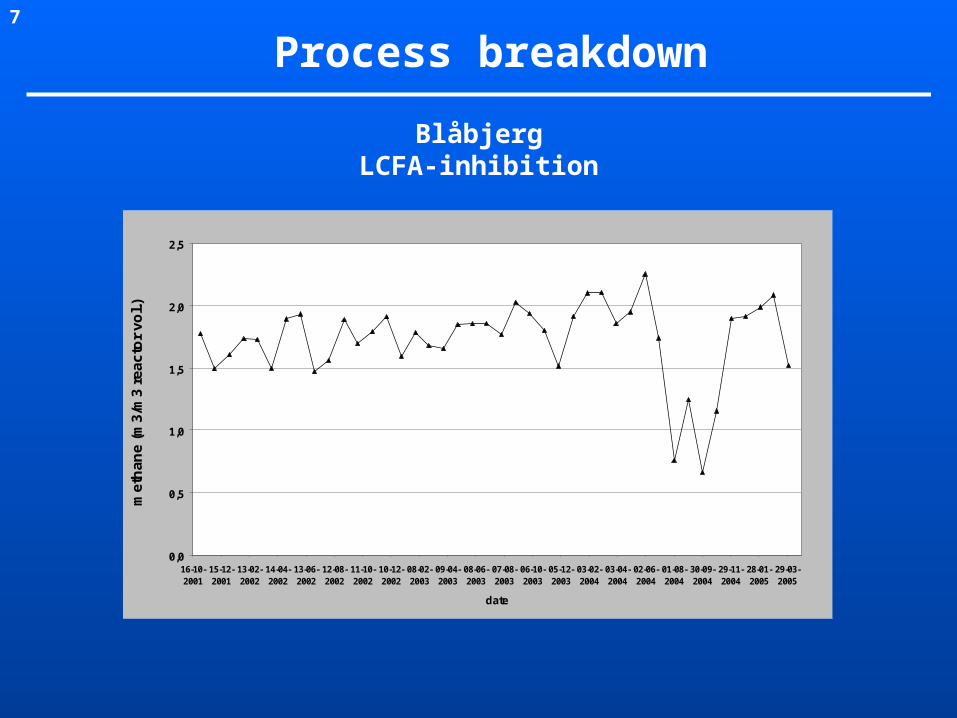
Process breakdown
BlåbjergLCFA-inhibition
0,0
0,5
1,0
1,5
2,0
2,5
16-10-2001
15-12-2001
13-02-2002
14-04-2002
13-06-2002
12-08-2002
11-10-2002
10-12-2002
08-02-2003
09-04-2003
08-06-2003
07-08-2003
06-10-2003
05-12-2003
03-02-2004
03-04-2004
02-06-2004
01-08-2004
30-09-2004
29-11-2004
28-01-2005
29-03-2005
date
me
tha
ne
(m
3/m
3 r
ea
cto
r v
ol.
)
8
0
0,5
1
1,5
2
2,5
15-06-1994
28-10-1995
11-03-1997
24-07-1998
06-12-1999
19-04-2001
01-09-2002
14-01-2004
28-05-2005
10-10-2006
Date
m3
/(m
3 r
ea
cto
r v
ol.
)
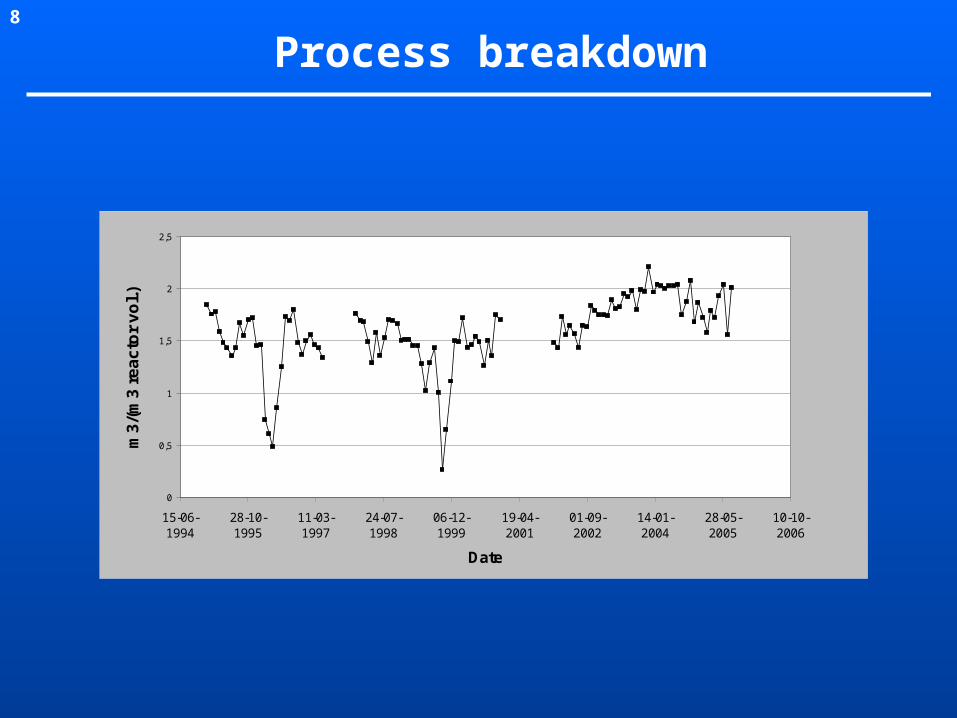
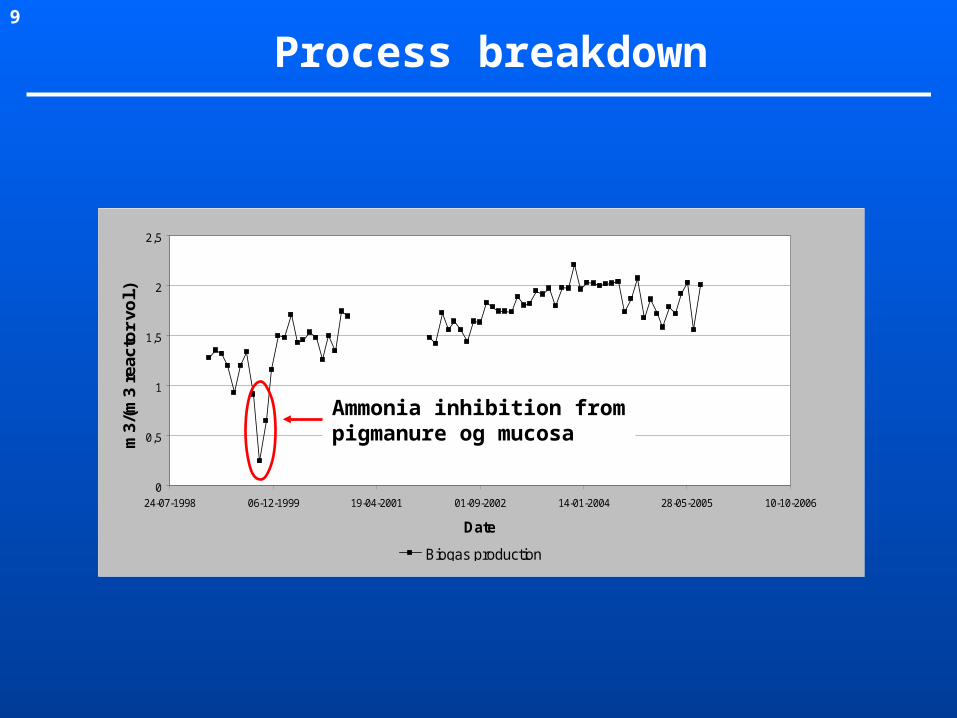
Process breakdown
9
0
0,5
1
1,5
2
2,5
24-07-1998 06-12-1999 19-04-2001 01-09-2002 14-01-2004 28-05-2005 10-10-2006
Date
m3/
(m3
reac
tor
vol.)
Biogas production
Ammonia inhibition frompigmanure og mucosa
Process breakdown

10
0
0,5
1
1,5
2
2,5
24-07-1998 06-12-1999 19-04-2001 01-09-2002 14-01-2004 28-05-2005 10-10-2006
Date
m3
/(m
3 r
ea
cto
r v
ol.
)
Biogas production
Suboptimal reactor performance
+-
11
0
0,5
1
1,5
2
2,5
24-07-1998 06-12-1999 19-04-2001 01-09-2002 14-01-2004 28-05-2005 10-10-2006
Date
m3
/(m
3 r
ea
cto
r v
ol.
)
0
200
400
600
800
1000
1200
ton
s
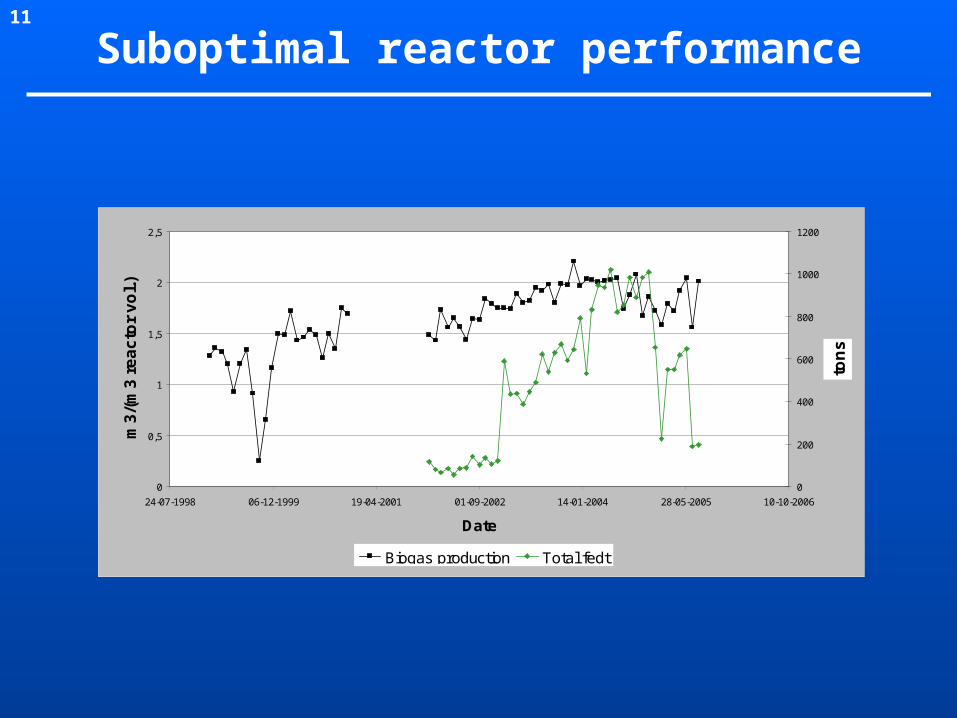
Biogas production Total fedt
Suboptimal reactor performance
12
0
0,5
1
1,5
2
2,5
24-07-1998 06-12-1999 19-04-2001 01-09-2002 14-01-2004 28-05-2005 10-10-2006
Date
m3
/(m
3 r
ea
cto
r v
ol.
)
0
200
400
600
800
1000
1200
Fe
dt
ton
s
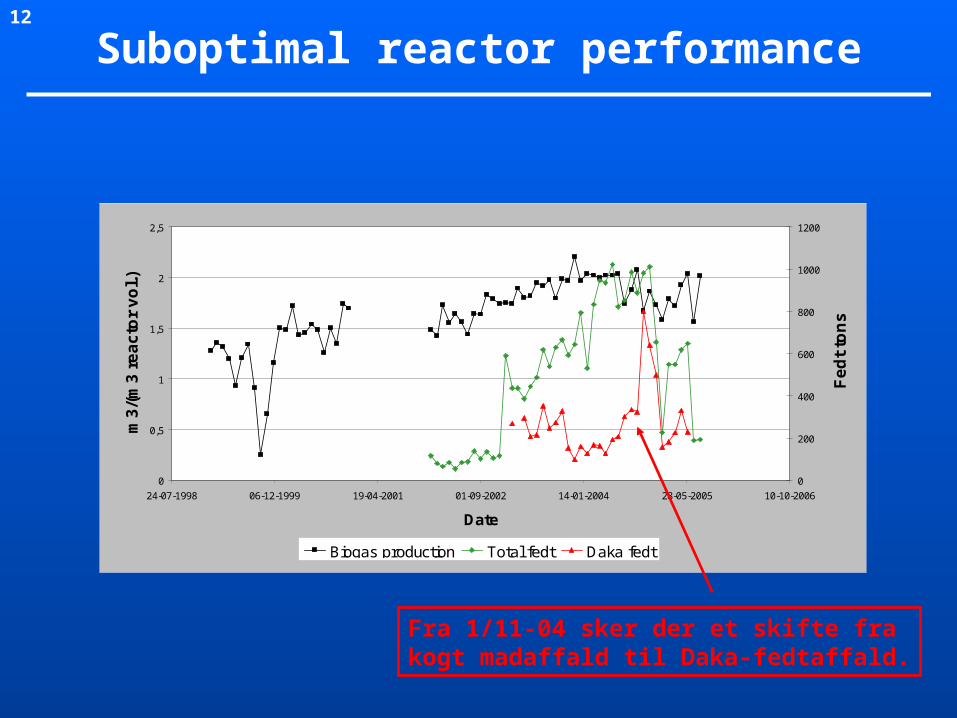
Biogas production Total fedt Daka fedt
Fra 1/11-04 sker der et skifte frakogt madaffald til Daka-fedtaffald.
Suboptimal reactor performance
13
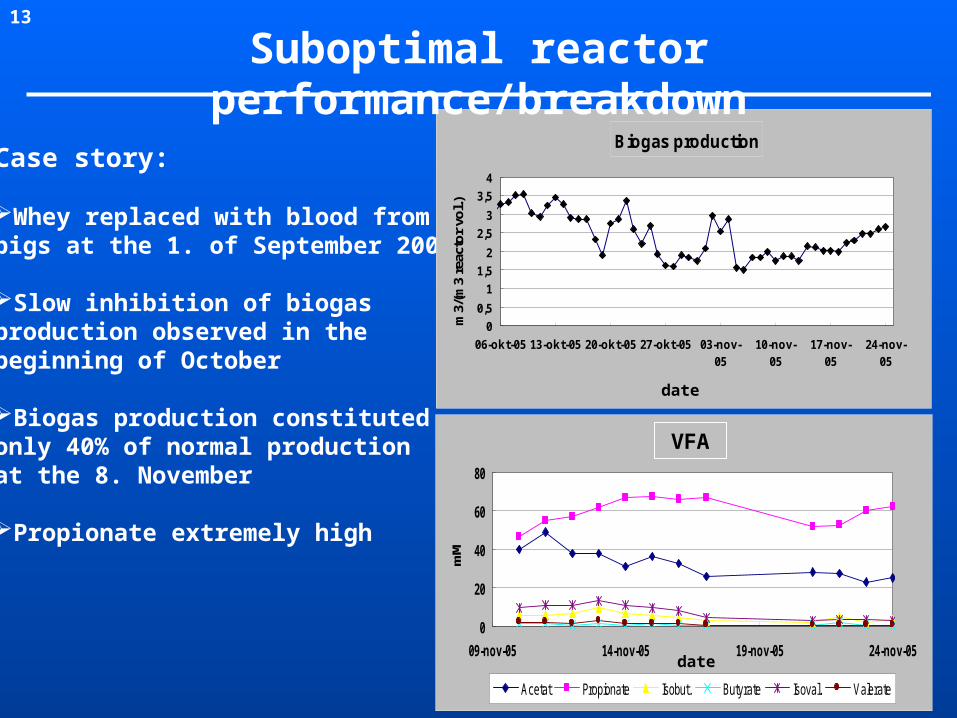
Case story:
Whey replaced with blood from pigs at the 1. of September 2005
Slow inhibition of biogasproduction observed in thebeginning of October
Biogas production constitutedonly 40% of normal productionat the 8. November
Propionate extremely high
Biogas production
0
0,5
1
1,5
2
2,5
3
3,5
4
06-okt-05 13-okt-05 20-okt-05 27-okt-05 03-nov-05
10-nov-05
17-nov-05
24-nov-05
m3/
(m3
reac
tor
vol.)
date
0
20
40
60
80
09-nov-05 14-nov-05 19-nov-05 24-nov-05
mM
Acetat Propionate Isobut. Butyrate Isoval. Valerate
VFA
date
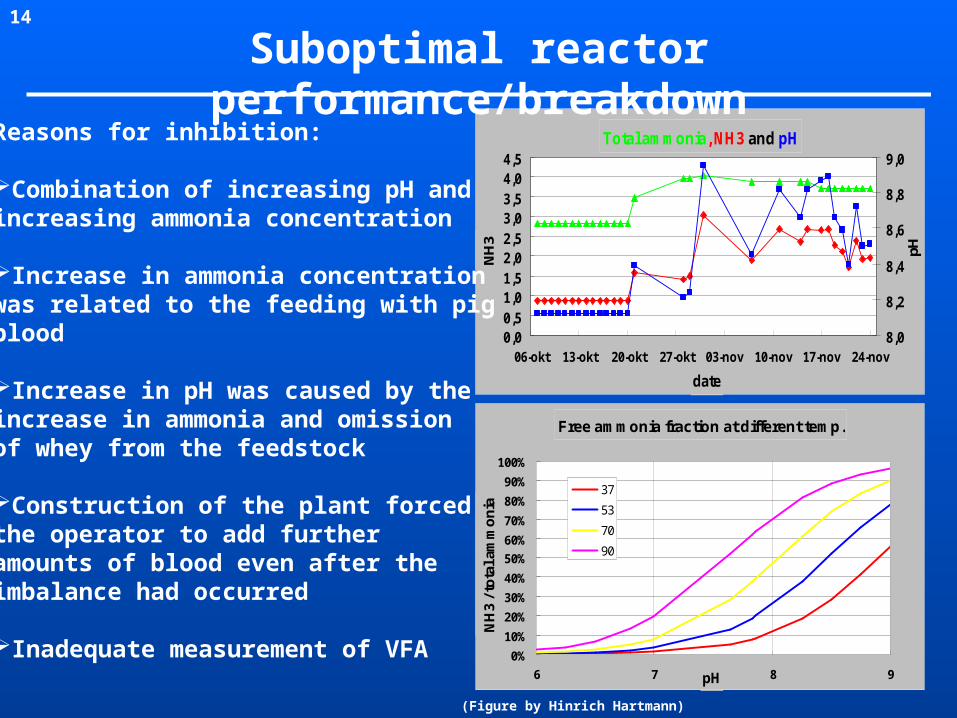
Suboptimal reactor performance/breakdown
14
Total ammonia, NH3 and pH
0,00,51,01,52,02,53,03,54,04,5
06-okt 13-okt 20-okt 27-okt 03-nov 10-nov 17-nov 24-nov
date
NH
3
8,0
8,2
8,4
8,6
8,8
9,0
pH
Suboptimal reactor performance/breakdown
Reasons for inhibition:
Combination of increasing pH andincreasing ammonia concentration
Increase in ammonia concentrationwas related to the feeding with pigblood
Increase in pH was caused by theincrease in ammonia and omissionof whey from the feedstock
Construction of the plant forcedthe operator to add further amounts of blood even after theimbalance had occurred
Inadequate measurement of VFA
Free ammonia fraction at different temp.
0%
10%
20%
30%
40%
50%
60%
70%
80%
90%
100%
6 7 8 9pH
NH
3 / t
ota
l am
monia
37
53
70
90
(Figure by Hinrich Hartmann)
15
0
0,5
1
1,5
2
2,5
3
3,5
29-08-2002
28-10-2002
27-12-2002
25-02-2003
26-04-2003
25-06-2003
24-08-2003
23-10-2003
22-12-2003
20-02-2004
20-04-2004
19-06-2004
18-08-2004
17-10-2004
16-12-2004
14-02-2005
15-04-2005
14-06-2005
date
met
han
e (m
3/m
3 re
acto
r vo
l.)
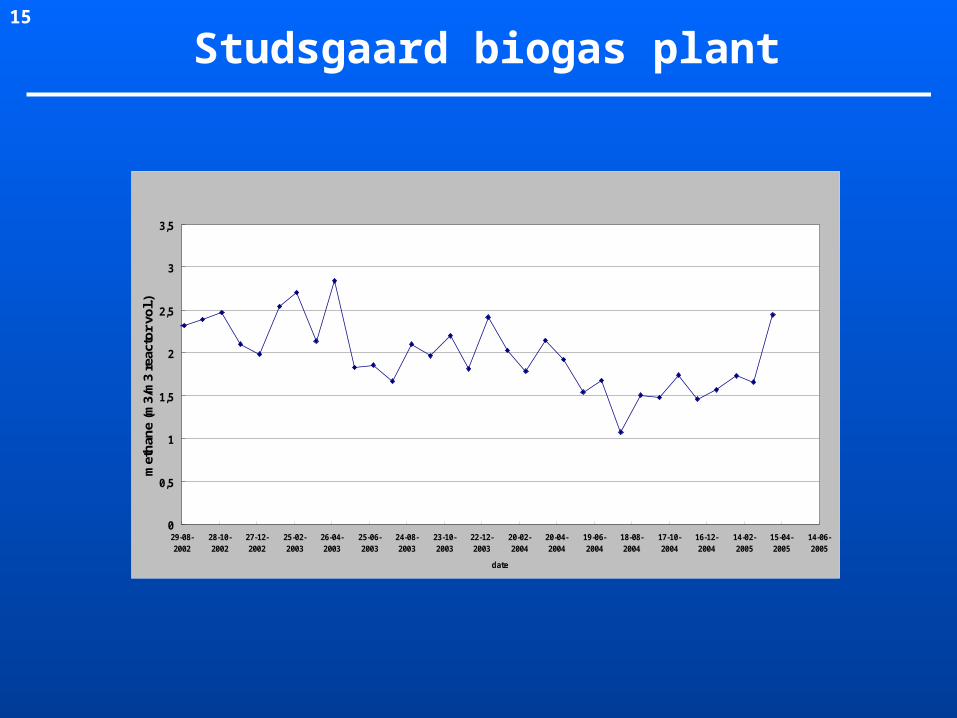
Studsgaard biogas plant
16
0,0
0,5
1,0
1,5
2,0
2,5
3,0
3,5
29-08-2002
28-10-2002
27-12-2002
25-02-2003
26-04-2003
25-06-2003
24-08-2003
23-10-2003
22-12-2003
20-02-2004
20-04-2004
19-06-2004
18-08-2004
17-10-2004
16-12-2004
14-02-2005
15-04-2005
date
met
han
e (m
3/m
3 re
acto
r vo
l.)
daily
10 per. Mov. Avg. (daily)
20 per. Mov. Avg. (daily)
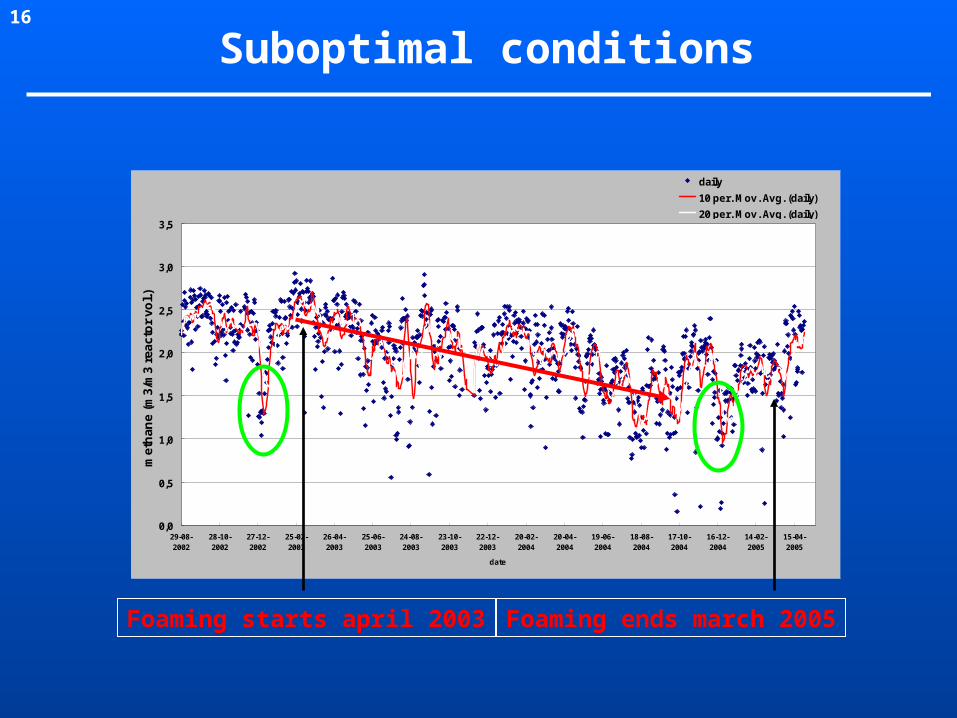
Suboptimal conditions
Foaming starts april 2003 Foaming ends march 2005
17
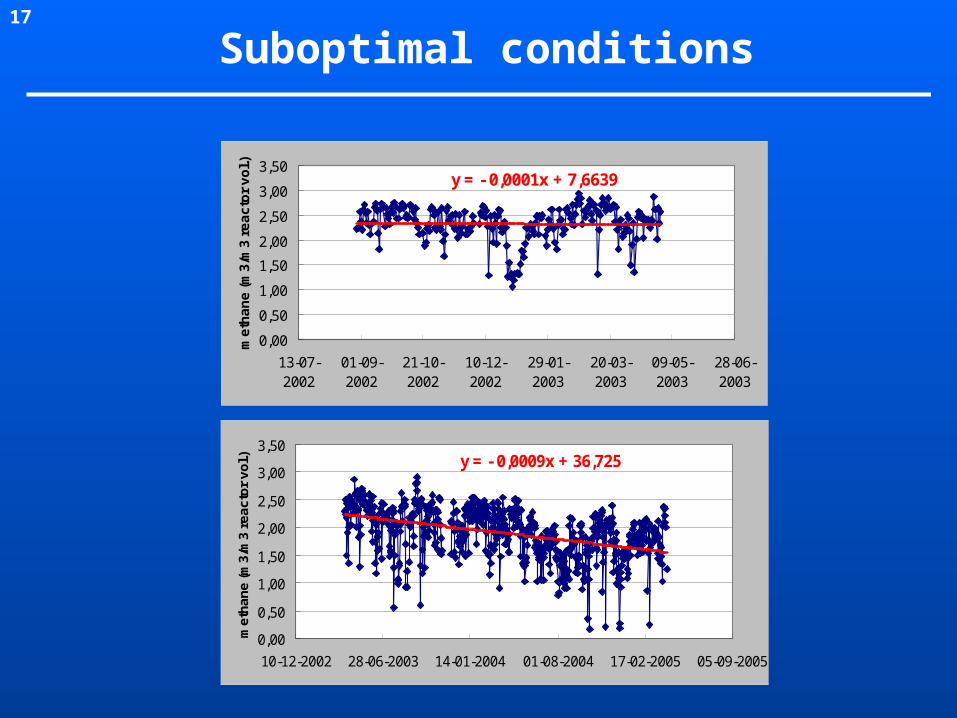
y = - 0,0001x + 7,6639
0,00
0,50
1,00
1,50
2,00
2,50
3,00
3,50
13-07-2002
01-09-2002
21-10-2002
10-12-2002
29-01-2003
20-03-2003
09-05-2003
28-06-2003
me
tha
ne
(m
3/m
3 r
ea
cto
r v
ol.)
y = - 0,0009x + 36,725
0,00
0,50
1,00
1,50
2,00
2,50
3,00
3,50
10-12-2002 28-06-2003 14-01-2004 01-08-2004 17-02-2005 05-09-2005
me
tha
ne
(m
3/m
3 r
ea
cto
r v
ol.)
Suboptimal conditions

18
0,0
0,5
1,0
1,5
2,0
2,5
3,0
3,5
01-05-2002
30-06-2002
29-08-2002
28-10-2002
27-12-2002
25-02-2003
26-04-2003
25-06-2003
24-08-2003
23-10-2003
22-12-2003
20-02-2004
20-04-2004
19-06-2004
18-08-2004
17-10-2004
16-12-2004
14-02-2005
15-04-2005
date
me
tha
ne
(m
3/m
3 r
ea
cto
r v
ol.
)
daily
10 per. Mov. Avg. (daily)
20 per. Mov. Avg. (daily)
Sinding-ørre biogas plant
19
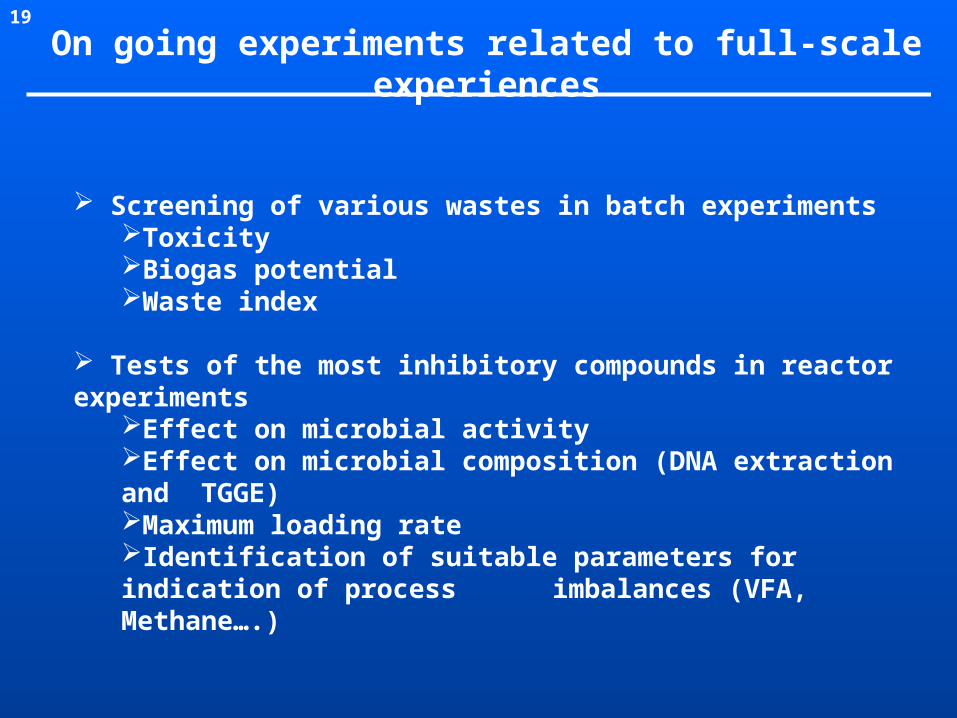
Screening of various wastes in batch experimentsToxicityBiogas potentialWaste index
Tests of the most inhibitory compounds in reactor experiments
Effect on microbial activityEffect on microbial composition (DNA extraction and TGGE)Maximum loading rateIdentification of suitable parameters for indication of process imbalances (VFA, Methane….)
On going experiments related to full-scale experiences
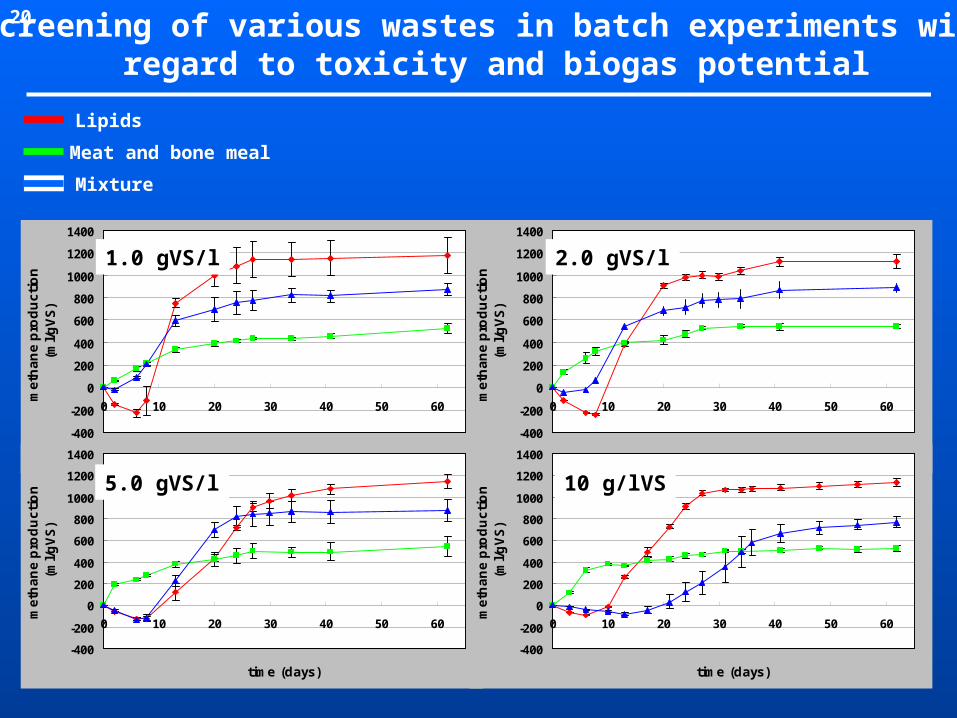
20 Screening of various wastes in batch experiments with regard to toxicity and biogas potential
Lipids
Meat and bone meal
Mixture
-400
-200
0
200
400
600
800
1000
1200
1400
0 10 20 30 40 50 60
time (days)
me
tha
ne
pro
du
cti
on
(m
l/g
VS
)
-400
-200
0
200
400
600
800
1000
1200
1400
0 10 20 30 40 50 60
time (days)
me
tha
ne
pro
du
cti
on
(m
l/g
VS
)
-400
-200
0
200
400
600
800
1000
1200
1400
0 10 20 30 40 50 60
time (days)
me
tha
ne
pro
du
cti
on
(m
l/g
VS
)
-400
-200
0
200
400
600
800
1000
1200
1400
0 10 20 30 40 50 60
time (days)
me
tha
ne
pro
du
cti
on
(m
l/g
VS
)
1.0 gVS/l
5.0 gVS/l
2.0 gVS/l
10 g/lVS

21
Waste type Temperature Inhibition level
g VS/l = kg VS/tBlood from pigs 37oC 0,5-1,0
Blood from pigs 55oC <0,5
Shrimp sludge 37oC 1,0-5,0
Shrimp sludge 55oC 0,5-1,0
Meat and Bone meal 37oC 1,0-5,0
Meat and Bone meal 55oC 0,5-2,0
100% Fat, DAO 55oC <1,0
Flotations fedt, pigs 55oC 0,5-1,0
Bakery (mainly fat) 55oC 5,0-10,0
Flotationsfedt, pigs 55oC 5,0-10,0
Flotationsfedt, pigs 55oC 5,0-10,0
Limfedt (fat) 55oC 5,0-10,0
Food waste (fat) 55oC >10,0
Flotationsfedt, chickens
55oC >10,0
Waste index. Examples
22
0,0
0,2
0,4
0,6
0,8
1,0
1,2
1,4
165 170 175 180 185 190 195 200 205
time (days)
met
hane
yie
ld (m
l/gV
S)
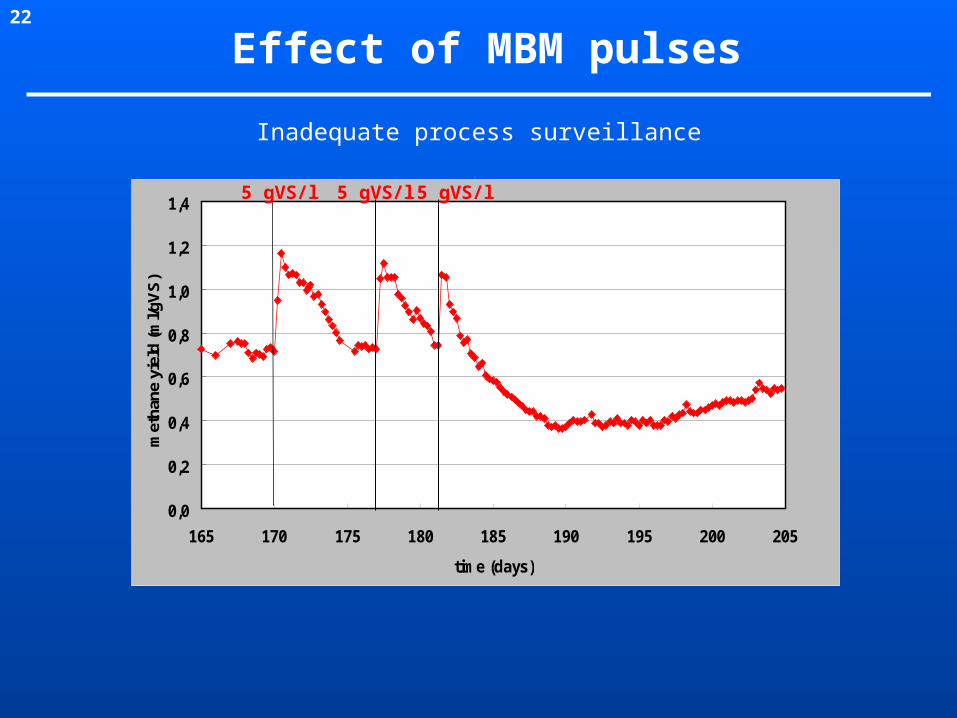
Effect of MBM pulses
5 gVS/l 5 gVS/l 5 gVS/l
Inadequate process surveillance
23
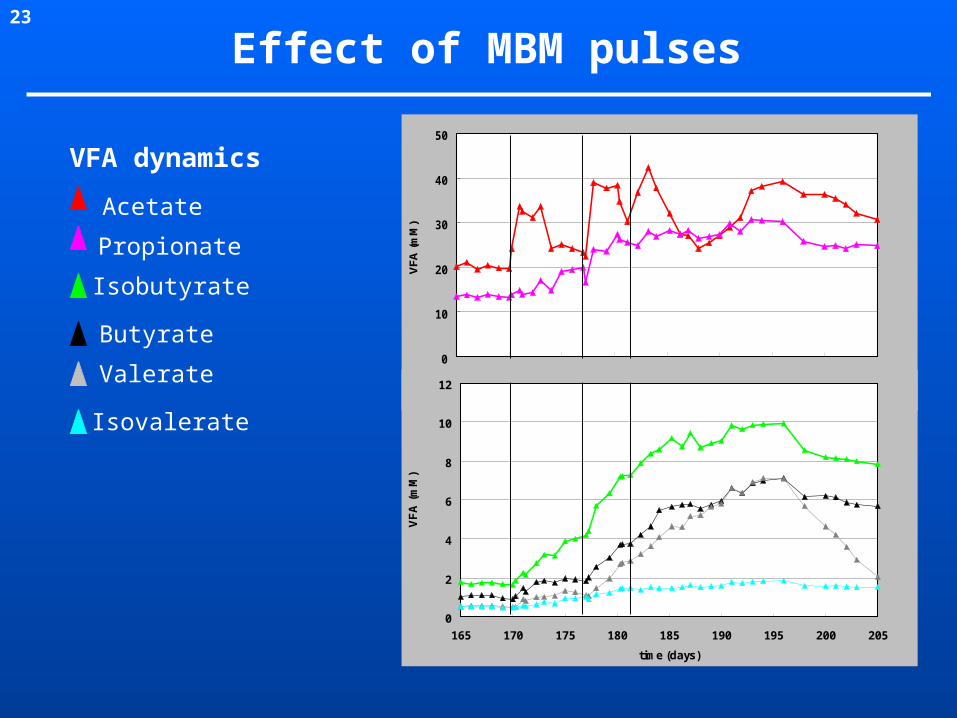
Effect of MBM pulses
Acetate
Propionate
Isovalerate
Isobutyrate
Butyrate
Valerate
VFA dynamics
0
10
20
30
40
50
165 170 175 180 185 190 195 200 205
time (days)V
FA (m
M)
0
2
4
6
8
10
12
165 170 175 180 185 190 195 200 205
time (days)
VF
A (
mM
)
24
Recovery of reactors following process imbalances:DilutionRe-inoculationContinued feeding with wasteFeeding with manure onlyNo feeding at all
Foaming in biogas plantsMicrobial phenomenon?Physical phenomenon?
Future experiments related to full-scale experiences

25
Conclusions
?
26
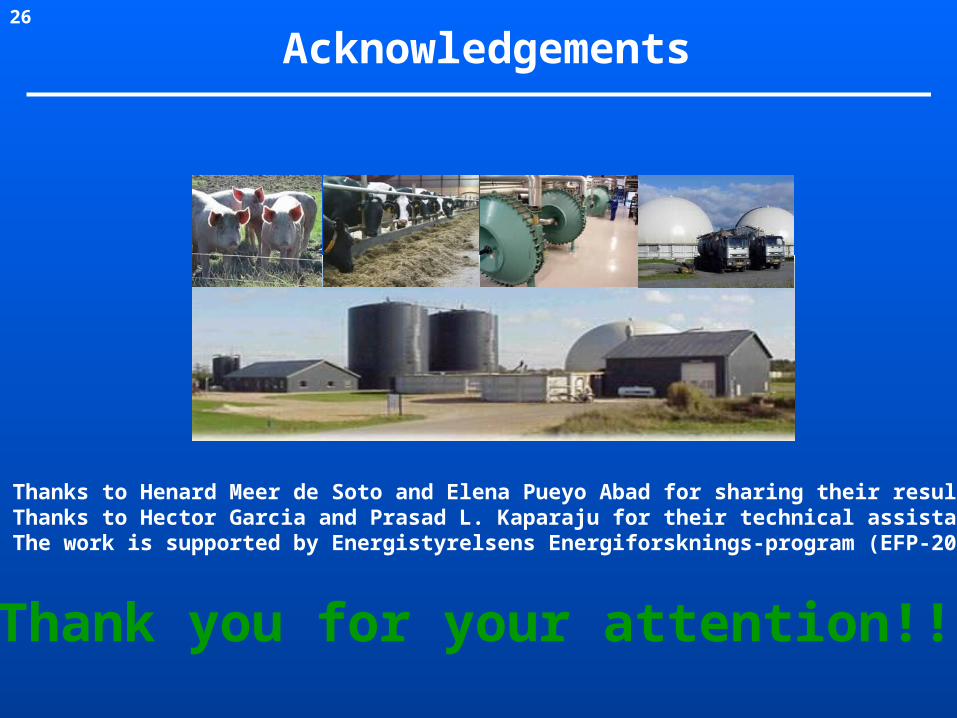
Acknowledgements
Thanks to Henard Meer de Soto and Elena Pueyo Abad for sharing their resultsThanks to Hector Garcia and Prasad L. Kaparaju for their technical assistanceThe work is supported by Energistyrelsens Energiforsknings-program (EFP-2005)
Thank you for your attention!!!!