1 pressure drop analysis of 1.6l car air intake system...
TRANSCRIPT

1
PRESSURE DROP ANALYSIS OF 1.6L CAR AIR INTAKE SYSTEM
MOHAMAD SAFWAN BIN AHMAD LOTHFY
Thesis submitted in fulfilment of the requirementsfor the award of the degree of
Bachelor of Mechanical Engineering with Automotive Engineering
Faculty of Mechanical EngineeringUNIVERSITI MALAYSIA PAHANG
NOVEMBER 2009

6
ABSTRACT
Today, air intake system and filter play major role in getting good quality air
into automobile engine. The intake system has improves the combustion efficiency
and also reduces air pollution. This paper focuses on the pressure drop analysis of
1.6L car air intake system. The thesis describes the CFD analysis techniques to
predict the pressure drop and identify the critical locations of the components. The
air intake system is work as to supply the engine with clean air and correct amount
for the required air to burn in the manifold chamber. This research is to analyze the
model and pressure drop of Proton Waja intake system. The thesis describes the CFD
analysis techniques to predict the pressure drop and identify the critical locations of
the components. 3D viscous CFD analysis will carry out for an existing model to
understand the flow behavior through the intake system, air filter geometry and filter
media. Results obtain from CFD analysis of the existing model show good
correlation with experimental data. Based on existing model CFD results, it can show
the airflow in the intake system and the pressure drop will see by pressure
visualization. The time and cost are reducing by using 3D CFD analysis for air intake
system in automobile industry.
7
ABSTRAK
Dewasa ini, sistem pengambilan udara dan penapisan memainkan peranan penting
dalam mendapatkan kualiti udara yang memasuki injin automobil. Sistem ini
meningkat kecekapan pembakaran dan mengurangkan pencemaran udara. Projek ini
memberi fokus kepada analisis tekanan yang jatuh dalam sistem pengambilan udara
bagi kereta 1.6 liter. System ini juga berfungsi membekalkan udara bersih dan
jumlah udara yang diperlukan untuk pembakaran di dalam kebuk pancarongga.
Penyelidikan ini bertujuan mengkaji model dan tekanan yang jatuh untuk sistem
pengambilan udara bagi kereta Proton Waja. Analisis CFD dianalisakan ke atas
model bagi mamahami corak sistem pengaliran udara melalui sysem pengambilan
udara luar, geometri penapisan udara dan media penapisan. Keputusan yang
diperolehi dari analisa model CFD menunjukkan bahawa corak sistem ini
mempunyai perkaitan yang baik. Daripada keputusan yang dikeluarkan oleh CFD, ia
menunjukan pengaliran udara dalam sistem ini dan melihat bagaimana tekanan jatuh
melalui visual takanan. Dengan menggunakan analisis dari CFD, ia dapat
mengurangkan kos dan masa untuk mengkaji sisten pengambilan udara di dalam
industri automotif.
8
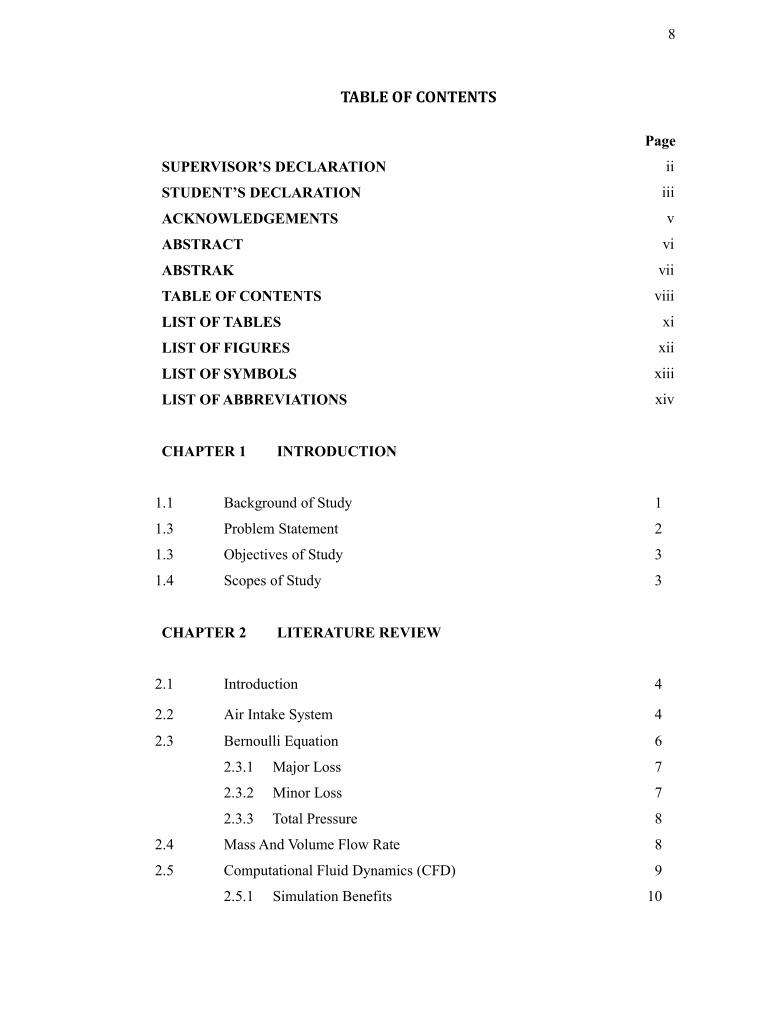
TABLE OF CONTENTS
Page
SUPERVISOR’S DECLARATION ii
STUDENT’S DECLARATION iii
ACKNOWLEDGEMENTS v
ABSTRACT vi
ABSTRAK vii
TABLE OF CONTENTS viii
LIST OF TABLES xi
LIST OF FIGURES xii
LIST OF SYMBOLS xiii
LIST OF ABBREVIATIONS xiv
CHAPTER 1 INTRODUCTION
1.1 Background of Study 1
1.3 Problem Statement 2
1.3 Objectives of Study 3
1.4 Scopes of Study 3
CHAPTER 2 LITERATURE REVIEW
2.1 Introduction 4
2.2 Air Intake System 4
2.3
2.4
2.5
Bernoulli Equation
2.3.1 Major Loss
2.3.2 Minor Loss
2.3.3 Total Pressure
Mass And Volume Flow Rate
Computational Fluid Dynamics (CFD)
2.5.1 Simulation Benefits
6
7
7
8
8
9
10
1 × ENTER (1.5 line spacing)

9
CHAPTER 3 RESEARCH METHODOLOGY
3.0 Introduction 11
3.1
3.2
3.3
Flow Chart
Data Collecting
Structural Modeling
12
13
14
3.4 Simulation
3.4.1 Boundary Condition
3.4.2 Mesh
19
19
20
CHAPTER 4 RESULTS AND DISCUSSION
4.1 Introduction 21
4.2
4.3
Velocity Visualization
Pressure Visualization
22
23
4.4 Simulation Analysis
4.4.1 Sample Of Calculation
25
26
4.5 Complete Result Of Simulation 27
4.6 Pressure Drop Result 33
4.7 Pressure Drop Analysis 34
CHAPTER 5 CONCLUSION AND RECOMMENDATIONS
5.1 Conclusions 36
5.2 Recommendations 37
10
REFERENCES38
APPENDICES
A Project Gant Chart 39
B Technical Report 42

11
List of Tables
Table No. Title Page
4.1 Simulation result at entering pipe for 1000 rpm 25
4.2 Simulation result at exit pipe for 1000 rpm 26
4.3 Simulation result at entering pipe for 2000 rpm 27
4.4 Simulation result at exit pipe for 2000 rpm 27
4.5 Simulation result at entering pipe for 3000 rpm 28
4.6 Simulation result at exit pipe for 3000 rpm 28
4.7 Simulation result at entering pipe for 4000 rpm 29
4.8 Simulation result at exit pipe for 4000 rpm 29
4.9 Simulation result at entering pipe for 5000 rpm 30
4.10 Simulation result at exit pipe for 5000 rpm 30
4.11 Simulation result at entering pipe for 6000 31
4.12 Simulation result at exit pipe for 6000 rpm 31
4.13 Simulation result at entering pipe for 7000 rpm 32
4.14 Simulation result at exit pipe for 7000 rpm 32
4.15 Result of pressure drop based on engine speed 33

12
LIST OF FIGURES
Figure No. Title Page
2.1 An illustration of the air intake system structure 5
3.1 Flow chart 12
3.2 Proton Waja air intake system 13
3.3 3D of air intake system 14
3.4 intake pipe 14
3.5 Air pipe 15
3.6 Upper box 15
3.7 Down box 16
3.8 Filter 16
3.9 After assemble 17
3.10 Orthographic view 18
3.11 Boundary condition 19
3.12 Mesh 20
4.1 Velocity visualization 22
4.2 Pressure visualization 23
4.3 Visual of pressure at filter box 24
4.4 Full pressure visualization of air flow 24
4.5 Pressure drop graph based on engine speed 33
5.1 Flow bench machine 36

13
LIST OF SYMBOLS
µ Dynamic viscosity
V Fluid velocity
ρ Density
υ Kinematic viscosity
m Molar mass
m Mass flow rate
Ac Area of the nozzle
As Area of the wall
f Friction factor
KL Loss coefficient
hL Head loss
Re Reynolds number
g Gravity
D Pipe diameter
Δp Pressure loss

14
List of Abbreviations
FYP Final year project
vs Versus
3-D Three Dimension
15
CHAPTER 1
INTRODUCTION
1.1 PROJECT BACKGROUND
This thesis focuses on the intake system pressure drop analysis using CFD
analysis results and experiment. In the end of this project, the pressure drop of air
flow cross the air intake can be analyzed. The engine of a car needs air for the
combustion process in the cylinders. Air intake system and filter play major role in
getting good quality air into automobile engine. It improves the combustion
efficiency and also reduces air pollution. For this thesis, the Proton Waja 1.6 Air
intake system has been choosing to analyze. The main function of an air intake
system is to supply the engine with clean air and correct amount for the required air
to burn in the manifold chamber. Air enters the filter through dirty pipe and inlet side
plenum, which guides the flow uniformly through the filter media. Optimum
utilization of filter can significantly reduce the cost of filter replacements frequently
and keep the filter in use for longer time. To optimize intake system and filter,
thorough understanding of flows and pressure drop through the system is essential.
Computational Fluid Dynamics (CFD) is considered to be the most cost effective
solution for flow analysis of intake system along with filter media. Air intake
systems employ specially-shaped intake tubes designed to straighten airflow as much
as possible while looking great in engine compartment. These pipes are typically
mandrel-bent, a process that doesn't crimp the pipe diameter at the bend.
16
1.2 PROJECT PROBLEM STATEMENT
Car air intake systems allow the car to breathe easier creating more
horsepower and greater gas mileage. Grabbing a high-performance air intake is the
quick and easy route to several benefits, including:
An instant increase in horsepower
A noticeable boost to your throttle response
Improved fuel economy
A long-life, washable performance air filter
Specialized engineering that's fine-tuned to your specific vehicle
Straightforward, simple installation virtually anyone can complete
Horsepower increase from a performance air intake
The flow efficiency of the intake system has a direct impact on the power the
engine is able to deliver. This project is to analyze the pressure drop of Proton Waja
intake system. If the flow in the air intake determined to have less turbulent flow and
decrease the wake projection and there is less pressure drop across the intake system
it will increase the efficiency of combustion of the air in the intake system. The CFD
will be use to analyze the internal flow of air intake and get the initial result. From
the analysis, the value of pressure drop in certain rpm of engine power can be
determined. The difference speed of air flow based on the lower until maximum rpm
of engine will be used.
For performance intake draws in a higher volume of air which may be much
cooler, your engine can breathe easier than with a limiting stock system. With
combustion chamber filled by cooler, oxygen-rich air, fuel burns at a more efficient
mixture. It will get more power out of every drop of fuel when it's combined with the
right amount of air. With more air in the chamber, it can also burn more fuel than
before. That's how a performance intake puts power at the pedal for reducing air
temperatures, balancing fuel mixtures and providing more air for combustion.

17
1.3 OBJECTIVES
The objectives of this project are:
i. To determine and analyze the pressure drop in the air intake system.
ii. To analyze the model of Waja 1.6 Air Intake System using the CFD
iii. To estimate flow rates of the air intake system across the intake system.
iv. To analyze the air flow affected by the minor losses.
1.4 SCOPES OF STUDY
The scope of this project will comprise the boundaries of project study. The
pressure drop analyses of air intake system are wide range of study. Many
characteristic should be bound in order to make this project achieve the objectives.
First of all, the study of this project is using Bernoulli Equation to determine the
pressure drop in calculation. This equation is very useful to identify the velocity,
density and pressure of the air flow. Furthermore, this project study using the
Solidworks to design the air intake system model of the Proton Waja 1.6L. The CFD
will be use to analyze the internal flow of air intake and get the result in difference
speed of engine from minimum until maximum. The speed of engine start from 1000
rpm until 7000 rpm will be use in the simulation.
18
CHAPTER 2
LITERATURE REVIEW
2.1 INTRODUCTION
This chapter presents a review of literature on the efforts relating to the
pressure drop analysis of air intake system. It attempts to establish what the factors
are affecting the performance of intake system and how this intake system affected
the car engine performance. The discussions are focus on the flow management in
the intake system as a tool to improve the car engine performance.
2.2 AIR INTAKE SYSTEM
For an engine equipped with a carburetor, this is pretty straightforward. Air
comes in the air filter housing, passes through the air filter, into the carburetor where
the fuel is mixed with it. Then it passes through the intake manifold and is drawn into
the cylinders [1]. The most advanced part of the system was an Air Temperature
Sensor in the air intake. It was used to measure the air temperature and, by opening
and closing a flap, allow cool air in through the air horn or heated air piped in from
around an exhaust manifold [2]. This was to prevent carburetor icing that would
cause the car to stall and die out. It also facilitated vaporization of the fuel into the air
stream [1].
In a fuel-injected car it's a whole different ball game. Air is drawn in through
the air intake. This is usually a long plastic tube going into the air filter housing. The
reason the intake tube is long is to get the air moving in a fairly steady, coherent
stream. It then passes through the air filter and then through an Air Flow Meter [3].
19
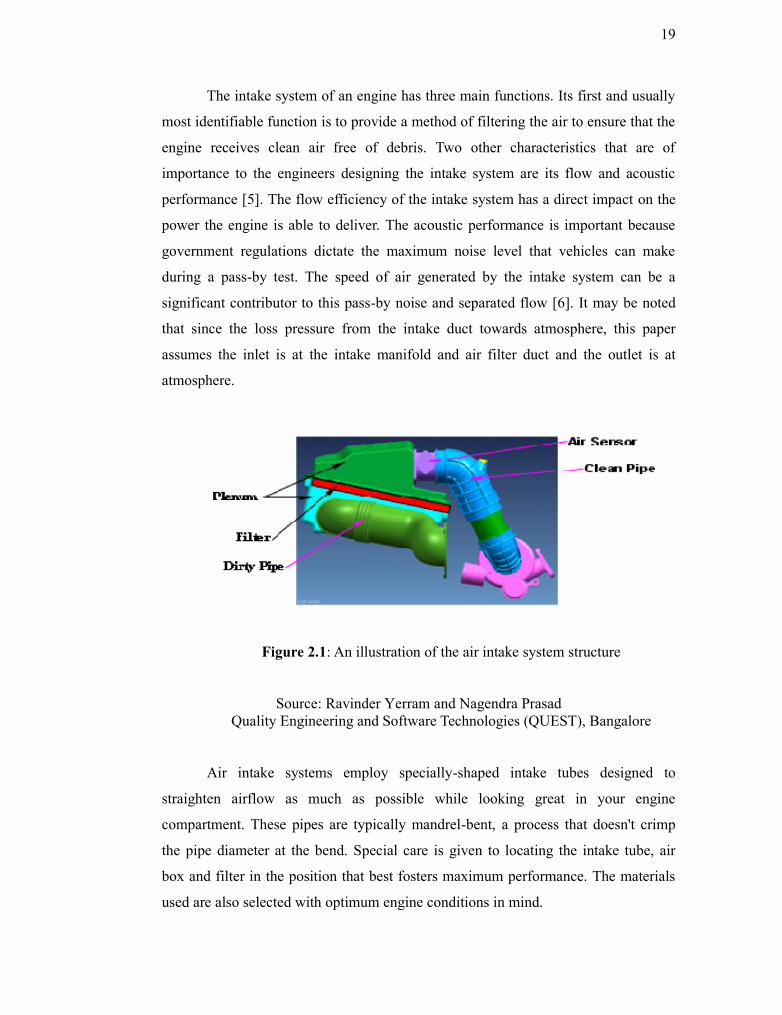
The intake system of an engine has three main functions. Its first and usually
most identifiable function is to provide a method of filtering the air to ensure that the
engine receives clean air free of debris. Two other characteristics that are of
importance to the engineers designing the intake system are its flow and acoustic
performance [5]. The flow efficiency of the intake system has a direct impact on the
power the engine is able to deliver. The acoustic performance is important because
government regulations dictate the maximum noise level that vehicles can make
during a pass-by test. The speed of air generated by the intake system can be a
significant contributor to this pass-by noise and separated flow [6]. It may be noted
that since the loss pressure from the intake duct towards atmosphere, this paper
assumes the inlet is at the intake manifold and air filter duct and the outlet is at
atmosphere.
Figure 2.1: An illustration of the air intake system structure
Source: Ravinder Yerram and Nagendra PrasadQuality Engineering and Software Technologies (QUEST), Bangalore
Air intake systems employ specially-shaped intake tubes designed to
straighten airflow as much as possible while looking great in your engine
compartment. These pipes are typically mandrel-bent, a process that doesn't crimp
the pipe diameter at the bend. Special care is given to locating the intake tube, air
box and filter in the position that best fosters maximum performance. The materials
used are also selected with optimum engine conditions in mind.

20
The fundamentals of installing a performance air intake on your vehicle not
only is a performance air intake one of the most essential upgrades to your vehicle, it
happens to be one of the easiest additions to install. With little more than a common
socket set, a couple of screwdrivers and half an hour's time, you can have your new
air intake in place and ready to roar [5].
Detailed instructions are included with every intake kit. These instructions go
through the simple process of removing your stock intake system (including the tube
and air box), and installing the new air intake in just a few minutes to stock mounting
positions. No cutting, drilling or other modifications are required [2].
2.3 BERNOULLI EQUATION
The Bernoulli equation is a useful equation as it relates pressure changes to
velocity and elevation changes along a streamline. Streamlines are lines drawn in a
flow field so that at a given instant they are tangent to the direction of the flow at
every point in the flow field. Since they are tangent to the velocity vector at every
point in the flow field, there can be no flow of fluid across a streamline [4].
+ 2 + = + 2 + + ℎ (2.1)The Bernoulli equations give correct results when certain restrictions are applied.
These are as follows:
1. Steady flow
2. Incompressible flow
3. Frictionless flow
4. Flow along a streamline.
=

21
2.3.1 Major Loss
The most pipe or duct system consists of the straight pipe at this point head
loss due to viscous effect , ℎ can determined by equation:
, ℎ = ℓ 2 (2.2)Friction factor, to be determine using Moody chart. Using the Reynolds number
and for the plastic surface of the AIS we look the graph curve at the graph smooth
line [4]. Because the roughness, ε. For the laminar developed flow, the value of is
simply:
= 642.3.2 Minor Loss
In the intake system we found the system of the pipe more than a straight
pipe. These additional components (valves, bends, tees, and the like) add the overall
head loss of e system [8]. Such losses are generally termed , with the
corresponding head loss denoted ℎ ., ℎ = 2 (2.3)
The most common method used to determine these head losses or pressure drops is
to specify the loss coefficient, which is defined as:
= ℎ . 2 = 12 (2.4)
22
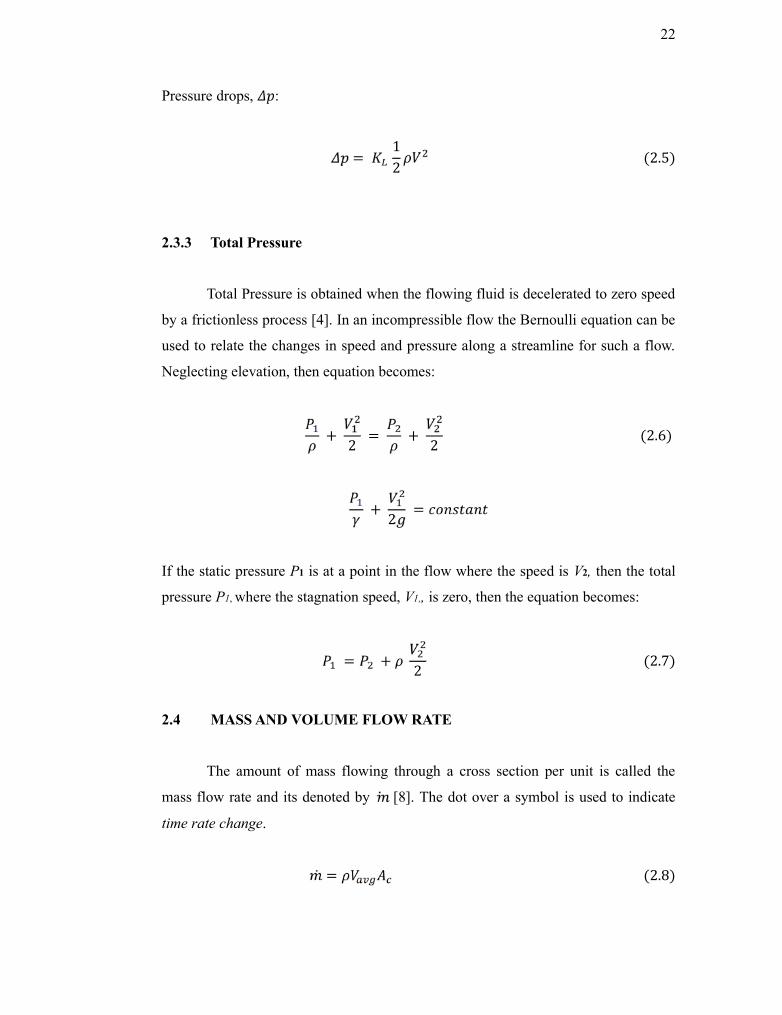
Pressure drops, :
= 12 (2.5)2.3.3 Total Pressure
Total Pressure is obtained when the flowing fluid is decelerated to zero speed
by a frictionless process [4]. In an incompressible flow the Bernoulli equation can be
used to relate the changes in speed and pressure along a streamline for such a flow.
Neglecting elevation, then equation becomes:
+ 2 = + 2 (2.6)+ 2 =
If the static pressure P1 is at a point in the flow where the speed is V2, then the total
pressure P1, where the stagnation speed, V1,, is zero, then the equation becomes:
= + 2 (2.7)2.4 MASS AND VOLUME FLOW RATE
The amount of mass flowing through a cross section per unit is called the
mass flow rate and its denoted by [8]. The dot over a symbol is used to indicate
time rate change.
= (2.8)

23
We defined the average velocity average value across the entire cross section of
the pipe, where is the area of the cross section normal t the flow direction.
The volume of the fluid flowing through a cross section per unit time is called
volume flow rate, .
= =The mass and volume flow rates are related by:
= 2.5 COMPUTATIONAL FLUID DYNAMICS (CFD)
Air was used as fluid media, which was assumed to be steady and
incompressible. High Reynolds number k-ε turbulence model was used in the CFD
model. This turbulence model is widely used in industrial applications. The equations
of mass and momentum were solved using SIMPLE algorithm to get velocity and
pressure in the fluid domain. The assumption of an isotropic turbulence field used in
this turbulence model was valid for the current application. The near-wall cell
thickness was calculated to satisfy the logarithmic law of the wall boundary. Other
fluid properties were taken as constants [11]. One of the most important requirements
before a CFD computation can be performed is the available of a suitable grid.
Inability to construct a grid quickly and reliably often rules out a CFD analysis.
Linear methods such as the Panel Method need only a grid on the body surface (and
road). Generation of the grid on the surface of a real vehicle so as to correctly capture
the critical flow phenomenon is not a trivial problem. The Computer-Aided Design
(CAD) surface definition data created for body panel manufacture in the industry are
helpful in generating such grids [12]. The nonlinear CFD methods (Euler, NS) need a
body-surrounding spatial grid to solve the partial differential equations. The inner
boundary of this grid is the body surface and the outer boundary is the bounding
surface of a sufficiently large computational domain around the body

24
The aim of CFD is to resolve the equations that drive theoretically every kind
of flow:
• The continuity equation
• The momentum equations
• The energy equation
(2.9)
(2.10)
where u is the fluid velocity, is the fluid density, Si is a mass-distributed external
force per unit mass, E is the total energy per unit mass, QH is a heat source per unit
volume,
(2.11)
is the viscous shear stress tensor and qi is the diffusive heat flux.
2.5.1 Simulation Benefits
Technical Advantages
• Faster evaluation of new ideas, products and processes
• New insights into your process and performance
• Maximise effectiveness of your manufacturing resources
• Save time and cost, and get better results
Business Advantages
• Reduce risk and increase confidence in technical projects
• Increase customer confidence
• Increase credibility with customers
• Win more business
0
kk
uxt
ii
ikkik
i SxPuu
xyu
Hkkiikkkk
QuSuquPExy
E

25
CHAPTER 3
METHODOLOGY
3.0 INTRODUCTION
In this project, simulation will be conduct by vary the velocity of air based on
the speed of engine. Research and approach will be described clearly in flow chart,
procedures, dimension measurements, modeling and simulation. The collected data
from the simulation will be use for further analysis.
26
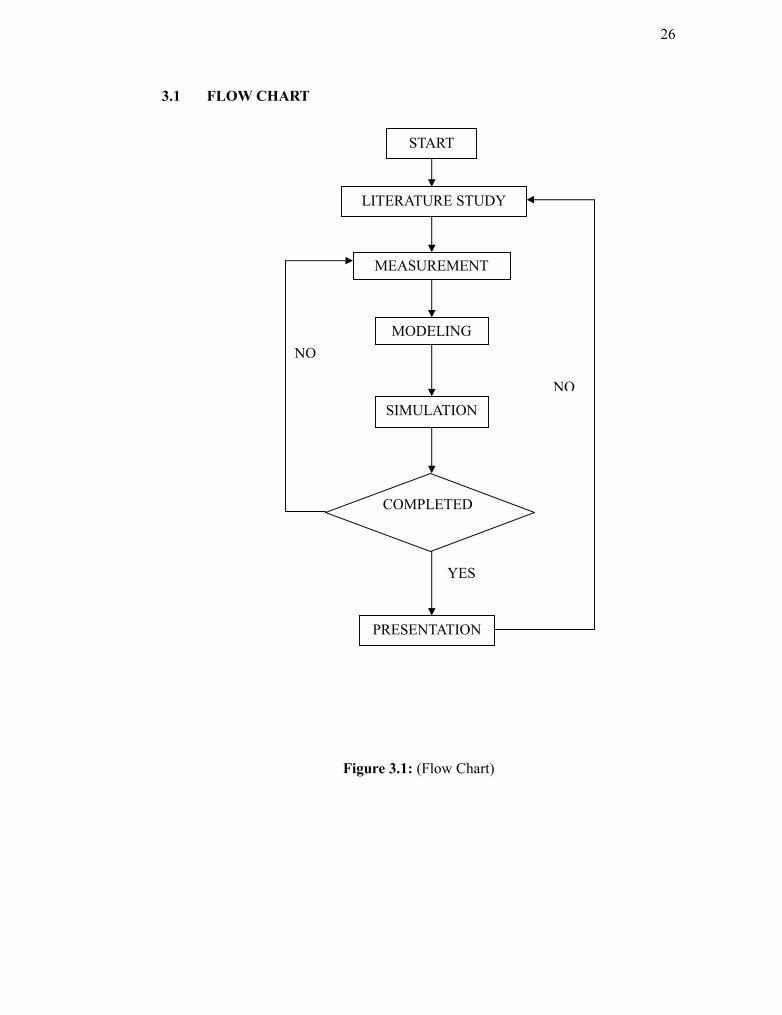
3.1 FLOW CHART
Figure 3.1: (Flow Chart)
START
LITERATURE STUDY
MEASUREMENT
MODELINGNO
NOSIMULATION
COMPLETED
YES
PRESENTATION

27
3.2 DATA COLLECTING
Figure 3.2: Proton Waja air intake system
The data of dimension for air intake system of Proton Waja was collecting
from measuring then modeling the body by SolidWorks software. Data collecting of
dimension as accurate as possible is very important for air intake to simulating the
model in CFD.
To measure the area, venire caliper had been used.
Inlet cross section area = 0.03756m²
Thickness of plastic = 29.5 mm
Porosity (filter) = 0.85
28
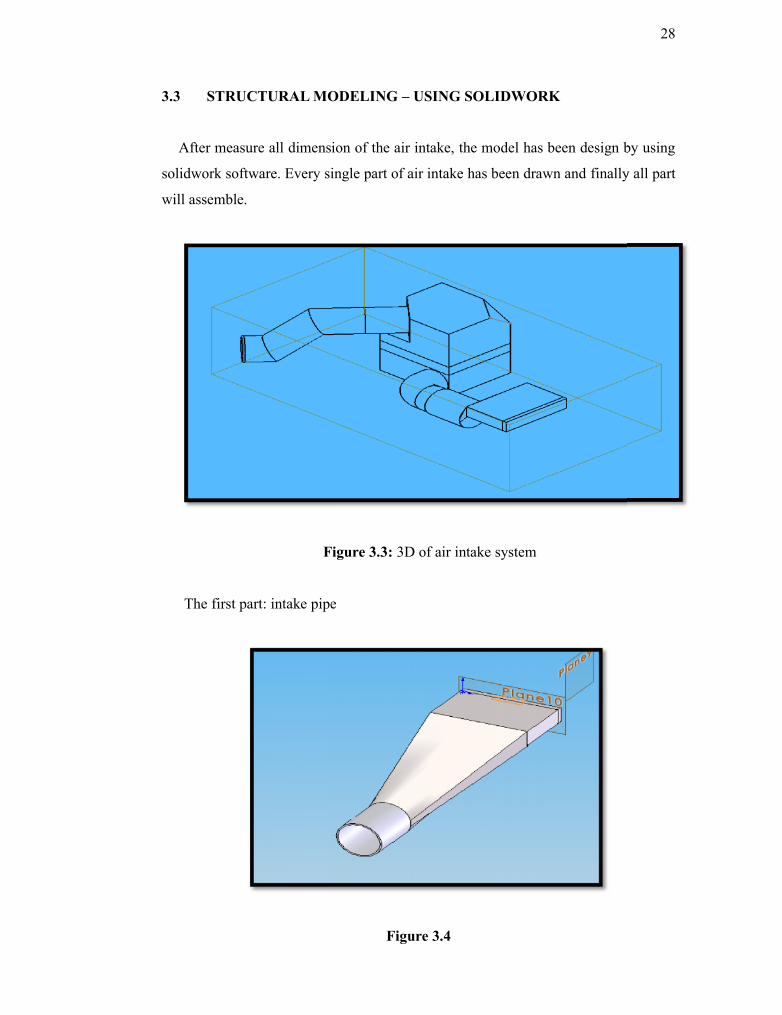
3.3 STRUCTURAL MODELING – USING SOLIDWORK
After measure all dimension of the air intake, the model has been design by using
solidwork software. Every single part of air intake has been drawn and finally all part
will assemble.
Figure 3.3: 3D of air intake system
The first part: intake pipe
Figure 3.4
28
3.3 STRUCTURAL MODELING – USING SOLIDWORK
After measure all dimension of the air intake, the model has been design by using
solidwork software. Every single part of air intake has been drawn and finally all part
will assemble.
Figure 3.3: 3D of air intake system
The first part: intake pipe
Figure 3.4

29
Air Pipe
Figure 3.5
Upper box
Figure 3.6