1 pis: sonia fahmy ness b. shroff phd student: roman chertov center for education and research in...
Post on 19-Dec-2015
218 views
TRANSCRIPT

1
PIs: Sonia Fahmy Ness B. ShroffPIs: Sonia Fahmy Ness B. Shroff
PhD StudentPhD Student: Roman Chertov: Roman ChertovCenter for Education and Research in Information Center for Education and Research in Information
Assurance and Security (CERIAS)Assurance and Security (CERIAS)Purdue UniversityPurdue University
http://www.cs.purdue.edu/~fahmy/software/emist/
September 28September 28thth, 2005, 2005
Emulation versus Simulation: A Emulation versus Simulation: A Case Study with DoS AttacksCase Study with DoS Attacks

2
Why? Simulators cannot execute real applications, and only
approximate various appliances. Testbeds and especially emulation provides a convenient
way to use real appliances and applications, but is constrained by the number of nodes, types of appliances, and difficulty in configuration/management/reproducibility.
When to use each? How to compare and interpret results? The goal of EMIST is to develop rigorous testing
methodologies, tools, and benchmarks for important classes of Internet attacks and defenses. It is crucial to understand the effectiveness of defense
mechanisms on real networks. Results obtained on testbeds can be used to develop more
accurate models. Refs: Kohler and Floyd, … others.

3
An Emulation Experiment• Create a topology via a topology generator
or based on available data (e.g., RocketFuel). If applicable, create BGP/OSPF router configurations
• Create disk images on DETER with the desired tools
• Trigger actions at experimental nodes• Repeat experiments with different
parameters• Collect data and analyze it by scripts, or
interactively, e.g., in ESVT

4
Tools
• A key goal of the EMIST project is to conduct realistic experiments with Internet attacks and defenses.
• Large scale experiments on an emulation testbed require topology generation, extensive router configuration, and automated node control.
• Hence, it is important to create an infrastructure for fast experiment creation and automation, including complex BGP/OSPF scenarios.

5
Topology/Routing Tools• Many sources for AS-level topologies, e.g., RouteViews• RocketFuel provides router-level topologies. For intra-
domain links, it provides inferred OSPF weights• However, no BGP policies; we infer/assign some of them
by L. Gao’s inference algorithms
OR:OR:• Create a topology with a topology generator, e.g., GT-
ITM• Assign ASes to router nodes• Configure all border and non-border routers
Students: David Bettis, Abdallah Kreishah, Pankaj Kumar

6
Available Tools• Can be found at
http://www.cs.purdue.edu/~fahmy/software/emist/• Scriptable Event System (SES):
• Allows using a script to repeat experiments while changing parameters
• As tasks can take arbitrary time to complete, an event completion callback is required
• Software link monitor• Ref: EMIST/ISI technical notes
• Measurement and data integration tools, and other useful scripts

7
Scriptable Event System
• A master server runs either on the main users account or on one of the test nodes.
• The communication between the master and the zombies is done via the control network which is free of experimental traffic.
• The server runs a script that determines the experiment.
1. Start measurements and configure software
2. Launch attack/benchmark
3. Once the benchmark is complete, stop the attack
4. Copy local measurement logs to a central location

8
Sample Event Script0 node0 node2 node3 r1 r2 "./tmeas -f /usr/local/tmeas.out"
1 "pause"
0 node2 "/usr/bin/ttcp -r > /dev/null"
1 "pause"
0 node0 node2 "rm /usr/local/dump.dmp"
1 "pause"
0 node0 node2 r1 r2 "sh /proj/DDoSImpact/exp/bell/scripts/dump.sh"
1 "pause"
5 node3 "./flood node1 -U -s10 -W160-1000 -D80000"
9 node0 "/usr/bin/ttcp -v -t node2 < /usr/local/f30m >/usr/local/ttcp.out!"
1 "pause"
0 node0 node1 node2 node3 r1 r2 "stop"
1 "pause"
0 node0 node2 r1 r2 "killall tcpdump"
1 "pause"
0 node0 "cp /usr/local/dump.dmp /proj/DDoSImpact/exp/bell/data/dump.node0"
0 node2 "cp /usr/local/dump.dmp /proj/DDoSImpact/exp/bell/data/dump.node2"
1 "pause"
0 node0 "cp /usr/local/ttcp.out /proj/DDoSImpact/exp/bell/data"
1 "pause"
0 node0 "cp /usr/local/tmeas.out /proj/DDoSImpact/exp/bell/data/tmeas.out.node0"
0 node3 "cp /usr/local/tmeas.out /proj/DDoSImpact/exp/bell/data/tmeas.out.node3"
0 node1 "cp /usr/local/tmeas.out /proj/DDoSImpact/exp/bell/data/tmeas.out.node1"
9
Measurement and Integration
Measurement of systems statistics at different points in the network can yield an understanding of what events are occurring in the entire network
A tool based on a 1 sec timer records CPU, PPSin, PPSout, BPSin, BPSout, RTO, Memory. The collected logs (plus routing logs) are aggregated and used to plot graphs via a collection of scripts
Congestion Window is recorded on per connection basis by reading the system files. Alternatively, it can be estimated from tcpdump files using tcptrace
The data can also be displayed by ESVT upon experiment completion, allowing easy graphical examination

10
Link Monitor• An easy way to monitor links is to run
tcpdump and drop counters on individual PCs
• Tcpdump requires additional CPU processing
• Drop counters are not always accurate as they depend on the driver accuracy
• A software solution similar to a delay node can be placed on a link between two nodes
• Two monitors can be used to find out what was dropped by comparing traffic in and traffic out
• High traffic volumes require the logger to be much faster than the test nodes
• Extensive tests have shown that the logger can keep up with 148 Kpps, but tcpdump cannot
11
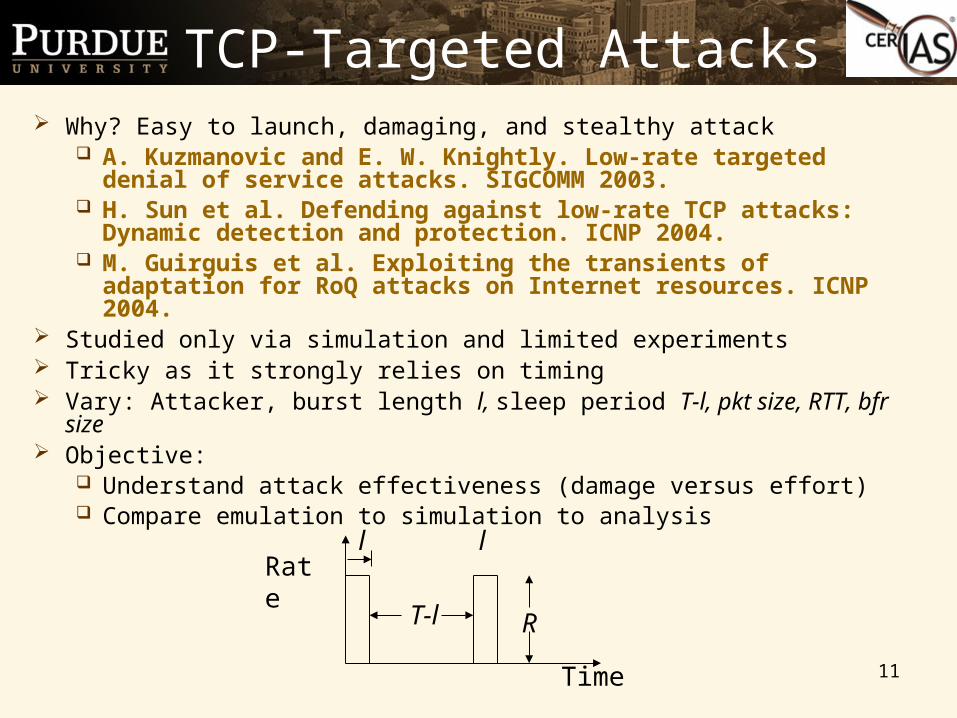
TCP-Targeted Attacks Why? Easy to launch, damaging, and stealthy attack
A. Kuzmanovic and E. W. Knightly. Low-rate targeted denial of service attacks. SIGCOMM 2003.
H. Sun et al. Defending against low-rate TCP attacks: Dynamic detection and protection. ICNP 2004.
M. Guirguis et al. Exploiting the transients of adaptation for RoQ attacks on Internet resources. ICNP 2004.
Studied only via simulation and limited experiments Tricky as it strongly relies on timing Vary: Attacker, burst length l, sleep period T-l, pkt size, RTT, bfr size Objective:
Understand attack effectiveness (damage versus effort) Compare emulation to simulation to analysis
T-l
ll
Time
Rate
R
12
Experimental Scenario
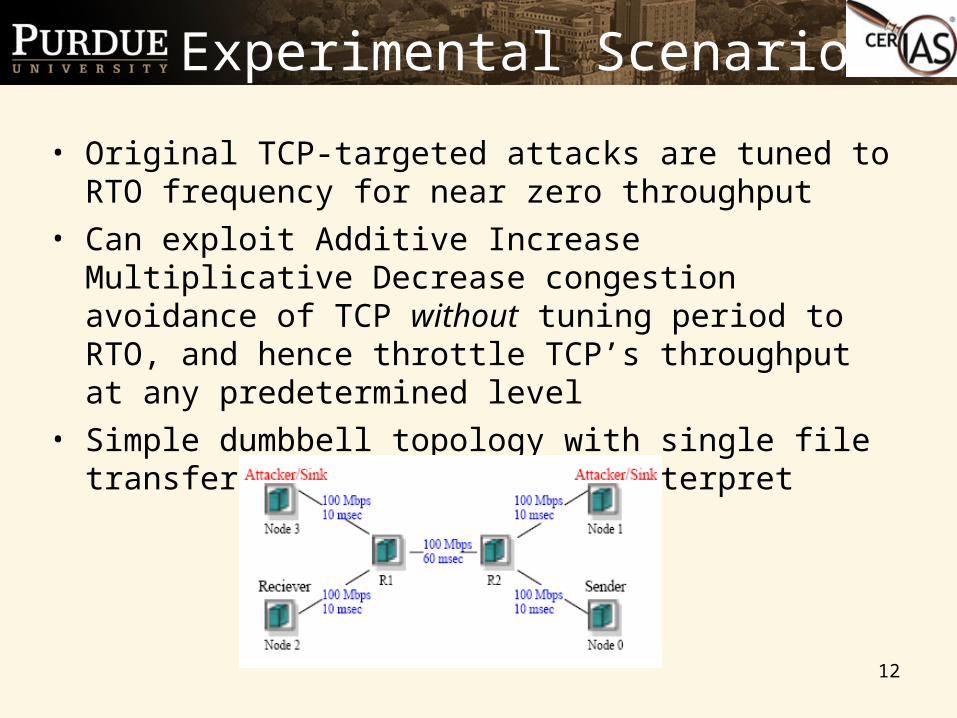
• Original TCP-targeted attacks are tuned to RTO frequency for near zero throughput
• Can exploit Additive Increase Multiplicative Decrease congestion avoidance of TCP without tuning period to RTO, and hence throttle TCP’s throughput at any predetermined level
• Simple dumbbell topology with single file transfer flow is easiest to interpret
13
Experimental Setup• All nodes run a zombie process that connects to the
master, thus forming our Scriptable Event System• SES script informs the nodes to start measurements • A file transfer and TCP-targeted attack are initiated• When the file transfer is complete, the SES is informed and
it stops the attack and instructs the nodes to copy the logs to a central location
• The same topology with similar events is simulated in ns-2• Besides using default OS routing, routing nodes on DETER
were configured with the Click modular software router [Kohler et al., ACM TOCS 2000]
• Data from DETER, Emulab, and ns-2 is compared to a simple throughput degradation model

14
• Loss occurs during each pulse.
• Connection does not RTO.
• There is no packet loss during attack sleep periods.
Throughput Degradation
is the Cwnd growth during a sleep period
time between two loss events

15
Analysis vs. Simulation
• Simulation results are closest to the analysis when the attack pulse length is equal to the flow RTT.

16
Congestion Window• The irregular peaks in this ns-2 Cwnd plot indicate that
not every pulse of the attack causes Cwnd to get halved• This causes ns-2’s average Cwnd to be higher than the
one predicted by the analysis when buffer sizes are large or attack pulse length is shorter than the RTT
17
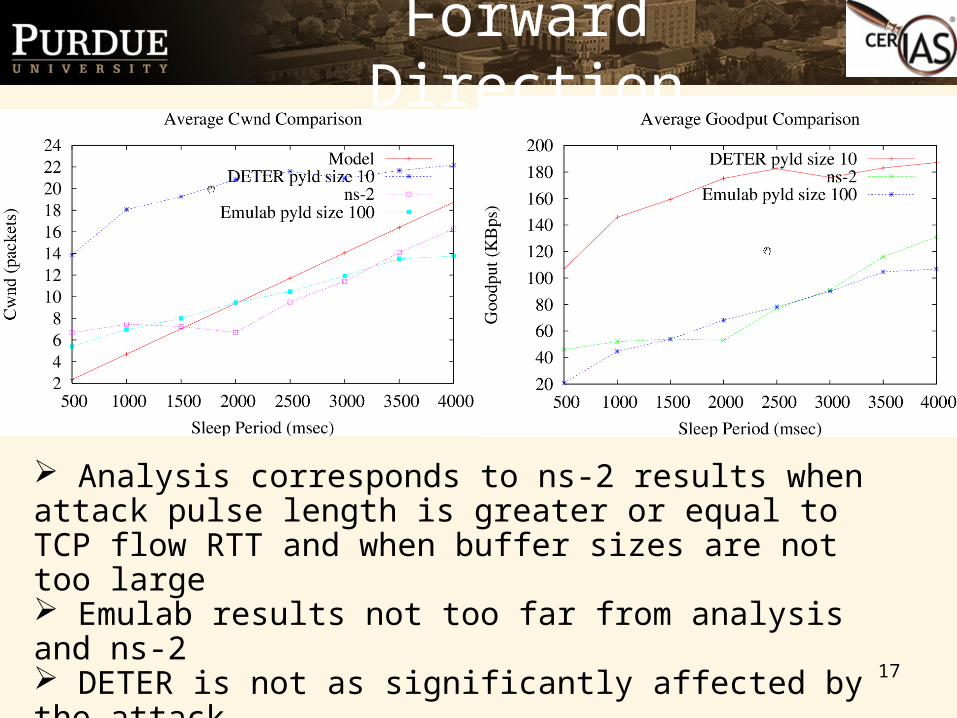
Forward Direction
Analysis corresponds to ns-2 results when attack pulse length is greater or equal to TCP flow RTT and when buffer sizes are not too large Emulab results not too far from analysis and ns-2 DETER is not as significantly affected by the attack

18
Reverse Direction
Since ns-2 does not model CPU/bus/devices, and opposing flows do not interfere at a router with output buffering, data for ns-2 is not shown for reverse direction (Cwnd has no cuts)

19
Emulation vs. Emulation
• Attack on Emulab has weaker parameters (83 byte versus 2 byte payload)
• On Emulab routers are faster than on DETER (850 MHz versus 733 MHz)
• Attacking machine on Emulab is slower (600 MHz versus 733 MHz)
• One would expect the routers on DETER to be affected more

20
Emulab vs. DETER
• Emulab router experiences a much higher load than a DETER router
• Why?

21
Router Nodes
To avoid slowdown in the Linux kernel, the machine can be configured to run SMP enabled Click modular router with polling drivers.
• Polling reduces CPU overhead by reducing interrupts.
• Bypassing the Linux protocol stack speeds up packet processing.
It is important to configure network device buffers as well, since some of them may be quite large by default.

22
Results with Click
• The results indicate that device buffer size variation has a higher impact on the final results than Click buffers.
• It is important to understand device drivers so that accurate comparisons can be made.

23
Summary of Results
• An attack pulse length of one RTT is the most effective.
• Large queue sizes can effectively dampen the attack when the TCP flow has not reached its full transfer rate.
• Discrepancies between DETER and Emulab testbed results are attributed to differences in the underlying hardware and system software, especially device drivers and buses.
• Click experiments demonstrate the importance of device driver settings.

24
More Complex Benchmark

25
Throughput

26
Web Clients/Server
Server Throughput
0
10
20
30
40
50
60
70
80
90
0 20 40 60 80
Burst Length (ms)
Mb
it/s
ec
Total Number of Pages Read
0
50000
100000
150000
200000
250000
300000
350000
0 20 40 60 80
Burst Length (ms)
Nu
mb
er
of
Pag
es
Average Client Throughput
0
0.5
1
1.5
2
2.5
0 20 40 60 80
Burst Length (ms)
Mb
it/s
ec
Average Respone Time
0
0.02
0.04
0.06
0.08
0.1
0.12
0.14
0.16
0 20 40 60 80
Burst Length (ms)
Ave
rage
Res
pons
e Ti
me
(sec
)

27
Attack Parameters vs. RTT
0.38 Mbps without an attack 0.75 Mbps without an attack
Client with 63 ms RTT to the server

28
Short RTT
1.00 Mbps without an attack 1.40 Mbps without an attack
Client with 12.6 ms RTT to the server

29
Conclusions TCP congestion control can be successfully exploited by a pulsating
attack with a fraction of needed attack traffic when compared to a flooding attack; attack frequency need not be tuned to RTO With a single flow under attack, attack pulse must be longer or
equal to RTT and buffer sizes must not exceed 100 packets; attack packet size also an important parameter
Simulation and emulation can produce very different results for very similar experiments Same experiment on different emulation testbeds (or same testbed
before and after hw/sw upgrades) can yield different results Same experiment on the same emulation testbed can yield different
results depending on driver settings Such differences are important as they allow us to identify real
vulnerabilities and fundamental limits. The Internet is an evolving, heterogeneous entity with protocol
implementation errors and resource constraints, and not a modeling approximation in a simulator
Need to study other scenarios with multiple flows and attackers, and different hw/sw routers with different buffer sizes
30
Other Work…
• What is the relationship between topology, routing, and attacks?
• Experiment scale down• RouteViews/RocketFuel/policy inferenceDETER
tools• GT-ITMDETER tools• Link virtualization• More benchmarks Slides and movies on above topics are available